
Population-adjusted national rankings in the Olympics
Abstract
Ranking countries in the Olympic Games by medal counts clearly favors large-population countries over small ones, while ranking by medals-per-capita produces national rankings with very small population countries on top. We discuss why this happens, and propose a new national ranking system for the Olympics, also based upon medals won, which is inclusive in the sense that countries of widely-varying population can achieve high rankings. This population-adjusted probability ranking ranks countries by how much evidence they show for high capability at Olympic sports. In particular, it ranks countries according to how improbable their medal counts would be in an idealized reference model of the Games which posits that all medal-winning nations have equal propensity per capita for winning medals. The ranking index U is defined using a simple binomial sum. Here we explain the method, and we present population-adjusted national rankings for the last three summer Olympics (London 2012, Rio 2016 and Tokyo 2020, held in 2021). If the advantages of this ranking method come to be understood by sports media covering the Olympics and by the interested public, it could be widely reported alongside raw medal counts, thus adding excitement and interest to the Olympics.
1The need for inclusive Olympic national rankings
Since the Olympic Games began in 1896, national rankings have been widely reported by news media covering the Olympics. Participating countries are traditionally ranked by the number of gold medals that they have won (with silver counted only for ties) or alternatively, by the total number of medals: gold + silver + bronze. With the help of modern communications (television, websites, newspapers, streaming services, etc.) such rankings are followed by sports fans around the world. The top ten or twenty countries are typically reported in daily updates during the Games. We believe that this has a positive effect on the Olympics. All sporting events depend upon the spirit of friendly competition to generate interest, so it is natural to quantify relative national achievement. This has sociological benefits since it promotes the spirit of national pride (e.g. Hoffman et al. 2002; van Hilvoorde et al. 2010; Flegl & Andrade 2018; Humphreys et al. 2018) and it certainly helps to raise public interest and excitement about the Olympics.
But there is an obvious problem with raw medal-count rankings. Because larger-population countries draw from a larger pool of athletes and tend to have greater resources, ranking by medal counts systematically favors larger-population countries over smaller ones. Indeed, in all the past four Summer Olympics, the final rankings have placed the U.S.A. and China—two of the three most populous countries in the world—in the top two spots, in both gold-only and total-medal counts.
In order to correct for this bias, sports media sometimes show national rankings by medals-per-capita, a ranking-index with no intrinsic bias. But such rankings are not often displayed or emphasized because they have an obvious disadvantage in practice, as demonstrated by the final results from the most recent Summer Olympics, shown in Table 1.
Table 1
2020 Tokyo Olympics: National ranking by medals per capita
| Rank | Country | Population (millions) | Medals Won | Medals/million |
| 1 | San Marino | 0.034 | 3 | 88.90 |
| 2 | Bermuda | 0.064 | 1 | 15.58 |
| 3 | Grenada | 0.125 | 1 | 8.03 |
| 4 | Bahamas | 0.408 | 2 | 4.90 |
| 5 | New Zealand | 5.130 | 20 | 3.90 |
| 6 | Jamaica | 2.828 | 9 | 3.18 |
| 7 | Slovenia | 2.119 | 5 | 2.36 |
| 8 | Fiji | 0.925 | 2 | 2.16 |
| 9 | Georgia | 3.758 | 8 | 2.13 |
| 10 | Hungary | 9.709 | 20 | 2.06 |
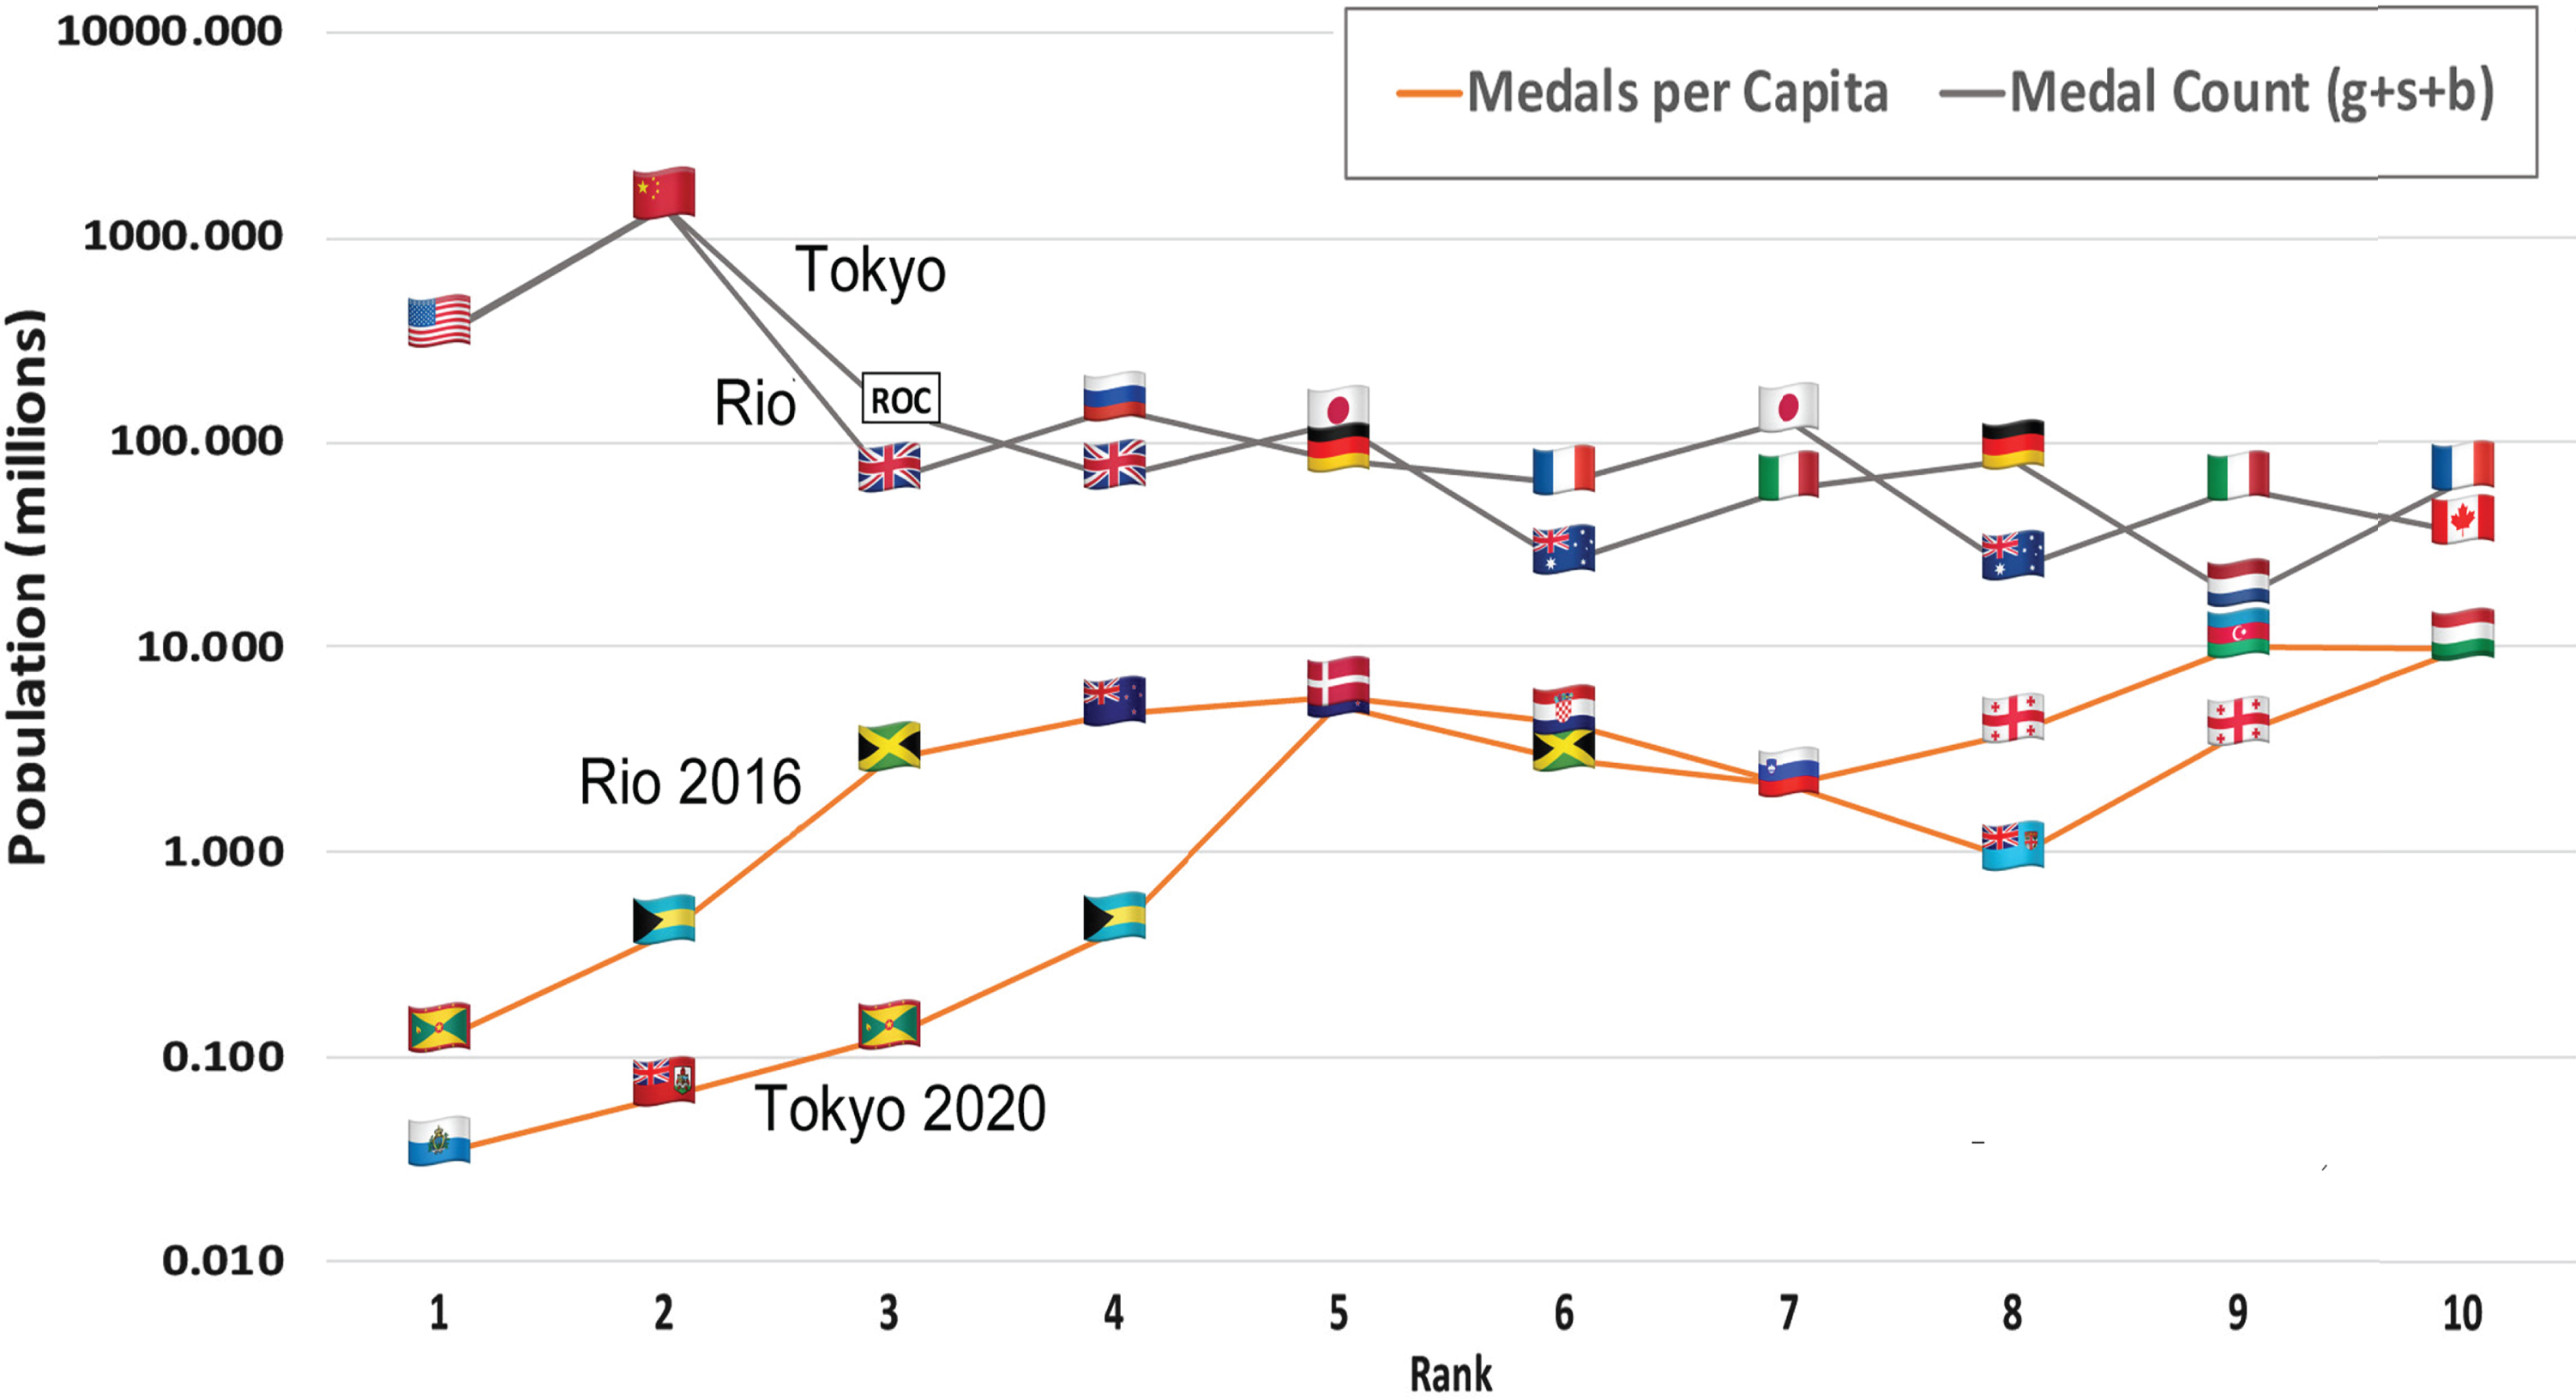
The top four spots in this list are taken by the four smallest-population countries that won medals in the Tokyo Games, ranked in order of population. Previous Summer Olympic Games have had similar results (see Fig. 1). This is an inevitable consequence of the peculiar data emerging from the Olympics, as we explain in Section 2 below. But the key point is simply that the two most widely-used methods of ranking produce lists that are, in practice, predictably topped either by the largest-population or smallest-population medal-winning countries.
Fig. 1
National population (plotted on a log scale) as a function of rank-number for the past two Summer Olympic Games, using the two accepted, popular ranking methods.
This is a significant problem in sports communications. It limits public interest in daily ranking updates during the Olympics, thus limiting the excitement and drama of the Games. It also limits public understanding and appreciation for the athletic talents emerging from many different regions worldwide, and for the hard work done by athletes in many countries to achieve sporting excellence. Thus we seek a more informative way to adjust medal counts for national populations, a method that can rank mid-range countries, with populations between 1 and 100 million, near the top along with countries with extreme (large or small) populations.
When seeking such a system, practical considerations are important. To be widely accepted and used, it is advantageous for the ranking system to satisfy—as nearly as possible—several constraints:
(1) It should have a simple motivating idea and clear meaning. Even people who may not completely understand the mathematical details of the ranking method should be able to understand why it is a logical way to rank.
(2) It must be easily implemented. For widespread use, the ranking index should be easy to calculate, preferably based on a plug-in formula—a simple function of medal counts and population—rather than a complex mathematical procedure.
(3) It produces useful, accurate results throughout the Games, even before many medals are awarded. Showing how national rankings develop and change during the Games can add excitement and interest, so this is important.
(4) The method for calculating the ranking index must involve no undetermined (and hence potentially controversial) decisions or features, and no free parameters. This is necessary because no ruling body will officially decide upon the precise method or parameters used for ranking.
You might think that the International Olympic Committee (I.O.C.) could authorize an official national ranking index. But this would be tantamount to specifying which country “won” the Olympics, which would be inconsistent with the Olympic Charter of 1908. To be specific, section 1.6 of the Charter says: The Olympic Games are competitions between athletes in individual and team events, and not between countries. (Olympics.com 2023). Thus no official ranking method can be authorized; but the I.O.C. has never discouraged the unofficial ranking of countries by the interested public. Indeed, the I.O.C.’s own online archive offers the option to rank countries in past Games by medal counts, either by gold-only or by total (g + s+b) medals (Olympics.com 2024).
The four conditions given above strongly constrain any ranking system. Nevertheless, we have found a system which satisfies these conditions, and produces interesting, population-inclusive results (as shown in Section 5 below). The key is to rank countries according to which ones show the strongest evidence for high capability at Olympic sports, per person.
Before we explain our method, we want to emphasize that there exists no perfect and absolutely ‘correct’ way to do Olympic national ranking. But the “probability ranking” that we favor has many advantages. Of course, raw medal counts are such an obvious way to measure national achievement that they will always be of interest too. Thus we propose that the probability rankings for the top ten or top twenty countries be posted during the Olympic Games alongside medal-count rankings. This would help to make the Games more exciting and interesting, while raising public understanding of athletic achievements worldwide. Medals-per-capita rankings could also be posted when time and space limitations allow, in order to highlight the achievements of the smallest-population medal-winning countries.
The plan of this paper is as follows. Section 2 discusses medals-per-capita rankings, explaining why—in real Olympic practice—this method invariably ranks the smallest-population medal-winning countries on top. Section 3 then explains probability ranking, and tells how to calculate the relevant ranking index. In Section 4 we consider the relative value of gold, silver and bronze medals, and discuss how this affects national ranking. This leads, in Section 5, to our presentation of results from the past three Summer Olympic Games. We also note some interesting trends in these national rankings. In Section 6 we discuss how economic factors and other considerations could be taken into account in Olympic national rankings. We ultimately conclude that these factors add complexities that make rankings based upon them impractical for wide use. In Section 7 we give our summary, and conclusions.
2National ranking by medals-per-capita
To understand the practical limitations of medals-per-capita ranking in the Summer Olympics, we need to consider the range of national populations involved. In the 2020 Tokyo Games, the most populous medal-winning country was China, with a summed population s = 1.444 billion, and the least populous medal-winner was San Marino with s = 34.0 thousand. Thus national populations ranged over a factor Δ s = 42,500. This means that if San Marino wins one medal, China would need 42,500 medals to surpass it, in medals-per-capita. Another key number characterizing the Games is M, the maximum number of medals that any country could possibly win. This is the number of gold, silver and bronze medals that would be won if a country had athletes (or teams) that qualified in every event up to the Olympic quota for that event, and then all of these athletes/teams won medals. For the Tokyo games M = 579, although the total number of medals awarded was T = 1080.1 Finally, we note that many small-population countries competed in the Tokyo Olympics. Indeed, 53 countries with less than 1 million people had won at least one medal in previous Summer Olympics or in Tokyo, and 23 additional sub-million-population countries had not.
Taken together, these facts explain why Olympic medals-per-capita rankings are led by the smallest medal-winning countries in the Games. This can be understood as a collective phenomenon. Since many small-population countries participate in the Olympics, the aggregate of very small nations constitutes a significant population, with 17.21 million people in medal-winning countries with s < 1 million. This sum is comparable to the population of Netherlands, and more than three times the population of New Zealand. Even if the people in these countries have only average sporting abilities—or below average abilities—within this significant aggregate population it is likely that a medal, or a few medals, will be won somewhere, and in countries where this happens, the medals per capita will be extremely high—higher than any large-population countries can possibly match because the number of medals that can be won is only M = 0.0136 Δ s.
This does not imply that there is any systematic bias favoring small countries, since the great majority of very small countries finish at the bottom of the medals-per-capita rankings, with zero medals. Nor does this imply that medals-per-capita is a useless index. It has clear meaning which can be useful for comparing the performances of countries, especially when they have mid-range populations. All that we are saying is that the medals-per-capita top ten list is predictably led by all the smallest-population medal-winners, often with just one medal each, so this list is not optimal for giving the public interesting information about relative national performance in the highest levels of the Olympic competition.
Moreover, there is a sense in which the top medals-per-capita rankings are not very reliable. Consider, for example, the case of Grenada in the 2020 Tokyo Games. This small Caribbean island, with about one-fifth the population of Staten Island, NY, is ranked third in medals-per-capita because the Granada-born Kirani James—a former track star at the University of Alabama—won a bronze medal in the 400-meter run. James is clearly a great athlete, but if he had run two one-hundredths of a second (0.02 s) slower he would have missed his medal, and Grenada’s medal count would have been zero (Fig. 2).
Fig. 2
Kirani James of Grenada (right) finishes 0.02 seconds ahead of Michael Cherry (U.S.A.) and 0.12 seconds ahead of Michael Norman (U.S.A.) to win bronze in the men’s 400 meter run. Meanwhile, Anthony Zambrano (Columbia) wins silver, and Steven Gardiner (Bahamas) wins gold—thus elevating the Bahamas to 4th place in medals-per-capita, although if Gardiner had run 0.36 seconds slower he would not have won a medal. (Photo by Bob Strong, UPI.)
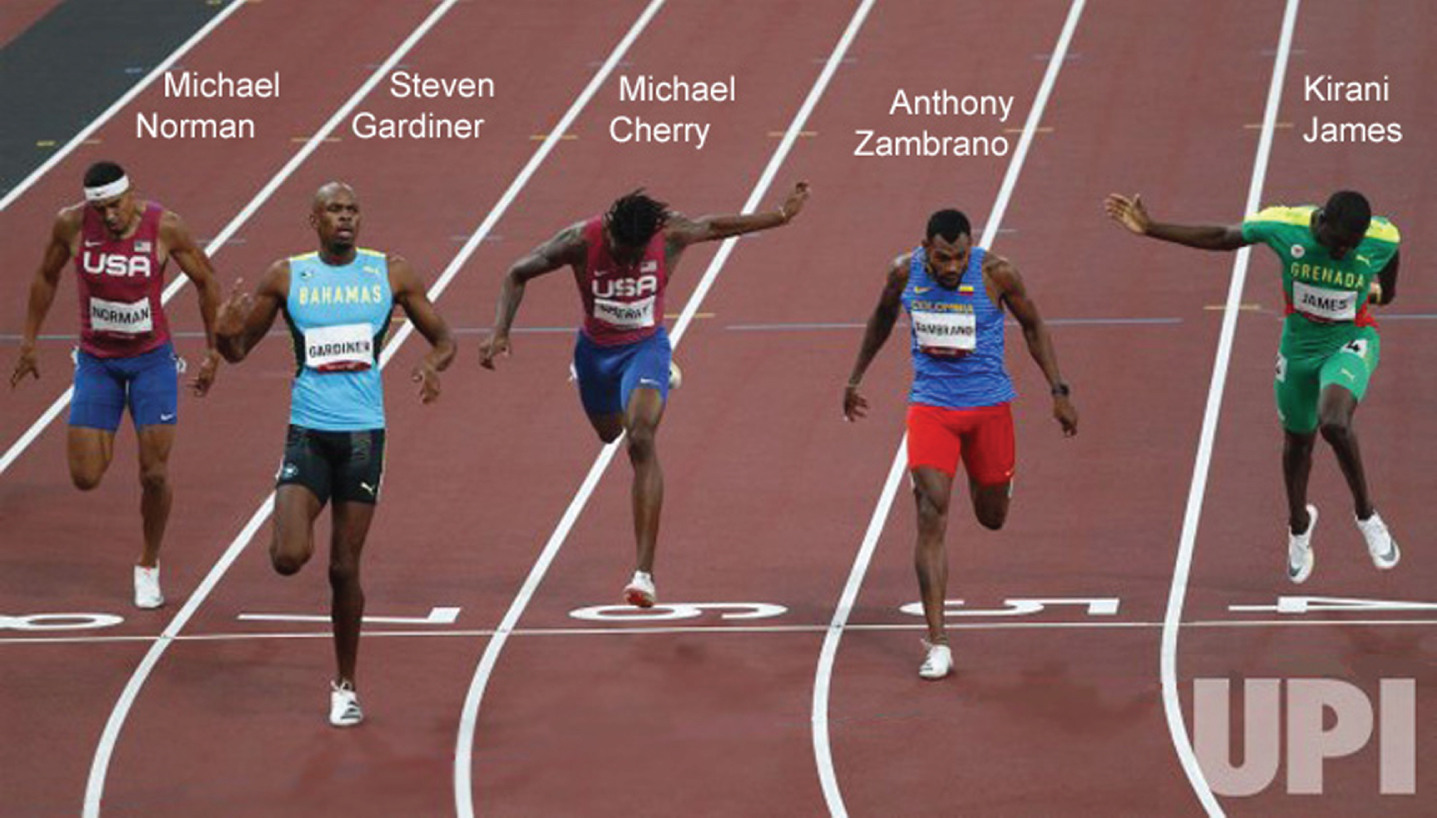
Given the razor-thin margins between finishers (0.02, 0.12, 0.36 s), if you ran the 2020 Tokyo Olympics men’s 400 meter final race multiple times, leaving plenty of time for the runners to recover between races, the order of finishing would not uniformly hold true, as any 400 meter runner can attest. So in some “runnings of the Olympics,” the rankings of Grenada and the Bahamas would drop dramatically, with Granada falling from third to last place, with zero medals-per-capita. Any ranking system subject to such profound variability is not highly reliable, which is another reason for seeking a more informative ranking system for public communications.
3Probability ranking
3.1Background discussion and motivation
To rank data with one independent variable according to the disparity of the dependent variable, a common approach is based upon regression analysis. This involves finding patterns in the data and then identifying the most extreme outliers. In the case of Olympic national medal-wins N as a function of population s, this would involve fitting the data to the line
Thus we must use a different approach. Instead of using patterns in the data, we propose to rank based upon an idea: an obvious idealization that everyone can understand. To be specific, we propose to rank by comparing real Olympic results to an idealized reference model in which the populations within all medal-winning countries worldwide have equal capacity and motivation, per person, for winning medals.
Note that the reference model does not idealize that all people have equal propensity for winning medals. In any country, only a tiny fraction ε of people have both the ability and motivation to become top Olympic athletes. We simply idealize that this fraction ε is constant throughout medal-winning countries worldwide, so that medal-winning achievement scales in proportion to national population.
To do the ranking, we compare the real medal-winnings of participant countries to this idealized model, with medal-winning idealized as a stochastic process. The way to do this is simple and uncontroversial, so it needs no official authorization. We simply ask: how probable is it, in this idealization, for a given high-performing country (with a given population) to have won as many medals as it actually did, or more medals? The lower this probability, i.e. the more improbable the number of medals won, the more the revealed evidence for higher-than-average capability. This improbability can thus be used as the national ranking index, with smaller probabilities ranked higher.
Note that our reference model is highly idealized, in the sense that the real Olympic results do not conform to this model very well. But our ranking method does not depend upon accurately fitting the data; instead it is a based upon a conceptually-obvious idealization. As long as we compare national medal-wins to this idealization uniformly when calculating the ranking index for all participating countries, the ranking procedure is mathematically valid, and its fairness is shown in Section 3.4. We shall also see that probability ranking yields plausible, interesting, population-inclusive results.
3.2The equal-capability reference model
We now make these ideas mathematically precise. In our idealized reference model, we will treat Olympic medal-winning as a stochastic process, with each country having a probability p i of winning each medal (with the subscript i identifying the country), as it competes for every medal in the Games, limited only by entry quotas.
Of course, in the real Olympics, only top athletes from a subset of countries actually compete in each event, because quotas are not the main restriction on entry. Only a limited group of athletes meet Olympic qualifying standards, and even fewer are granted wild-card entry, although many more athletes try to qualify worldwide. This is consistent with our idealized reference model if the lead-up to the Games, including all national Olympic Trials, are considered as part of the competition. Thus every country is assumed to initially have a chance at every medal that it is possible for it to win (given entry quotas), so the baseline probability p i is nonzero for every medal; but as the Games come together, even before the first Olympic event begins, some countries fail to find and develop qualified entrants in some sports, effectively losing their chance to win some medals.
Thus, since each country gets M chances to win an Olympic medal (taking into account Olympic quotas; see footnote 1), and since each chance has probability p i for success, the probability that a country i will win exactly N medals is given by the binomial formula (see Appendix A for a review):
(1)
We emphasize that this model probability is an idealization used as a theoretical tool for ranking only. We never use it to predict medal-winning results; we only use it to find national ranking indices.
Now, if all people in medal-winning countries worldwide have equal medal-winning capacity in all events, then the number of medals that each country is expected to win, 〈N〉 i is simply equal to the fraction of the whole international population that resides within that country, times the total number of medals awarded in the Games:
(2)
(3)
Thus from Equations (2) and (3),
(4)
To make these ideas clear, let’s apply them to the 2020 Tokyo Olympics, in which T = 1080 medals were awarded, but only M = 579 medals could be won by any single country due to quotas. The total population of all countries that had won medals in a summer Olympics (current or previous) was, at that time, S = 7.229 billion. Thus the U.S.A., with a population of s = 337.0 million, was expected to win 〈N〉=50.35 medals, assuming equal medal-winning capability worldwide. Instead it won 113, more than twice the expected value—a highly improbable result by chance: P = 3.0 × 10⁻¹⁶ according to Equations (1) and (4). This means that the U.S.A. should place high in probability rankings for the Tokyo Olympics.
3.3The probability ranking index U
So how, exactly, do we do the ranking? Among high-performing countries, all with medal-tallies satisfying N i > 〈N〉 i = (s i /S) T (i.e., the number of medals won exceeds the number expected for uniform worldwide capability per person) smaller values of P i (N i , p i ), as calculated from Equation (1), mean that the national medal-count is more improbably high, indicating superior performance. However, among countries which have N i < 〈N〉 i , a smaller P i implies that the medal-count is more improbably low. Hence, for consistent ranking, it is useful to define a cumulative “ranking probability,” P r which is the probability for a country to win as many medals as it actually did, or more medals:
(5)
(6)
For very highly-performing countries, the ranking probabilities P r can be extremely small numbers. For example, the U.S.A. with N = 113 has P r = 4.89 × 10⁻¹⁶. Such tiny numbers are inconvenient to work with, so it is useful to define the “Probability Ranking Index” U as the minus logarithm (base 10) of the ranking probability:
(7)
This means that as P r gets smaller, U gets larger, i.e., if P r = 0.1, 0.01 or 0.001, then U = - log P r = 1, 2 or 3. Thus we rank countries by the value of U, with larger positive values ranked higher on the national list (i.e., at lower rank-numbers). This preserves the rank-order of countries found from directly ranking by P r (with smaller- P r ranked higher), but using a more intuitive, positive ranking index.
We can express our proposed ranking index concisely in the formula:
(8)
Note that Olympic entry quotas do not significantly affect the rank-ordering of countries in practice. This makes sense, because no countries actually come close to winning either M or T medals. Thus a simpler, approximate version of probability ranking, which works very well, adopts the idealization that every country has a chance to win every medal in the Games (i.e., the number of binomial trials is T), with probability for winning p i = (s i /S), which makes intuitive sense. The resulting ranking index is
(9)
This can be used instead of Equation (8) when calculational simplicity is needed. The binomial distributions in the two ranking methods have exactly the same 〈N〉, and nearly the same variance
The formulas of Equations (8) and (9) may look daunting, but binomial sums are easily done by computer. Online high-precision calculators can do the sum reliably for any given values of M, T, N, and p (Burton 2022). In Microsoft Excel, the popular spreadsheet calculator, such sums can be done with the BINOM.DIST.RANGE function. Since the number of binomial trials is large (M⪢1 and T⪢1), for all but the smallest-population countries, the ranking probability Pr can also be well-approximated by an integral over a Gaussian (normal) distribution.
Probability ranking could have other applications. To use it for the Winter Olympics requires just one simple update: the summed population S of all medal-winning countries is much smaller in Winter than in Summer Games. Probability ranking is only reliable if S is accurate, and because countries from tropical zones usually do not compete in sports like skiing and ice skating, their populations should not be included. The natural criterion for inclusion in S is that a country has won at least one medal in the Winter Games, either in previous years or in the present Olympics—the same criterion which is used, independently, for the Summer Games. Probability ranking could also add interest and excitement to many other international competitions with multiple events, such as the Paralympic Games, the World Athletics Championships, and the World Aquatics Championships.
3.4A test for statistical fairness
To verify that U-ranking is fair, we need to make sure that when countries win their expected number of medals N = 〈N〉 they will all be ranked essentially the same, regardless of population. So consider a set of imaginary countries with populations that are integral multiples of (S/T), so that their expected numbers of medals 〈N〉, in the idealization of uniform capacity per person worldwide, are integers. Now imagine entering these countries in the 2020 Tokyo Olympics, for which (S / T)= 6.69 million. Then as 〈N〉 goes from 1 to 210, s goes from 6.69 million to 1,405 million, from a little more populous than Denmark to a little less than India or China. Now we ask, if each of these countries wins precisely N = 〈N〉 medals, what will be their ranking index U? The answer is that it is remarkably uniform, varying only from 0.20 to 0.29 over the whole population range. This difference is tiny compared to the range of values of U in the real Olympics (33.0 to 0), giving evidence that probability ranking is not significantly biased toward either large or small-population countries.
4The relative value of gold, silver, and bronze
The probability ranking method described above is based upon total medal counts (gold + silver + bronze), so it does not take into account the higher value of gold medals relative to silver, or silver relative to bronze. However, if the relative weighting-factors for different medal-colors (or medal-metals) can be agreed upon, the probability ranking index U can be updated to take these weights into account. In this section, we will show that as long as medal-color weighting factors are neither generally agreed upon, nor officially set by the I.O.C., the most reasonable and accurate way to do probability ranking is to base the U-index calculations upon total medal counts.
We begin by summarizing how medal-color weighting has traditionally been done in the Olympics. For more than a century, news and sports information sources worldwide have ranked countries by raw medal counts. Some do the ranking by the number of gold medals alone, counting silver only when there are gold ties, and bronze only for gold-and-silver ties, a procedure known as lexicographic ranking. Others rank by the total medal count, adding the numbers of gold, silver and bronze medals to find the ranking index.
Alternatively, some information sources assign specific color weight-factors. This is equivalent to assigning differing numbers of ‘points’ to gold, silver, and bronze wins, and ranking by point totals. For example, the official report of the 1908 London Games used (gold, silver, bronze) weights of (5, 3, 1) (Cook 1908). Other commonly-used schemes include (3, 2, 1) and (4, 2, 1) (Wood 2010).
Sitarz (2013) argues for weight factors (6.3, 2.4, 1) based upon the “incenter” criterion: the condition that the medal-weight factors lie in the geometric center of the space of all mathematical possibilities (with weight-factor triads treated as Cartesian coordinates), subject to the constraints that gold medals must be weighed greater than silver by a factor exceeding the factor by which silver is weighed above bronze. Why this incenter criterion is the best choice for medal-weights is not clear to us, but it is a plausible choice.
Lexicographic ranking has been used in much of Europe and Asia during recent Olympics. Could lexicographic weights also be used in probability ranking? Since the formula for U (Equation 5) never produces rank-index ties, this would simply be using probability ranking based on gold medals alone, rather than total medals. The gold-only probability index U G can be found from Equations (8) or (9) by using each country’s gold medal count N G as the lower-limit of the binomial sum, plus appropriate numbers of gold medals (e.g., M G = T G = 340 for Tokyo 2020). However, we do not favor doing this, because it gives zero weight to both silver and bronze medals, so it fails to use a lot of information relevant to national sporting achievement, thus significantly reducing the accuracy and inclusiveness of the ranking.
This information-based argument was quantified by Ogwang & Cho (2021), who found an “objective weighting scheme” for the Olympics. They began by calculating the correlation matrix for gold, silver and bronze national winnings for all countries in all Winter Olympics throughout history, finding (G-S, G-B, S-B) correlations of (0.931, 0.859, 0.948). This shows that different-color winnings are highly correlated, so different-color medal counts seem to be measuring the same property of countries (i.e. intrinsic sporting capability). For the last three summer Olympic Games we found (G-S, G-B, S-B) correlations of (0.9100, 0.8713, 0.8823), corroborating this result.
To find optimal, objective weighting factors, Ogwang & Cho used a well-known tool from multivariate statistics known as Principal Component Analysis (Dunteman 1989), which can reduce a set of correlated variables to a reduced number of principal components (PCs) — linear combinations accounting for much of the variation in the original variables. In this case, the color-color correlations were so strong that a single PC accounted for 94% of the variations in the historical Winter Olympics data and has nearly equal weights for G/S/B:
(10)
Since all the coefficients here are very close to 1/3, Ogwang & Cho concluded that equal weights should be assigned to all three medal colors, in order to reflect optimal ranking by the revealed information from medal-winning. We corroborated this with a PCA analysis of the London, Rio and Tokyo Games taken together, finding that the first principal component accounts for 92.5% of the variation:
(11)
This conclusion is consistent with the fact that the average performance variations between first, second, and third position in elite Olympic competitions are fractionally very small, suggesting that highly discrepant color-weightings are not justified as measures of capability (Bian 2005).
Table 2
2020 Tokyo Olympics: National ranking by probability index
| Rank | Country | Population (millions) | Expected Medals | Medals Won | U Index |
| 1 | Australia | 25.92 | 3.87 | 46 | 33.008 |
| 2 | Great Britain | 67.28 | 10.05 | 64 | 30.381 |
| 3 | Netherlands | 17.50 | 2.61 | 36 | 28.063 |
| 4 | New Zealand | 5.13 | 0.77 | 20 | 21.147 |
| 5 | Hungary | 9.71 | 1.45 | 20 | 15.878 |
| 6 | USA | 337.00 | 50.35 | 113 | 15.310 |
| 7 | Italy | 59.24 | 8.85 | 40 | 14.139 |
| 8 | Japan | 124.61 | 18.62 | 58 | 13.244 |
| 9 | Cuba | 11.26 | 1.68 | 15 | 9.475 |
| 10 | Jamaica | 2.83 | 0.42 | 9 | 9.117 |
| 11 | Switzerland | 8.69 | 1.30 | 13 | 8.889 |
| 12 | France | 64.53 | 9.64 | 33 | 8.712 |
| 13 | Denmark | 5.85 | 0.87 | 11 | 8.623 |
| 14 | Canada | 38.16 | 5.70 | 24 | 8.138 |
| 15 | Germany | 83.41 | 12.46 | 37 | 8.073 |
| 16 | San Marino | 0.03 | 0.01 | 3 | 7.674 |
| 17 | Georgia | 3.76 | 0.56 | 8 | 6.845 |
| 18 | Croatia | 4.06 | 0.61 | 8 | 6.594 |
| 19 | Czechia | 10.51 | 1.57 | 11 | 6.098 |
| 20 | Norway | 5.40 | 0.81 | 8 | 5.677 |
| 21 | Serbia | 7.30 | 1.09 | 9 | 5.667 |
| 22 | Slovenia | 2.12 | 0.32 | 5 | 4.697 |
| 23 | Sweden | 10.47 | 1.56 | 9 | 4.437 |
| 24 | Ukraine | 43.53 | 6.50 | 19 | 4.350 |
| 25 | Republic of Korea | 51.83 | 7.74 | 20 | 3.832 |
However it is important to note that different national ranking methods may be needed to realize different objectives. Ranking countries by the status or prestige gained from Olympic wins (however that quantity may be defined) would depend highly upon the relative prestige of gold, silver and bronze medals—which are socially-determined quantities (or, in the present-day situation, socially undetermined). If, on the other hand, you seek to rank countries by the degree of sporting capability that is revealed by their medal-winning, adjusted for population, then it is important to use the information from the different medal colors optimally in order to produce the most accurate ranking.
5Olympic ranking results
To show the utility of probability ranking, we now give population-adjusted national rankings for the three most recent summer Olympic Games. All the data used for these rankings can be found in online archives of national medal counts (Olympics.com 2024) and of national populations (United Nations 2022).
5.1The 2020 Tokyo Olympics
The 2020 Tokyo Games were held in the summer of 2021 because of the COVID-19 pandemic. During 16 days of competition, 92 different countries won medals. The total population of all medal-winning countries (i.e. all countries that won medals in Tokyo or in any previous summer Olympics) was S = 7.229 billion, and the maximum number of medals that any country could have won was M = 579 out of the total T = 1080 that were awarded. (Here team-sports wins are counted as single medals, even though all team members were honored.) Table 2 lists the top 25 countries as ranked by the index U, where the ranking probability is P r (N) =10-U .
Note that within the top ten, national populations ranged over a factor of 119, from 337 million to 2.83 million, USA to Jamaica. Moreover, within the top 20, the populations ranged over a factor of ten-thousand (USA to San Marino, which was ranked 16th) so this ranking is verified as population-inclusive. The top twenty also spanned a large geographical range, with Europe (Great Britain, Netherlands, Italy, Hungary, France, etc.), the ‘down-under’ Pacific (Australia, New Zealand), the Caribbean (Jamaica, Cuba), East Asia (Japan) and North America (USA, Canada) all represented.
Where is Russia in the list? Numerous athletes of the Russian Olympic Committee (ROC) were allowed to compete in Tokyo, but the International Olympic Committee made it clear that, due to Russia’s recent history of state-sponsored doping, the ROC athletes did not represent Russia. Thus using a national ranking statistic based upon Russia’s population s is not appropriate, and the ROC cannot be ranked. However, if the ROC could be identified with Russia’s national population, they would have done well. They won 71 medals, with an expected number of 21.68, giving U = 17.296 which would have been good for fifth place.
5.2The 2016 Rio de Janeiro Olympics
In the 2016 Rio Games, athletes from 85 countries won medals, with 2 more medals won by Independent Olympic Athletes (IOA). The summed population of all Summer Olympics medal-winning countries at the end of the Rio Games was 6.872 billion. The total number of medals (gold + silver + bronze) that any single country could possibly have won was M = 521 out of T = 972. Table 3 gives the top 25 countries in the final ranking. Note that national populations within the top three ranged over a factor of 70 (USA to New Zealand).
Table 3
2016 Rio de Janeiro Olympics: National ranking by probability index
| Rank | Country | Population (millions) | Expected Medals | Medals Won | U Index |
| 1 | Great Britain | 65.66 | 9.29 | 67 | 35.135 |
| 2 | USA | 327.21 | 46.28 | 121 | 21.972 |
| 3 | New Zealand | 4.67 | 0.66 | 18 | 19.443 |
| 4 | Australia | 24.20 | 3.42 | 29 | 17.155 |
| 5 | France | 63.99 | 9.05 | 42 | 15.256 |
| 6 | Denmark | 5.71 | 0.81 | 15 | 13.920 |
| 7 | Azerbaijan | 9.98 | 1.41 | 18 | 13.804 |
| 8 | Jamaica | 2.80 | 0.40 | 11 | 12.222 |
| 9 | Germany | 82.33 | 11.64 | 42 | 11.684 |
| 10 | Netherlands | 17.12 | 2.42 | 19 | 10.892 |
| 11 | Russia | 145.11 | 20.52 | 56 | 10.639 |
| 12 | Hungary | 9.82 | 1.39 | 15 | 10.616 |
| 13 | Croatia | 4.22 | 0.60 | 10 | 9.066 |
| 14 | Kazakhstan | 18.08 | 2.56 | 17 | 8.747 |
| 15 | Canada | 36.11 | 5.11 | 22 | 7.696 |
| 16 | Italy | 60.12 | 8.50 | 28 | 7.159 |
| 17 | Sweden | 9.95 | 1.41 | 11 | 6.560 |
| 18 | Cuba | 11.34 | 1.60 | 11 | 6.012 |
| 19 | Japan | 126.99 | 17.96 | 41 | 5.889 |
| 20 | Georgia | 3.77 | 0.53 | 7 | 5.830 |
| 21 | Czechia | 10.53 | 1.49 | 10 | 5.443 |
| 22 | Belarus | 9.71 | 1.37 | 9 | 4.875 |
| 23 | Serbia | 7.49 | 1.06 | 8 | 4.828 |
| 24 | Republic of Korea | 51.31 | 7.26 | 21 | 4.692 |
| 25 | Switzerland | 8.37 | 1.18 | 7 | 3.647 |
5.3The 2012 London Olympics
In the 2012 London Games, 86 different countries won medals. The final summed population of all prior Summer Olympics medal-winning countries was S = 6.562 billion, with M = 513 and T = 961. Table 4 gives the final London top 25.
Table 4
2012 London Olympics: National ranking by probability index
| Rank | Country | Population (millions) | Expected Medals | Medals Won | U Index |
| 1 | Great Britain | 63.81 | 9.34 | 65 | 33.189 |
| 2 | Australia | 22.73 | 3.33 | 35 | 23.563 |
| 3 | Russia | 143.63 | 21.03 | 66 | 15.305 |
| 4 | Jamaica | 2.76 | 0.40 | 13 | 15.135 |
| 5 | USA | 316.65 | 46.37 | 104 | 14.216 |
| 6 | Hungary | 9.92 | 1.45 | 18 | 13.593 |
| 7 | New Zealand | 4.41 | 0.65 | 13 | 12.583 |
| 8 | Germany | 81.55 | 11.94 | 44 | 12.533 |
| 9 | Netherlands | 16.79 | 2.46 | 20 | 11.714 |
| 10 | France | 63.07 | 9.24 | 35 | 10.389 |
| 11 | Republic of Korea | 49.63 | 7.27 | 30 | 9.840 |
| 12 | Cuba | 11.31 | 1.66 | 15 | 9.573 |
| 13 | Italy | 60.19 | 8.81 | 28 | 6.848 |
| 14 | Denmark | 5.60 | 0.82 | 9 | 6.679 |
| 15 | Czechia | 10.51 | 1.54 | 11 | 6.185 |
| 16 | Belarus | 9.69 | 1.42 | 10 | 5.624 |
| 17 | Canada | 34.69 | 5.08 | 18 | 5.242 |
| 18 | Azerbaijan | 9.49 | 1.39 | 9 | 4.836 |
| 19 | Georgia | 3.80 | 0.56 | 6 | 4.598 |
| 20 | Spain | 46.76 | 6.85 | 20 | 4.554 |
| 21 | Japan | 127.85 | 18.72 | 38 | 4.387 |
| 22 | Croatia | 4.33 | 0.63 | 6 | 4.288 |
| 23 | Ukraine | 45.41 | 6.65 | 19 | 4.232 |
| 24 | Kazakhstan | 17.10 | 2.50 | 11 | 4.231 |
| 25 | Mongolia | 2.79 | 0.41 | 5 | 4.175 |
5.4Trends in Olympic national rankings
Table 5 compares probability rankings for the past three summer Olympic Games. It is significant that many countries achieve similar rank-numbers in the three games, often showing gradual evolution. This is evidence for the reliability of the ranking system. In particular, Great Britain was clearly an outstanding performer, ranked [1, 1, 2] in the [London, Rio, Tokyo] Olympic Games. The ‘down under’ Pacific countries also did extremely well, with Australia ranked [2, 4, 1], and New Zealand [7, 3, 4]. Other top performers in the past three Olympics were the U.S.A. [5, 2, 6], Hungary [6, 12, 5] and Jamaica, which showed a downward trend [4, 8, 10] due in part to the retirement of the 8-time gold medalist sprinter Usain Bolt. Other countries showing modest downward trends were Germany [8, 9. 15], Belarus [16, 22, 29] and the Republic of (South) Korea [11, 24, 25]. On the other hand, significant improvement over the three Games was attained by the Netherlands [9, 10, 3], Canada [17, 15, 14], Switzerland [39, 25, 11] and Japan [21, 19, 8]. Indeed, Japan may have benefited from the “home advantage” of hosting the Tokyo Games.
Table 5
National ranking by probability index for three Olympic Games
| London 2012 | Rio 2016 | Tokyo 2020 | |||
| Rank | Rank | Rank | |||
| 1 | Great Britain | 1 | Great Britain | 1 | Australia |
| 2 | Australia | 2 | USA | 2 | Great Britain |
| 3 | Russia | 3 | New Zealand | 3 | Netherlands |
| 4 | Jamaica | 4 | Australia | 4 | New Zealand |
| 5 | USA | 5 | France | 5 | Hungary |
| 6 | Hungary | 6 | Denmark | 6 | USA |
| 7 | New Zealand | 7 | Azerbaijan | 7 | Italy |
| 8 | Germany | 8 | Jamaica | 8 | Japan |
| 9 | Netherlands | 9 | Germany | 9 | Cuba |
| 10 | France | 10 | Netherlands | 10 | Jamaica |
| 11 | Republic of Korea | 11 | Russia | 11 | Switzerland |
| 12 | Cuba | 12 | Hungary | 12 | France |
| 13 | Italy | 13 | Croatia | 13 | Denmark |
| 14 | Denmark | 14 | Kazakhstan | 14 | Canada |
| 15 | Czechia | 15 | Canada | 15 | Germany |
| 16 | Belarus | 16 | Italy | 16 | San Marino |
| 17 | Canada | 17 | Sweden | 17 | Georgia |
| 18 | Azerbaijan | 18 | Cuba | 18 | Croatia |
| 19 | Georgia | 19 | Japan | 19 | Czechia |
| 20 | Spain | 20 | Georgia | 20 | Norway |
| 21 | Japan | 21 | Czechia | 21 | Serbia |
| 22 | Croatia | 22 | Belarus | 22 | Slovenia |
| 23 | Ukraine | 23 | Serbia | 23 | Sweden |
| 24 | Kazakhstan | 24 | Republic of Korea | 24 | Ukraine |
| 25 | Mongolia | 25 | Switzerland | 25 | Republic of Korea |
| 26 | Trinidad and Tobago | 26 | Slovenia | 26 | Chinese Taipei |
| 27 | Ireland | 27 | Spain | 27 | Austria |
| 28 | Sweden | 28 | Uzbekistan | 28 | Bulgaria |
| 29 | Lithuania | 29 | Armenia | 29 | Belarus |
| 30 | Slovenia | 30 | Lithuania | 30 | Armenia |
5.5The Medal-winning Population and the 2024 Paris Games
We now discuss how probability ranking is done during the Olympic Games, which may be useful for future applications. Consider the Tokyo Olympics. On July 23, 2021, the first official day of the Games, the total population of all medal-winning countries was S = 7.200 billion. This did not include 63 countries that had failed to win any medals in 31 previous summer Olympic Games. Such countries are very unlikely to win medals, thus they do not significantly affect other country’s medal-winning prospects (as measured by p i ), so their populations are not included in S. However, during the Tokyo Games, three of these countries (Burkina Faso, San Marino and Turkmenistan) won their first-ever medals, so S was immediately updated. The final value of S was thus slightly increased by 0.0285 billion (or 0.395%) to S = 7.229 billion. (See Table 6 for a full list of countries whose populations were not included in calculating S.) Note that the R.O.C. definitely reduced the medal-winning probability p i for other countries by taking 71 medals in Tokyo, so the population of Russia was included in S, even though Russia itself was not eligible for U-ranking due to its national disqualification.
Table 6
Countries that have not won any summer Olympics medals prior to 2024
| Albania | Bosnia/Herzegovina | El Salvador | Liberia | Myanmar | Sao Tome/Principe |
| Andorra | Brunei | Equatorial Guinea | Libya | Nauru | Seychelles |
| Angola | Cambodia | Micronesia | Liechtenstein | Nicaragua | Sierra Leone |
| Antigua/Barbud | Cape Verde | Gambia | Madagascar | Oman | Somalia |
| Aruba | Cent. African Rep. | Guinea | Malawi | Palau | South Sudan |
| Bangladesh | Chad | Guinea-Bissau | Maldives | Palestine | Swaziland |
| Belize | Comoros | Honduras | Mali | Papua New Guinea | Timor-Leste |
| Benin | Congo | Kiribati | Malta | Rwanda | Tuvalu |
| Bhutan | Dem. Rep. Congo | Laos | Mauritania | Saint Lucia | Vanuatu |
| Bolivia | Dominica | Lesotho | Monaco | St Vincent/Grenadines | Yemen |
There will be 329 medal events in Paris, with T = 1041 total medals awarded. (Note that two bronze medals are awarded in all wrestling, boxing, judo and taekwondo events, with 30 men’s events and 23 women’s events and one mixed event, yielding a Games total of 383 bronze medals.) The summer Olympics in Paris 2024 will be the first summer Games in which the number of events and medals awarded will decrease in comparison to previous Games. Due to Olympic entry quotas the total number of medals that any single country could win will be M = 559. (See Table 7 for the sport-by-sport breakdown.) This number is not affected by “universality” or “host country” special invitations for entry without qualifying. Note that the I.O.C. has banned Russia from the Paris Games due to the invasion of Ukraine, and the Russian Olympic Committee (R.O.C.) will not be recognized either, although some Russian athletes will be allowed to compete as Individual Neutral Athletes (AINs) (reference: International Olympic Committee 2023).
Table 7
Numbers of Medals in the Paris 2024 Olympic Games With Entry Quota Adjustments
| Sport | Events | Total Medals | Maximum Medals (per country) |
| Aquatics | 49 | 147 | 86 |
| Archery | 5 | 15 | 11 |
| Athletics | 48 | 144 | 132 |
| Badminton | 5 | 15 | 5 |
| Basketball | 4 | 12 | 4 |
| *Boxing | 13 | 52 | 13 |
| Breaking | 2 | 6 | 4 |
| Canoeing | 16 | 48 | 26 |
| Cycling | 22 | 66 | 40 |
| Equestrian | 6 | 18 | 12 |
| Fencing | 12 | 36 | 24 |
| Field hockey | 2 | 6 | 2 |
| Football | 2 | 6 | 2 |
| Golf | 2 | 6 | 4 |
| Gymnastics | 18 | 54 | 30 |
| Handball | 2 | 6 | 2 |
| *Judo | 15 | 60 | 15 |
| Modern pentathlon | 2 | 6 | 4 |
| Rowing | 14 | 42 | 14 |
| Rugby sevens | 2 | 6 | 2 |
| Sailing | 10 | 30 | 10 |
| Shooting | 15 | 45 | 27 |
| Skateboarding | 4 | 12 | 12 |
| Sport climbing | 4 | 12 | 8 |
| Surfing | 2 | 6 | 4 |
| Table tennis | 5 | 15 | 7 |
| *Taekwondo | 8 | 32 | 8 |
| Tennis | 5 | 15 | 10 |
| Triathlon | 3 | 9 | 7 |
| Volleyball | 4 | 12 | 6 |
| Weightlifting | 10 | 30 | 10 |
| *Wrestling | 18 | 72 | 18 |
| Total | 329 | T = 1041 | M = 559 |
*Combat events with 2 bronze medals.
Table 8 shows final values of S for the past three summer Olympic Games, along with the projected S for the start of the 2024 summer Olympic Games in Paris.
Table 8
Population and medal amounts in four summer Olympics
| 2012 | 2016 | 2021 | 2024 | |
| London | Rio | Tokyo | Paris | |
| Total world population (millions) | 7,162 | 7,514 | 7,909 | 8,119 |
| Number of countries with no medals in all prior summer Olympic Games | 66 | 63 | 60 | 60 (as Games begin) |
| S, Total population (millions) of Olympic medal-winning countries | 6,562 | 6,872 | 7,229 | 7,397 |
| T, Number of medals awarded in Games | 961 | 972 | 1080 | 1041 |
| M, Maximum possible medals that a country could win | 513 | 521 | 579 | 559 |
Throughout the Paris Games, and during future Olympics, probability rankings will be posted online at the following website: https://www.olympicnationalrankings.com/. These rankings will be updated daily at the end of competitions (i.e., in the evening in Paris).
5.6Age-grouped probability ranking
Finally, we mention an alternative way to do population-adjusted ranking by taking age demographics into account. As before, the probability ranking index is given by Equation (8), but now all national populations s (and the total population S) are counted only within the limited youthful age-range of highly competitive athletes. A plausible age-range is 13–39, since the great majority of Olympic medal-winners have ages within this range. (But note that the minimum age for competition exceeds 13 in some sports.) We implemented this ranking for ages 13–39 in recent Olympic Games, using the best available demographic data. We found only minor changes from the total-population U-ranking, but these changes distinctly favored wealthy countries, with high-GDP(PPP) per capita, relative to less economically-advantaged countries.
This result is easy to understand. Countries with stronger economies tend to have better and more widely-available medical care, with more of their citizens surviving to advanced age, thus the fraction of their population within the competitive, youthful age-group is smaller. This tends to lower their probabilities p and expected medals 〈N〉, driving up U, thus favoring wealthier countries in the age-grouped rankings. Indeed, age-grouped ranking effectively penalizes economically-disadvantaged countries in two ways: (1) for not having many older citizens, and—in a separate but related effect—(2) by failing to recognize the advantages gained by wealthy countries due to its older citizens (aged above 40) who contribute to Olympic efforts, through coaching, recruiting, administration, and financial support. Many older parents also support their progeny’s Olympic aspirations.
Thus adopting specific, youthful age-groups for U-ranking does not seem optimal for public communications. If wealth-dependent adjustments are to be made, it would seem more appropriate to give a compensatory boost to less wealthy countries, as discussed in the next section. There are also practical reasons to reject age-group ranking. It is more complicated to implement, and the relevant age range is somewhat subjective and controversial. Should it be 13–40, 14–30, 15–35, 16–45 etc.? Without official I.O.C. authorization, this is unclear. Moreover, age-distribution data for many parts of the world are somewhat unreliable, due to infrequent and perfunctory demographic surveys.
6Economically-adjusted probability rankings
Countries with stronger economies are at an advantage for achieving sporting success, because the people in wealthier countries, with higher average incomes, tend to have more time and resources available for the pursuit of sports. Government support of Olympic athletes also trends higher in wealthier countries. Thus it could make sense to adjust for economic prosperity as well as for population in Olympic national rankings, although this is a matter of choice, since it clearly changes the meaning of the rankings.
To adjust for national economic strength alone, probability ranking can be done with gross domestic product based on purchasing power parity, or GDP(PPP) as the basis variable, rather than population. GDP(PPP) is a well-documented measure of economic productivity, with local currency-values adjusted to quantify the local, domestic costs of goods and services (rather than being based on international exchange rates) so that the GDP(PPP) accurately reflects the summed economic means of citizens. The economically-adjusted probability ranking index is then the probability that a country with a given GDP(PPP) would win as many medals as it did, or more medals, under the idealization that all countries have equal sporting capability per dollar GDP(PPP). So if a country’s GDP(PPP) is d, and if the sum of d’s for all medal-winning countries is D (estimated to be 183.95 trillion dollars in 2024 [International Monetary Fund 2023]), the probability for a country to win any given medal is p = (T/M) · (d/D); and the GDP-adjusted probability index V is
(12)
Using this formula, GDP-adjusted national probability rankings can easily be found. But note that two countries with the same GDP(PPP) would not be expected to win the same number of medals if they had significantly different populations, so it makes little sense to adjust for GDP without also adjusting for population.
One plausible way to adjust for the size of the population and economic resources together is to use
(13)
Given this situation, unless the I.O.C. specifies official values for W S and W d (an unlikely prospect), we favor population-adjusted U-ranking without economic adjustment as used in Section 5. Population is clearly the most relevant single number measuring national differences, and the population-adjusted U-rankings have no uncertain, disputable free parameters.
Note that various cultural factors also play a significant role in determining Olympic achievement. Some countries simply have less interest in Olympic sports than do others, due to divergent cultural influences within their populations. For example, nearly half of the highly-ranked countries in recent Olympics have been European—a result that is probably no coincidence, since Europe was the birthplace of both the ancient and modern Olympics. This is a complex issue that is difficult to quantify. Trying to adjust for this would be even more controversial than adjusting for economic differences.
An alternative approach to Olympic ranking that takes economic factors into account has been developed by Operations Research experts, using computational modelling methods known as Data Envelopment Analysis (DEA). These methods were originally developed for economic planning, to optimize the production of factory goods in competitive markets. Some key papers that use DEA for Olympic ranking are: Ball 1972; Lozano et al. 2002; Lins et al. 2003; Bernard and Busse 2004; Churilov and Flitman 2006; Li et al. 2008; Saaty 2008; Wu et al. 2009; Flegl and Andrade 2016. These papers rank countries according to their “technical efficiency scores” for producing Olympic medals. They use linear programming to determine how efficiently countries achieve medal winnings, taking into account the relevant ‘inputs’ to medal production, including population, economic resources as measured by GDP (PPP), and in some cases, other factors like host country benefits, culture, politics, team size, etc. DEA rankings can provide useful insights into how countries achieve Olympic excellence, but such rankings are impractical for wide promulgation by sports media because: (1) they require complex software, (2) some inputs and features of the computational models are controversial, with no official I.O.C. authorization to decide the details; (3) the meaning of the ranking may not be obvious to the general public, and (4) the models can produce ties at the top of the ranked list, with more than one country rated at 100% efficiency. For example, in their groundbreaking DEA-based ranking of the 2000 Sydney Olympics, Lins et al. (2003), ranked nine countries together in first place, including the USA with 97 medals and Barbados with one bronze medal.
7Summary and conclusions
National rankings by medal counts, using either [gold+silver+bronze] totals or gold-alone counts, are widely reported in Olympic media coverage, influencing public perception of the Olympics Games worldwide. Unfortunately, this kind of national ranking systematically favors larger-population countries. Another commonly-used ranking index is medals-per-capita, but rankings by this index are, in practice, invariably topped by the smallest-population medal-winners. This happens because the populations of medal-winning countries vary over an enormous range—a factor of 42,500 in the 2020 Tokyo Games, which is much greater than the number of medals which any country could win, M = 579—and because many small-population countries compete, constituting a significant aggregate population within which some medals are expected (as explained in section 2).
We have proposed a new method for national ranking in the Olympics, to promote deeper public understanding and appreciation of the relative sporting capabilities of countries with varying populations. This “probability ranking” is based upon the index U as given by Equation (8) [or, in an excellent approximation, Equation (9)]. We suggest that popular media coverage of the Olympics report the top ten or top twenty probability-ranked countries in daily updates, along with medal-count rankings. The two rankings would complement each other well, generating excitement and suspense about the Games at the national level, thus enriching the Olympics. But the probability index U should never be described as a “score” determining who “won” the Olympics. It should always be described accurately as a simple, objective way to quantify the evidence for high sporting ability given by Olympic medal-wins, while adjusting for population. Specifically, it is a measure of the improbability that a country of the given population could win as many medals as it did, or more medals, if all people worldwide had equal capacity for winning medals.
In this paper, we have based Olympics rankings upon total medal counts N—the sum of a country’s gold, silver and bronze counts. In Section 4 we justified this using principal component analysis, a standard tool of multivariate statistical analysis. Our calculations showed that using total medal counts optimizes ranking accuracy, on average, when no official color weights are specified.
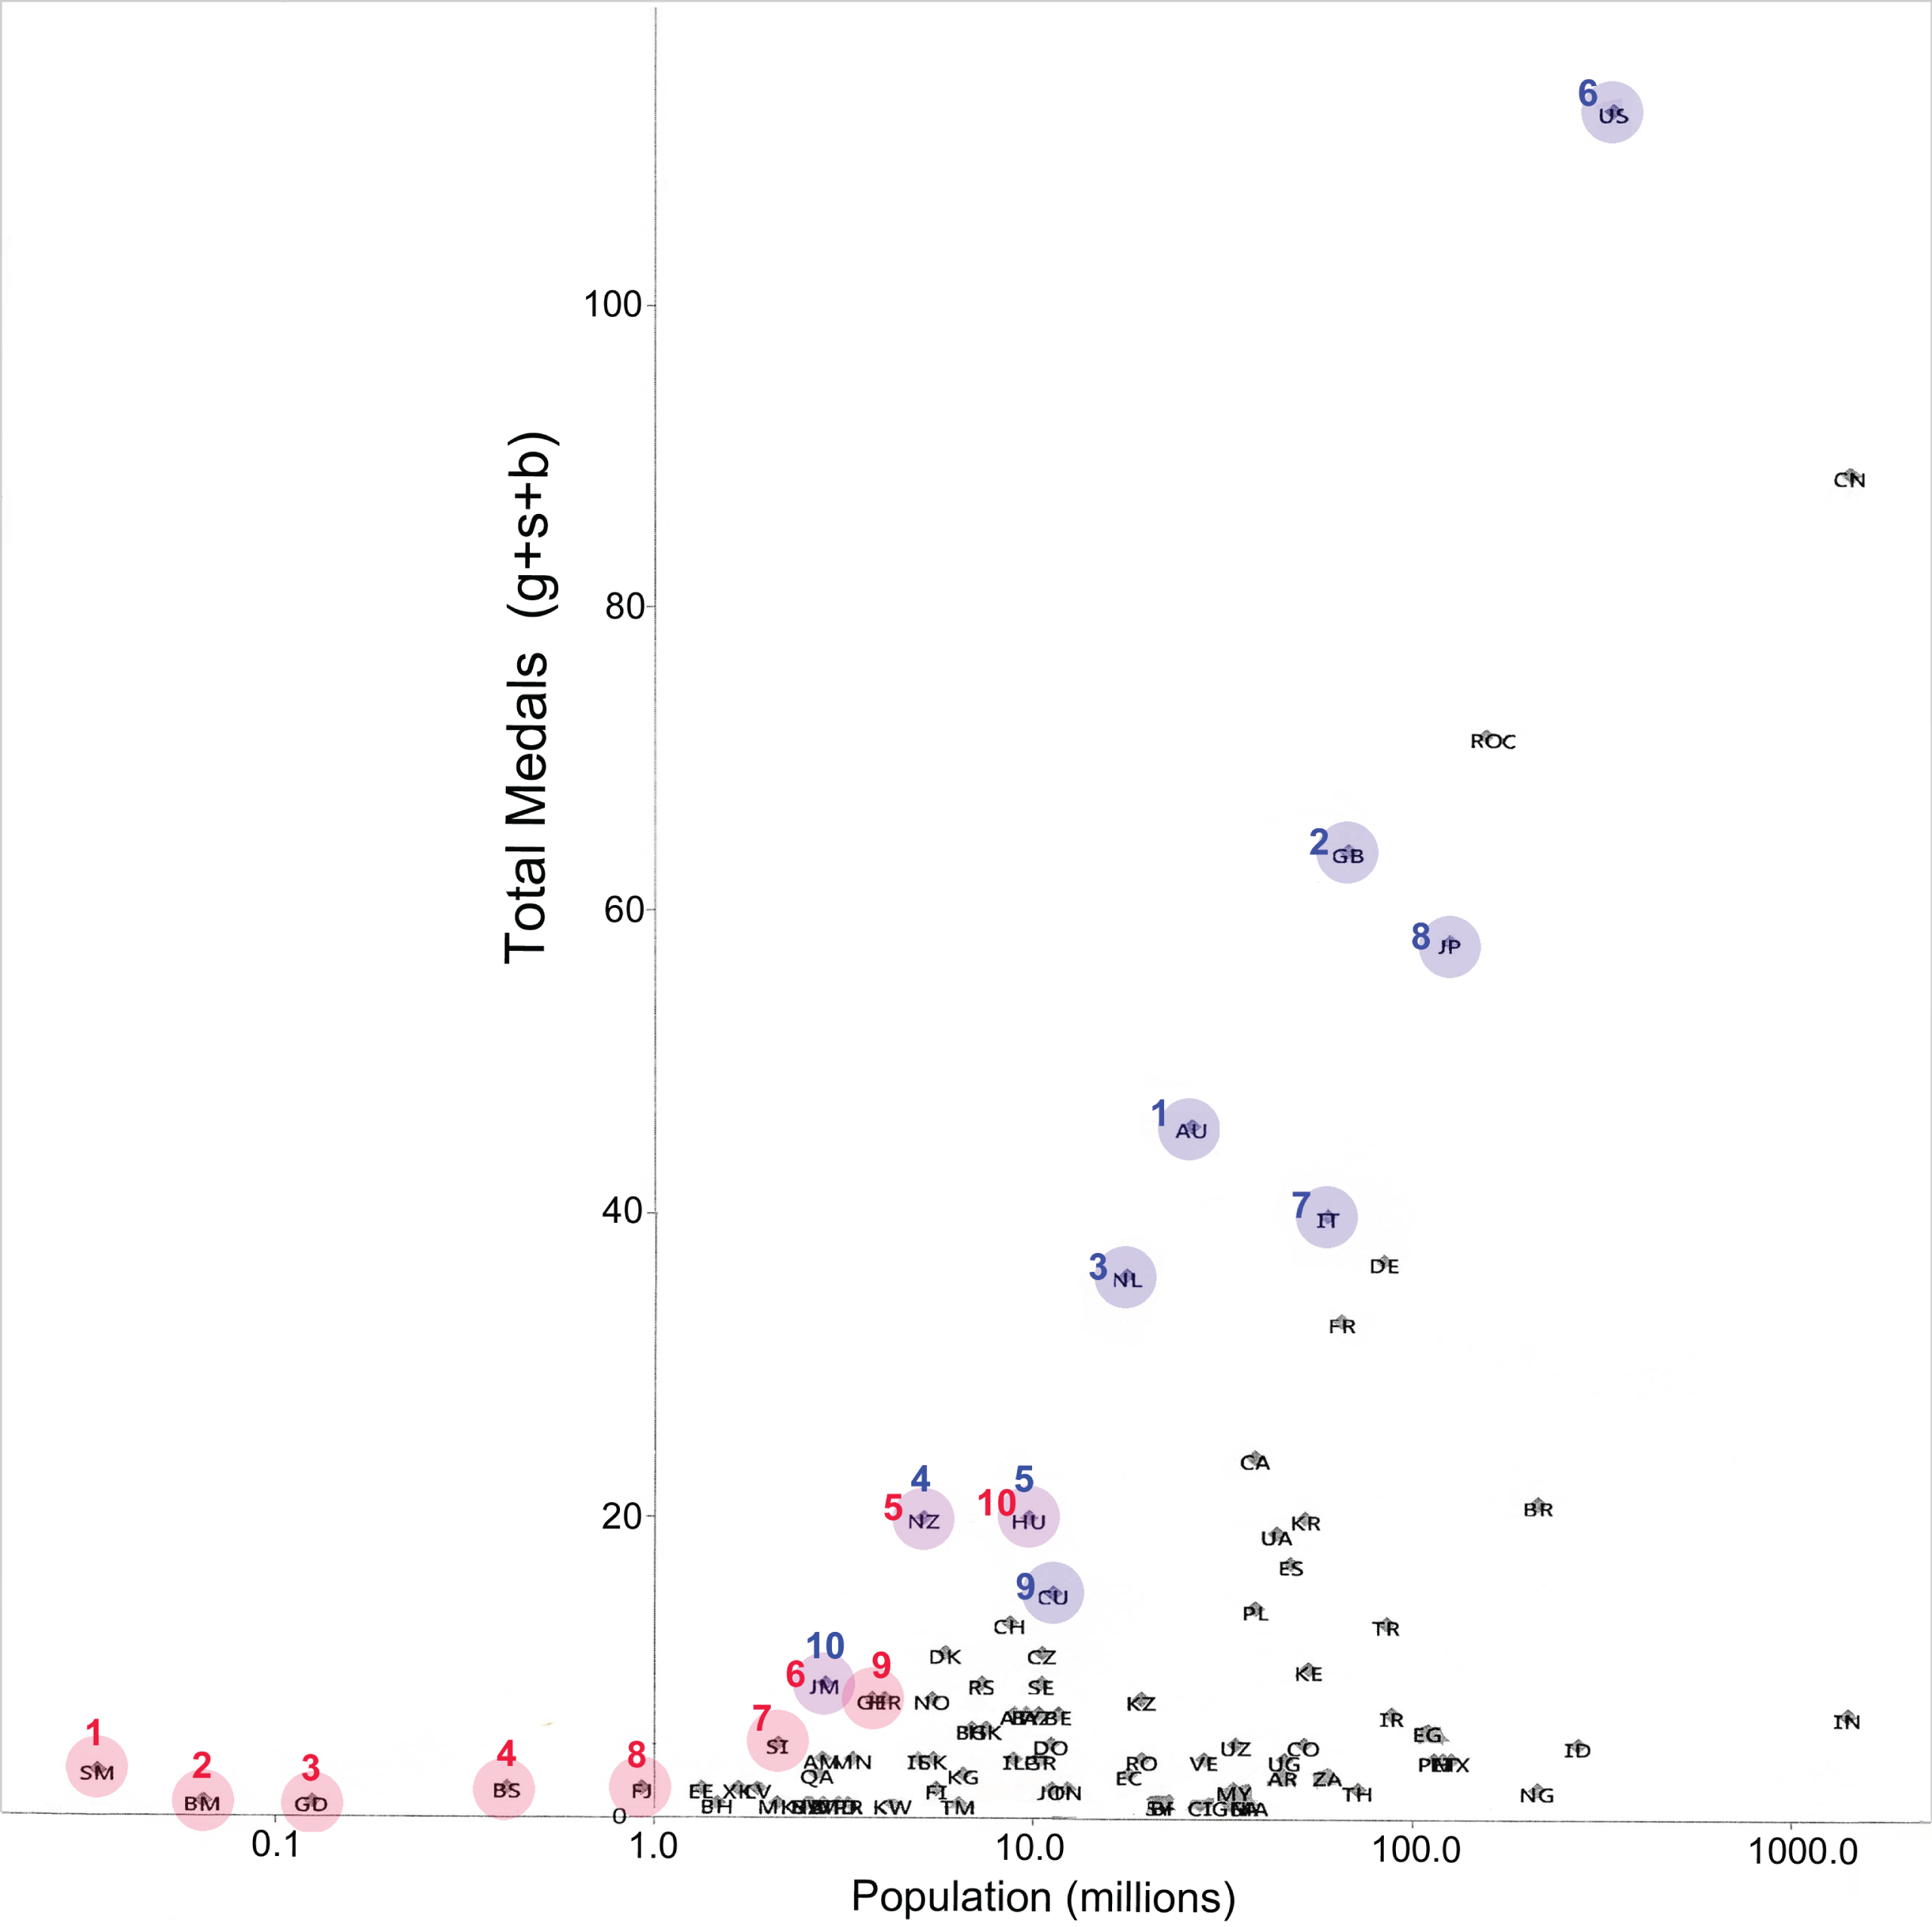
Figure 3 shows probability ranking results for the 2020 Tokyo Games. The top ten probability-ranked countries are highlighted in blue (cf. Table 2), and the top ten countries ranked by medals-per-capita are highlighted in red (cf. Table 1), with rank-numbers given in the same colors. Three countries (New Zealand, Hungary and Jamaica) are highlighted in purple because they made both top-ten lists. The top countries as ranked by total medal counts can also be easily found from Fig. 3, by starting at the top of the graph and moving downward: U.S.A., China, R.O.C., Great Britian, Japan, etc. (Note that the R.O.C. can be ranked by raw medal counts, but not by any population-adjusted index because the I.O.C specified that R.O.C. did not represent Russia in the 2020 Games.)
Fig. 3
The numbers of medals won by various countries, plotted as a function of national population (on a log scale) for the 2020 Tokyo Games. Probability rank-numbers are given in blue, and medals-per-capita rank-numbers are in red.
No ranking system is perfect, and given the vast population range and heteroskedasticity of the Olympic data, no single ranking system can highlight all national achievements comprehensively. Thus when seeking to highlight the achievements of very small-population countries, it may be useful to post medal-per-capita rankings alongside medal-count and probability rankings, at least some of the time. Tiny-population countries are effectively excluded from the top twenty in raw medal counts, and they tend to not reach the top five in probability rankings either, although some small-population countries can be U-ranked highly, such as Jamaica which was 3rd, 8th and 10th in the last three Summer Games, or San Marino, which was 16th in Tokyo. Tiny San Marino (population 34,000) would have needed one more medal to reach the U-ranks top ten, or 3 more medals to reach the top five, or, alternatively, 9 more medals to be ranked first. This might seem like a lot to ask for, but it is much less than the 110 more medals that San Marino would need to be first in the total medal-count; or the wildly impossible 126,763 medals that China would need to be ranked first in medals per capita.
In conclusion, we encourage sports media and public information sources to use population-adjusted probability ranking when reporting and assessing national performance in the Olympics. To facilitate this, probability rankings will be posted online at https://www.olympicnationalrankings.com/ and updated daily during future Olympic Games. If these U-rankings are presented regularly alongside raw medal-counts, this will deepen the public’s understanding and appreciation of achievement at the highest level of sports, worldwide, and add to the excitement and drama of the Olympics. We hope that this will make the Olympics more fun for everyone, while raising appreciation of the determined efforts made by athletes in many different countries to achieve Olympic excellence.
Acknowledgments
We thank Peter Pfitzinger of Athletics New Zealand for identifying this problem and urging us to resolve it.
We thank Christopher Small of the University of Waterloo in Ontario, Canada for many insightful comments, and for making sure that one of us (R.D.) survived a foolhardy attempt to run from Oxford to Cambridge on a day of record-breaking heat in Britain.
References
1 | Ball, D.W. , (1972) , Olympic Games Competition: Structural Correlates of National Success, International Journal of Comparative Sociology, 13: , 186–200. |
2 | Bernard, A.B. , & Busse, M.R. , (2004) , Who wins the Olympic games: economic resources and national totals, Review of Economic Statistics, 86: , 413–417. |
3 | Bian, X. , (2005) , Predicting Olympic medal counts: the effects of economic development on Olympic performance, The Park Place Economist, 13: (1), 37–44. |
4 | Burton, David A. , (2022) , Extreme Precision Binomial Probability Calculator. Available at: https://sealevel.info/binomcalc.sphp (Accessed 15 May 2024). |
5 | Churilov, L. , & Flitman, A. , (2006) , Toward fair ranking of Olympic achievements: the case of Sydney 2000, Comput. Oper. Res., 33: , 2057–2082. |
6 | Cook, T.A. , (1908) , The Fourth Olympiad: Official Report of the Olympic Games of 1908, London, U.K. The British Olympic Association, p. 366. Available at: http://www.la84foundation.org/6oic/OfficialReports/1908/1908.pdf (Accessed 12 May 2024). |
7 | Dunteman, G.H. , (1989) , Principle Components Analysis. Series: Quantitative Applications in the Social Sciences, Sage Publications, Newbury Park, California. |
8 | Flegl, M. , & Andrade, L.A. , (2018) , Measuring countries’ performance at the summer Olympic games in Rio 2016, OPSEARCH, 55: , 823–846. |
9 | Hoffman, R. , Ging, L.C. , & Ramasamy, B. , (2002) , Public policy and Olympic success, Applied Economics Letters, 9: , 545–548. |
10 | Humphreys, B.R. , Johnson, B.K. , Mason, D.S. , & Whitehead, J.C. , (2018) , Estimating the value of medal success in the Olympic Games, Journal of Sports Economics, 19: , 398–416. |
11 | International Monetary Fund, (2023) , World Economic Outlook (October 2023). Available at: https://www.imf.org/external/datamapper/datasets/WEO (Accessed 10 May 2024). |
12 | International Olympic Committee, (2023) , ‘Strict eligibility conditions in place as IOC EB approves Individual Neutral Athletes for the Olympic Games Paris 2024’, Available at: https://olympics.com/ioc/news/strict-eligibility-conditions-in-place-as-ioc-eb-approves-individual-neutral-athletes-ains-for-the-olympic-games-paris-2024 (Published Dec. 8, 2023). |
13 | Li, Y. , Liang, L. , Chen, Y. , & Morita, H. , (2008) , Models for measuring and benchmarking Olympic achievements, Omega, 36: , 933–940. |
14 | Lins, M. , Lins, M.P.E. , Gomes, E.G. , Sores de Mello, J.C.C.B. , & Sores de Mello, A.J.R. , (2003) , Olympic ranking based on a zero sum gains DEA model, European Journal of Operations Research, 148: , 312–322. |
15 | Lozano, S. , Villa, G. , Guerrero, F. , & Cortes, P. , (2002) , Measuring the performance of nations at the summer Olympics using data envelopment analysis, J. Oper. Res. Soc., 53: , 501–511. |
16 | Ogwang, T. , & Cho, D.I. , (2021) , Olympic rankings based on objective weighting schemes, Journal of Applied Statistics, 48: (3), 573–582. |
17 | Olympics.com (2023) . The Olympic Charter. International Olympic Committee. Available at: https://olympics.com/ioc/olympic-charter (Last updated 15 October 2023). |
18 | Olympics.com (2024) , Olympic Results, International Olympic Committee. Available at: https://olympics.com/en/olympic-games/olympic-results (Accessed February 1, 2024). |
19 | Saaty, T. , (2008) , Who won the Olympics? A multicriteria decision of measuring intangibles, J. Syst. Sci. Syst. Eng., 17: , 473–486. |
20 | Sitarz, S. , (2013) , The medal points’ incenter for rankings in sport, Applied Mathematics Letters, 26: , 408–412. |
21 | United Nations (2022) World Population Prospects 2022, United Nations United Nations Department of Economic and Social Affairs, Population Division. Available at: https://population.un.org/wpp/Download/Standard/Population/ (Accessed February 1, 2024.) |
22 | van Hilvoorde I , Elling, A. , & Stokvis, R. , (2010) , How to influence national pride? The Olympic medal index as a unifying narrative, International Review for the Sociology of Sport, 45: ((1)), 87–102. |
23 | Wood, R. , (2010) , ‘Comon of Weighted Ranking Systems,’ Topend Sports, May 2010. Available at: https://www.topendsports.com/events/summer/medal-tally/rankings-weighted.htm (Accessed 5 March 2024). |
24 | Wu, J. , Liang, L. , & Chen, Y. , (2009) , DEA game cross-efficiency approach to Olympic rankings, Omega 37: , 909–918. |
Appendix A
The Binomial Distribution
We now give a brief pedagogical review for readers who are unfamiliar with Equation (1) for P i (N, s i ). This basic theory is very well-known to statisticians, but it may be helpful to summarize the essential ideas here for sports journalists and others seeking to apply probability ranking.
The Binomial Probability Distribution is defined as follows. If p is the probability for success in a single trial event, then the probability for getting exactly N successes in a series of M individual, independent trials is
(14)
For example, if p is the probability for getting “heads” in a coin-flip, which has the value p = 0.5, then the probability for getting exactly N = 8 heads when you do a trial of M = 10 coin-flips is
(15)
To derive Equation (14), note that the factor p N (1 - p) M-N is just the probability that N specific independent trials out of t will succeed, because each success has a probability p and these probabilities multiplied together give a net probability p N , while the (M – N) non-successes each have probability (1 - p). To then find the probability that any set of N tests succeed we must multiply this by the number of ways that you can select N specific events out of a total number M. By simple combinatoric reckoning, it can be shown that the numbers of combinations of M things taken N at a time is M !/N! (M – N)!, yielding Equation (14). Now, each time you do 10 coin-flips, the number of heads N must be some value between 0 and 10, so the probabilities for all those outcomes must add up to 1. This is guaranteed by the “normalization condition”
(16)
Using Equation (14), this can be verified as a mathematical identity, which is known as the “Binomial Theorem.”
If you do many series of trials, each with M trial-events, then the mean number of successes that you will find, averaged over all the trial series, is
(17)
Notes
1 No single country can win all the medals awarded in an Olympic Games, because each country is only allowed one entrant in team sports (such as football/soccer, basketball, and rowing) and entrance quotas less than 3 also exist in many other sports (such the 2-entrant quota in gymnastics).

