
A deep learning approach to injury forecasting in NBA basketball
Abstract
Predicting athlete injury risk has been a holy grail in sports medicine with little progress to date due to a variety of factors such as small sample sizes, significantly imbalanced data, and inadequate statistical approaches. Data modeling which does not account for multiple interactions across factors can be misleading. We address the small sample size by collecting longitudinal data of NBA player injuries using publicly available data sources and develop a state of the art deep learning model, METIC, to predict future injuries based on past injuries, game activity, and player statistics. We evaluate model performance using metrics appropriate for imbalanced data and find that METIC performs significantly better than other traditional machine learning approaches. METIC uses feature learning to create interactive features which become meaningful in combination with each other. METIC can be used by practitioners and front offices to improve athlete management and reduce injury incidence, potentially saving sports teams millions in revenue due to reduced athlete injuries.
1Introduction
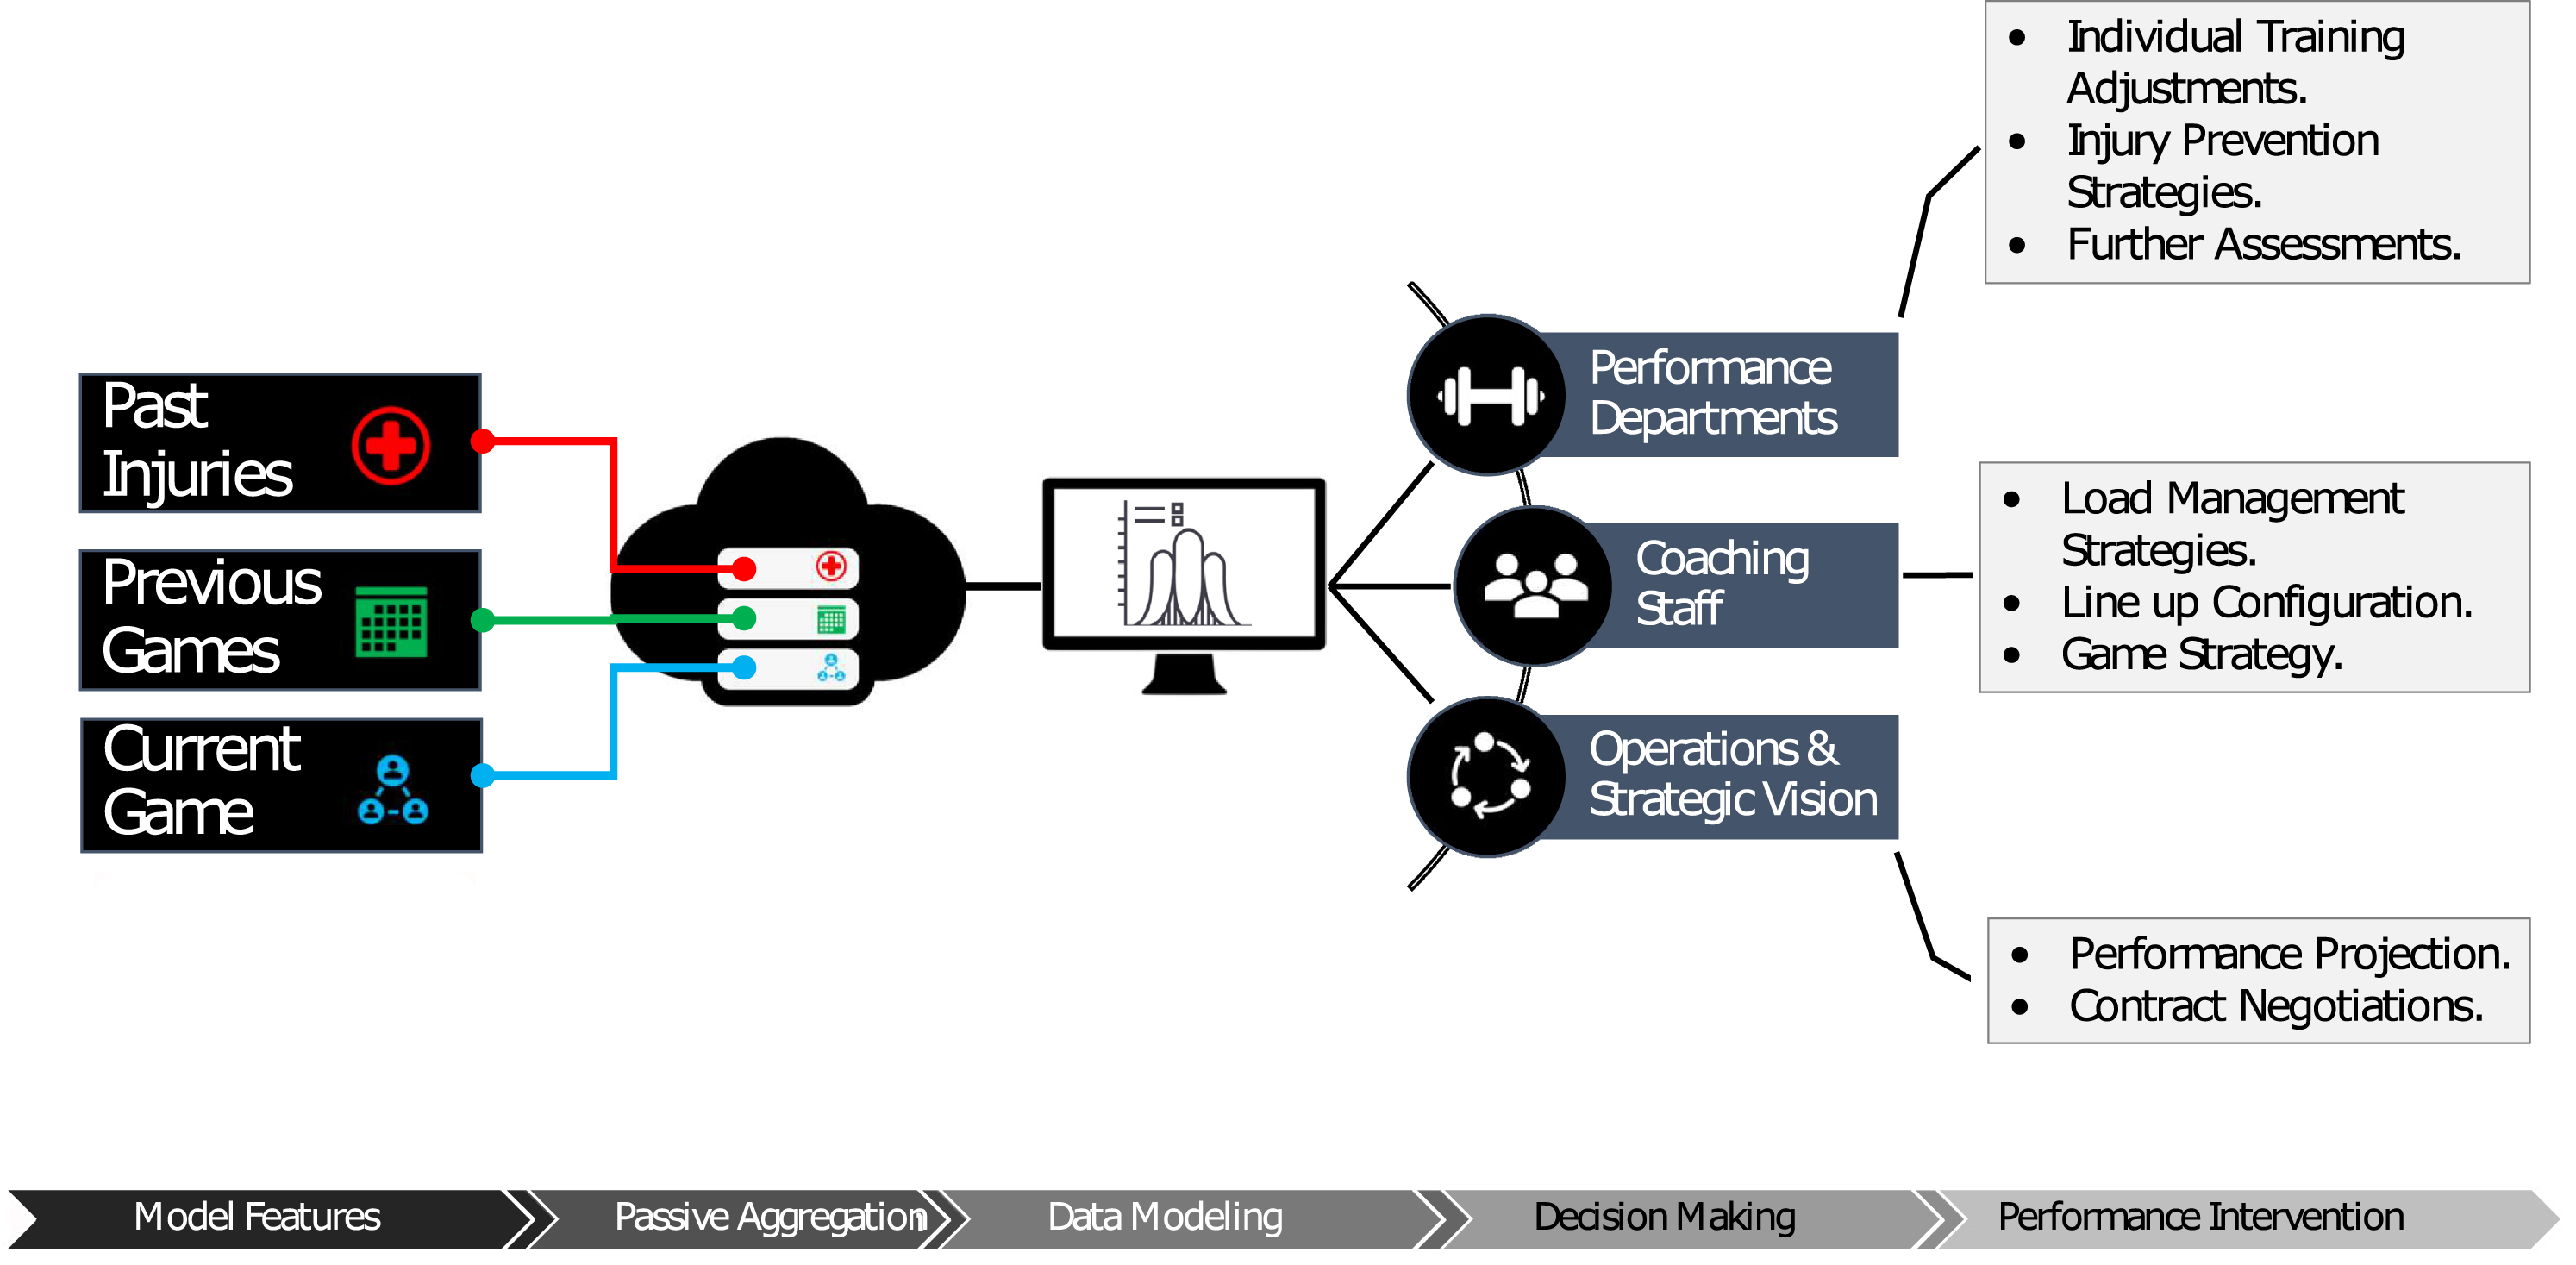
Sports teams lose millions of dollars in actual and potential revenue each year due to athlete injuries, despite significant investment in sports medicine, strength and conditioning, and analytics. Few, if any, would declare that sufficient progress has been made on reducing injuries despite such support staff being commonplace for several decades (Fullagar, et al. 2019; Hägglund et al. 2016; Conte et al. 2016). Athlete monitoring and management presently fail to meaningfully forecast injury risk (Soligard, et al. 2016; Buchheit 2017; Fanchini et al. 2020; Impellizzeri et al. 2020; Buchheit et al. 2019) missing significant advances from data modeling techniques that better represent the complexity and variety of interactions across factors. Recent advances in Deep Learning allow for new approaches to this critical mission of support staff in sport; forecast potential injuries in a way which provides actionable insight for decision-makers. This information can then be utilized by sporting organizations in various areas such as training optimization, load management, and other operational tasks such as future player projections, as shown in Fig. 1.
Fig. 1
Overview of the data pipeline and highlights of the different stages of processing, including feature identification, passive aggregation of data, and deep learning analytical approaches, as well as custom dissemination of the findings for multiple stakeholders.
Traditional approaches to athlete load monitoring have shown limited utility due to only being able to account for a few pieces of the puzzle which influence athlete performance and poor predictive analysis techniques to forecast injury risk (Impellizzeri et al. 2020; Hulme et al. 2017; Hulme & Finch 2015; Hulme et al. 2019; Bittencourt & Meeuwisse 2016; Stern et al. 2020). Advancing towards more useful approaches which can inform athlete management is a worthwhile pursuit to help support performance and medical staff and maximize the investments being made by sporting organizations (Buchheit 2017). Embracing complexity and deploying recent advances in data science to identify instances of heightened risk, often termed red flags, can provide meaningful opportunities to mitigate injury incidences, increase player availability, and enhance results. In the sports medicine and performance field, the use of statistical calculations to determine injury risk is often hindered by cultural silos where different staff departments do not communicate sufficiently to make use of data insights, or the data being used is limited in scope failing to account for the broad range of factors which may impact injury risk (Mooney et al. 2017). Data science practices involved often fall short of necessary standards due to oversimplified approaches and flawed metrics, in contrast to embracing complexity and pattern recognition where recent advances in data science allow (Kampakis 2016; Lakens 2020; Casals & Finch 2017; Stern et al. 2020; Claudino et al. 2019; Cook 2016; Impellizzeri, et al. 2020).
In this paper, we present a model which outperforms other available and recently cutting-edge methods, despite our data missing details such as exact occurrence time and injury-type, as well as geospatial activity metrics and biometric evaluations taken regularly by teams, which could potentially significantly improve model accuracy. Our approach demonstrates the potential for deep learning models to predict injury risk even with limited available data.
A contribution of this study is to present a framework and encourage better handling of data and evaluation metrics appropriate for risk injury. We manage this with adoption of modern data science practices and a larger injury sample size and variable set than previous studies (Jaspers et al. 2018; Peterson et al. 2019; Rossi et al. 2018; Vallance et al. 2020; Ge 2017).
Deep Learning is representational learning (Bengio et al. 2013) where shallow layers learn representations of data built upon deeper layers. This paradigm has been described as feature learning since the model learns to identify and build important features during training. In past studies, heavy emphasis has been placed on feature engineering by defining specific metrics or ratios that are fed into a model (Dhar 2017; Zheng & Casari 2018). This study utilizes feature learning in a deep learning model which can be an opaque process. We attempt to provide insight into the model decision process by examining model explainability.
2Methods
2.1Injury data
Injury data includes detail on every injury in the NBA reported between 2010-20. The data was scraped from “Pro Sport Transactions” website using the Airball package in RStudio (RStudio Team 2020; Fernandez 2020; Pro Sports Transactions 2020). The dataset contains information on 11k injuries. The accuracy of injury reporting timing and thoroughness of the reporting is uncertain. Teams are incentivized to obscure player injuries if feasible to maintain a competitive advantage. This study relies on publicly available data which is noisy in nature. We have taken the approach to embrace the noise of the dataset and accept it is an unavoidable reality of dealing with public player injury data.
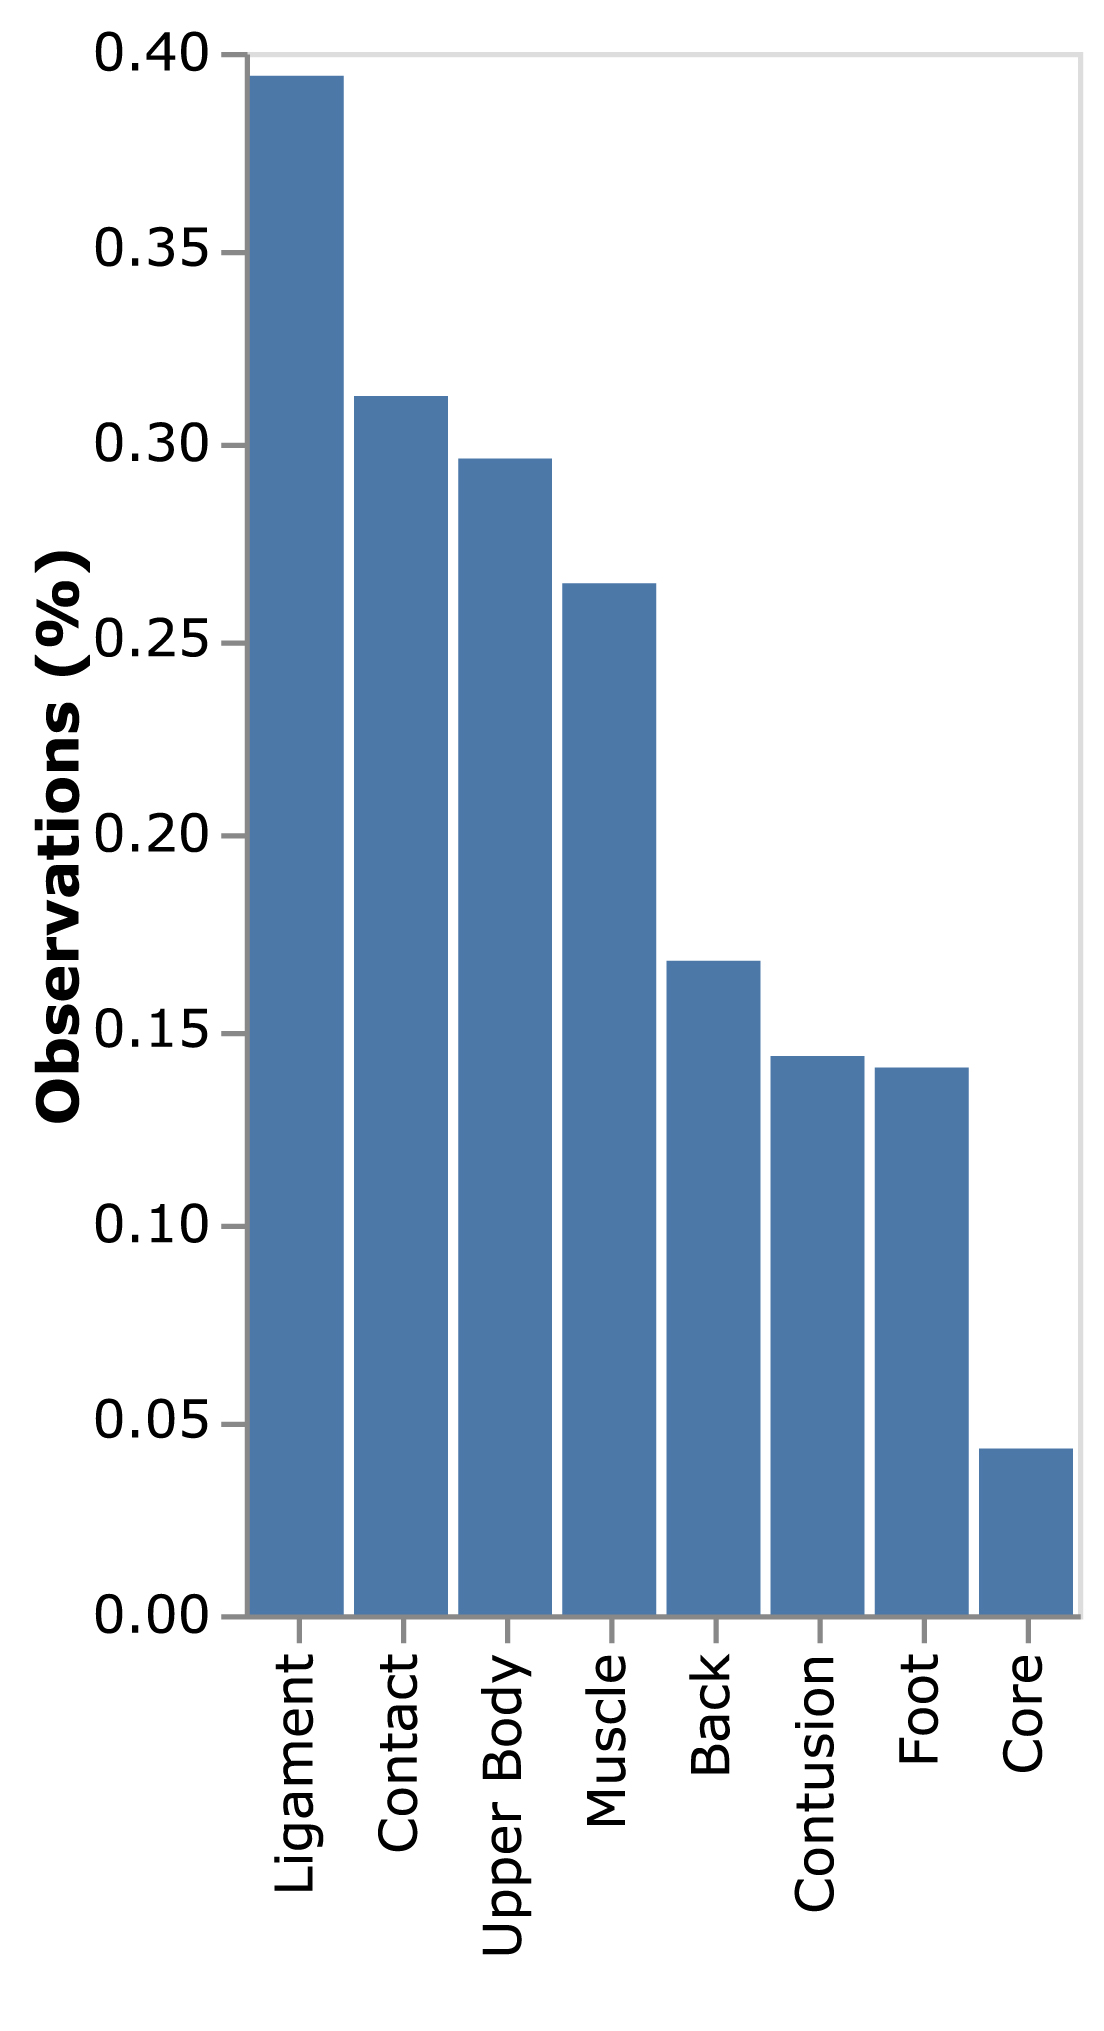
The terminology used to describe the injuries is inconsistent. The injuries are grouped into eight common injury types based on keywords used in official league reporting via Cerner; back, contact, contusion, core, foot, ligament, muscle, and upper body (Cerner n.d.). There are additional injuries which don’t fit into these buckets but are too uncommon to include in this modeling exercise. The incident rate for each injury type is shown in Fig. 2.
Fig. 2
Percentage of injury incidences by type in the dataset examined.
Team rosters and athlete’s data as well as information about who was coaching the team for each game in the dataset were downloaded via the publicly accessible NBAStatR interface which provides access to data from https://stats.nba.com/ as well as other popular Basketball data sources (The NBA Stats R Studio Interface, 2020). Injury data is enriched with game-specific player statistics. There are 238k player-game observations with data describing home and away teams, game location, player height and weight, player primary and secondary position, and game time. We observe an interesting lack of literature utilizing publicly available data and emphasize that various markers of accuracy and utility from analyses could be greatly enhanced by official team data.
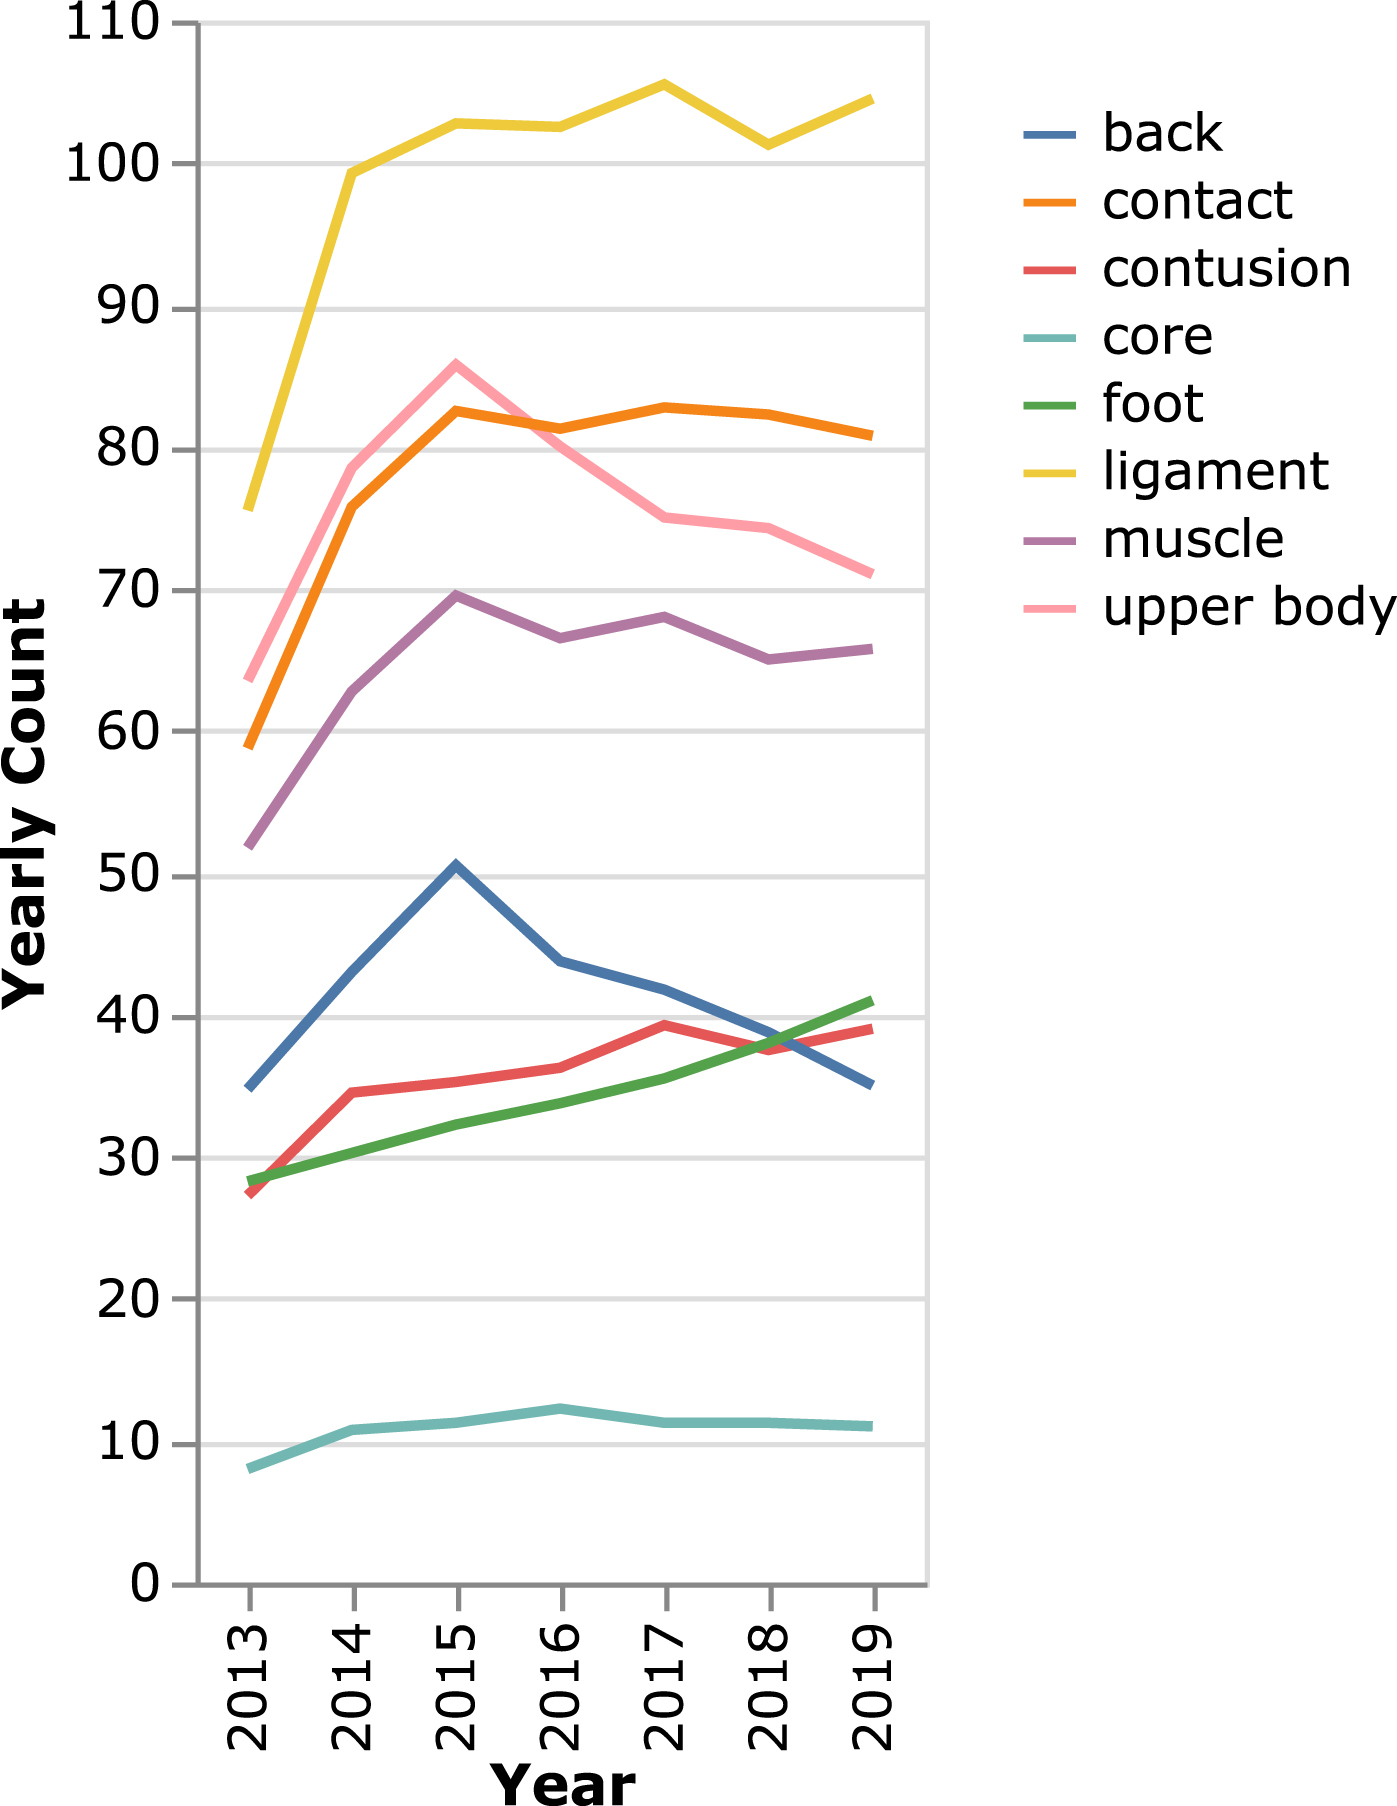
Injuries are attributed to the most recent game within 30 days. This assumption leads to associating 5k injuries with games. The total number of injuries by injury type is generally increasing despite a near-constant number of NBA players, as shown in Fig. 3.
Fig. 3
4 year running average of injuries in the NBA by type of injury illustrating an increasing prevalence of injuries of all types despite the number of players in the NBA and their ages remaining relatively constant.
The dataset is absent any biometric data such as geospatial activity, subjective wellness, sleep tracking, or neuromuscular status. The presented approach could be extended with more information from the athlete or their organization, and the results of this study must be considered within this context.
This dataset is significantly imbalanced with injuries accounting for less than 4% of the data, as shown in Fig. 3. Discussions of the inherent imbalance among sports injury datasets have been lacking and must be taken into account when performing analysis on sports injuries (Ruddy et al. 2019; Kajdanowicz T 2017).
A troubling artifact in many past studies modeling injury risk is using the same data to train and evaluate model performance (Google Machine Learning 2020; Lundberg et al. 2019). Not properly splitting data and reporting metrics on training data leads to an over-confidence in model predictive power (Xu & Goodacre 2018; Google Machine Learning 2020). Results like 98% accuracy (Peterson et al. 2019), 90% accuracy (Adetiba et al. 2017), and 0.97 ROC AUC (Vallance et al. 2020) may seem impressive but are in fact misleading since the generalizability of the approaches are unknown. One notable exception is Rossi et al. (2018).
The data is split into train and validation sets consisting of 85% /15% of the data using an iterative stratified approach for injury pairs (Sechidis et al. 2011; Szymański & Kajdanowicz 2017). There are 750 injuries in the validation set. The injury types are treated as multi-label multi-classification since players can incur multiple injuries at the same time.
2.2Risk factors
This section examines risk factors considering specific criteria conditions as seen in the dataset. Figure 4 shows average and 95% confidence intervals of increased risk factors calculated with Monte Carlos bootstraps of the dataset. These results are exploratory and not derived from modeling.
Fig. 4
Single-factor risk factor analysis with mean and 95% confidence intervals shown in blue and black, respectively.
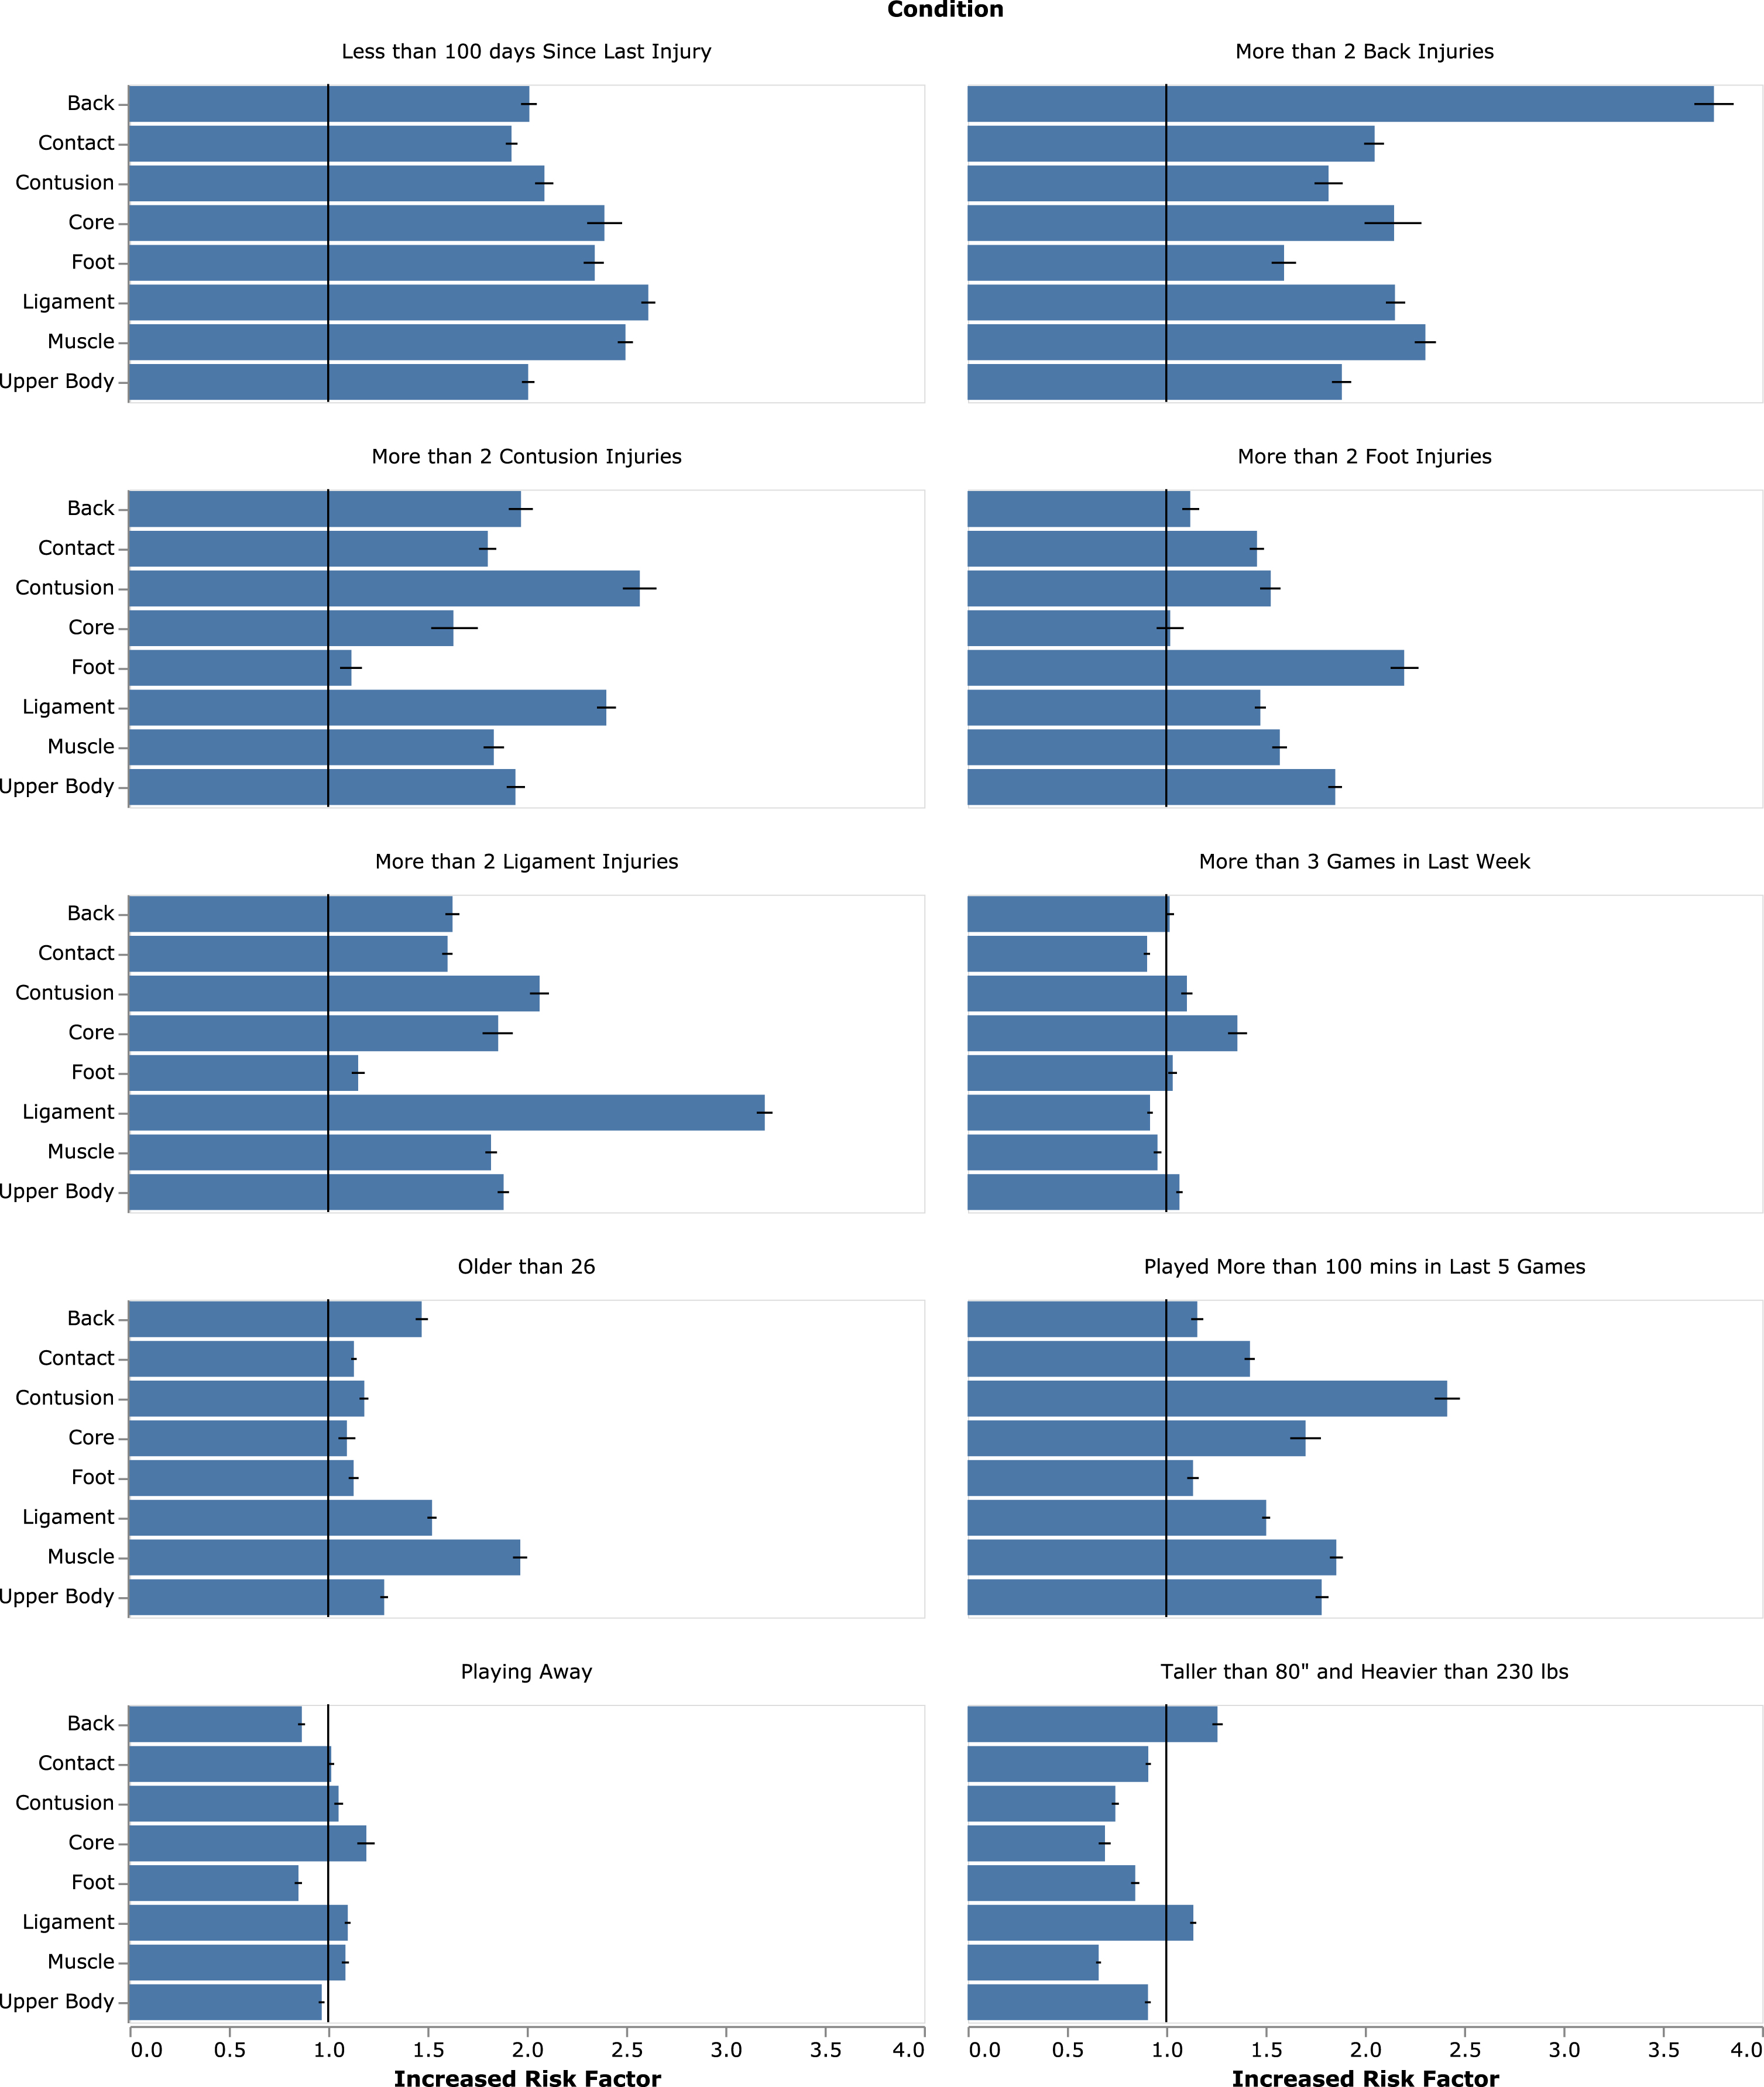
While our data showed that height may influence risk of back and ligament injuries, this has not previously been supported despite it being a current concern which has been examined in popular media and academia (Stotts 2014; Eric Choi, Penn State University 2015). We found that high playing-time load, here reported as more than 100 minutes in the previous five games, influenced incidence of all injuries but especially muscle and contusion-type injuries, which is corroborated in the literature (Lewis 2018). In general, previous injury was a meaningful indicator of future injury, which has been demonstrated in multiple sports with different injury types (Toohey et al. 2017; Terry et al. 2018; Fulton et al. 2014). Generalizing results is very difficult in the literature where subject-samples do not exceed 30, while our dataset examines injuries from 856 NBA players. The risk factors reported here are generalized across the data manifold which includes multiple teams over multiple seasons; however, they do not capture trends within individual athletes.
2.3Model development
We propose a new deep learning approach to assess injury classification METIC: Multiple bidirectional Encoder Transformers for Injury Classification. This architecture is largely inspired by BERT (Devlin et al. 2018). We use the same multi-layer bidirectional transformer encoder based on the implementation described in Vaswani et al. (Vaswani et al. 2017). The transformer has led to significant advances in the state of the art of natural language processing (Radford et al. 2018; Brown et al. 2020).
METIC uses multiple transformer encoders to process the sequences of data associated with past injuries and previous games. We limit the analysis of past games to the previous 5 games, while all past injuries are considered. The model inputs are shown in Table 1 and an overview of the model architecture is shown in Fig. 5. Model architecture is optimized using Keras Tuner (O’Malley 2020; O’Malley et al. 2019). METIC contains 3.2 million learnable parameters.
Table 1
METIC model and METIC explainability model input features
| METIC | Explainer Model | |
| Current Game | Coach, Primary Position, Secondary Position, Player, Age, Height, Weight, Game Location | Primary Position, Secondary Position, Age, Height, Weight, Game Location |
| Past 5 Games | Age During Game, Time Played, Time Since Game, Game Location, Coach | Time Since Last Game, Games in Last Week, Total Minutes Played in Last 5 Games |
| Past Injuries | Body Area, Age During Injury, Time Since Injury | Number of Injuries for Each Body Area, Age at First Injury, Age at Last Injury, Time Since First Injury, Time Since Last Injury |
Fig. 5
Overview of METIC architecture.
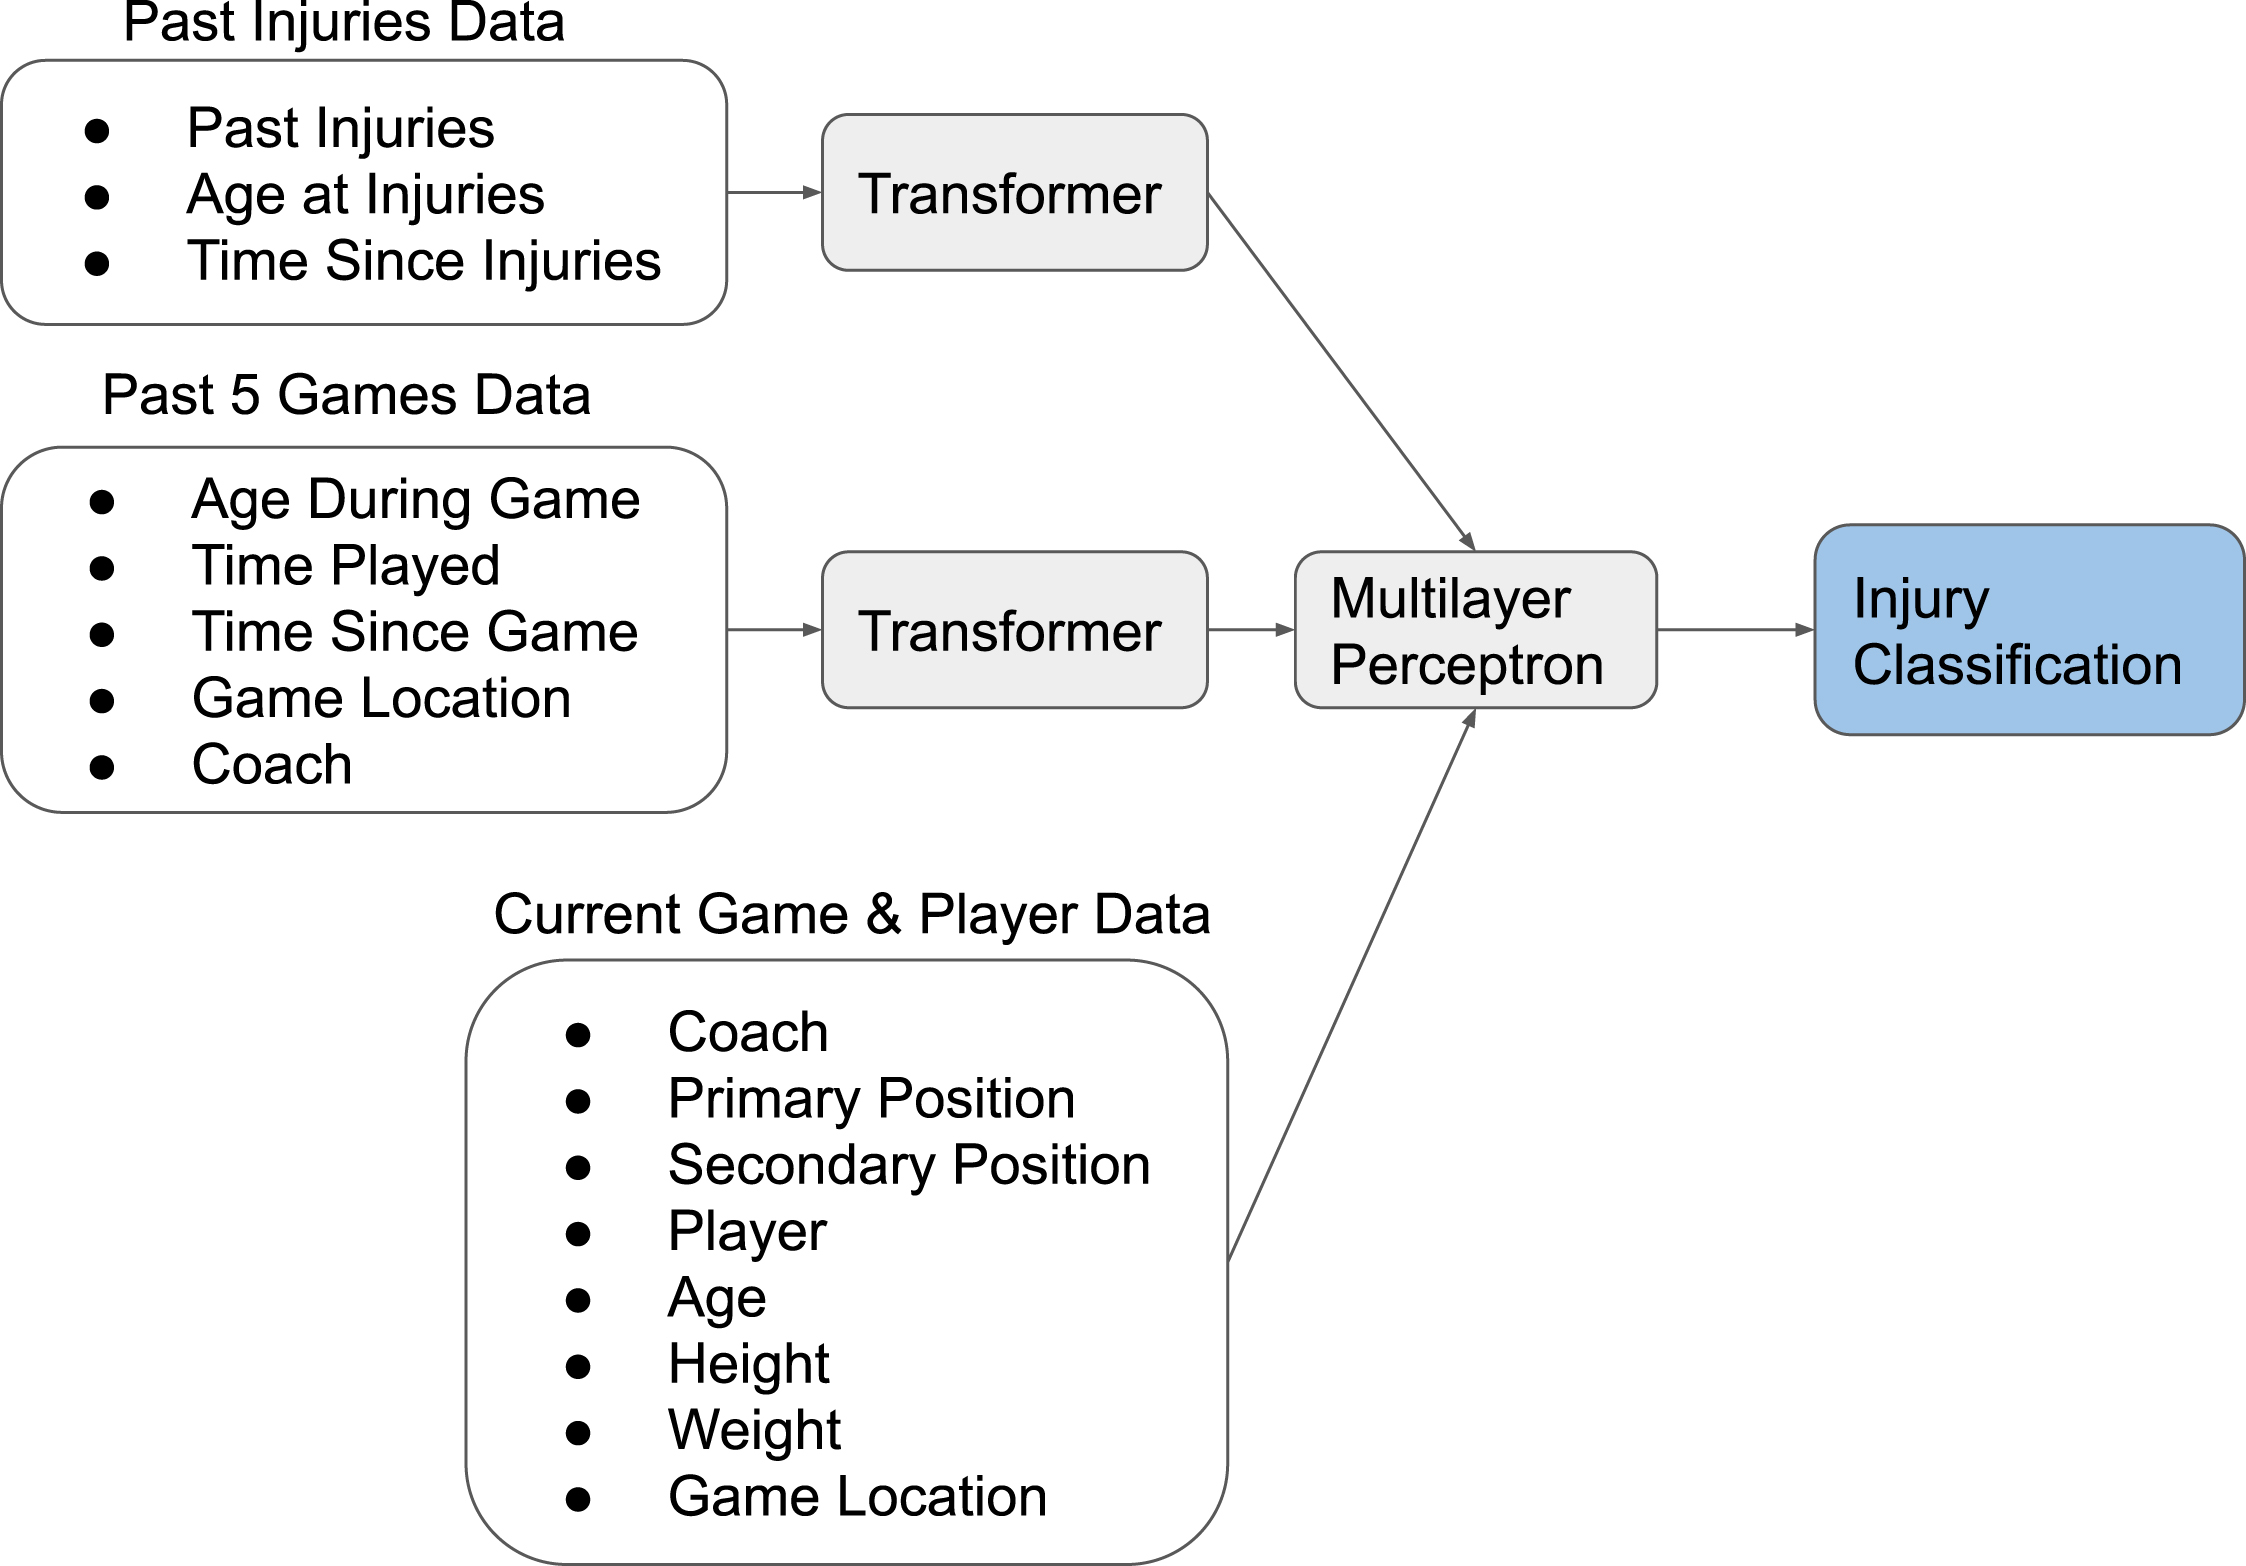
Fig. 6
Receiver Operating Characteristic (ROC) curves by injury type for validation and training data by injury type. ROC curves plot the true positive rate versus the false positive rate in a dataset as a function of the model’s threshold for classifying a positive result.
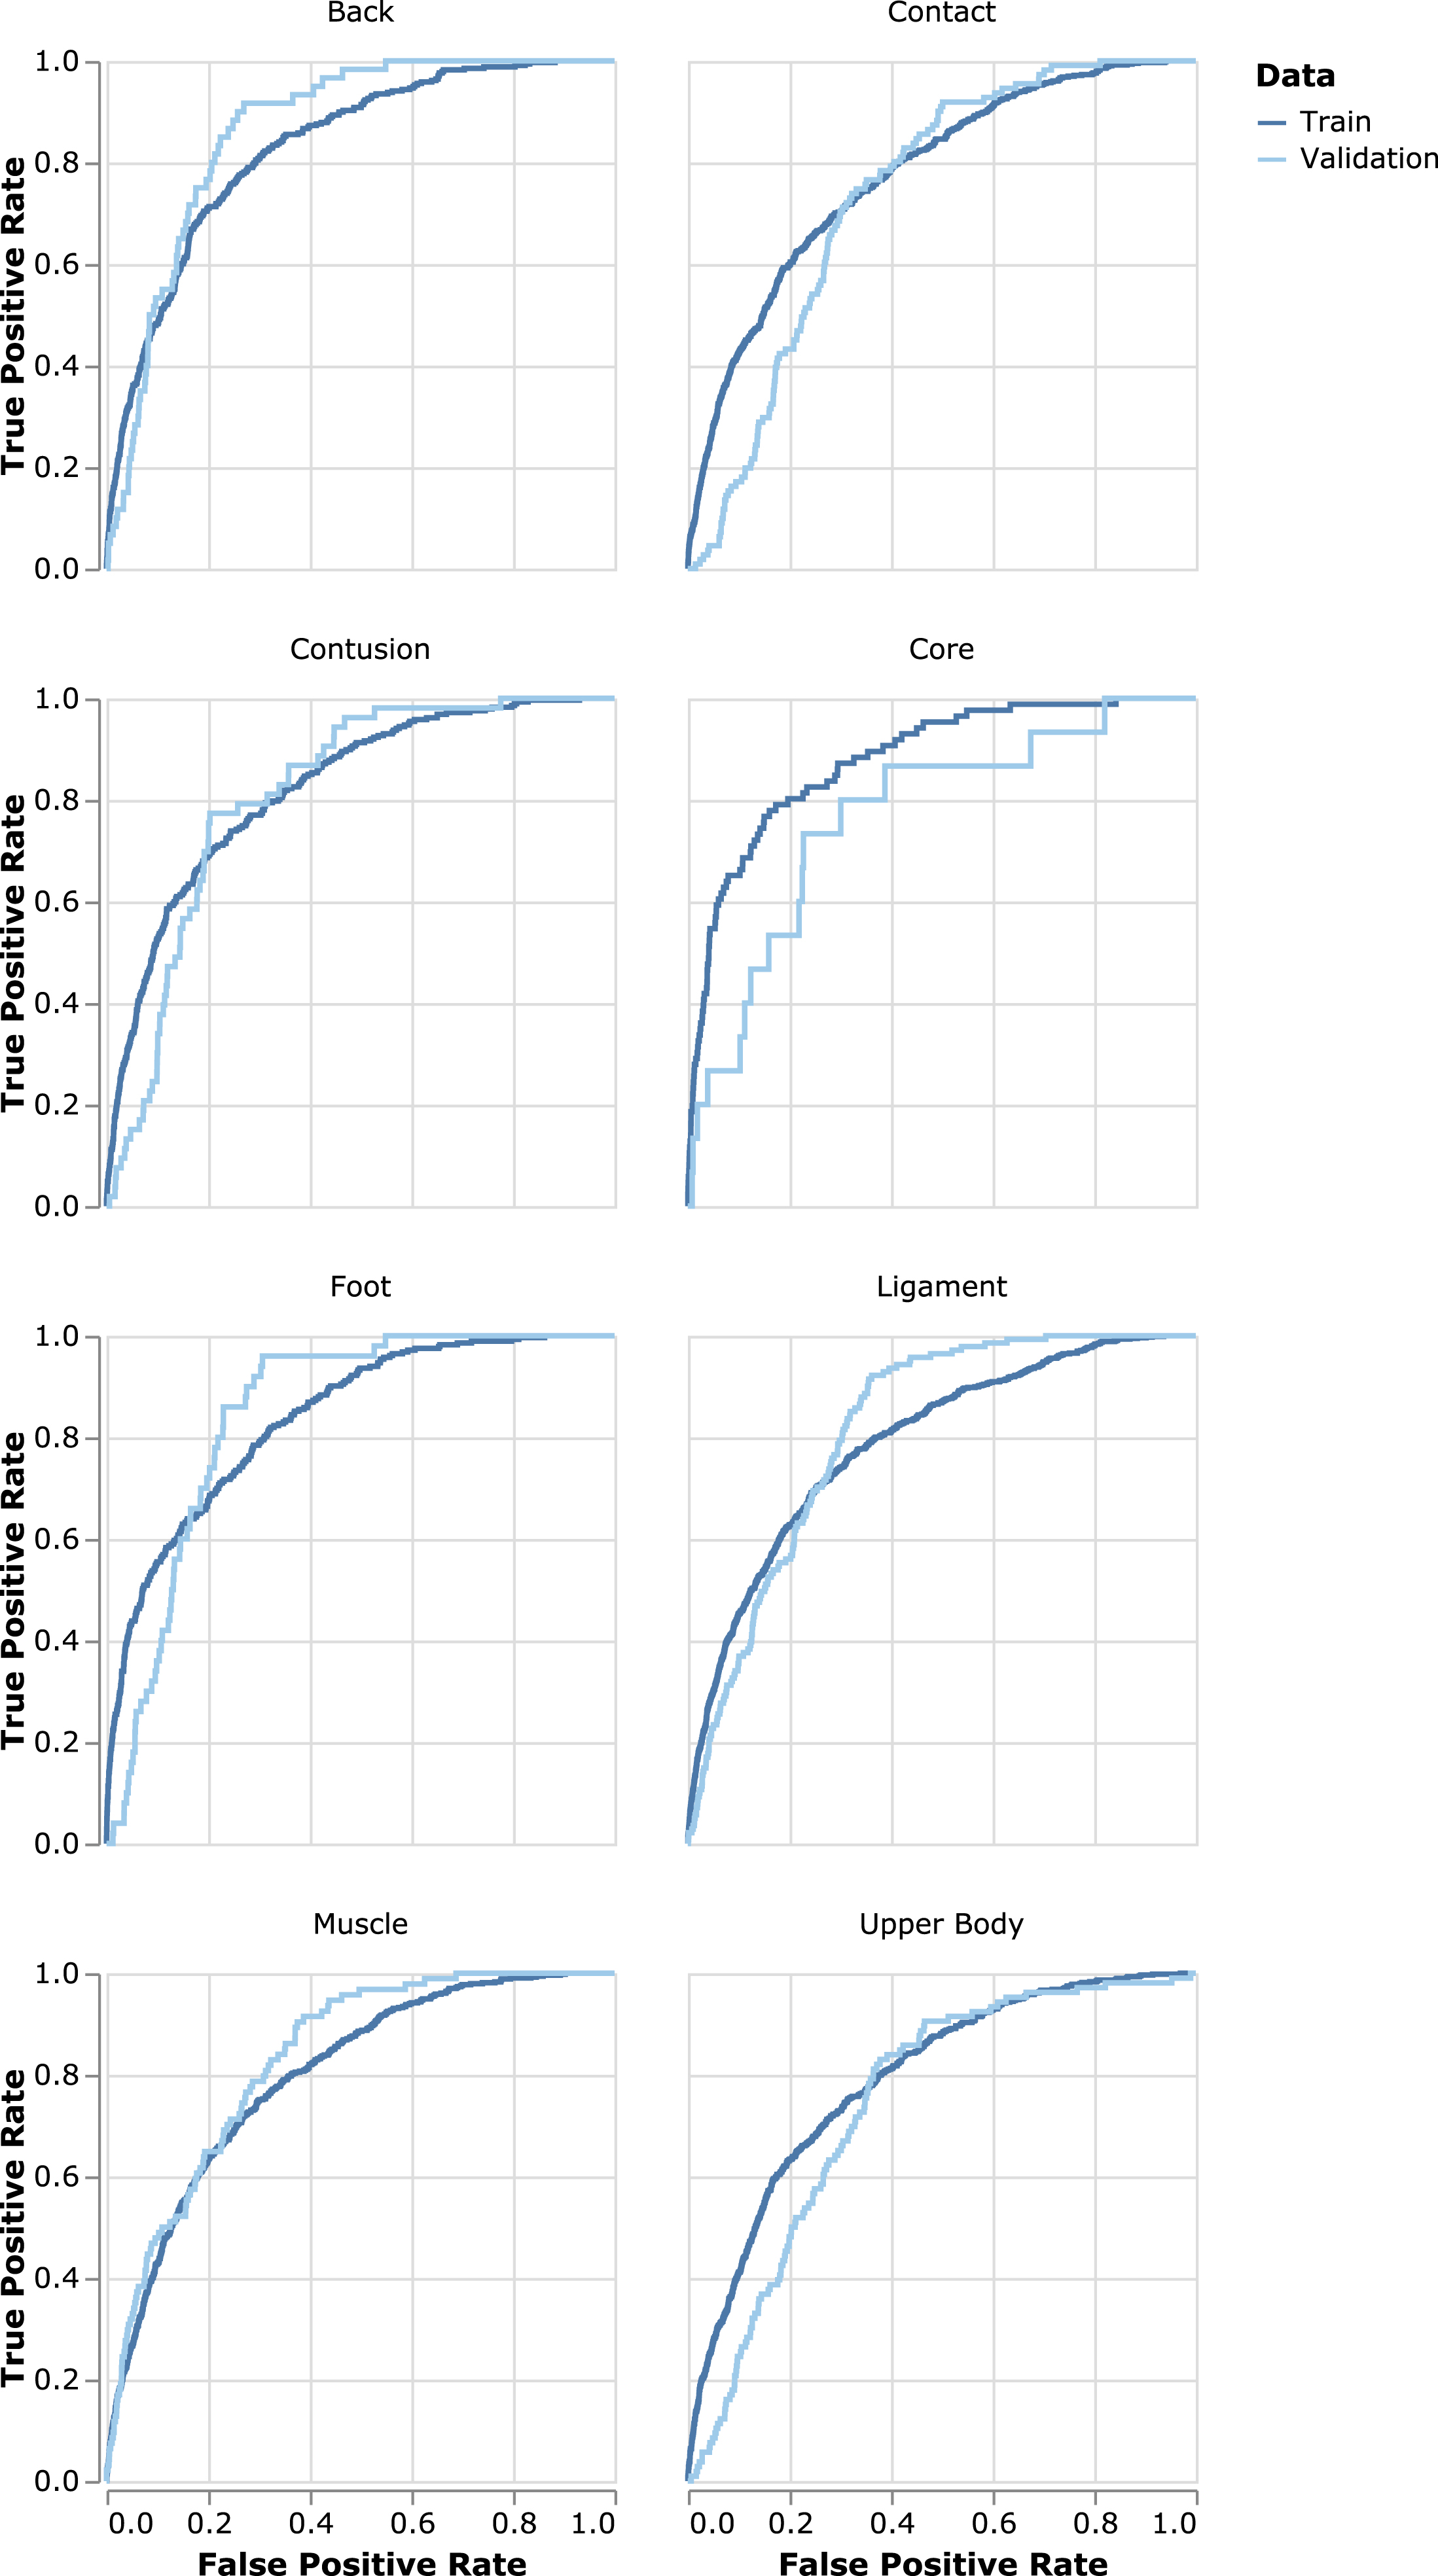
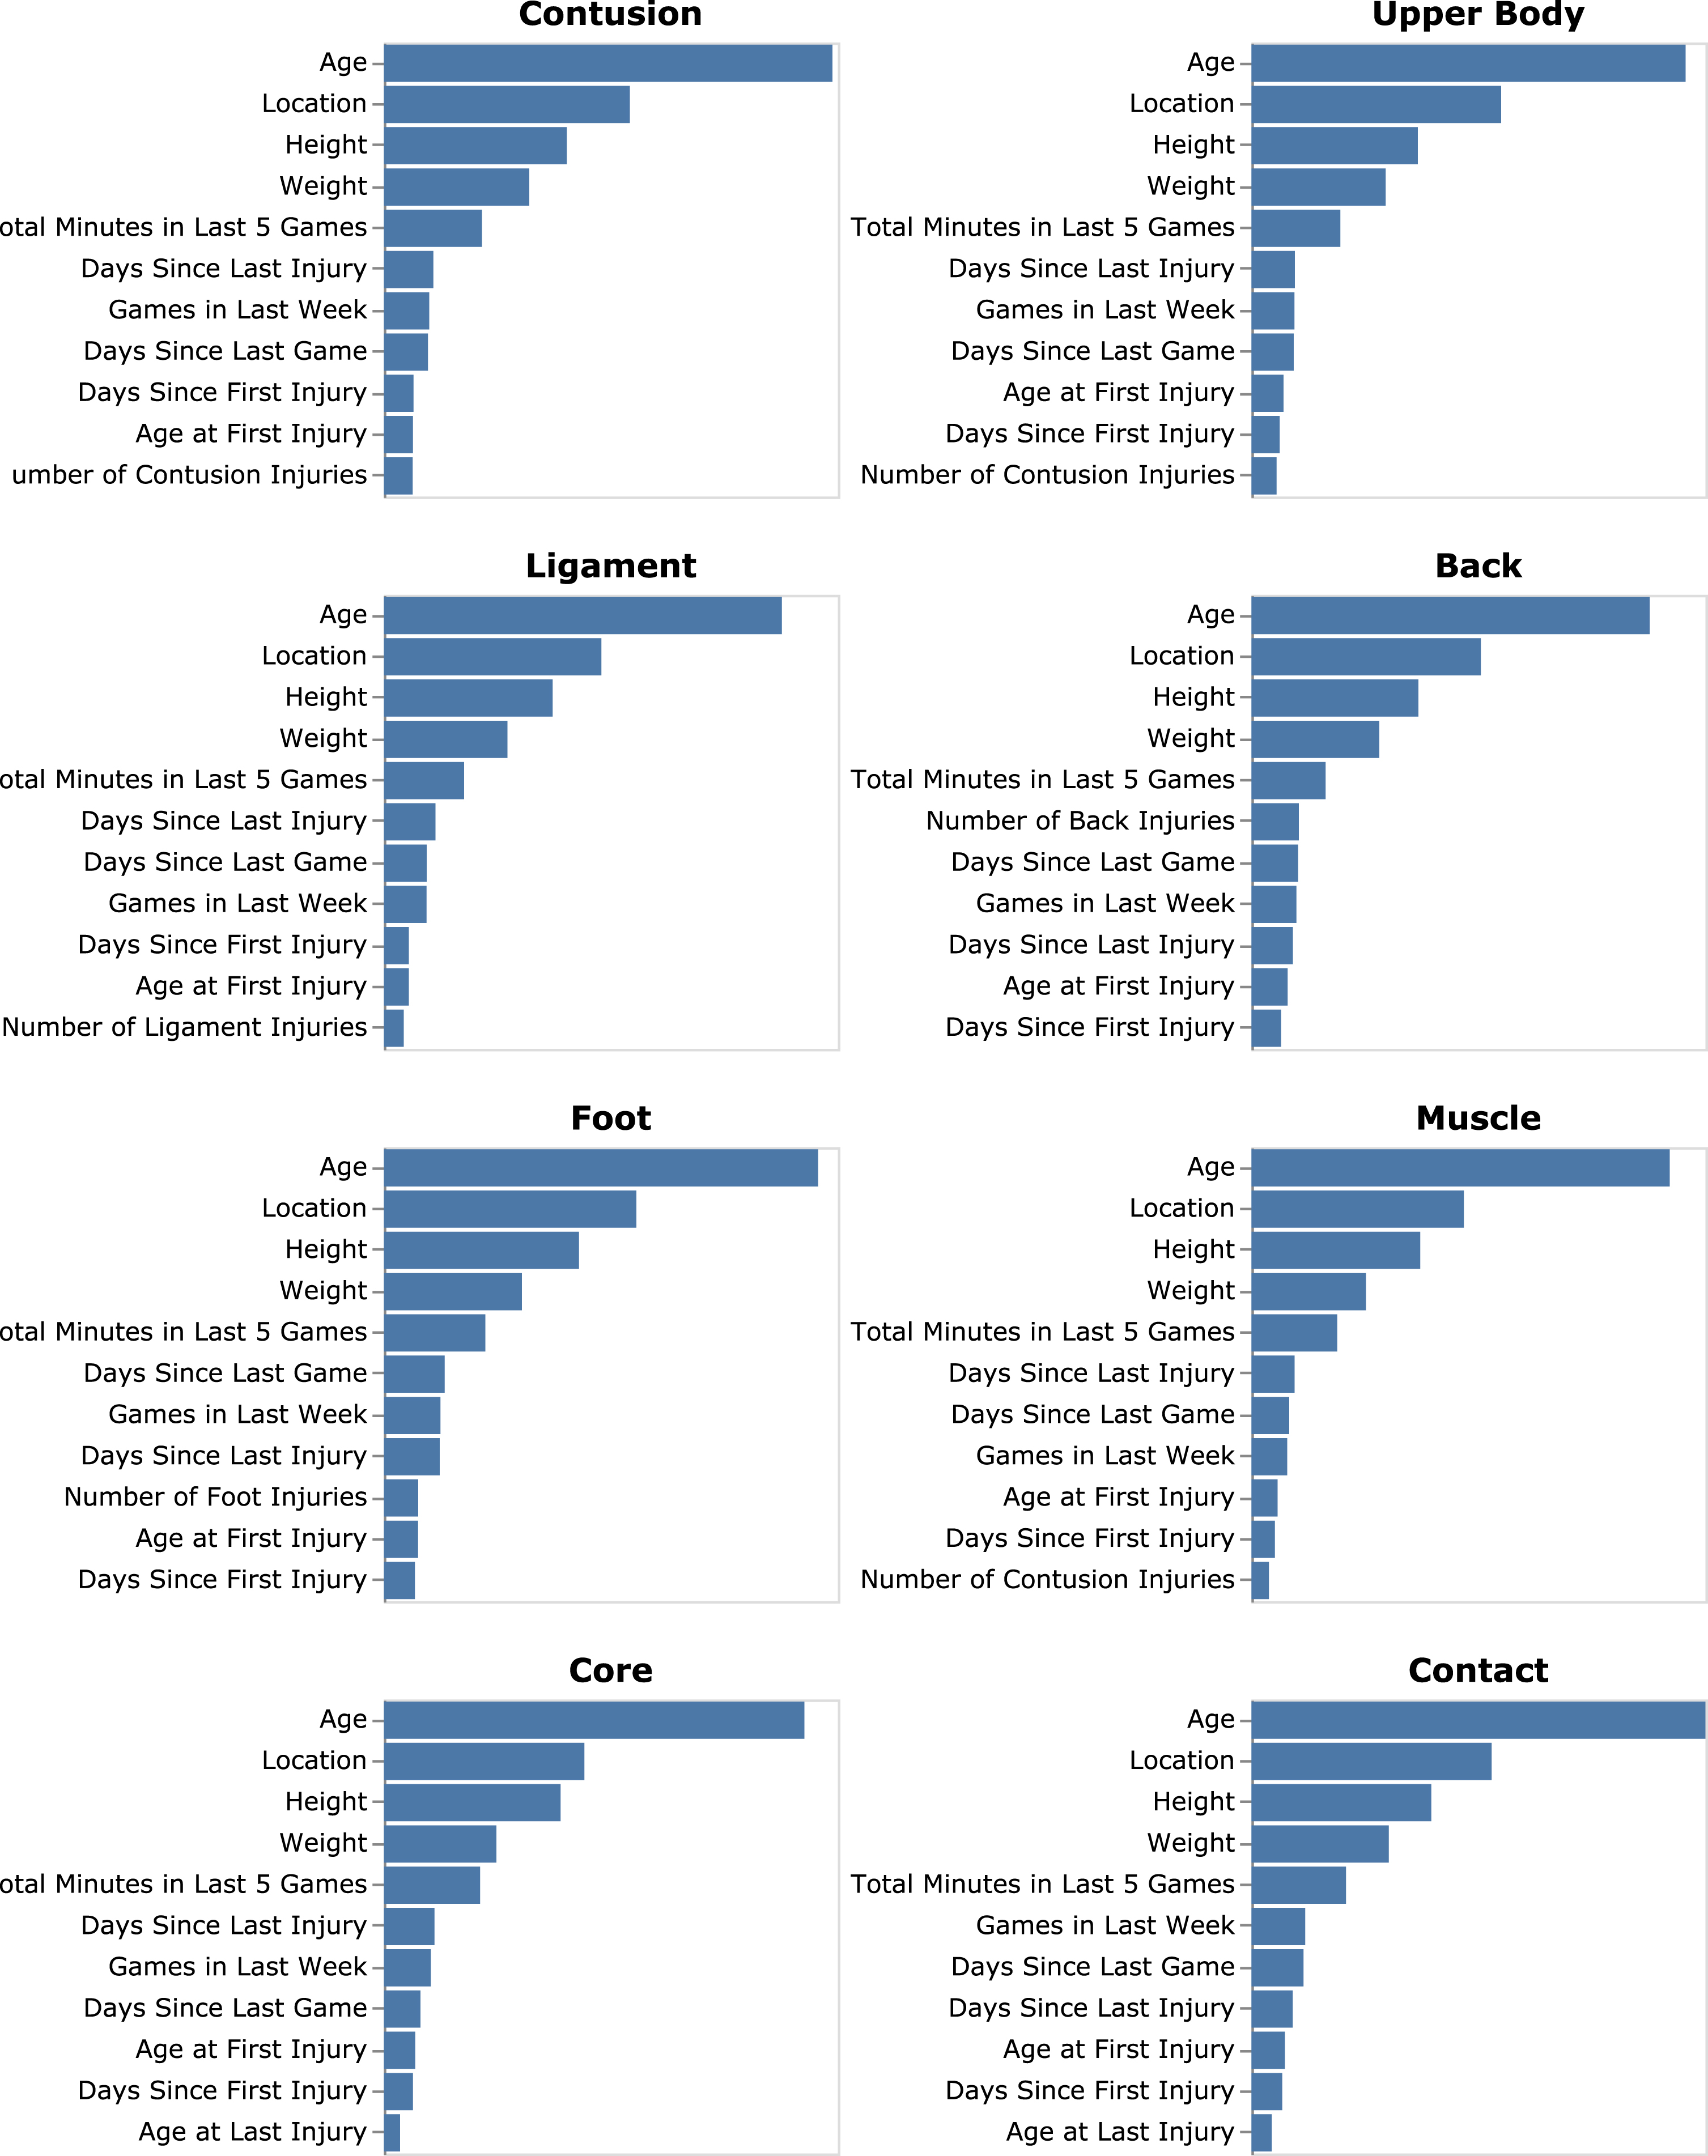
Fig. 7
Average model impact measured by mean absolute value of Shapely values by injury type.
Time data, such as age and time to events, is embedded using the time2vec approach introduced by Kazemi et al (Kazemi et al. 2019), with a sinusoidal activation function. METIC uses time embeddings to provide context for the injury and game embeddings in the same manner as how BERT uses positional and sentence embeddings to provide context.
The inputs to METIC are shown in Table 1. METIC is a deep learning model which performs feature representation learning, hence minimally feature engineering is performed on the data.
To compensate for the imbalanced nature of the dataset, several strategies were explored including over-sampling of positive injury data, under-sampling of non-injury data, weighting the data, and creating synthetic samples (Lemaître et al. 2017). All these approaches led to worse model performance for the validation set, hence they are not considered further for METIC.
3Results
3.1Model comparison
Several simple models are examined, including; one-vs-the-rest (OvR) Ridge classifier, extra-trees classifier, random forest classifier, Lasso regression, OvR Gaussian Naive Bayes (NB), OvR Bernoulli NB, OvR Logistic Regression (Pedregosa et al. 2011), and OvR XGboost Classifier (Chen & Guestrin 2016). Some of these methods responded positively to over-sampling of positive injury data. Additionally, a trivial solution of predicting no injuries ever is included in the assessment which we refer to as the No Injury model. Summary statistics of all the methods’ performance on the validation set are presented in Table 2. METIC performs favorably against other model approaches considering a variety of metrics common in evaluating classification problems.
Table 2
Comparison of model evaluations. Area Under the Receiver Operating Characteristic Curve (ROC AUC) is a general measure of model performance. Average Precision represents a classification models’ ability to return only relevant instances, while Recall represents the ability to identify such relevant instances. F1 Score is the harmonic mean of Precision and Recall
| Model | Accuracy | ROC AUC | Average Precision | Recall | F1 Score |
| METIC | 93.4% | 0.80 | 0.0087 | 0.20 | 0.020 |
| OvR Ridge Classifier + Over Sampling | 96.1% | 0.52 | 0.0024 | 0.07 | 0.008 |
| OvR Logistic Regression + Over Sampling | 99.3% | 0.50 | 0.0025 | 0.00 | 0.002 |
| Extra Trees Classifier + Over Sampling | 99.8% | 0.50 | 0.0032 | 0.00 | 0.000 |
| No Injuries | 99.8% | 0.50 | 0.0022 | 0.00 | 0.000 |
| OvR Gaussian NB | 99.8% | 0.50 | 0.0022 | 0.00 | 0.000 |
| Lasso | 99.8% | 0.50 | 0.0022 | 0.00 | 0.000 |
| OvR Ridge Classifier | 99.8% | 0.50 | 0.0022 | 0.00 | 0.000 |
| OvR XGBoost + Over Sampling | 99.7% | 0.49 | 0.0037 | 0.00 | 0.000 |
| Extra Trees Classifier | 99.8% | 0.49 | 0.0037 | 0.00 | 0.000 |
| OvR XGBoost | 99.8% | 0.48 | 0.0022 | 0.00 | 0.000 |
| Random Forest Classifier | 99.8% | 0.48 | 0.0032 | 0.00 | 0.000 |
| OvR Logistic Regression | 99.8% | 0.45 | 0.0019 | 0.00 | 0.000 |
| OvR Bernoulli NB + Over Sampling | 81.9% | 0.45 | 0.0019 | 0.12 | 0.003 |
| OvR Bernoulli NB | 79.6% | 0.39 | 0.0017 | 0.10 | 0.002 |
Table 3
Summary statistics of model performance by type of injury for validation data
| Body Area | Injury Incidents | Accuracy | Average Precision | ROC AUC | Recall | F1 Score |
| Back | 60 | 99.5% | 0.0079 | 0.87 | 0.05 | 0.030 |
| Foot | 50 | 94.1% | 0.0048 | 0.85 | 0.26 | 0.012 |
| Muscle | 94 | 99.7% | 0.0248 | 0.83 | 0.02 | 0.041 |
| Ligament | 141 | 99.4% | 0.0136 | 0.82 | 0.02 | 0.029 |
| Contusion | 53 | 98.0% | 0.0046 | 0.81 | 0.08 | 0.011 |
| Core | 15 | 98.9% | 0.0019 | 0.77 | 0.13 | 0.010 |
| Upper Body | 106 | 85.9% | 0.0062 | 0.74 | 0.36 | 0.015 |
| Contact | 111 | 72.1% | 0.0059 | 0.74 | 0.66 | 0.014 |
A common way to evaluate the success of a classifier is accuracy. However, accuracy does not give meaningful results when dealing with skewed data where the classes are unbalanced and a good accuracy score can be reached by simply guessing the majority class.
A major challenge in sports-injury analytics is building classifiers which can tolerate the significant imbalances skewing the data. The No Injury model achieves an extremely high accuracy of 99.8% because of the momentous imbalance of games with injuries versus games without injury, and yet this model is completely useless. This illustrates how accuracy is not a good metric to consider within sports-injury analysis. Peterson et al. (2019) reported an accuracy of 98% using an NB model, but it was not clear if the model presented achieved better performance than a trivial No Injury solution. Performance metrics which are more appropriate than accuracy for evaluating injury prediction model performance include the area under the receiver operating curve (ROC AUC) and average precision.
METIC performs significantly better than the other examined approaches in terms of ROC AUC, average precision, recall, and F1 score. The relatively low precision and high recall are prevalent in imbalanced problems where the negative class is the majority. METIC has an F1 score of more than double the next closest model.
3.2Model evaluation
This section provides an in-depth examination of METICS predictive performance by injury type.
Contact injuries are commonly thought of as being completely unpredictable, which explains why METIC struggles to accurately predict contact injuries.
Back and foot injuries may be chronic as often as they are acute, making the load monitoring dynamic especially interesting. While some univariate modifiable risk factors exist for injuries such as hamstring strain and biomechanical analyses of ankle and knee injuries contribute to reduction efforts, here we highlight the multifactorial and complex dynamics approach to management and treatment (Opar et al. 2014; Bourne et al. 2017; Liporaci et al. 2019; Toohey et al. 2017; Toohey et al. 2019; Bisciotti et al. 2020; Panagiotakis et al. 2017).
3.3Model explainability
Model explainability is examined using a proxy dataset which reduces the feature space to consider a more easily interpretable feature space. Series within the full dataset are aggregated using counts, maximums, and minimums as shown in Table 1. Shapely model impacts are calculated using the SHAP kernel explainer (Lundberg & Lee 2017; Lundberg et al. 2019). The Shapely values represent feature importance for particular data points considering perturbations around the data. While many studies in the literature isolate one factor and remark upon simple statistical significance (Okoroha et al. 2017; Hulme & Finch 2015; Bolling et al. 2018), this study considers multiple interactive factors and provides a hierarchy of importance.
While our results corroborate the literature in showing previous injuries to be important factors for predicting future injuries of any type (Toohey et al. 2017; Bolling et al. 2018; Toohey et al. 2019), they are not in the top-five factors found by our model for any type of injuries examined here. Older athletes incurred more injuries in our dataset, and this information should be combined with other factors examined here to better manage athletes further into their careers (Menard & Stanish 1989; Baumert et al. 2016).
Interestingly, the number of contusion injuries was found to be important for many of the injury types such as upper body and muscle injuries. We speculate that athletes who are carrying minor injuries could be prone to incurring more significant ones, whether as represented by accumulated fatigue, altered movement patterns, or other factors. However, further researching what factors may predispose a player to suffer a contusion may help shed some light into this finding.
The risk factors associated with age, game location, height, and weight are relatively low, while METIC found these factors to be highly important in determining injury risk among all injury types. These features alone may offer little insight into injury risk classification. However, we can conclude that age, game location, height, and weight are important in METIC’s feature learning process where learned features build upon these data points to classify injuries. The discrepancy among METIC feature importance and relative risk factors highlight the non-linear complex relationship among athlete data points and injuries.
4Discussion and conclusion
In this paper we presented a new deep learning model, METIC, to predict injury classification considering past injuries and game activity. This model achieves a new state of the art in injury prediction and provides useful insights into the non-linear relationships among player activity and history. Crucially, it utilizes passive aggregation of information without requiring manual daily data extraction related to athlete monitoring practices. While proprietary biometric data could improve model generalizability, effective forecasting using readily available data is of great value to sporting organizations. Analyses where disparate data types are combined to inform athlete management processes can provide a competitive advantage.
This longitudinal analysis considered multiple teams over multiple seasons, where based on the features provided, injury risk probabilities for different body parts were highlighted. This information can aid practitioners and performance staff to prioritize training interventions that may help minimize injury risk by optimizing factors associated with the specific body part and/or injury mechanism.
Statistical models have created much debate without valid utility, while machine learning approaches often excite with their complexity while failing to produce coherent results, or at least results absent of excessive misclassifications (Lakens 2020; Casals & Finch 2017). The overall performance of METIC at classifying injury risk illustrates the utility and potential of deep learning applications within sports science. Identification of non-linear and multifactorial classifiers of injury risk are of great use to athletes and sporting organizations. One important use of complex modeling is that single factors which are not significant on their own are subsequently meaningful in combination with one another. METIC is able to capture complex non-linear relationships among multiple athlete data points using representational learning which leads to a robust generalization of sports injuries.
It is important to highlight that much of the research done in the field of injury prediction failed to split the data for model training and validation purposes. As part of our approach, the data was divided into training and validation, and reported evaluation metrics on the validation set. Additionally, we present evaluation metrics appropriate for imbalance classification. This approach helps to ensure the generalizability of the presented algorithm. Organizations wishing to increase the injury forecasting potential could integrate other biometric data along with the features presented in this paper. Future work could consider integrating biomechanical data leveraging current data sources such as optical tracking to capitalize on the influx of newly available video data streams in the sports science world.
Athletes and sporting organizations can utilize the METIC model with their own data to stratify injury risk and inform athlete management decisions to mitigate injury incidence and ultimately improve performance. METIC presents a new approach to combining disparate data sources which learns multi-factorial importance across a variety of athletic monitoring fields. Teams capable of intelligently harnessing their many data sources could gain a significant competitive advantage.
References
1 | Adetiba, E. et al. (2017) Automated detection of heart defects in athletes based on electrocardiography and artificial neural network, Cogent Engineering, 4: (1), 1411220. |
2 | Anon (2020) , Pro Sports Transactions. Available at: http://www.prosportstransactions.com/ [Accessed 2020]. |
3 | Baumert, P. et al. (2016) , Genetic variation and exercise-induced muscle damage: implications for athletic performance, injury and ageing, European Journal of. Available at: https://link.springer.com/article/10.1007/s00421-016-3411-1. |
4 | Bengio, Y , Courville, A , & Vincent, P. (2013) , Representationlearning: a review and new perspectives, IEEE Transactions onPattern Analysis and Machine Intelligence 35: (8), 1798–1828. |
5 | Bisciotti, G.N. et al. (2020) , Hamstring Injuries Prevention in Soccer: A Narrative Review of Current Literature, Joints, (EFirst). Available at: https://www.thieme-connect.com/products/ejournals/abstract/10.1055/s-0040-1712113 [Accessed October 18, 2020]. |
6 | Bittencourt, N.F.N , & Meeuwisse, W.H. (2016) , Complex systems approach for sports injuries: moving from risk factor identification to injury pattern recognition—narrative review and new concept, British Journal of Sports Medicine. Available at: https://bjsm.bmj.com/content/50/21/1309.short. |
7 | Bolling, C. et al. (2018) , Context matters: revisiting the first step of the “sequence of prevention” of sports injuries, Sports Medicine. Available at: https://link.springer.com/article/10.1007/s40279-018-0953-x. |
8 | Bourne, M. et al. (2017) , An Evidence-Based Framework for Strengthening Exercises to Prevent Hamstring Injury, Sports Medicine 48: (3). |
9 | Brown, T.B. et al. (2020) , Language Models are Few-Shot Learners, arXiv [cs.CL]. Available at: http://arxiv.org/abs/2005.14165. |
10 | Buchheit, M. (2017) , Houston, We Still Have a Problem, International Journal of Sports Physiology and Performance 12: (8), 1111–1114. |
11 | Buchheit, M. et al. (2019) , Injury rate and prevention in elitefootball: Let us first search within our own hearts, British Journal of Sports Medicine 53: (21), 1327–1328. |
12 | Casals, M , & Finch, C.F. (2017) , Sports Biostatistician: a critical member of all sports science and medicine teams for injury prevention, Injury Prevention: Journal of the International Society for Child and Adolescent Injury Prevention. Available at: https://injuryprevention.bmj.com/content/23/6/423.short. |
13 | Cerner, HeathEAthlete. Available at: https://healtheathlete.cerner.com/ [Accessed 2020]. |
14 | Chen, T , & Guestrin, C. (2016) , XGBoost: A Scalable Tree Boosting System. In Proceedings of the 22nd ACM SIGKDD International Conference on Knowledge Discovery and Data Mining. KDD ’16. New York, NY, USA: Association for Computing Machinery, pp. 785-794. |
15 | Claudino, J.G. et al. (2019) , Current Approaches to the Use ofArtificial Intelligence for Injury Risk Assessment and PerformancePrediction in Team Sports: a Systematic Review, Sports Medicine- Open 5: (1), 28. |
16 | Conte, S , Camp, C.L , & Dines, J.S. (2016) , Injury Trends in Major League Baseball Over 18 Seasons: 1998-2015, American Journal of Orthopedics 45: (3), 116–123. |
17 | Cook, C. (2016) , Predicting future physical injury in sports: it’s a complicated dynamic system. Available at: https://bjsm.bmj.com/content/50/22/1356.short. |
18 | Devlin, J. et al. (2018) , BERT: Pre-training of Deep Bidirectional Transformers for Language Understanding, arXiv [cs.CL]. Available at: http://arxiv.org/abs/1810.04805. |
19 | Dhar, V. (2017) , What Is the Role of Artificial Intelligence in Sports? Available at: https://www.liebertpub.com/doi/pdfplus/10.1089/big.2017.29022.vdb. |
20 | Eric Choi , Penn State University (2015) , Is it easier to get injured if you are tall? (NBA edition) *revised, SiOWfa15: Science in Our World: Certainty and Controversy. Available at: https://sites.psu.edu/siowfa15/2015/10/18/is-it-easier-to-get-injured-if-you-are-tall-nba-edition-revised/. |
21 | Fanchini, M. et al. (2020) , Exercise-Based Strategies to PreventMuscle Injury in Elite Footballers: A Systematic Review and BestEvidence Synthesis, Sports Medicine 50: (9), 1653–1666. |
22 | Fernandez, J. (2020) , Airball: Schedule & Travel Related Metrics in Basketball, Available at: https://github.com/josedv82/airball. |
23 | Fullagar, H.H.K , Harper, L.D , et al. (2019) , PractitionerPerceptions of Evidence-Based Practice in Elite Sport in the UnitedStates of America, Journal of Strength and ConditioningResearch / National Strength & Conditioning Association 33: (11), 2897–2904. |
24 | Fullagar, H.H.K , McCall, A , et al. (2019) , The Translation of SportScience Research to the Field: A Current Opinion and Overview on thePerceptions of Practitioners, Researchers and Coaches, SportsMedicine 49: (12), 1817–1824. |
25 | Fulton, J. et al. (2014) , Injury risk is altered by previous injury:a systematic review of the literature and presentation of causativeneuromuscular factors, International Journal of Sports PhysicalTherapy 9: (5), 583–595. |
26 | Ge, S. (2017) , Research on the factors of basketball injury in physical teaching based on artificial neural network, Revista De La Facultad De Ingenieria 32: (3), 415–422. |
27 | Google Machine Learning (2020) , Training and Test Sets: Splitting Data, Google Machine Learning Crash Course. Available at: https://developers.google.com/machine-learning/crash-course/training-and-test-sets/splitting-data [Accessed 2020]. |
28 | Hägglund, M , Waldén, M , & Ekstrand, J. (2016) , Injuryrecurrence is lower at the highest professional football level thanat national and amateur levels: does sports medicine and sportsphysiotherapy deliver? British Journal of Sports Medicine 50: (12), 751–758. |
29 | Hulme, A. et al. (2017) , Closing Pandora’s Box: adapting a systemsergonomics methodology for better understanding the ecologicalcomplexity underpinning the development and prevention ofrunning-related injury, Theoretical Issues in ErgonomicsScience 18: (4), 338–359. |
30 | Hulme, A. et al. (2019) , Towards a complex systems approach in sportsinjury research: simulating running-related injury development withagent-based modelling, British Journal of Sports Medicine 53: (9), 560–569. |
31 | Hulme, A , & Finch, C.F. (2015) , From monocausality to systems thinking: a complementary and alternative conceptual approach for better understanding the development and prevention of . . . , Injury Epidemiology. Available at: https://injepijournal.biomedcentral.com/articles/10.1186/s40621-015-0064-1. |
32 | Impellizzeri, F.M. et al. (2020) , Training Load and Its Role inInjury Prevention, Part I: Back to the Future, Journal ofAthletic Training 55: (9), 885–892. |
33 | Impellizzeri, F , Woodcock, S , Coutts, A , Fanchini, M , McCal, A , & Vigotsky, A (2020) , Acute to random workload ratio is “as” associated with injury as acute to actual chronic workload ratio: time to dismiss ACWR and its components, SportRxiv, (Preprint). |
34 | Jaspers, A. et al. (2018) , Relationships Between the External andInternal Training Load in Professional Soccer: What Can We Learn From Machine Learning? International Journal of Sports Physiology and Performance 13: (5), 625–630. |
35 | Kajdanowicz T , S.P. (2017) , Proceedings of the First International Workshop on Learning with Imbalanced Domains: Theory and Applications. In Proceedings of Machine Learning Research, pp. 22-35. |
36 | Kampakis, S. (2016) , Predictive modelling of football injuries, arXiv [stat.AP]. Available at: http://arxiv.org/abs/1609.07480. |
37 | Kazemi, S.M. et al. (2019) , Time2Vec: Learning a Vector Representation of Time, arXiv [cs.LG]. Available at: http://arxiv.org/abs/1907.05321. |
38 | Lakens, D. (2020) , Improving Your Statistical Questions, The 20% Statistician. Available at: https://daniellakens.blogspot.com/2019/10/improving-your-statistical-questions.html. |
39 | Lemaître, G , Nogueira, F , & Aridas, C.K. (2017) , Imbalanced-learn: A python toolbox to tackle the curse of imbalanced datasets in machine learning, Journal of Machine Learning Research: JMLR. Available at: https://dl.acm.org/doi/abs/10.5555/3122009.3122026. |
40 | Lewis, M. (2018) , It’s a Hard-Knock Life: Game Load, Fatigue, and Injury Risk in the National Basketball Association, Journal of Athletic Training. Available at: https://meridian.allenpress.com/jat/article-abstract/53/5/503/112788. |
41 | Liporaci, R.F , Saad, M , & Grossi, D.B. (2019) , Clinical features and isokinetic parameters in assessing injury risk in elite football players, International Journal of. Available at: https://www.researchgate.net/profile/Marcelo_Riberto/publication/336587698_Clinical_Features_and_isokinetic_Parameters_in_Assessing_Injury_Risk_in_elite_Football_Players/links/5dd54f0a458515cd48afbae4/Clinical-Features-and-isokinetic-Parameters-in-Assessing-Injury-Risk-in-elite-Football-Players.pdf. |
42 | Lundberg, S.M. et al. (2019) , Explainable AI for Trees: From Local Explanations to Global Understanding, arXiv [cs.LG]. Available at: http://arxiv.org/abs/1905.04610. |
43 | Lundberg, S.M , & Lee, S.-I. (2017) , A Unified Approach to Interpreting Model Predictions. In I. Guyon et al., eds, Advances in Neural Information Processing Systems 30. Curran Associates, Inc., pp. 4765-4774. |
44 | Menard, D , & Stanish, W.D. (1989) , The aging athlete, The American Journal of Sports Medicine 17: (2), 187–196. |
45 | Mooney, M. et al. (2017) , Who “owns” the injury or illness? Who“owns” performance? Applying systems thinking to integrate healthand performance in elite sport, British journal of sportsmedicine 51: (14), 1054–1055. |
46 | Okoroha, K.R. et al. (2017) , Amount of Minutes Played Does NotContribute to Anterior Cruciate Ligament Injury in NationalBasketball Association Athletes, Orthopedics 40: (4), e658–e662. |
47 | O’Malley, T. (2020) , Hyperparameter tuning with Keras Tuner. |
48 | O’Malley, T. et al. (2019) , Keras Tuner. |
49 | Opar, D. et al. (2014) , Eccentric Hamstring Strength and Hamstring Injury Risk In Australian Footballers, Medicine and Science in Sports and Exercise, 46. |
50 | Panagiotakis, E. et al. (2017) , Biomechanical analysis of ankleligamentous sprain injury cases from televised basketball games:Understanding when, how and why ligament failure occurs, Journal of Science and Medicine in Sport / Sports MedicineAustralia 20: (12), 1057–1061. |
51 | Pedregosa, F , Varoquaux, G , & Gramfort, A. (2011) , Scikit-learn: Machine learning in Python, the Journal of Machine. Available at: http://www.jmlr.org/papers/volume12/pedregosa11a/pedregosa11a.pdf. |
52 | Peterson, K.D , & Evans, L.C. (2019) , Decision Support System for Mitigating Athletic Injuries, International Journal of Computer Science in Sport 18: (1), 45–63. |
53 | Radford, A. et al. (2018) , Improving language understanding by generative pre-training, cs.ubc.ca. Available at: https://www.cs.ubc.ca/amuham01/LING530/papers/radford2018improving.pdf. |
54 | Rossi, A. et al. (2018) , Effective injury forecasting in soccer withGPS training data and machine learning, PloS one 13: (7), e0201264. |
55 | RStudio Team (2020) , RStudio: Integrated Development for R, Available at: http://www.rstudio.com/. |
56 | Ruddy, J.D. et al. (2019) , Modeling the Risk of Team Sport Injuries:A Narrative Review of Different Statistical Approaches, Frontiers in Physiology 10: , 829. |
57 | Schwellnus, M. et al. (2016) , How much is too much ? (Part 2) International Olympic Committee consensus statement on load in sport and risk of illness, British Journal of Sports Medicine, (Part 2), pp. 1043-1052. |
58 | Sechidis, K , Tsoumakas, G , & Vlahavas, I. (2011) , On the Stratification of Multi-label Data. In Machine Learning and Knowledge Discovery in Databases. Springer Berlin Heidelberg, pp. 145–158. |
59 | Soligard, T , Schwellnus, M , Alonso, J. M , Bahr, R , Clarsen, B , Dijkstra, H. P , Gleeson, M , Hagglund, M , Hutchinson, M , Rensburg, C , Khan, K , Meeuson, R , Orchard, J , Pluim, B , Raftery, M. , & Budgett, R. (2016) , How much is too much? (Part 1) International Olympic Committee consensus statement on load in sport and risk of injury, British Journal of Sports Medicine, (50), 1030-1041. |
60 | Stern, B.D , Hegedus, E.J , & Lai, Y.-C. (2020) , Injury prediction as a non-linear system, Physical therapy in sport: official journal of the Association of Chartered Physiotherapists in Sports Medicine 41: , 43–48. |
61 | Stotts, J. (2014) , Tall Players Like Joel Embiid Are More Prone to Injury, Five Thirty Eight. Available at: https://fivethirtyeight.com/features/tall-players-like-joel-embiid-are-more-prone-to-injury/. |
62 | Szymański, P , & Kajdanowicz, T. (2017) , A Network Perspective on Stratification of Multi-Label Data. In L. Torgo et al., eds. Proceedings of Machine Learning Research. ECML-PKDD, Skopje, Macedonia: PMLR, pp. 22-35. |
63 | Terry, A.C , Thelen, M.D , & Crowell, M. (2018) , The musculoskeletal readiness screening tool-athlete concern for injury & prior injury associated with future injury, International Journal of. Available at: https://www.ncbi.nlm.nih.gov/pmc/articles/PMC6088131/. |
64 | The NBA, NBA Stats R Studio Interface. Available at: http://asbcllc.com/nbastatR/ [Accessed 2020]. |
65 | Toohey, L.A. et al. (2019) , Comparison of subsequent injurycategorisation (SIC) models and their application in a sportingpopulation, Injury Epidemiology 6: (1), 9. |
66 | Toohey, L.A. et al. (2017) , Is subsequent lower limb injuryassociated with previous injury? A systematic review andmeta-analysis, British Journal of Sports Medicine 51: (23), 1670–1678. |
67 | Vallance, E. et al. (2020) , Combining Internal- andExternal-Training-Loads to Predict Non-Contact Injuries in Soccer, NATO Advanced Science Institutes series E: Applied sciences 10: (15), 5261. |
68 | Vaswani, A. et al. (2017) , Attention Is All You Need, arXiv [cs.CL]. Available at: http://arxiv.org/abs/1706.03762. |
69 | Xu, Y , & Goodacre, R. (2018) , On Splitting Training and Validation Set: A Comparative Study of Cross-Validation, Bootstrap and Systematic Sampling for Estimating the Generalization Performance ofSupervised Learning, Journal of Analysisand Testing 2: (3), 249–262. Available at: http://dx.doi.org/10.1007/s41664-018-0068-2. |
70 | Zheng, A , & Casari, A. (2018) , Feature Engineering for Machine Learning: Principles and Techniques for Data Scientists, “O’Reilly Media, Inc.” |


