
A weakly supervised learning method based on attention fusion for Covid-19 segmentation in CT images
Abstract
Since the end of 2019, the COVID-19, which has swept across the world, has caused serious impacts on public health and economy. Although Reverse Transcription-Polymerase Chain Reaction (RT-PCR) is the gold standard for clinical diagnosis, it is very time-consuming and labor-intensive. At the same time, more and more people have doubted the sensitivity of RT-PCR. Therefore, Computed Tomography (CT) images are used as a substitute for RT-PCR. Powered by the research of the field of artificial intelligence, deep learning, which is a branch of machine learning, has made a great success on medical image segmentation. However, general full supervision methods require pixel-level point-by-point annotations, which is very costly. In this paper, we put forward an image segmentation method based on weakly supervised learning for CT images of COVID-19, which can effectively segment the lung infection area and doesn’t require pixel-level labels. Our method is contrasted with another four weakly supervised learning methods in recent years, and the results have been significantly improved.
1Introduction
In December 2019, an acute infectious respiratory illness broke out in Wuhan, China. The new coronavirus, named COVID-19 by the World Health Organization (WHO), is believed to be the cause of the outbreak of the disease. In symptomatic patients, the clinical manifestations of the disease usually start after less than a week, consisting of fever, cough, nasal congestion, fatigue and other signs of upper respiratory tract infections [1]. COVID-19 infection is a viral infection so that the clinical symptoms are generally accompanied with fatigue. The COVID-19 could be also accompanied with other symptoms, such as dizziness, sore throat and other symptoms. In January 2020, the World Health Organization (WHO) announced that COVID-19 has become a Public Health Emergency of International Concern. The COVID-19 has spread all over the world, causing serious losses to countries around the world. As of August 8, 2020, WHO has reported a total of 19,187,943 confirmed cases and 716,075 death worldwide. Although the epidemic in China has been controlled, the overall number of confirmed cases in the world is still increasing rapidly. Regrettably, there are still no effective treatment measures.
Reverse transcription polymerase chain reaction (RT-PCR) is considered to be the standard method for diagnosing COVID-19. However, it takes a long time and has a high false negative rate, which makes the detection efficiency low [2]. In recent years, medical imaging technology has become a common method for diagnosis and quantitative assessment of various diseases [1, 3]. Especially computer tomography (CT), which can show lung consolidation and ground glass shadows, has become an important auxiliary tool for detecting new coronary pneumonia [4]. Studies have shown that chest CT images are more sensitive to COVID-19 than RT-PCR [5, 6]. However, the evaluation of medical images is a manual, tedious and time-consuming process, which is also affected by the experience of radiologists [7]. Therefore, it is very important to construct a scheme that can automatically segment the lung lesions.
Lately, with the rise of deep learning, artificial intelligence has developed rapidly. As a popular method in AI field, deep learning has been widely adopted in medical image segmentation, such as brain [8, 9], lung [10], and pancreas [11]. Recently, some technologies that can automatically segment the infected area from COVID-19 CT images have been published [12, 13]. U-Net [14] is the most widely used network structure in medical image segmentation. It has a codec structure and can make full use of low-level and high-level features. After U-Net was proposed, improvements based on U-Net were successively proposed [15–17]. However, we consider that these methods cannot be directly applied to datasets of COVID-19. On one hand, the sample size of the public COVID-19 dataset is very small. As we all know that too few samples and too many parameters will lead to overfitting, which makes the generalization ability of the model very poor. On the other hand, the fully supervised method that requires pixel-level annotations marked by experienced doctors is too costly to be a realistic solution for COVID-19.
Our work bases on the above analysis. Considering the high cost of pixel-level labeling, we adopt a method based on the datasets with weak labels to generate pseudo segmentation masks to train our segmentation network. In our method, only image-level labeling information (that is, whether the infected area exists) and a little saliency supervision information are required. Class Activation Maps (CAM) [18] is a technique that has been widely used in research related to weak supervision in recent years and is used to generate attention maps. Jiang et al. [19] proposed a module called OAA, which improved the CAM with attention accumulation, making the attention map generated by the model more complete. Our method is inspired by this, but uses a different aggregation method. At the same time, we used the method of Liu et al. [20] to generate a saliency map to extract background cues. Pseudo segmentation masks come from the combination of attention map and saliency map. Besides, because our dataset is small, building a lightweight segmentation model is our goal. However, if only deep separable convolution [21] or Ghost Module [22] are used, although the number of parameters can be greatly reduced, it will affect the segmentation quality [21, 23]. In order to reduce this influence, we propose MDPPM (Modified Dilated Pyramid Pooling Module) and FE (Features Extraction) Block, which make full use of context information in a multi-scale manner. At the same time, we introduced an attention mechanism in the encoder module. In addition, we have introduced non-linear factors at the connection between the encoder and the decoder to make the most of the features extracted by the encoder.
In summary, the contributions of our work are as follows:
• We propose a weakly supervised learning segmentation method based on attention fusion.
• We adopt the MDPPM and FE block in the segmentation network, which can effectively integrate contextual information.
• By adopting depthwise separable convolution, our segmentation network is light enough. At the same time, the attention mechanism is used to improve efficiency.
• Our Residual Connection can alleviate the gap between the feature maps generated by the encoder and the decoder by introducing non-linear operations, and make better use of the features generated by the encoder.
The rest of the paper is organized as follows. Section 2 describes some works relate to weakly supervised learning and semantic segmentation. The method our proposed is present in Section 3. We show the dataset and experiment results in Section 4. And Section 5 is a conclusion.
2Related work
2.1Semantic segmentation for medical images
Because the convolutional neural network will lose the image details during the convolution operation and pooling operation, the previous model cannot point out the specific contour of the target, and thus cannot complete the accurate segmentation. Fully Convolutional Networks (FCN) [24] replaced the fully connected layer with a convolutional layer, and merged multiple layers of features to achieve good segmentation results. Therefore, FCN has become the basic framework of semantic segmentation. U-Net [14] is a very widely used model in the field of medical image segmentation. The idea of U-Net is similar to FCN, which is also the encoder-decoder structure, the difference of the two is that U-Net uses the method of concatenation features instead of direct addition. Çiçek et al. [15] replaced the 2D convolution operation in U-Net with a 3D convolution operation, which can process 3D medical images more effectively. U-Net++ [16] integrates U-Net of different sizes into one network. In [25], Xiao et al. replaced each sub-module of U-Net with a module with residual link and applied it to retinal image segmentation. In [17], Ibtehaz et al. proposed the MultiRes module, and conjecture that there may be a semantic gap between the feature of the encoder and decoder. [26] adopts the attention mechanism into U-Net, which reduces the weight of the background area, thereby improving the segmentation accuracy. At present, there have been some work aimed at COVID-19 lung infection, such as [27–29]. Unfortunately, these methods require full supervision, and the cost is much higher than weak supervision.
2.2Weakly supervised semantic segmentation
In weakly supervised semantic segmentation, there are several common weak labels such as bounding boxes [30], scribbles [31, 32], points [33], and image-level labels [34–37]. Among them, image-level tags are the simplest supervision and are very easy to obtain. Although weakly supervised learning has made great progress in the research of semantic segmentation of natural images, there are relatively few related works in the research of medical images. Afshari et al. [38] used bounding boxes and a new loss function to implement an end-to-end network for head and neck tumor segmentation. Wu et al. [39] used the classification network to generate Class Activation Maps (CAMs) with attention mechanism, and used this as a supervised signal to learn a representation model to segment brain lesion. Recently, Laradji et al. [40] used point-level supervision to segment the COVID-19 lung infection area and proposed a consistency-based loss function.
3Methodology
In this section, we describe our solution and explain how each stage works.
3.1Generating pseudo segmentation labels
CAM [18] is a visualization technique that allows us to observe which area of the picture the neural network pays more attention. In our scheme, we use CAMs to obtain foreground cues. In order to obtain attention maps by CAM, it is generally necessary to train a classification network in which a fully connected layer is replaced with a global average pooling (GAP). Given an image, the CAM of the target region can be computed by:
(1)
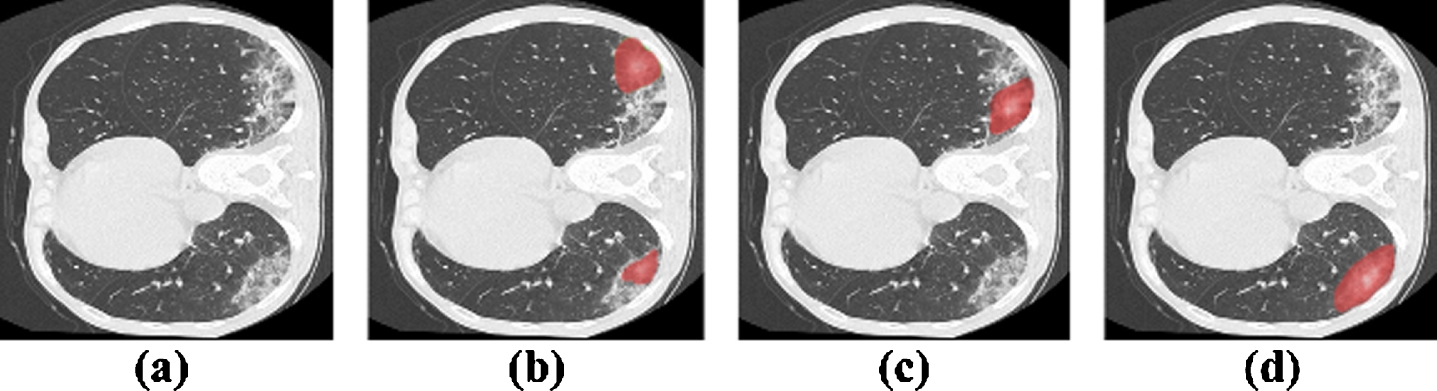
Since the attention map generated by the classification network continues to focus on different positions of the target during the training process and the regions are even often complementary [19], we consider gathering the attention maps of various stages to obtain a more complete target area. Figure 1 shows this phenomenon. For the cumulative attention map Mt generated in the t-th epoch, it is calculated as:
(2)
where CF represents CAM fusion, and Ct represents the CAM extracted from the network in the t-th epoch. In the work of Jiang et al. [19], the fusion operation adopts the element-wise maximum operation. However, for our task, the segmentation target sometimes only occupies a small part of the entire image, and the use of element-wise maximum operation is likely to cause the target range to be too large. Therefore, we adopted another simple fusion strategy, the average fusion strategy of adjacent epochs. It takes the average of the attention map Ct and the current cumulative attention map Mt - 1, and the formula is as follows:
(3)
Fig. 1
Observation of attention maps. (a) Source images; (b-d) Intermediate attention maps produced by a classification network at different training stages. In order to show the demonstration effect, we removed the pixels with lower values. However, in practical experiment, these pixels are considered.
We believe that such an operation can obtain a suitable target range, which will not be too large or concentrated within the target region. However, the CAM obtained at this time is still very noisy, which makes it difficult for us to choose a suitable threshold to obtain the foreground (that is, the infected area) cues we need. To solve this problem, we consider introducing a spatial attention mechanism into the classification network.
The feature map from the last convolution layer before GAP
(4)
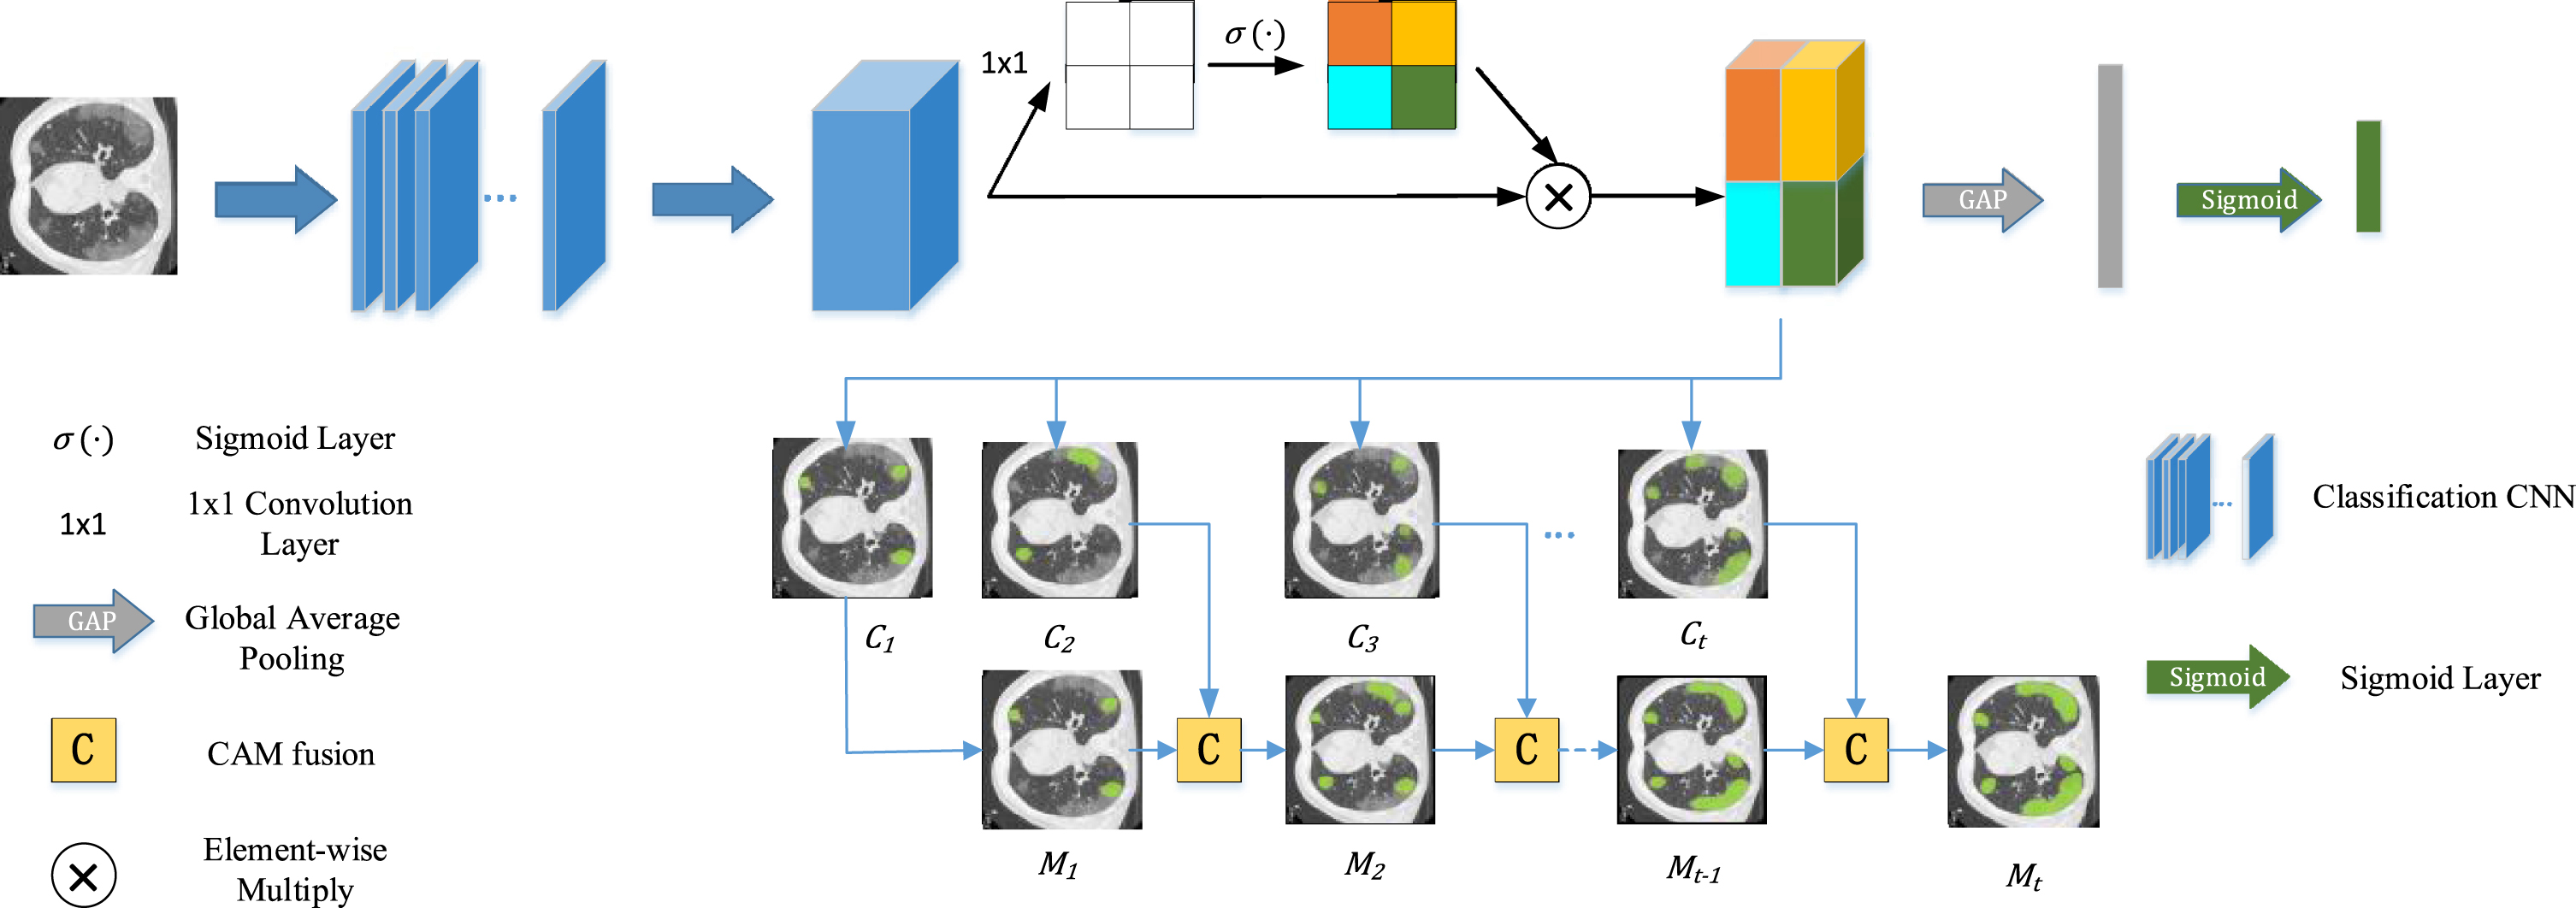
where σ (pi,j) represents the importance of the position (i, j) relative to the overall feature map. Therefore, the feature map after the operation will highlight the more important parts in space, which is beneficial to obtain the infected area. Figure 2 shows the pipeline of the first stage.
To get segmentation mask, we adopt saliency detection technology from [20]. Specifically, we regard the region in the saliency map of which pixels are with enough low value as background. At last, the foreground cues (from the generated CAM) and the background cues (from saliency map) are merged to be a segmentation mask.
Fig. 2
The pipeline for getting more complete CAM which at the first stage of our work. We get class attention maps from the last convolution layer passed through a spatial attention mechanism. After that, the more complete CAM will be generated by a series of CAM fusion operation with training.
3.2Segmentation network
In this section, we introduce the proposed segmentation network and the composition of each module that contained in the second stage.
3.2.1The proposed network architecture
Our network is improved based on U-Net and consists of an encoder and a decoder. The encoder of the first four layers not only extracts features through Feature Extraction Block but also strengthens channels that are more important through Channel Attention Block (shown in Fig. 4). We complete down sampling through pooling, and add our proposed MDPPM Block to the fifth layer. MDPPM uses adaptive pooling and dilated convolution, which can combine the context of different regions to obtain multi-scale information. Then, the up-sampling information of each layer and the encoder information are projected to the label space gradually by the decoder through the skip connection combination, and finally the segmentation result is obtained. Besides, the block we adopt in the decoder and the fifth layer called ‘conv block’ is shown in Fig. 5, which consists of two depthwise separable convolutions. Before the feature map gets into decoder block, it is processed by an upsampling layer that followed by a pointwise convolution to shrink the number of channels. It is worth mentioning that, so as to diminish the number of parameters and computational complexity, most of the convolutions in the network are replaced with depthwise separated convolutions (Fig. 6). In order to alleviate the problem of precision degradation caused by depthwise separated convolutions [21, 23, 41], we adopt multi-scale learning in FE Block. In addition, unlike the standard U-Net, we have added a convolution operation to skip connection, which we call Residual Connection. On one hand, it can diminish the semantic difference between the encoder and decoder. On the other hand, adding non-linear factors will improve the accuracy of the model. The network architecture is displayed in Fig. 3.
Fig. 3
Architecture of the proposed segmentation network.
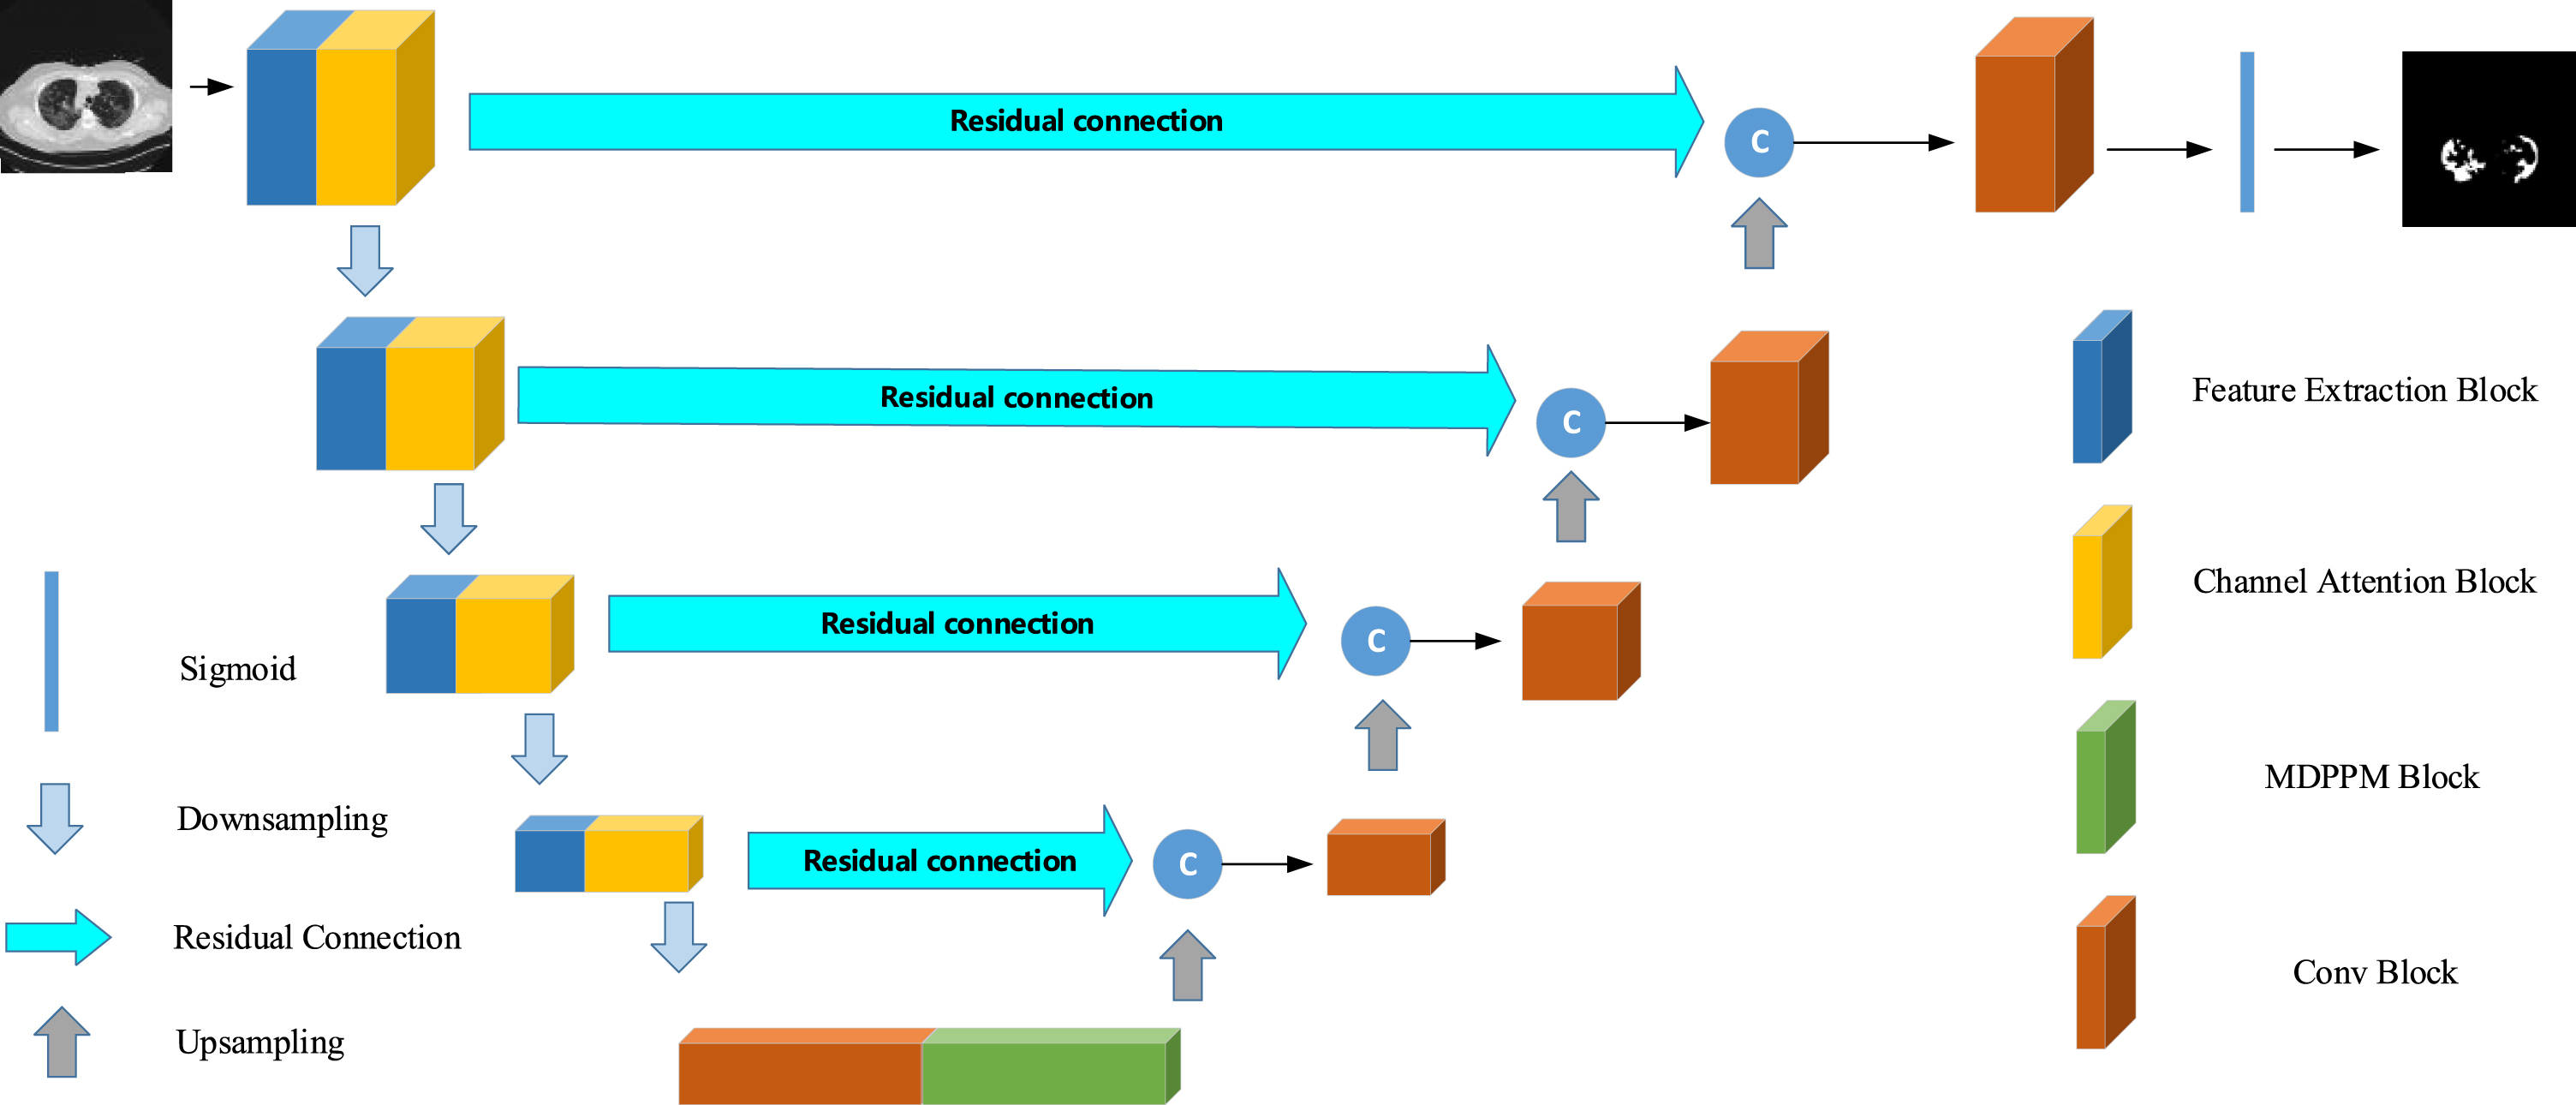
Fig. 4
Channel Attention Block in encoder. The block consists of a GAP and two fully connected layers of which activation functions are different. The size of input feature map is squeezed to 1×1×C by GAP layer. After that, the fully connected layer ahead makes the channels of feature shrink to reduce the numbers of parameters. Then, passing through the sigmoid layer, we get channel attention maps, which contain channel-wise weights. At last, the feature maps are reweighted via element-wise multiplication operation.
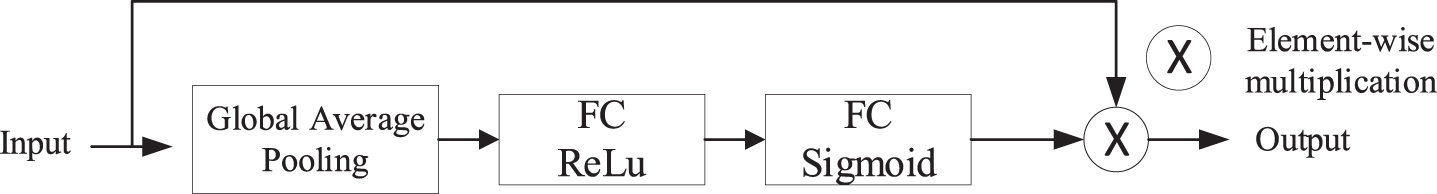
Fig. 5
The conv block contains two depthwise separable convolutions.
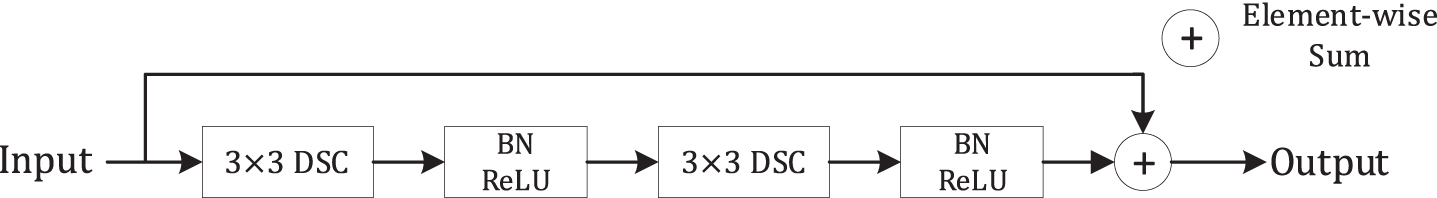
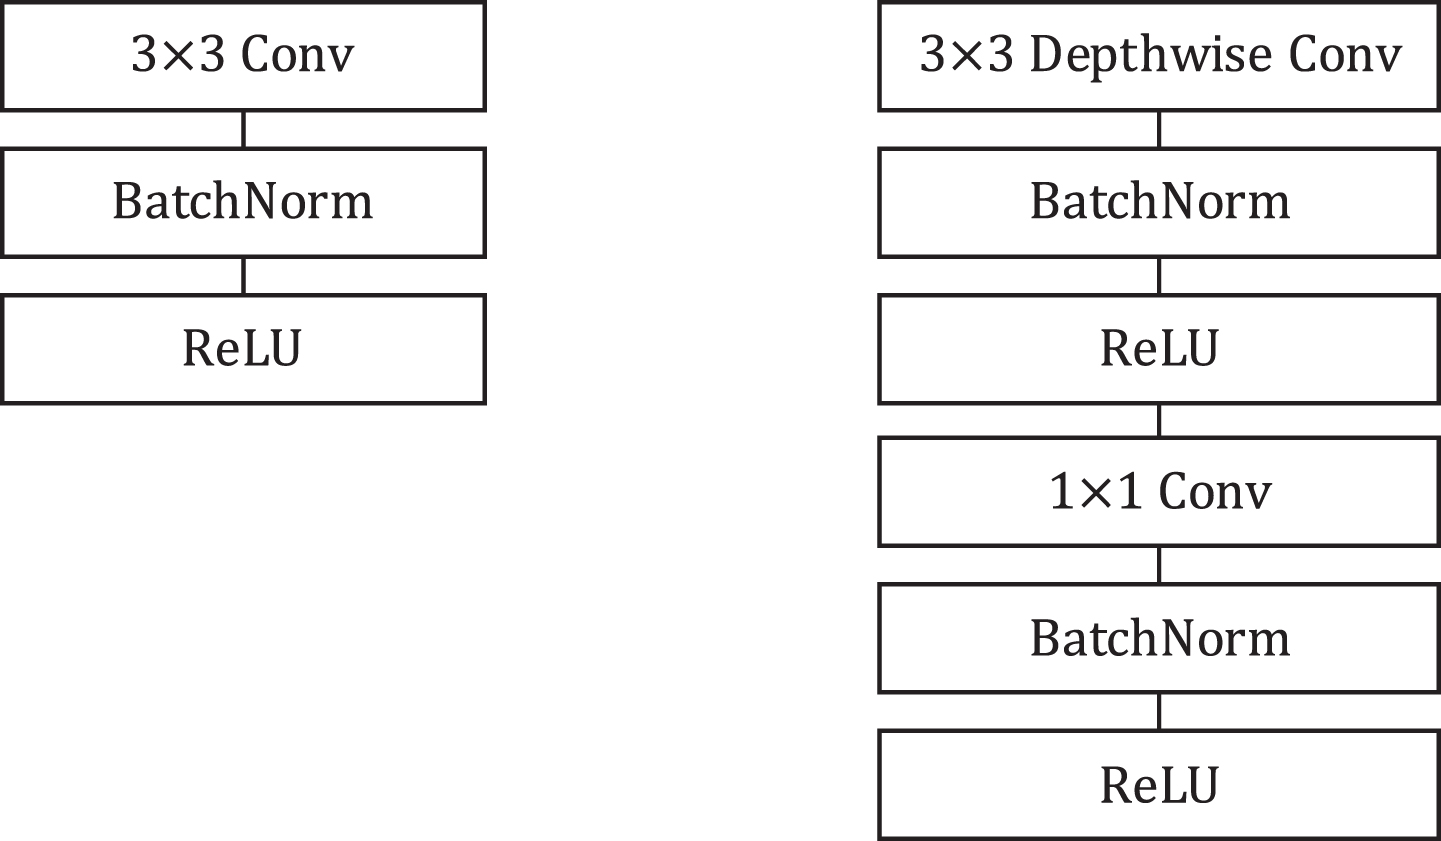
Fig. 6
Left: Standard convolution layer with Batch Normalization and ReLU activation function. Right: Depthwise separable convolution with batchnorm and ReLU which consists of depthwise convolution, pointwise convolution. Compared to the standard convolution, the use of depthwise separable convolution could obtain a diminution in computation of
3.2.2Feature extraction block
In order to introduce the model better, we define the basic operations at first. Suppose
(5)
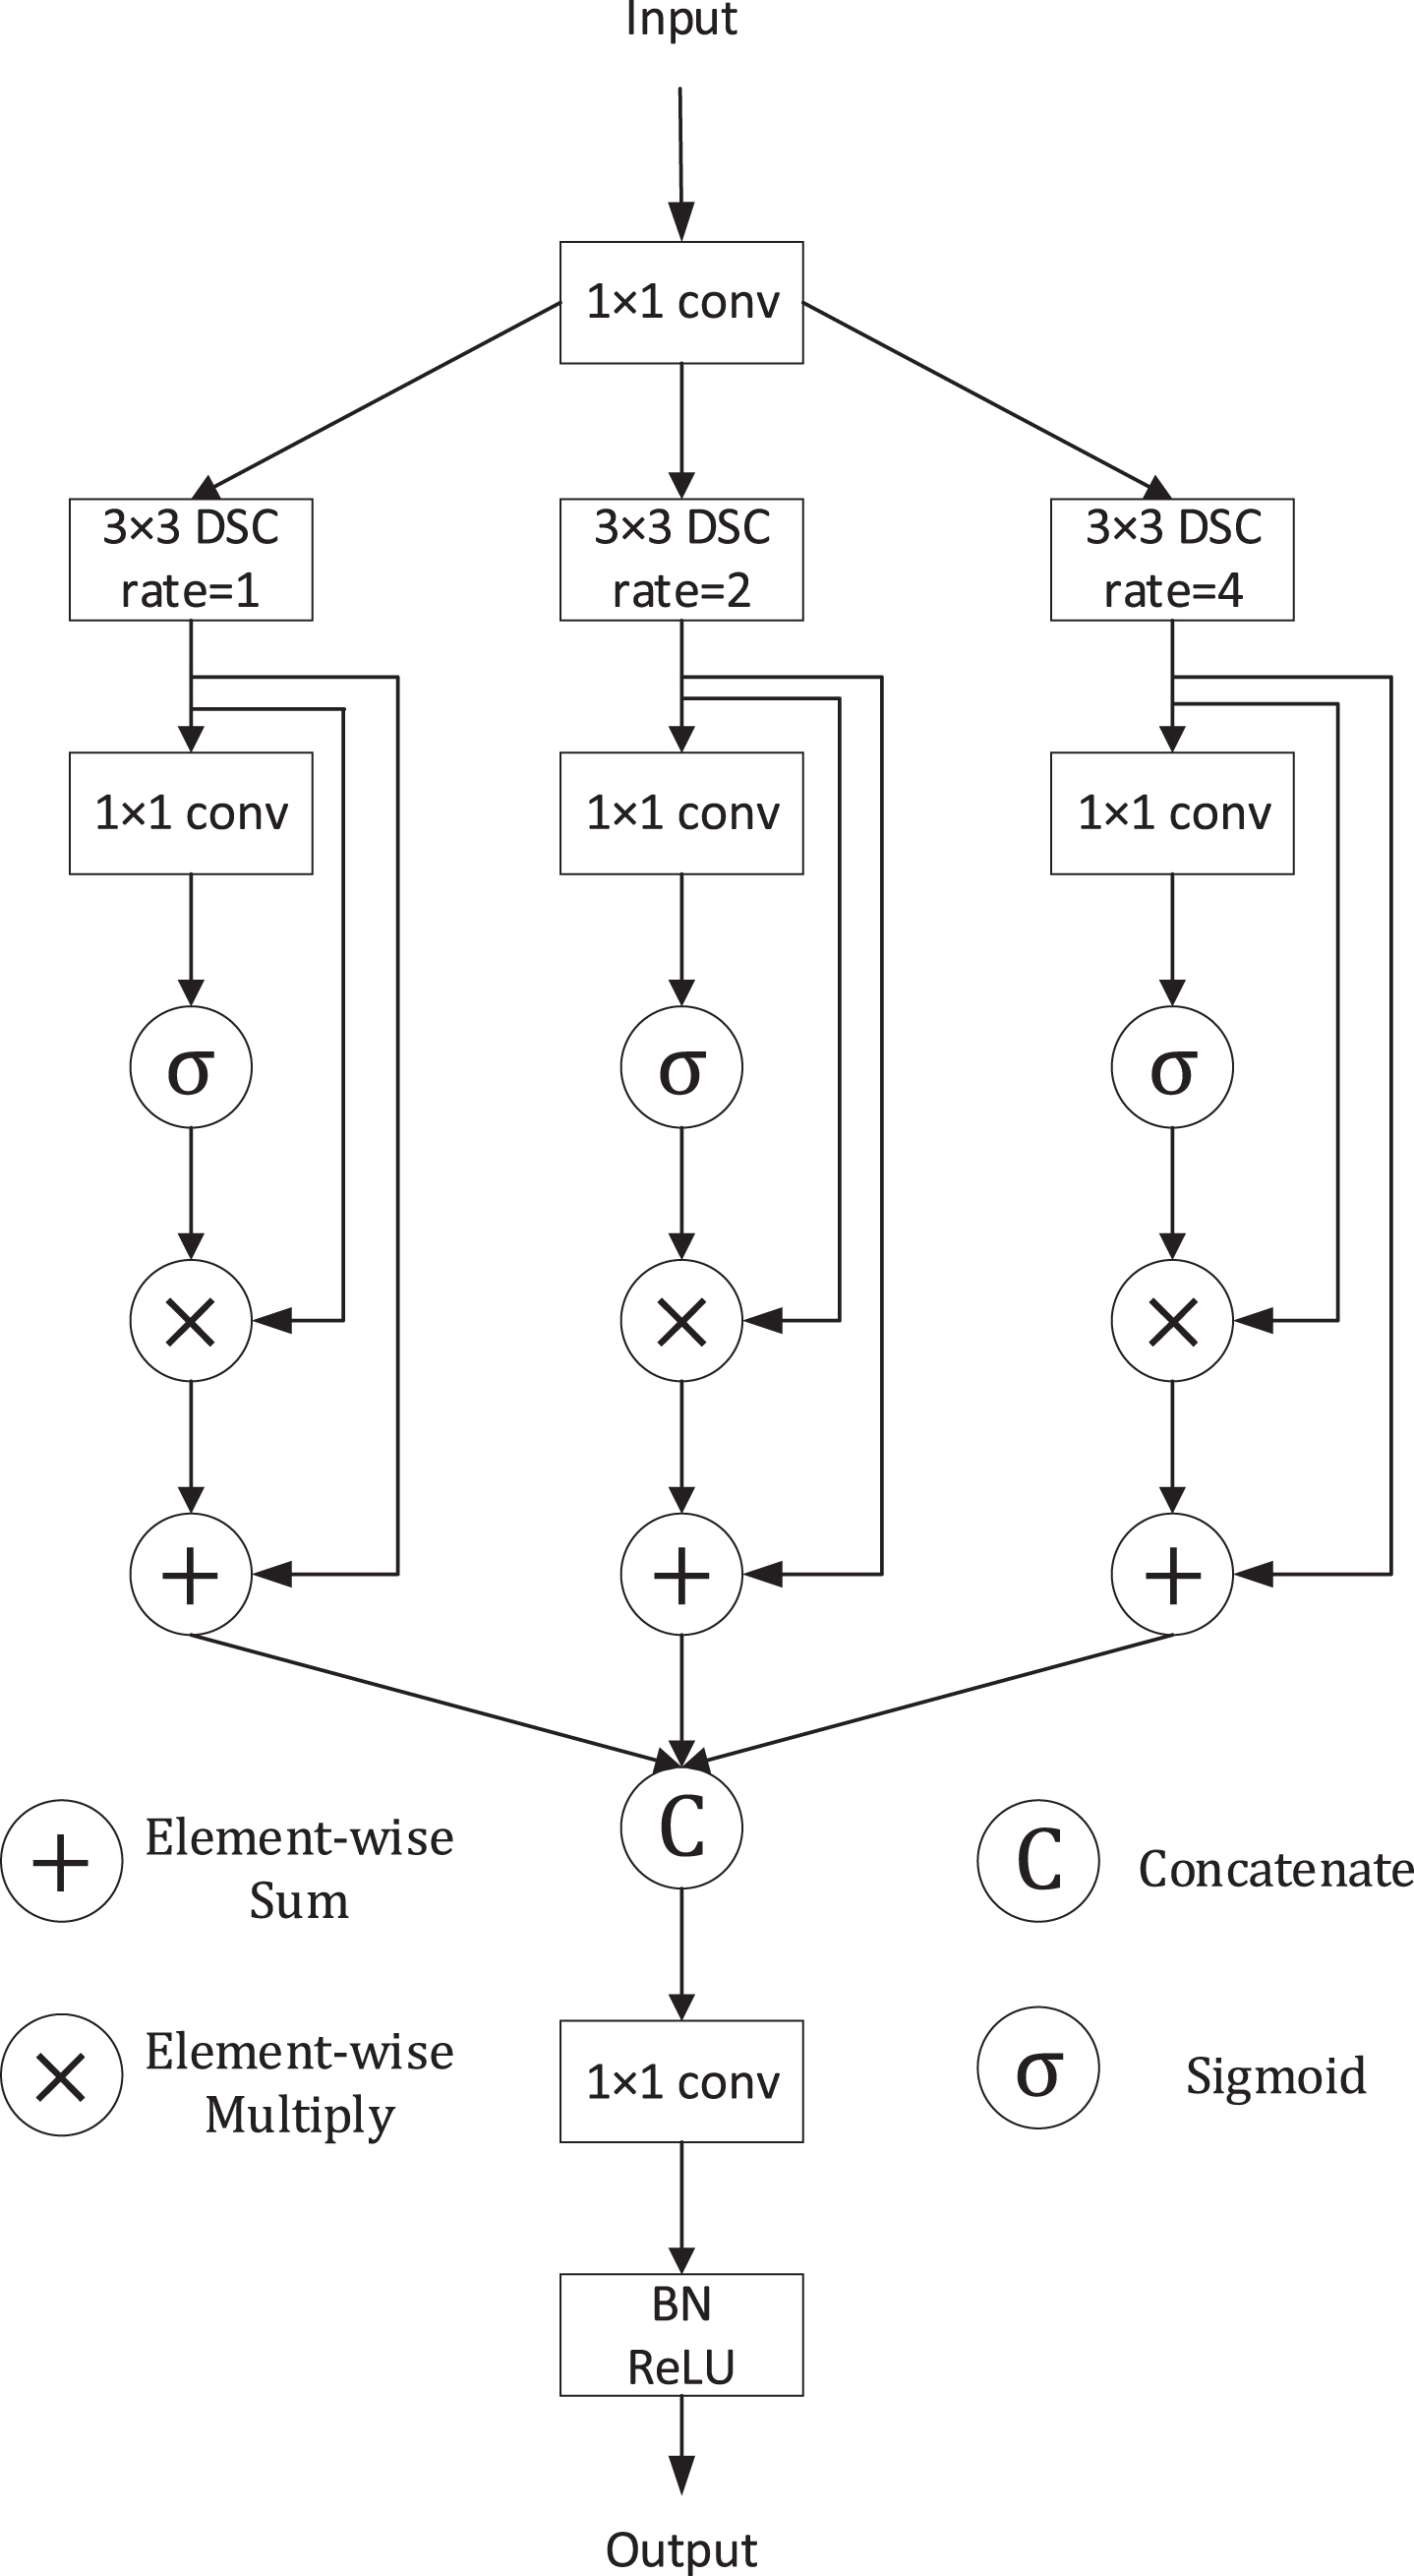
Then the feature map P is fed into three parallel branches, passing through a dilated DSC respectively:
(6)
Next, we adopted a spatial attention mechanism to enable the FE module to suppress useless information while emphasizing the more important information in space. The process can be written as:
(7)
where σ is sigmoid function, ⊗ is element-wise multiplication and Fbmak denotes the result of each branch. We get the attention map through a 1×1 convolution and sigmoid activation function. Then the feature map is recalibrated because of the generated attention map. Finally, we fuse the above feature map by concatenation and a 1×1 convolution as:
(8)
where BN (·) denotes batch normalization. The proposed FE Block is illustrated in Fig. 7.
Fig. 7
Illustration of the FE Block.
3.2.3Modified dilated pyramid pooling module
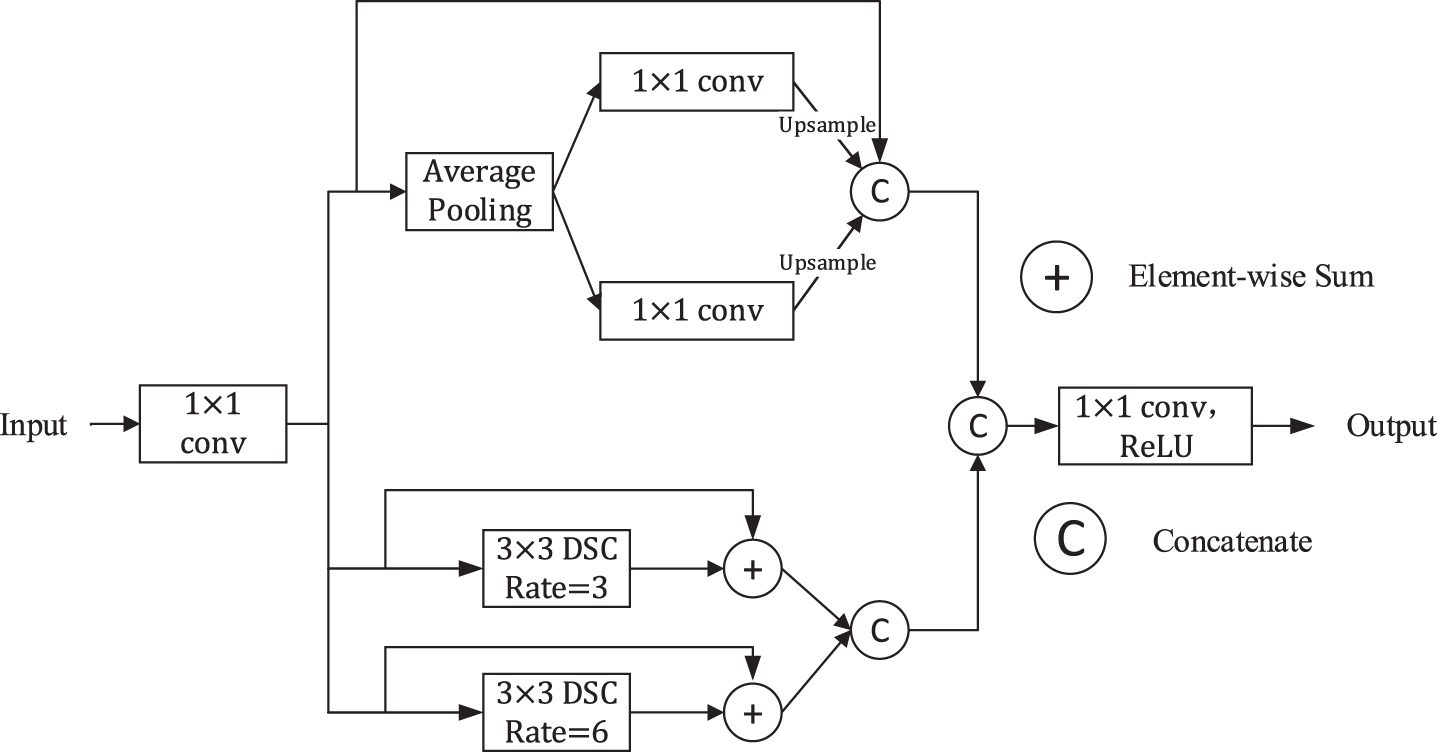
To diminish the loss of contextual information between different sub-regions while obtaining multi-scale information further, we propose Modified Dilated Pyramid Pooling Module (MDPPM) module of which the structure is illustrated in Fig. 8. We let
(9)
Note that, compared to the input feature map, the number of channels of Fmk decrease to C/4. Then, the generated feature Fm1 is processed by an average pooling layer, generating two feature maps named Fmp1 and Fmp2, the size of which are 1 × 1 × C/4 and 2 × 2 × C/4 respectively. After that, the two feature maps will pass through 1×1 convolution to halve the number of channels. And then, we upsample them to get the feature with the same size as Fm1 via bilinear interpolation. Next, different levels of features are concatenated. Finally, the result of the first branch
(10)
(11)
(12)
As for the other two branches, we adopt two dilated depthwise separable convolutions. The result of them
(13)
At last, the output of our proposed MDPPM Block M (X) is defined as:
(14)
Fig. 8
Illustration of the MDPPM Block.
3.2.4Residual connection
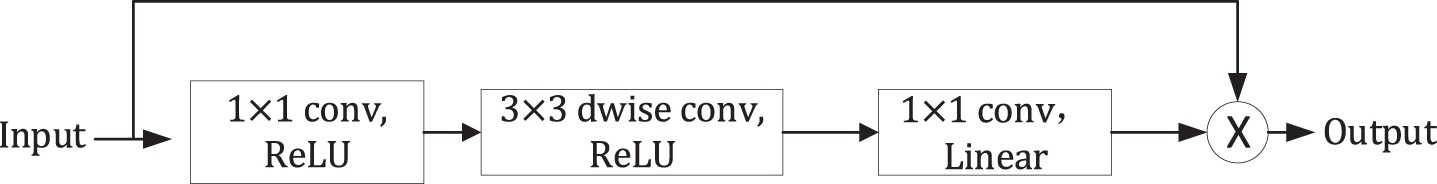
In the encoder-decoder structure, there may be a semantic gap between the features generated by the encoder and the features to be merged in skip connection since the features from encoder are considered as lower level feature, however, the features in decoder are supposed to be higher feature because they are computed at deeper layer [17]. Therefore, we incorporate some convolution layers because additional non-linear transformations may be able to alleviate the semantic gap. In other words, we adopt some non-linear transformations instead of only concatenating the feature maps compared to the standard U-Net. We call it ‘Residual Connection’, and the structure of the bottleneck block we used from MobileNet V2 [23] in the residual connection is shown in Fig. 9. From the structure, we can observe that the block consists of two pointwise convolutions and a depthwise convolution. Note that, the convolution at last is a linear convolution because ReLU function may cause information loss. Considering that the disparity of the deeper layer is likely to decrease gradually because they are processed and computed more, we use 4,3,2,1 bottleneck block from the top residual connection to the bottom respectively.
Fig. 9
Bottleneck block in Residual Connection.
3.3Loss function
In the research of medical image segmentation, Dice Score Coefficient (DSC) is widely used to measure the quality of segmentation as a measure of set similarity.
The optimal objective for a metric is the metric itself. Milletari et al. [42] proposed a loss function based on Dice coefficient. Dice Loss is formulated as follow:
(15)
pn is the probability that the predicted pixel n belongs to infection, gn is the ground truth that pixel n belongs to infection. However, when facing datasets with extremely imbalanced categories and small segmentation targets (such as part of the COVID-19 infection area), Dice Loss will lead to a lower recall rate. To solve this problem, Salehi et al. [43] proposed Tversky loss:
(16)
(17)
where p0n is the probability that the predicted pixel n belongs to infection area and p1n is the probability of pixel n be a non-infection. Besides, g0n is the ground truth that pixel n belongs to infection and g1n is the ground truth that pixel n belongs to non-infection area.
However, both Tversky loss and Dice loss will cause the training to be very unstable. Therefore, inspired by [44], we use a mixed loss function composed of Tversky loss and Focal loss [45]. Focal loss and the final loss function formula are as follows:
(18)
(19)
In the formula (19), we use the logarithmic function and introduce the variable μ, the purpose is to balance the size of Tversky loss and Focal loss, so that their values are in the same order of magnitude.
4Experimental results
In this section, we introduce the setup and results of the experiment.
4.1Experimental setup
4.1.1Datasets
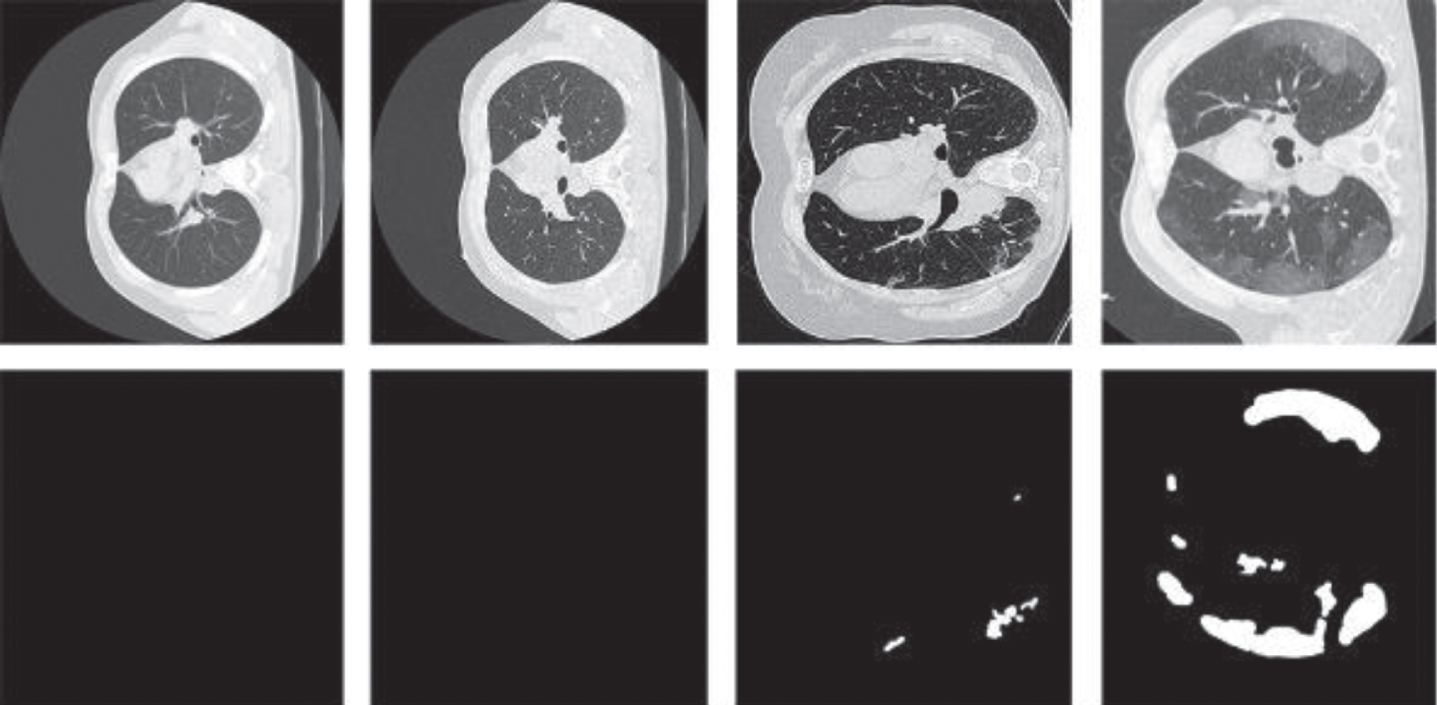
The two open source datasets we used in the experiment come from Italian Society of Medical and Interventional Radiology (SMIR) and the ground-truth segmentation was done by a trained radiologist [46]. Dataset A is 100 axial CT images from 60 COVID-19 patients. These 512 × 512images are converted from JPG images. Each CT image has the radiologist marking the infected area as a segmentation mask. Dataset B consists of nine axials volumetric CTs, which contain 829 slices. In the 829 slices, 373 slices have been evaluated and labeled as positive by the radiologist. The size of these images is 630 × 630, we resize them to 512 × 512, which is consistent with dataset A. We show the information of the two datasets in Table 1 and some sample images from the dataset are shown in Fig. 10. In the experiment, we will use two data sets together.
Table 1
The information of the two datasets
| Dataset Name | Cases | Slices Infection | Slices with the infected | Ratio of |
| A | 40 | 100 | 100 | 100% |
| B | 9 | 829 | 373 | 44.9% |
Fig. 10
Four images from the datasets we used. The first two columns display two images without infection. The images in the third and the fourth are COVID-19 images.
4.1.2Implementation details
Considering that training a network from scratch is inefficient, we apply the transfer learning technique. We use the pre-trained WideResNet-38 [47] as the backbone classification network for generating CAM. Based on pre-training parameters, we fine-tune the classification network to obtain a more accurate CAM based on whether there is an infected area as an image-level annotation. In our segmentation network, we use the Adam optimizer [48] to set β1 = 0.9, β2 = 0.999, ɛ=10-8, and the initial learning rate is set to 1e-4. In the loss function, we set α=0.3, β=0.7. All network models in the experiment are implemented with pytorch, and are calculated on a GTX TITAN X GPU. Our results based on a 10-fold cross-validation.
4.1.3Evaluation metrics
In this paper, we use three widely used evaluation indicators in medical image analysis to evaluate segmentation accuracy, namely Dice similarity coefficient (DSC), sensitivity (SEN), and specificity (SPC). The Dice similarity coefficient indicates the degree of similarity between the predicted area and the real labeled area on the ground. Sensitivity represents the ability of the model to predict the actual COVID-19 infection area successfully. Specificity represents the ability of the ground truth of the background area are correctly segmented. These metrics are defined as follows:
(20)
(21)
(22)
where TP, FP, TN and FN represent the true positive, false positive, true negative and false negative, respectively.
4.2Experiment results
In this section, we analyze the experimental results to demonstrate the effectiveness of our weak supervision scheme and segmentation network.
4.2.1Quantitative and qualitative analysis
Our approach is measured against the other four excellent methods including CRF-RNN [49], IRN [50], IDC [51] and SEAM [52] which are also weakly supervised methods. The four methods are implemented according to the original articles. Some cases are shown in Fig. 11. We can observe that our weakly supervised method can get more detailed boundary information that is the best segmentation result in the comparison. Although the results of the other methods are not so bad, they lose so many details.
Fig. 11
Some examples of the results. We can observe that our method gains better segmentation result.
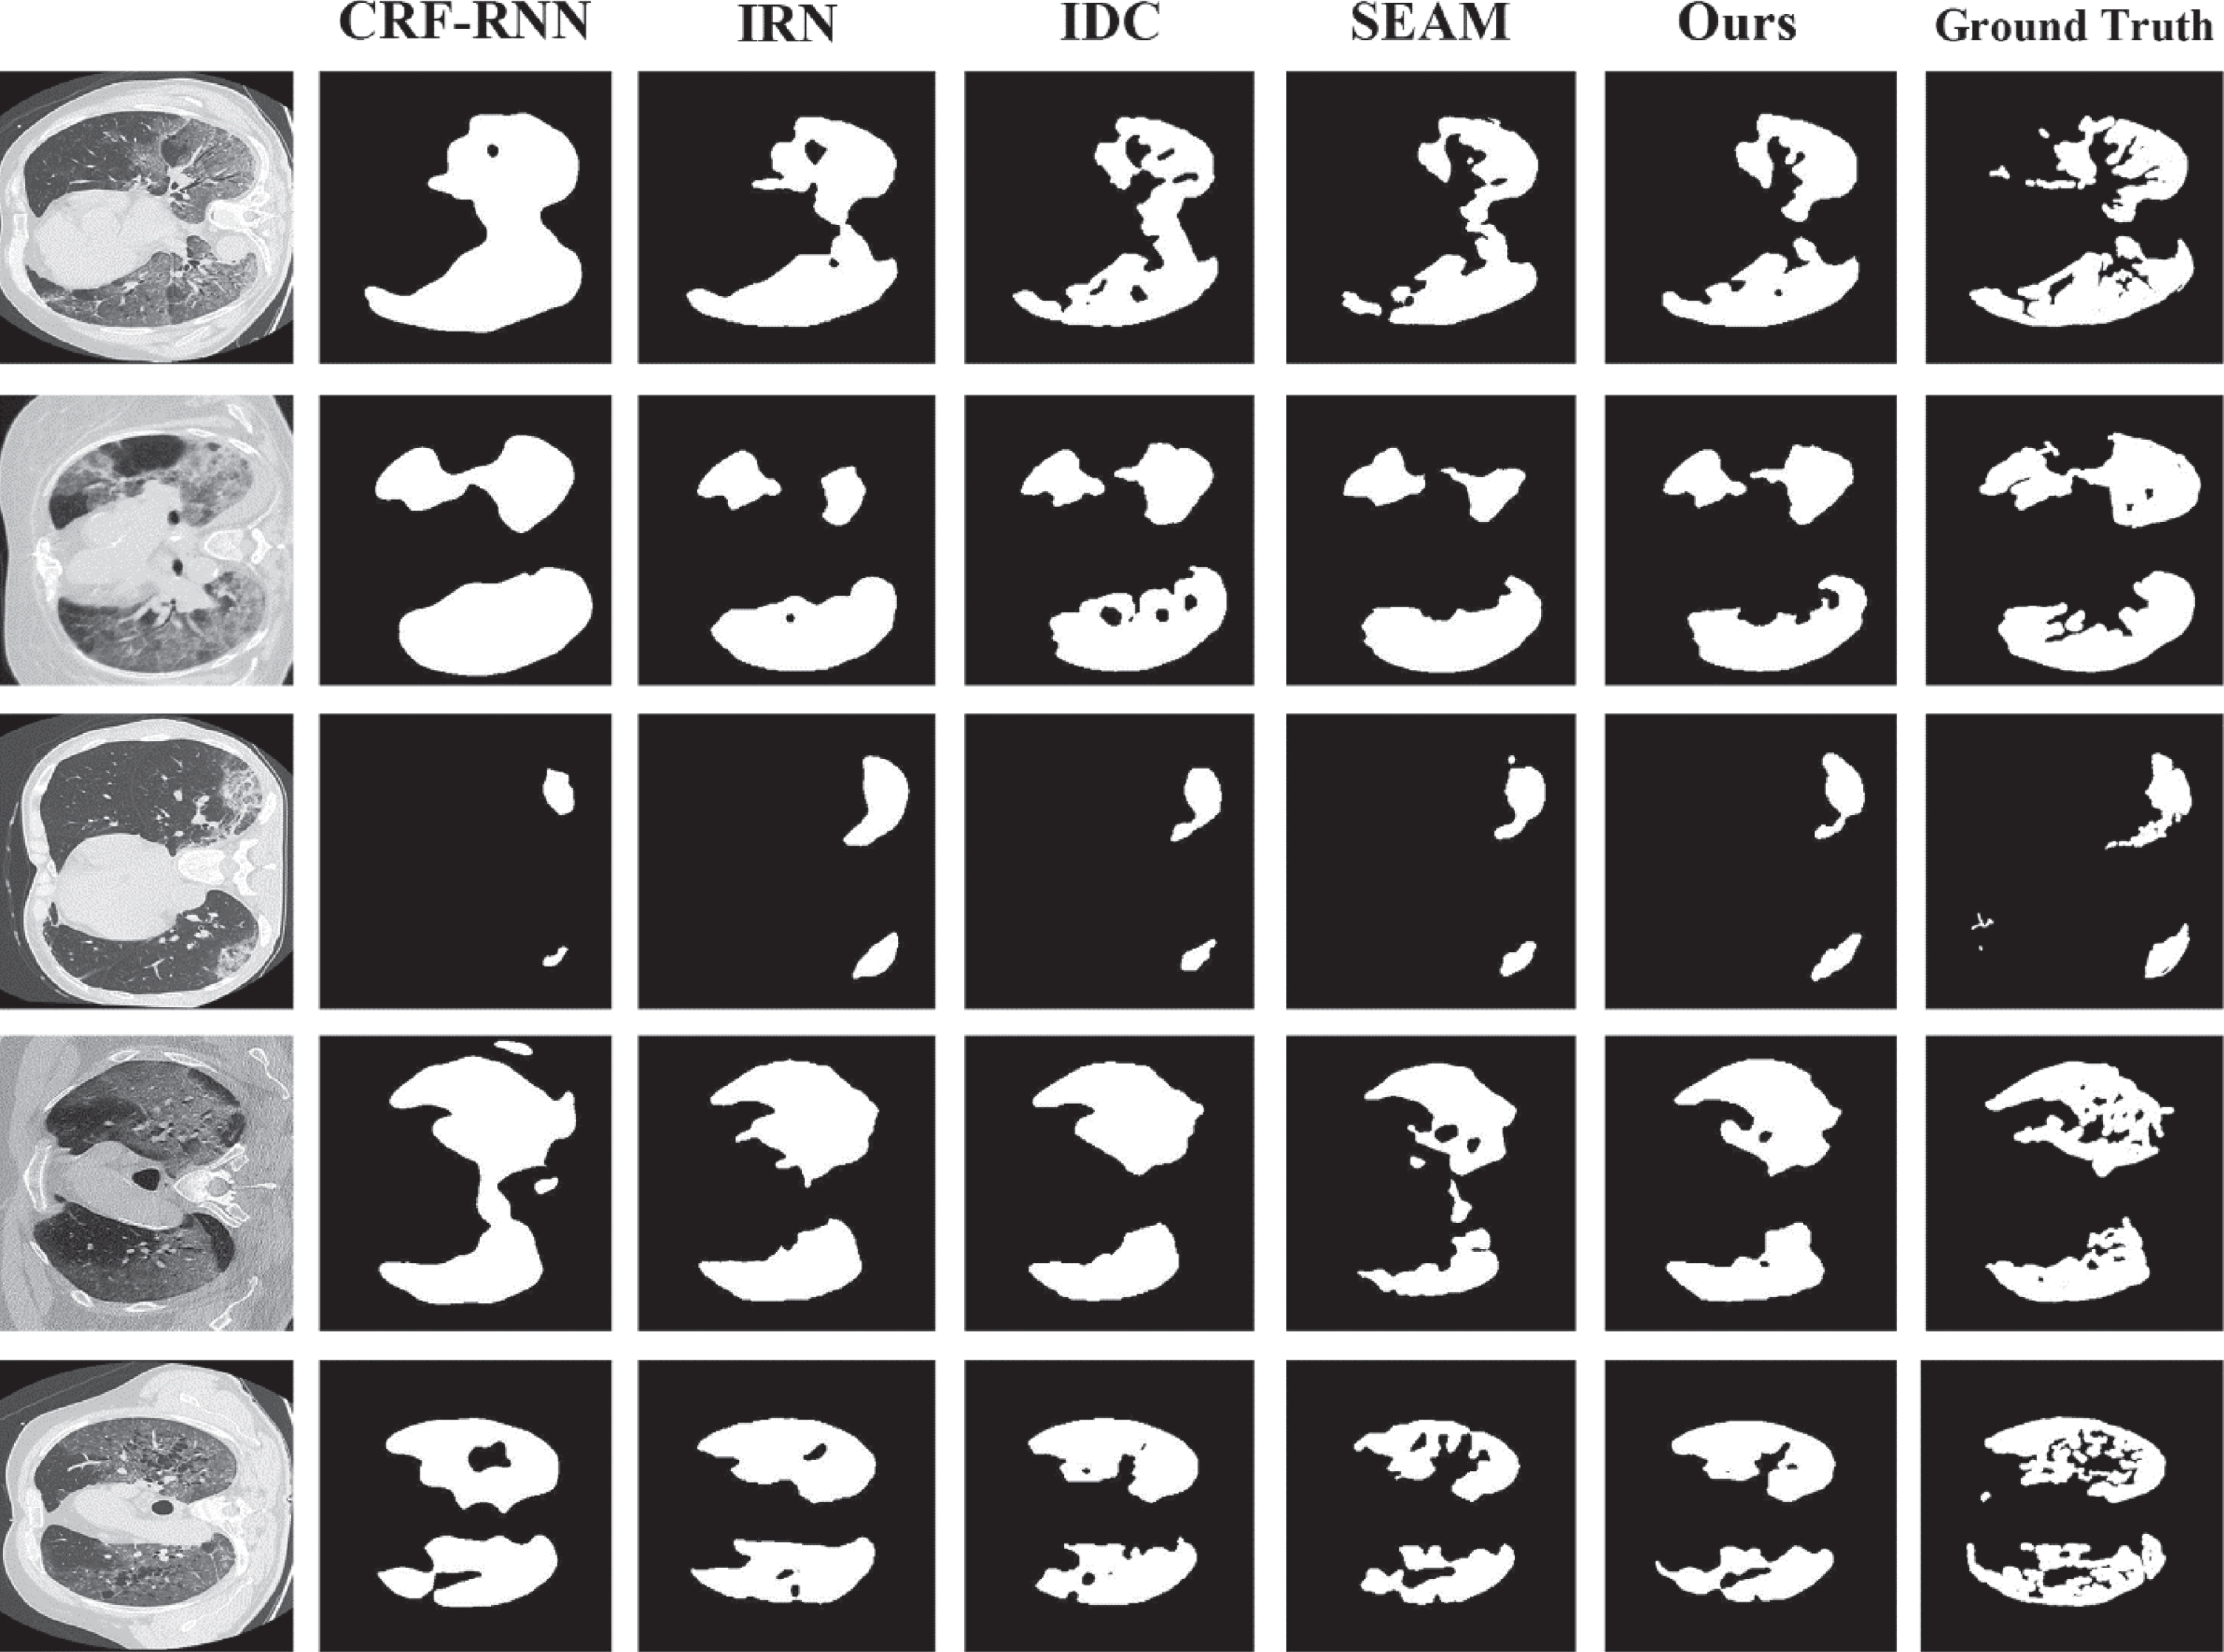
As shown in Table 2, we contrast our method with CRF-RNN, IRN, IDC and SEAM in terms of quantity. We can see that our method surpasses the other four methods on all the metrics. Comparing to SEAM, we get 1.08%, 3.12% improvement on Dice, Sensitivity.
Table 2
Segmentation performance comparison between ours and state-of-the-art methods
| Methods | DSC (%) | SEN (%) | SPC (%) |
| CRF-RNN | 57.69 | 66.41 | 94.71 |
| IRN | 66.74 | 75.65 | 96.92 |
| IDC | 67.92 | 77.53 | 96.23 |
| SEAM | 68.03 | 77.91 | 97.33 |
| Ours | 69.11 | 81.03 | 97.41 |
4.2.2Ablation studies
Accumulation Strategies. The accumulation strategy called CAM fusion is used to accumulate the discovered discriminative regions at each epoch. In addition to the average fusion strategy, we also investigate the maximum fusion strategy, which can be written as:
(23)
The results of different fusion strategies are shown in Table 3. As we can see, when the maximum fusion strategy is replaced with the average fusion strategy, we can get a higher dice score. We think this is because the average fusion strategy we used does not rely on the final cumulative attention map too much, which can gain more complete discriminative region.
Table 3
Segmentation performance with different fusion strategies
| Fusion Method | DSC (%) | SEN (%) | SPC (%) |
| MAX | 68.05 | 79.92 | 96.81 |
| AVG | 69.11 | 81.03 | 97.41 |
Segmentation network. To show the performance of our proposed segmentation network, we replace it with some previous state-of-the-art segmentation network model in our proposed weakly supervised method. The results are presented in Table 4. We could observe that lightweight models gain better performance, which shows that the model with fewer parameters are more suitable for COVID-19 dataset. We conduct that too many parameters will cause the generalization ability to decline for a small-scale dataset. Compared to the traditional large networks, our segmentation networks achieve competitive performance with much smaller number of parameters. In other words, our proposed segmentation network is more convenient for practical deployment than such large models. In comparison with the lightweight model, although we have more parameters, we get a higher dice score.
Table 4
Parameters comparison and segmentation performance of our method with different segmentation models
| Segmentation Model | Parameters | DSC (%) |
| U-Net [14] | 31.04M | 65.73 |
| PSPNet [53] | 65.7M | 66.85 |
| DeepLabV3+ [54] | 53.3M | 66.13 |
| EDANet [55] | 0.68M | 66.47 |
| ENet [56] | 0.36M | 67.25 |
| ESPNet [57] | 0.35M | 64.93 |
| Ours | 1.33M | 69.11 |
We also carry out ablation experiment to manifest the usefulness of our proposed block, and we use pixel-level labels in the experiment instead of weak labels. We list the various combinations in Table 5. We regard our proposed segmentation network without Feature Extraction (FE) block (replaced by conv block), Residual Connection (RC) and Modified Dilated Pyramid Pooling Module (MDPPM) as a baseline. The result shows that the FE block improves the segmentation performance over the baseline by 1.76% in term of DSC. In addition, RC improves the DSC to 77.54% on the basis of above. Besides, we adopt ASPP to prove the advantage of effectiveness of MDPPM. We can obtain the conclusion that residual learning and features fusion could improve performance.
Table 5
Ablation experiments with full supervision about all the blocks
| Block | Metrics (%) | |||||
| Baseline | FE | RC | ASPP | MDPPM | DSC | SEN |
| √ | 74.66 | 75.83 | ||||
| √ | √ | 76.42 | 77.91 | |||
| √ | √ | √ | 77.54 | 78.68 | ||
| √ | √ | √ | √ | 78.25 | 80.13 | |
| √ | √ | √ | √ | 78.61 | 81.24 | |
5Conclusion
In this paper, we are committed to using weakly supervised learning methods to segment COVID-19 infected areas from chest CT images. In the first stage of the method, we obtain object cues by gradually fusing the attention maps, and use the saliency detection method to obtain background cues. Finally, pseudo segmentation annotations, which are used to train segmentation models in the second stage, are generated from these cues. Considering the complexity of the model and the difficulty of deployment, we propose a lightweight segmentation model instead of using previous segmentation models. Owing to the depth separable convolution, the number of parameters of our segmentation model is much less than most existing models. At the same time, we adopt multi-scale learning and attention mechanism in the block that we proposed to improve performance. Besides, the effect of Residual Connection block, which is introduced above, shows that additional non-linear transformations could improve segmentation performance.
Our future work would be further improving segmentation performance. Most of the generated pseudo segmentation annotations are very rough. Therefore, there is still a gap between our method and the fully supervised method. Another research direction of our future work is the complexity of models. The lightweight model is more conducive to deployment, which has a positive effect on COVID-19 cure. We will also explore in this direction.
Acknowledgments
This work is supported by the Innovation Capacity Construction Project of Jilin Province Development and Reform Commission (2019C053-3), the Science & Technology Development Project of Jilin Province, China (20190302117GX) and the National Key Research and Development Program of China (No. 2020YFA0714103).
References
[1] | Velavan T.P. and Meyer C.G. , The COVID-19 epidemic, Tropical Medicine & International Health 25: (3) ((2020) ), 278. |
[2] | Zu Z.Y. , Jiang M.D. , Xu P.P. , Chen W. , Ni Q.Q. , Lu G.M. and Zhang L.J. , Coronavirus disease 2019 (COVID-19): a perspective from China, Radiology 296: (4) ((2020) ), E15–E25. |
[3] | Litjens G. , Kooi T. , Bejnordi B.E. , Setio A.A.A. , Ciompi F. , Ghafoorian M. , Van Der Laak J.A. , Van Ginneken B. and Sánchez C.I. , A survey on deep learning in medical image analysis, Medical Image Analysis 42: ((2017) ), 60–88. |
[4] | Wang D. , Hu B. , Hu C. , Zhu F. , Liu X. , Zhang J. , Wang B. , Xiang H. , Cheng Z. and Xiong Y. , Clinical characteristics of 138 hospitalized patients with 2019 novel coronavirus–infected pneumonia in Wuhan, China, Jama 323: (11) ((2020) ), 1061–1069. |
[5] | Ai T. , Yang Z. , Hou H. , Zhan C. , Chen C. , Lv W. , Tao Q. , Sun Z. and Xia L. , Correlation of chest CT and RT-PCR testing for coronavirus disease 2019 (COVID-19) in China: a report of 1014 cases, Radiology 296: (2) ((2020) ), E32–E40. |
[6] | Fang Y. , Zhang H. , Xie J. , Lin M. , Ying L. , Pang P. and Ji W. , Sensitivity of chest CT for COVID-19: comparison to RT-PCR, Radiology 296: (2) ((2020) ), E115–E117. |
[7] | Manning D. , Ethell S. , Donovan T. and Crawford T. , How do radiologists do it? The influence of experience and training on searching for chest nodules, Radiography 12: (2) ((2006) ), 134–142. |
[8] | Chen C. , Liu X. , Ding M. , Zheng J. and Li J. , 3D dilated multi-fiber network for real-time brain tumor segmentation in MRI, International Conference on Medical Image Computing andComputer-Assisted Intervention, (2019) , 184–192. |
[9] | Kuang H. , Menon B.K. and Qiu W. , Automated infarct segmentation from follow-up non-contrast CT scans in patients with acute ischemic stroke using dense multi-path contextual generative adversarial network, International Conference on Medical Image Computing and Computer-Assisted Intervention, (2019) , 856–863. |
[10] | Zhang W. , Li G. , Wang F. , Longjiang E. , Yu Y. , Lin L. and Liang H. , Simultaneous Lung Field Detection and Segmentation for Pediatric Chest Radiographs, International Conference on Medical Image Computing and Computer-Assisted Intervention, (2019) , 594–602. |
[11] | Fang C. , Li G. , Pan C. , Li Y. and Yu Y. , Globally guided progressive fusion network for 3D pancreas segmentation, International Conference on Medical Image Computing and Computer-Assisted Intervention, (2019) , 210–218. |
[12] | Müller D. , Rey I.S. and Kramer F. , Automated Chest CT Image Segmentation of COVID-19 Lung Infection based on 3D U-Net, arXiv preprint arXiv:2007.04774, 2020. |
[13] | Chen X. , Yao L. and Zhang Y. , Residual attention u-net for automated multi-class segmentation of covid-19 chest ct images, arXiv preprint arXiv:2004.05645, 2020. |
[14] | Ronneberger O. , Fischer P. and Brox T. , U-net: Convolutional networks for biomedical image segmentation, International Conference on Medical Image Computing and Computer-Assisted Intervention, (2015) , 234–241. |
[15] | Çiçek Ö. , Abdulkadir A. , Lienkamp S.S. , Brox T. and Ronneberger O. , 3DU-Net: learning dense volumetric segmentation from sparse annotation, International Conference on Medical Image Computing and Computer-Assisted Intervention, (2016) , 424–432. |
[16] | Zhou Z. , Siddiquee M.M.R. , Tajbakhsh N. and Liang J. , Unet++: A nested u-net architecture for medical image segmentation, Deep Learning in Medical Image Analysis and Multimodal Learning for Clinical Decision Support, 2018, 3–11. |
[17] | Ibtehaz N. and Rahman M.S. , MultiResUNet: Rethinking the U-Netarchitecture for multimodal biomedical image segmentation, Neural Networks 121: ((2020) ), 74–87. |
[18] | Zhou B. , Khosla A. , Lapedriza A. , Oliva A. and Torralba A. , Learning deep features for discriminative localization, Proceedings of the IEEE Conference on Computer Vision and Pattern Recognition, (2016) , 2921–2929. |
[19] | Jiang P.T. , Hou Q. , Cao Y. , Cheng M.M. , Wei Y. and Xiong H.-K. , Integral object mining via online attention accumulation, Proceedings of the IEEE/CVF International Conference on Computer Vision, (2019) , 2070–2079. |
[20] | Liu J.J. , Hou Q. , Cheng M.M. , Feng J. and Jiang J. , A simple pooling-based design for real-time salient object detection, Proceedings of the IEEE/CVF Conference on Computer Vision and Pattern Recognition, (2019) , 3917–3926. |
[21] | Howard A.G. , Zhu M. , Chen B. , Kalenichenko D. , Wang W. , Weyand T. , Andreetto M. and Adam H. , Mobilenets: Efficient convolutional neural networks for mobile vision applications, arXiv preprint arXiv:1704.04861, 2017. |
[22] | Han K. , Wang Y. , Tian Q. , Guo J. , Xu C. and Xu C. , Ghostnet: More features from cheap operations, Proceedings of the IEEE/CVF Conference on Computer Vision and Pattern Recognition, (2020) , 1580–1589. |
[23] | Sandler M. , Howard A. , Zhu M. , Zhmoginov A. and Chen L.-C. , Mobilenetv2: Inverted residuals and linear bottlenecks, Proceedings of the IEEE Conference on Computer Vision and Pattern Recognition, (2018) , 4510–4520. |
[24] | Long J. , Shelhamer E. and Darrell T. , Fully convolutional networks for semantic segmentation, Proceedings of the IEEE Conference on Computer Vision and Pattern Recognition, (2015) , 3431–3440. |
[25] | Xiao X. , Lian S. , Luo Z. and Li S. , Weighted res-unet for high-quality retina vessel segmentation, International Conference on Information Technology in Medicine and Education (ITME), (2018) , 327–331. |
[26] | Oktay O. , Schlemper J. , Folgoc L.L. , Lee M. , Heinrich M. , Misawa K. , Mori K. , McDonagh S. , Hammerla N.Y. and Kainz B. , Attention u-net: Learning where to look for the pancreas, arXiv preprint arXiv:1804.03999, 2018. |
[27] | Fan D.-P. , Zhou T. , Ji G.-P. , Zhou Y. , Chen G. , Fu H. , Shen J. and Shao L. , Inf-net: Automatic covid-19 lung infection segmentation from ct images, IEEE Transactions on Medical Imaging 39: (8) ((2020) ), 2626–2637. |
[28] | Zhou T. , Canu S. and Ruan S. , An automatic covid-19 CT segmentation based on u-net with attention mechanism, arXiv preprint arXiv:2004.06673, 2020. |
[29] | Qiu Y. , Liu Y. , Li S. and Xu J. , MiniSeg: An Extremely Minimum Network for Efficient COVID-19 Segmentation, Proceedings of the AAAI Conference on Artificial Intelligence 35: (6) ((2021) ), 4846–4854. |
[30] | Dai J. , He K. and Sun J. , Boxsup: Exploiting bounding boxes to supervise convolutional networks for semantic segmentation, Proceedings of the IEEE International Conference on Computer Vision, (2015) , 1635–1643. |
[31] | Lin D. , Dai J. , Jia J. , He K. and Sun J. , Scribblesup: Scribble-supervised convolutional networks for semantic segmentation, Proceedings of the IEEEConference on Computer Vision and Pattern Recognition, (2016) , 3159–3167. |
[32] | Vernaza P. and Chandraker M. , Learning random-walk label propagation for weakly-supervised semantic segmentation, Proceedings of the IEEE Conference on Computer Vision and Pattern Recognition, (2017) , 7158–7166. |
[33] | Bearman A. , Russakovsky O. , Ferrari V. and Fei-Fei L. , What’s the point: Semantic segmentation with point supervision, European Conference on Computer Vision, (2016) , 549–565. |
[34] | Ahn J. and Kwak S. , Learning pixel-level semantic affinity with image-level supervision for weakly supervised semantic segmentation, Proceedings of the IEEE Conference on Computer Vision and Pattern Recognition, (2018) , 4981–4990. |
[35] | Huang Z. , Wang X. , Wang J. , Liu W. and Wang J. , Weakly-supervised semantic segmentation network with deep seeded region growing, Proceedings of the IEEE Conference on Computer Vision and Pattern Recognition, (2018) , 7014–7023. |
[36] | Oh S.J. , Benenson R. , Khoreva A. , Akata Z. , Fritz M. and Schiele B. , Exploiting saliency for object segmentation from image level labels, Proceedings of the IEEE Conference on Computer Vision and Pattern Recognition, (2017) , 5038–5047. |
[37] | Wei Y. , Feng J. , Liang X. , Cheng M.M. , Zhao Y. and Yan S. , Object region mining with adversarial erasing: A simple classification to semantic segmentation approach, Proceedings of the IEEE Conference on Computer Vision and Pattern Recognition, (2017) , 1568–1576. |
[38] | Afshari S. , BenTaieb A. , Mirikharaji Z. and Hamarneh G. , Weakly supervised fully convolutional network for PET lesion segmentation, Medical Imaging 2019: Image Processing, 2019, 10949: : International Society for Optics and Photonics, 109491K. |
[39] | Wu K. , Du B. , Luo M. , Wen H. , Shen Y. and Feng J. , Weakly supervised brain lesion segmentation via attentional representation learning, International Conference on Medical Image Computing and Computer-Assisted Intervention, (2019) , 211–219. |
[40] | Laradji I. , Rodriguez P. , Manas O. , Lensink K. , Law M. , Kurzman L. , Parker W. , Vazquez D. and Nowrouzezahrai D. , A weakly supervised consistency-based learning method for covid-19 segmentation in ct images, in Proceedings of the IEEE/CVFWinter Conference on Applications of Computer Vision, (2021) , 2453–2462. |
[41] | Chollet F. , Xception: Deep learning with depthwise separable convolutions, Proceedings of the IEEE Conference on Computer Vision and Pattern Recognition, (2017) , 1251–1258. |
[42] | Milletari F. , Navab N. and Ahmadi S.-A. , V-net: Fully convolutional neural networks for volumetric medical image segmentation, International Conference on 3D Vision (3DV), (2016) , 565–571. |
[43] | Salehi S.S.M. , Erdogmus D. and Gholipour A. , Tversky loss function for image segmentation using 3D fully convolutional deep networks, International Workshop on Machine Learning in Medical Imaging, (2017) , 379–387. |
[44] | Zhu W. , Huang Y. , Zeng L. , Chen X. , Liu Y. , Qian Z. , Du N. , Fan W. and Xie X. , AnatomyNet: Deep learning for fast and fully automated whole-volume segmentation of head and neck anatomy, Medical Physics 46: (2) ((2019) ), 576–589. |
[45] | Lin T.Y. , Goyal P. , Girshick R. , He K. and Dollár P. , Focal loss for dense object detection, Proceedings of the IEEE International Conference on Computer Vision, (2017) , 2980–2988. |
[46] | “COVID-19 CT segmentation dataset,” https://medicalsegmentation.com/covid19/, Accessed: 2020-04-11. |
[47] | Wu Z. , Shen C. and Van Den Hengel A. , Wider or deeper: Revisiting the resnet model for visual recognition, Pattern Recognition 90: ((2019) ), 119–133. |
[48] | Kingma D.P. and Ba J. , Adam: A Method for Stochastic Optimization, Proceedings of International Conference on Learning Representations, (2015) , 1–15. |
[49] | Roy A. and Todorovic S. , Combining bottom-up, top-down and smoothness cues for weakly supervised image segmentation, Proceedings of the IEEE Conference on Computer Vision and Pattern Recognition, (2017) , 3529–3538. |
[50] | Ahn J. , Cho S. and Kwak S. , Weakly supervised learning of instance segmentation with inter-pixel relations, Proceedings of the IEEE/CVF Conference on Computer Vision and Pattern Recognition, (2019) , 2209–2218. |
[51] | Fan J. , Zhang Z. , Song C. and Tan T. , Learning integral objects with intra-class discriminator for weakly-supervised semantic segmentation, Proceedings of the IEEE/CVF Conference on Computer Vision and Pattern Recognition, (2020) , 4283–4292. |
[52] | Wang Y. , Zhang J. , Kan M. , Shan S. and Chen X. , Self-supervised equivariant attention mechanism for weakly supervised semantic segmentation, Proceedings of the IEEE/CVF Conference on Computer Vision and Pattern Recognition, (2020) , 12275–12284. |
[53] | Zhao H. , Shi J. , Qi X. , Wang X. and Jia J. , Pyramid scene parsing network, Proceedings of the IEEE Conference on Computer Vision and Pattern Recognition, (2017) , 2881–2890. |
[54] | Chen L.C. , Zhu Y. , Papandreou G. , Schroff F. and Adam H. , Encoder-decoder with atrous separable convolution for semantic image segmentation, Proceedings of the European Conference on Computer Vision (ECCV), (2018) , 801–818. |
[55] | Lo S.Y. , Hang H.M. , Chan S.W. and Lin J.J. , Efficient dense modules of asymmetric convolution for real-time semantic segmentation, Proceedings of the ACM Multimedia Asia, (2019) , 1–6. |
[56] | Paszke A. , Chaurasia A. , Kim S. and Culurciello E. , Enet: A deep neural network architecture for real-time semantic segmentation, arXiv preprint arXiv:1606.02147, 2016. |
[57] | Mehta S. , Rastegari M. , Caspi A. , Shapiro L. and Hajishirzi H. , Espnet: Efficient spatial pyramid of dilated convolutions for semantic segmentation, Proceedings of the European Conference on Computer Vision (ECCV), (2018) , 552–568. |

