
Reconstructing time series GRN using a neuro-fuzzy system
Abstract
As a reverse engineering field, reconstructing a Gene Regulatory Network (GRN) from time series gene data has been a challenging issue in bioinformatics. This paper proposes a novel engineering framework that infers and reconstructs a gene regulatory network in terms of regulatory accuracy. Different from other statistical methods, the proposed framework uses features that represent the characteristics of time series datasets and selects the appropriate features of the time series data by using a neuro-fuzzy system. The proposed framework for reconstruction is based on a Neuro Network with Weighted Fuzzy Membership Function (NEWFM), which not only simplifies fuzzy inference and regulation model complexity but also improves the regulatory accuracy of reconstructing the GRN without minimizing the dynamic regulatory cycle. Finally, the proposed framework is evaluated with experimental results that demonstrate higher regulatory accuracy than previous algorithms.
1Introduction
Recently, as a field of reverse engineering, the reconstruction or identification of gene regulatory networks from gene expression data has been a challenging issue in bioinformatics due to the inherent uncertainty, fuzziness and complexity. A network representing the relationship between the gene and the gene regulation is referred to as a gene regulation network. Gene regulatory networks represent the cause and effect among genes. An activator aids the expression of other genes, while a repressor inhibits gene expression. A time series yeast cell microarray data set was used to reconstruct a gene regulatory network. The time series dataset shows the different gene expressions. Thus, it is able to predict the expression at the current time in accordance with the expression at a previous time.
Time series data are used for decrypting the complex and dynamic characteristics of biological networks, by storing multiple expression files at discrete time points during continuous processing. Time series microarrays are also used to analyze continuous processing datasets.
Time series data that has a characteristic of the expression at a previous time (t-1) can estimate the current time (t) expression, as shown in Fig. 1.
Gene networks have been modeled according to various approaches [3, 4, 12]. Although there have been many proposed algorithms for reconstructing gene regulatory networks, each algorithm has specific disadvantages during inference of the gene regulatory network. For example, the dynamic Bayesian net-work model [12] based on time series data constructs a gene network with cyclic regulatory information, necessitating that the data be discretized into several classes; results depend on the discretization thresholds, leading to information loss. The model based on the Variational Bayes Expectation Maximization (VBEM) algorithm [3] presents the disadvantage of dynamicregulatory minimization [2, 14]. The time delay algorithm for the reconstruction of an accurate cellular network (ARACNE) results in low reconstruction accuracy.
To address the disadvantages of previous approaches, this paper proposes a novel process of reconstructing Gene Regulatory Networks (GRNs) with time series data and based on a neuro-fuzzy system, the Neural Network with Weighted Fuzzy Membership Function (NEWFM) [15]. The NEWFM is a supervised fuzzy neural network system that classifies layers by using the bounded sums of the weighted fuzzy membership function that are input and learned from the network [5, 16, 17]. It also combines the abilities of inference and learning in a fuzzy neural network system. As a method of feature selection, NEWFM selects the activator and repressor from the given yeast cell microarray time series data for GRN reconstruction. Thus, feature selection by NEWFM is the key process in the proposed framework. To evaluate the proposed framework, a yeast cell microarray time series dataset was used [7]. Finally, the proposed framework results in higher accuracy than the DBN [12], VBEM [4], and the time delay ARACNE [9] algorithm.
The entire process of the proposed process for GRN reconstruction with NEWFM is described in Section 2. The proposed process of GRN reconstruction is then evaluated according to experimental results in Section 3. Finally, conclusions regarding the proposed method of GRN reconstruction are presented in Section 4.
Four features are extracted, namely a(i), d(i), cp, and time lag, for each gene in the yeast cell microarray dataset, which has a total of 12 genes. The cdc 15 dataset was trained with NEWFM in order to select more effective features. The reasoning for feature selection can increase accuracy by removing genes with low correlations or degrees of influence. The GRN was reconstructed after assigning a weight to each selected feature. The achieved accuracy is 83.53% as compared to conventional GRN, providing the KEGG database.
2Process of reconstructing GRN with NEWFM
2.1Neural network with weighted fuzzy membership function (NEWFM)
NEWFM is a supervised fuzzy neural network that classifies layers using the bounded sums of the weighted fuzzy membership functions that are input and learned from the given network. The NEWFM consists of three layers: the input, hyperbox, and class layers. The input layer contains input nodes for featured input patterns. Figure 2 depicts the structure of the NEWFM. Each figure is inputted into the input layers of f 1, f 2, etc. The hyperbox layer comprises fuzzy sets with the bounded sum of three weighted fuzzy membership functions. The hyperbox layer will be divided into two classes: B 1 is the learning class 1, and B 2 is the learning class 2. One of characteristics is learned class1 or class2, and is categorizing the class. The bounded sum of three weighted fuzzy membership function is a synthesis of the bounded sums of three membership functions of large, middle, and small values according to their weights [5, 16, 17]. NEWFM trains n number of fuzzy set in each hyperbox according to a number n of feature inputs. After training, all three (large, medium, and small) weighted fuzzy membership functions of the fuzzy set compose one weight fuzzy membership function according to the bounded sum. This will be defuzzificated by using Takagi-Sugeno techniques. Finally, the class layer is the output layer. In this paper, a yeast cell dataset GRN is reconstructed using NEWFM. As the proposed process is unsupervised in this paper, the class layer does not represent the value of classification in this process [6].
Figure 3 shows the structure of the bounded sum of three weighted fuzzy membership functions.
2.2Data: Yeast cell cycle dataset
The dataset used for reconstruction of the GRN with NEWFM is a yeast cell cycle microarray time series dataset. The yeast cell is a living organism, of which Saccharomyces cerevisiae is one of several. The yeast cell dataset consists of four datasets: cdc15, cdc28, alpha, and Elu. Each data set has a time point: 24, 17, 18, and 14, respectively. The proposed NEWFM was analyzed using the cdc15 dataset. Table 1 describes the 12 genes that are related to the experiments [7].
2.3Overview of the proposed process
This paper proposes a novel process for reconstructing a GRN with NEWFM. As the Fig. 4, the proposed process consists of four steps as follows.
The description of each step is as follows:
– Step 1: For preprocessing, four features are extracted from each of 12 genes in the yeast cell cycle microarray dataset: wavelet a(i) (approximation), wavelet d(i) (detail coefficient), current position and time lag (the feature extraction methods are described in detail after the general overview of the process). Thus, there are a sum of 48 extracted features from the 12 genes that serve as input values in the input layer of NEWFM.
– Step 2: By using NEWFM, 15 features can be extracted from the given dataset, and the features can differ based on the given dataset. According to the results of NEWFM, 15 features were selected from the highest value to the 15th highest value; an addition 15 features were selected that have the lowest values, in reverse order. Experimental results indicate that the best performance was achieved when 15 features were selected for activators and 15 features were selected forrepressors.
– Step 3: The selected features are ranked according to their average values of classification after the processing in step 2. Finally, the gene regulatory network was constructed with the activators and repressors that were selected by NEWFM.
For the feature extraction in step 1, three different methods were utilized: wavelet, current position, and time lag. Each method is described as follows:
* Wavelet: The Haar function is used as a mother wavelet and irrelevant data were removed. The detail coefficient (di) and approximation coefficient (ai) were used at level 1, since the number of samples in the yeast cell microarray time series data are not sufficient to perform at level 2 or above. The following equations are used for each respective coefficient.
where mi is the value of the current time point.* Current Position (CP): Current position was used as the second feature extraction method. The equation describing current position is as follows [19]:
* Time Lag (TL): TL represents the time difference between gene expressions. Gene T and gene R that begin gene expression at time point t and change expressions at time point t+1 regulate gene networks. The TL equation is described as follows:
Four features were extracted from each of 12 genes; therefore, 48 total features were extracted. Figure 5 illustrates the structure of the features extracted by methods a, b and c, described above.
3Experimental results
The yeast cell time series datasets include alpha, cdc15, cdc28 and elu with 18, 24, 7 and 14 time points, respectively [10, 15]. Twelve genes were utilized (i.e., SIC01, CLB05, CDC20, CLN03, SWI06, CLN01, CLN02, CLB06, and SWI04) from the cdc15 dataset that is presented by M.C. Costanzo, J.D. Hogan, M.E. Cusick, et al. as a training dataset, and the alpha and cdc28 datasets that were used for testing datasets in this experiment [7].
To represent the characteristics of the time series datasets during preprocessing, a moving average method was applied that appropriately represents the relationship between the two moving averages, removes noisy datasets and reflects the dynamic changes and then extracts the data according to feature extraction methods such as wavelet a(i), wavelet d(i), CP(current position) [5, 15], and time-lag (TL) [2]. Therefore, each gene has four features and each gene selects features from 44 other features with NEWFM that are the sum of the features from the other 11 genes.
Figure 5 depicts the process of reconstructing the gene regulatory network with NEWFM. The input layer consists of 44 extracted features, and each node of the hyperbox layer consists of the 44 features of each gene.
In Fig. 6 each hyperbox node is connected by a common classification into a single class. The class is classified by the value at dataset time point t. For example, if t >t+1 then the class is 1; otherwise, the class is 2. Finally, network of activators was constructed with the best classifying results, and repressors with the worst classifying results.
In Fig. 7, an arrow indicates a positive interaction, while a closed circle indicates a negative interaction. The overall figure shows the GRN reconstructed with NEWFM evaluated according to a portion of the yeast cell cycle regulatory network extracted from the KEGG database [8, 18].
Figure 8 shows the results of the gene regulatory network achieved by NEWFM. Each node represents a gene; the blue solid lines indicate activator interactions, and the red dotted lines indicate repressor interactions. Sensitivity and precision are computed by the following equations:
where a true positive (TP) is the inferred number of edges as shown above, a false negative (FN) is the number of unidentified edges, and a false positive (FP) is the number of correctly identified edges. Table 2 shows a comparison of proposed process with other algorithms in terms of sensitivity and precision. The F-score is expressed by using the sensitivity and precision to evaluate the performance. The formula used to calculate the F-score is described as follows [11].
According to the results indicated by the F-score: VBEM = 23% , ARACNE = 44.4% , LASSO =32.5% , HTBNF = 53.1% , and the proposed algorithm = 79.45% , demonstrating improved results.
4Conclusion
This paper investigated the accuracy of GRN reconstruction with NEWFM. By extracting four features (wavelet a(i), wavelet d(i), CP (current position), and TL (time lag)) the proposed process is able to accurately represent the characteristics of the time series. Time-series data is extracted using the characteristic of the expression: the expression at previous time(t-1) can estimate the expression at current time(t), and could also represent a control gene in relation to the target gene that is identifiable in the feature selection process. The proposed process of GRN reconstruction achieved a higher F-score than other algorithms such as the dynamic Bayesian network, Variational Bayes Expectation Maximization (VBEM), and time delay ARACN. In future work, the proposed process of reconstruction GRN will be strengthened, experimentation will be conducted with a larger time series data set, and optimal thresholds for the given datasets will be determined.
Acknowledgments
This research was supported by Basic Science Research Program through the National Research Foundation of Korea (NRF) funded by the Ministry of Education, Science and Technology(2015R1D1A1A09057409).
References
1 | Noor A, Serpedin E, Nounou M, Nounou H (2012) Inferring gene regulatory networks via nonlinear state-space models and exploiting sparsity IEEE/ACM Transactions on Computational Biology and Bioinformatics 9: 1203 1211 |
2 | Chuang CL, Chen CM, Shieh GS, Jiang JA (2007) A neuro-fuzzy inference system to infer gene-gene interaction based on recognition of microarray gene expression patterns Evolutionary Computation IEEE |
3 | Tienda-Luna IM, Perez MCC, Padillo DPR, Yin Y, Huang Y (2009) Sensitivity and specificity of inferring genetic regulatory interactions with the VBEM algorithm IDIS International Journal on Computer Science and Information Systems 4: 54 63 |
4 | Bower JM, Bolouri H (2001) Computational Modeling of Genetic and Biochemical Networks MIT press UK |
5 | Lim JS (2009) Finding features for real-time premature ventricular contraction detection using a fuzzy neural network system IEEE Trans Neural Networks 20: 522 527 |
6 | Lim Member JS, Lee SH, Son SY (2014) Feature selection for daily peak load forecasting using a neuro-fuzzy system Multimedia Tools and applications 74: 2321 2336 |
7 | Costanzo MC, Hogan JD, Cusick ME (2000) The yeast proteome database (YPD) and Caenorhabditis elegans proteome database (WormPD): Comprehensive resource for the organization and comparison of model organism protein information Nucleic Acids Research 28: 73 76 |
8 | Kanehisa M, Goto S, Furumichi M, Tanabe M (2012) KEGG for integration and interpretation of large scale molecular datasets Nucleic Acids Research 40: D109 D114 |
9 | Zoppoli P, Morganella S, Ceccarelli M (2010) Time delay ARACNE: Reverse engineering of gene networks from time course data by an information theoretic approach BMC Bioinformatics 11: 154 |
10 | Cho RJ, Campbell MJ, Winzeler EA (1998) A genome-wide transcriptional analysis of the mitotic cell cycle Molecular Cell 2: 65 73 |
11 | Manshaei R, Bidari PS (2012) Hybrid-controlled neuro-fuzzy networks analysis resulting in genetic regulatory networks reconstruction Bioinformatics 2012: 419419 |
12 | Kim S, Imoto S, Miyano S (2004) Dynamic Bayesian network and nonparametric regression for nonlinear modeling of gene networks from time series gene expression data BioSystems 75: 57 65 |
13 | Imoto S, Goto T, Miyano S (2002) Estimation of genetic networks and functional structures between genes by using Bayesian Network and nonparametric regression Proc Pacific Symposium on Biocomputing 7: 175 186 |
14 | Imoto S, Kim S, Goto T, Aburatani S, Tashiro K, Kuhara S, Miyano S (2002) Bayesian network and nonparametric heteroscedastic regression for nonlinear modeling of genetic network Proc IEEE Computer Society Bioinformatics Conference 1: 219 227 |
15 | Lee SH, Lim JS (2011) Forecasting KOSPI based on a neural network with weighted fuzzy membership function Expert Systems with Applications 38: 4259 4263 |
16 | Lee SH, Lim JS (2011) Forecasting KOSPI based on a neural network with weighted fuzzy membership function Expert Syst Appl 39: 4259 4263 |
17 | Lee SH, Lim JS (2012) Parkinson’s disease classification using gait characteristics and wavelet-based feature extraction Expert Syst Appl 39: 7338 7344 |
18 |
Figures and Tables
Fig.1
Time series.
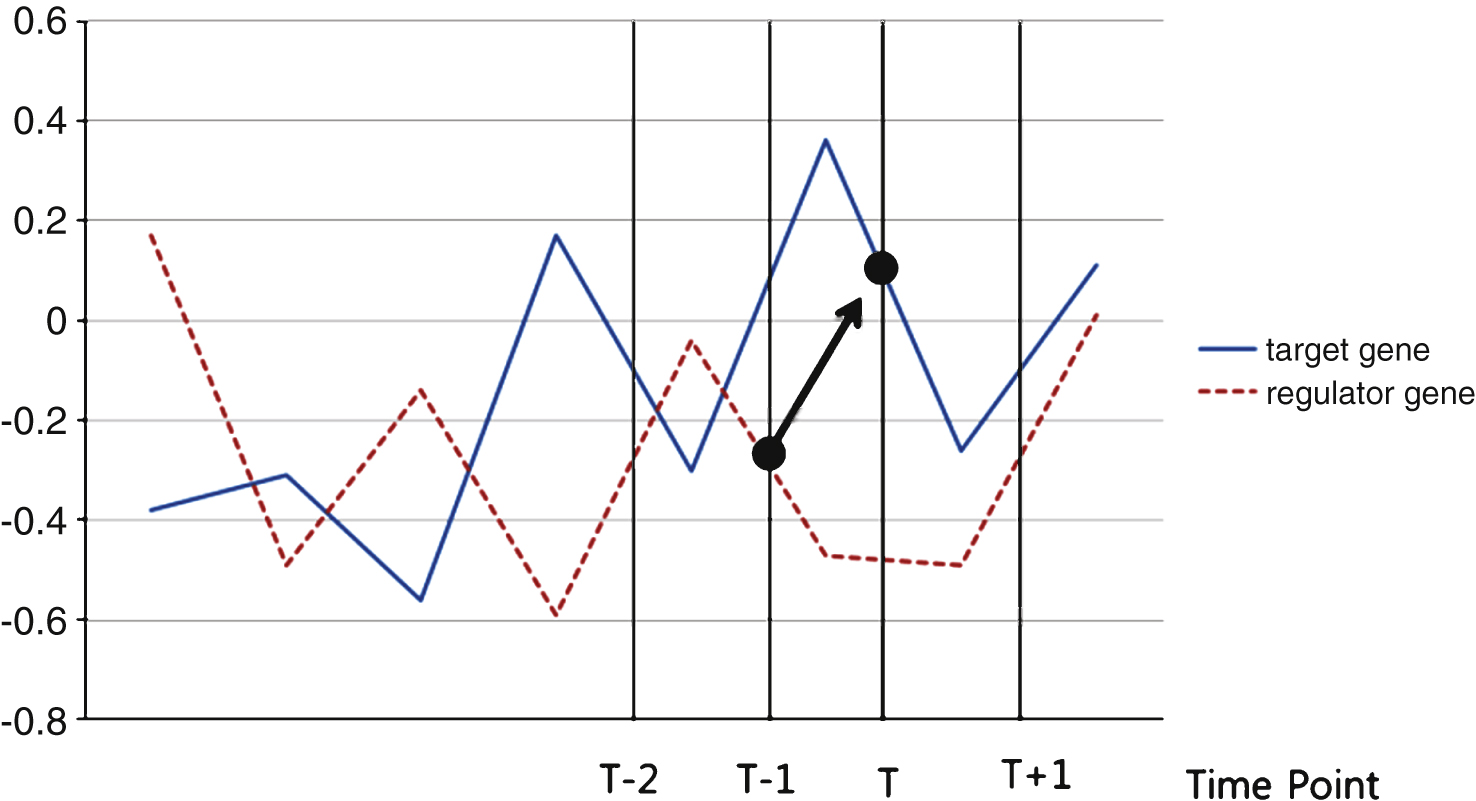
Fig.2
Structure of NEWFM.
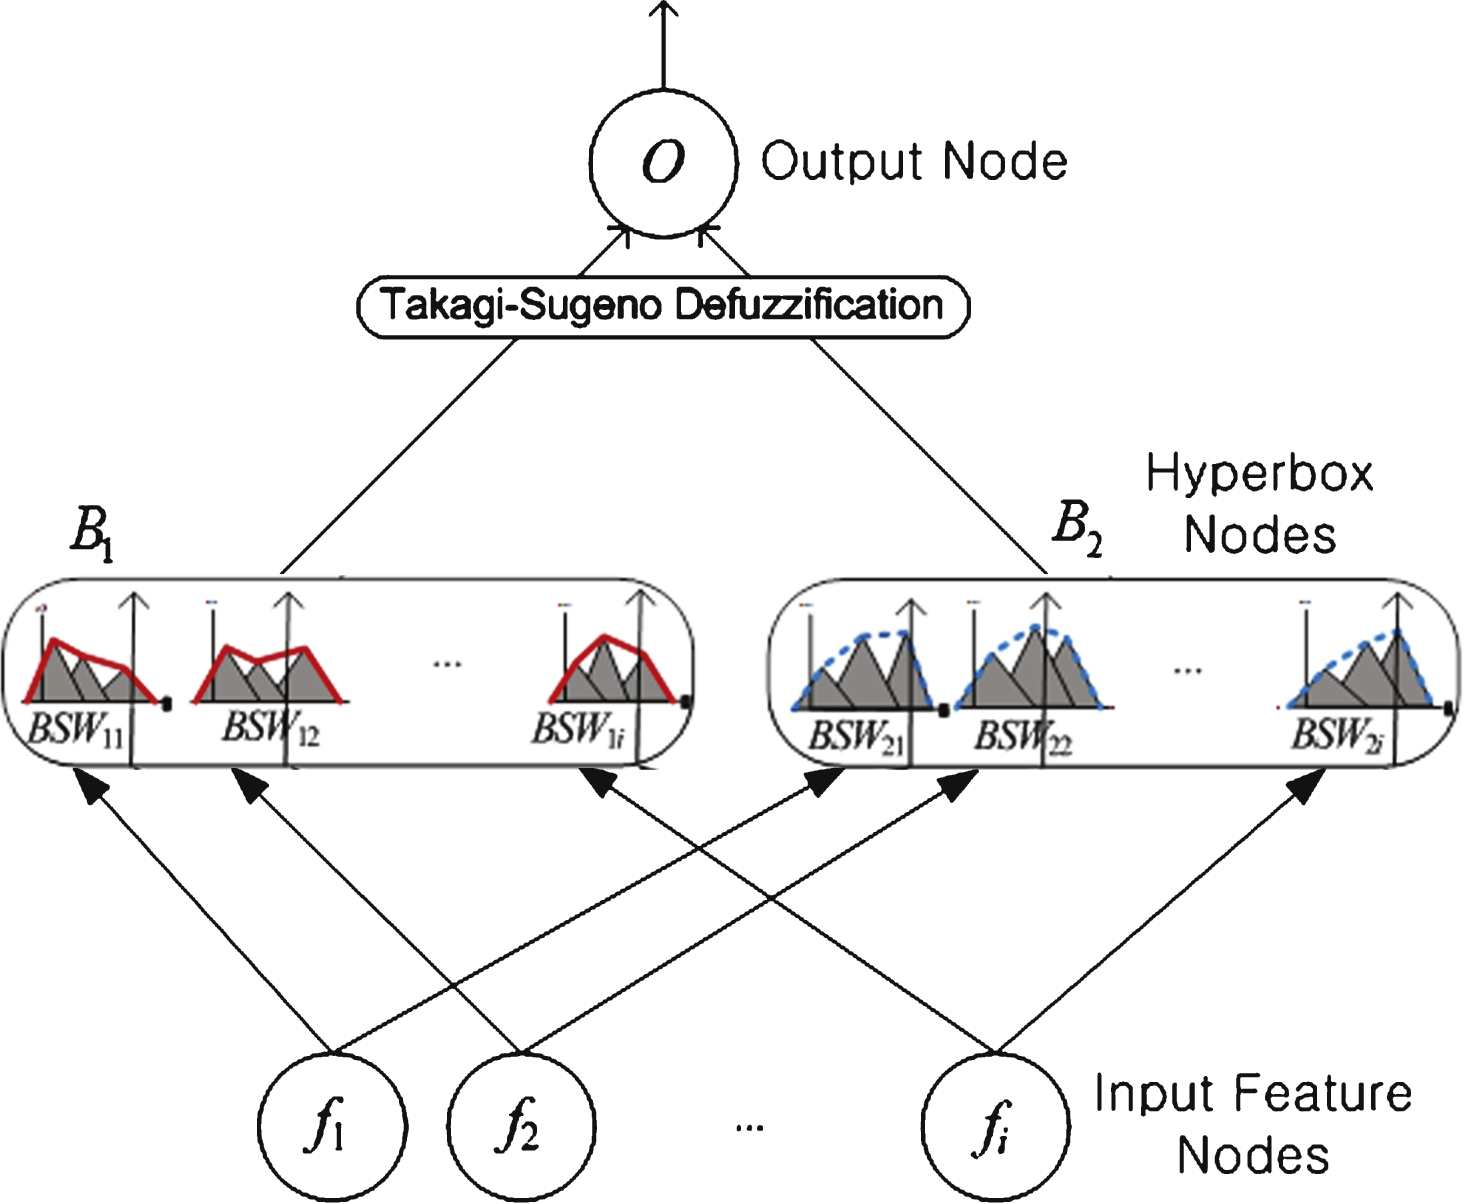
Fig.3
Structure of bounded sum of three weighted fuzzy membership functions.
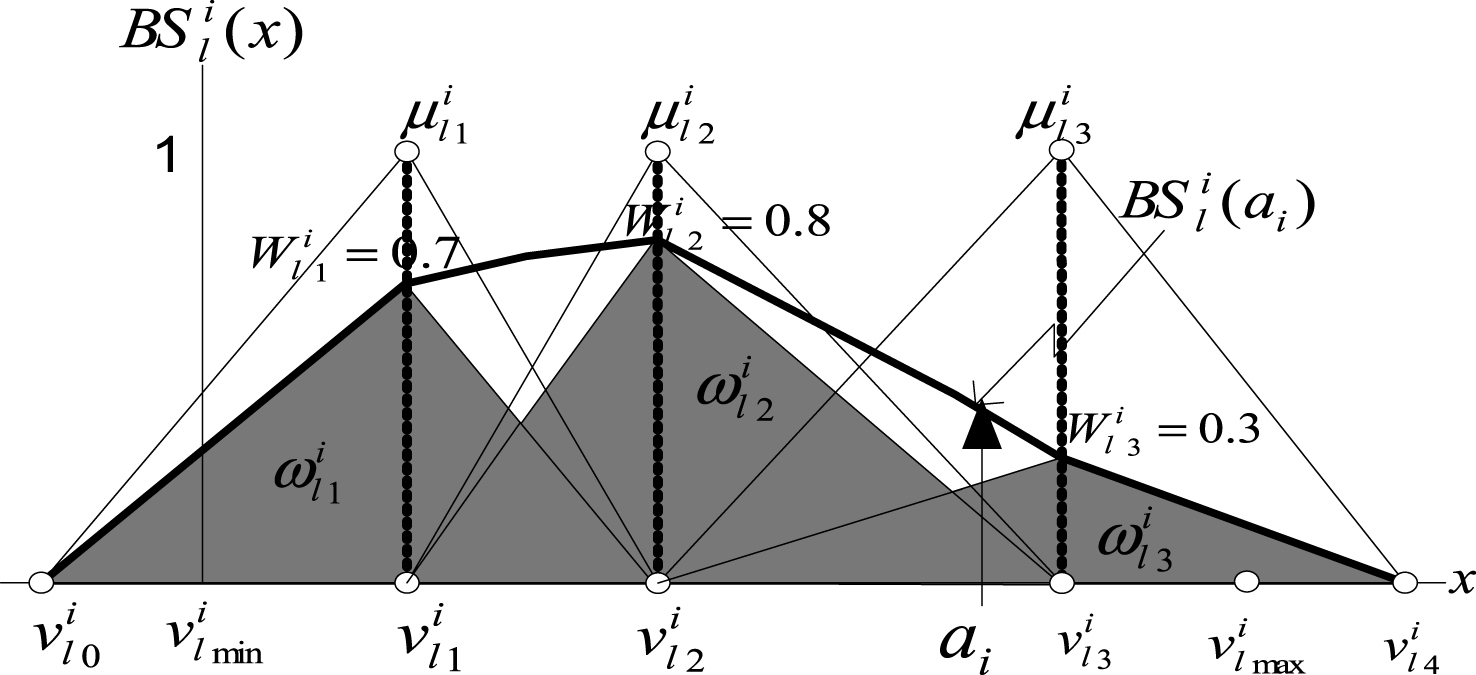
Fig.4
Overview of the proposed process with NEWFM.
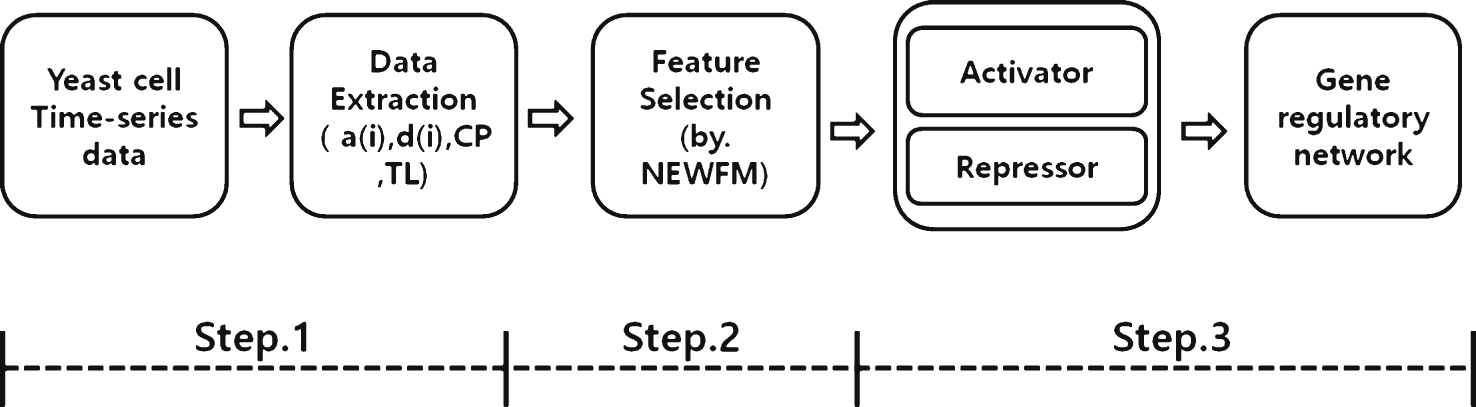
Fig.5
Structure of 48 extracted features.

Fig.6
Process of reconstructing GRN with NEWFM.
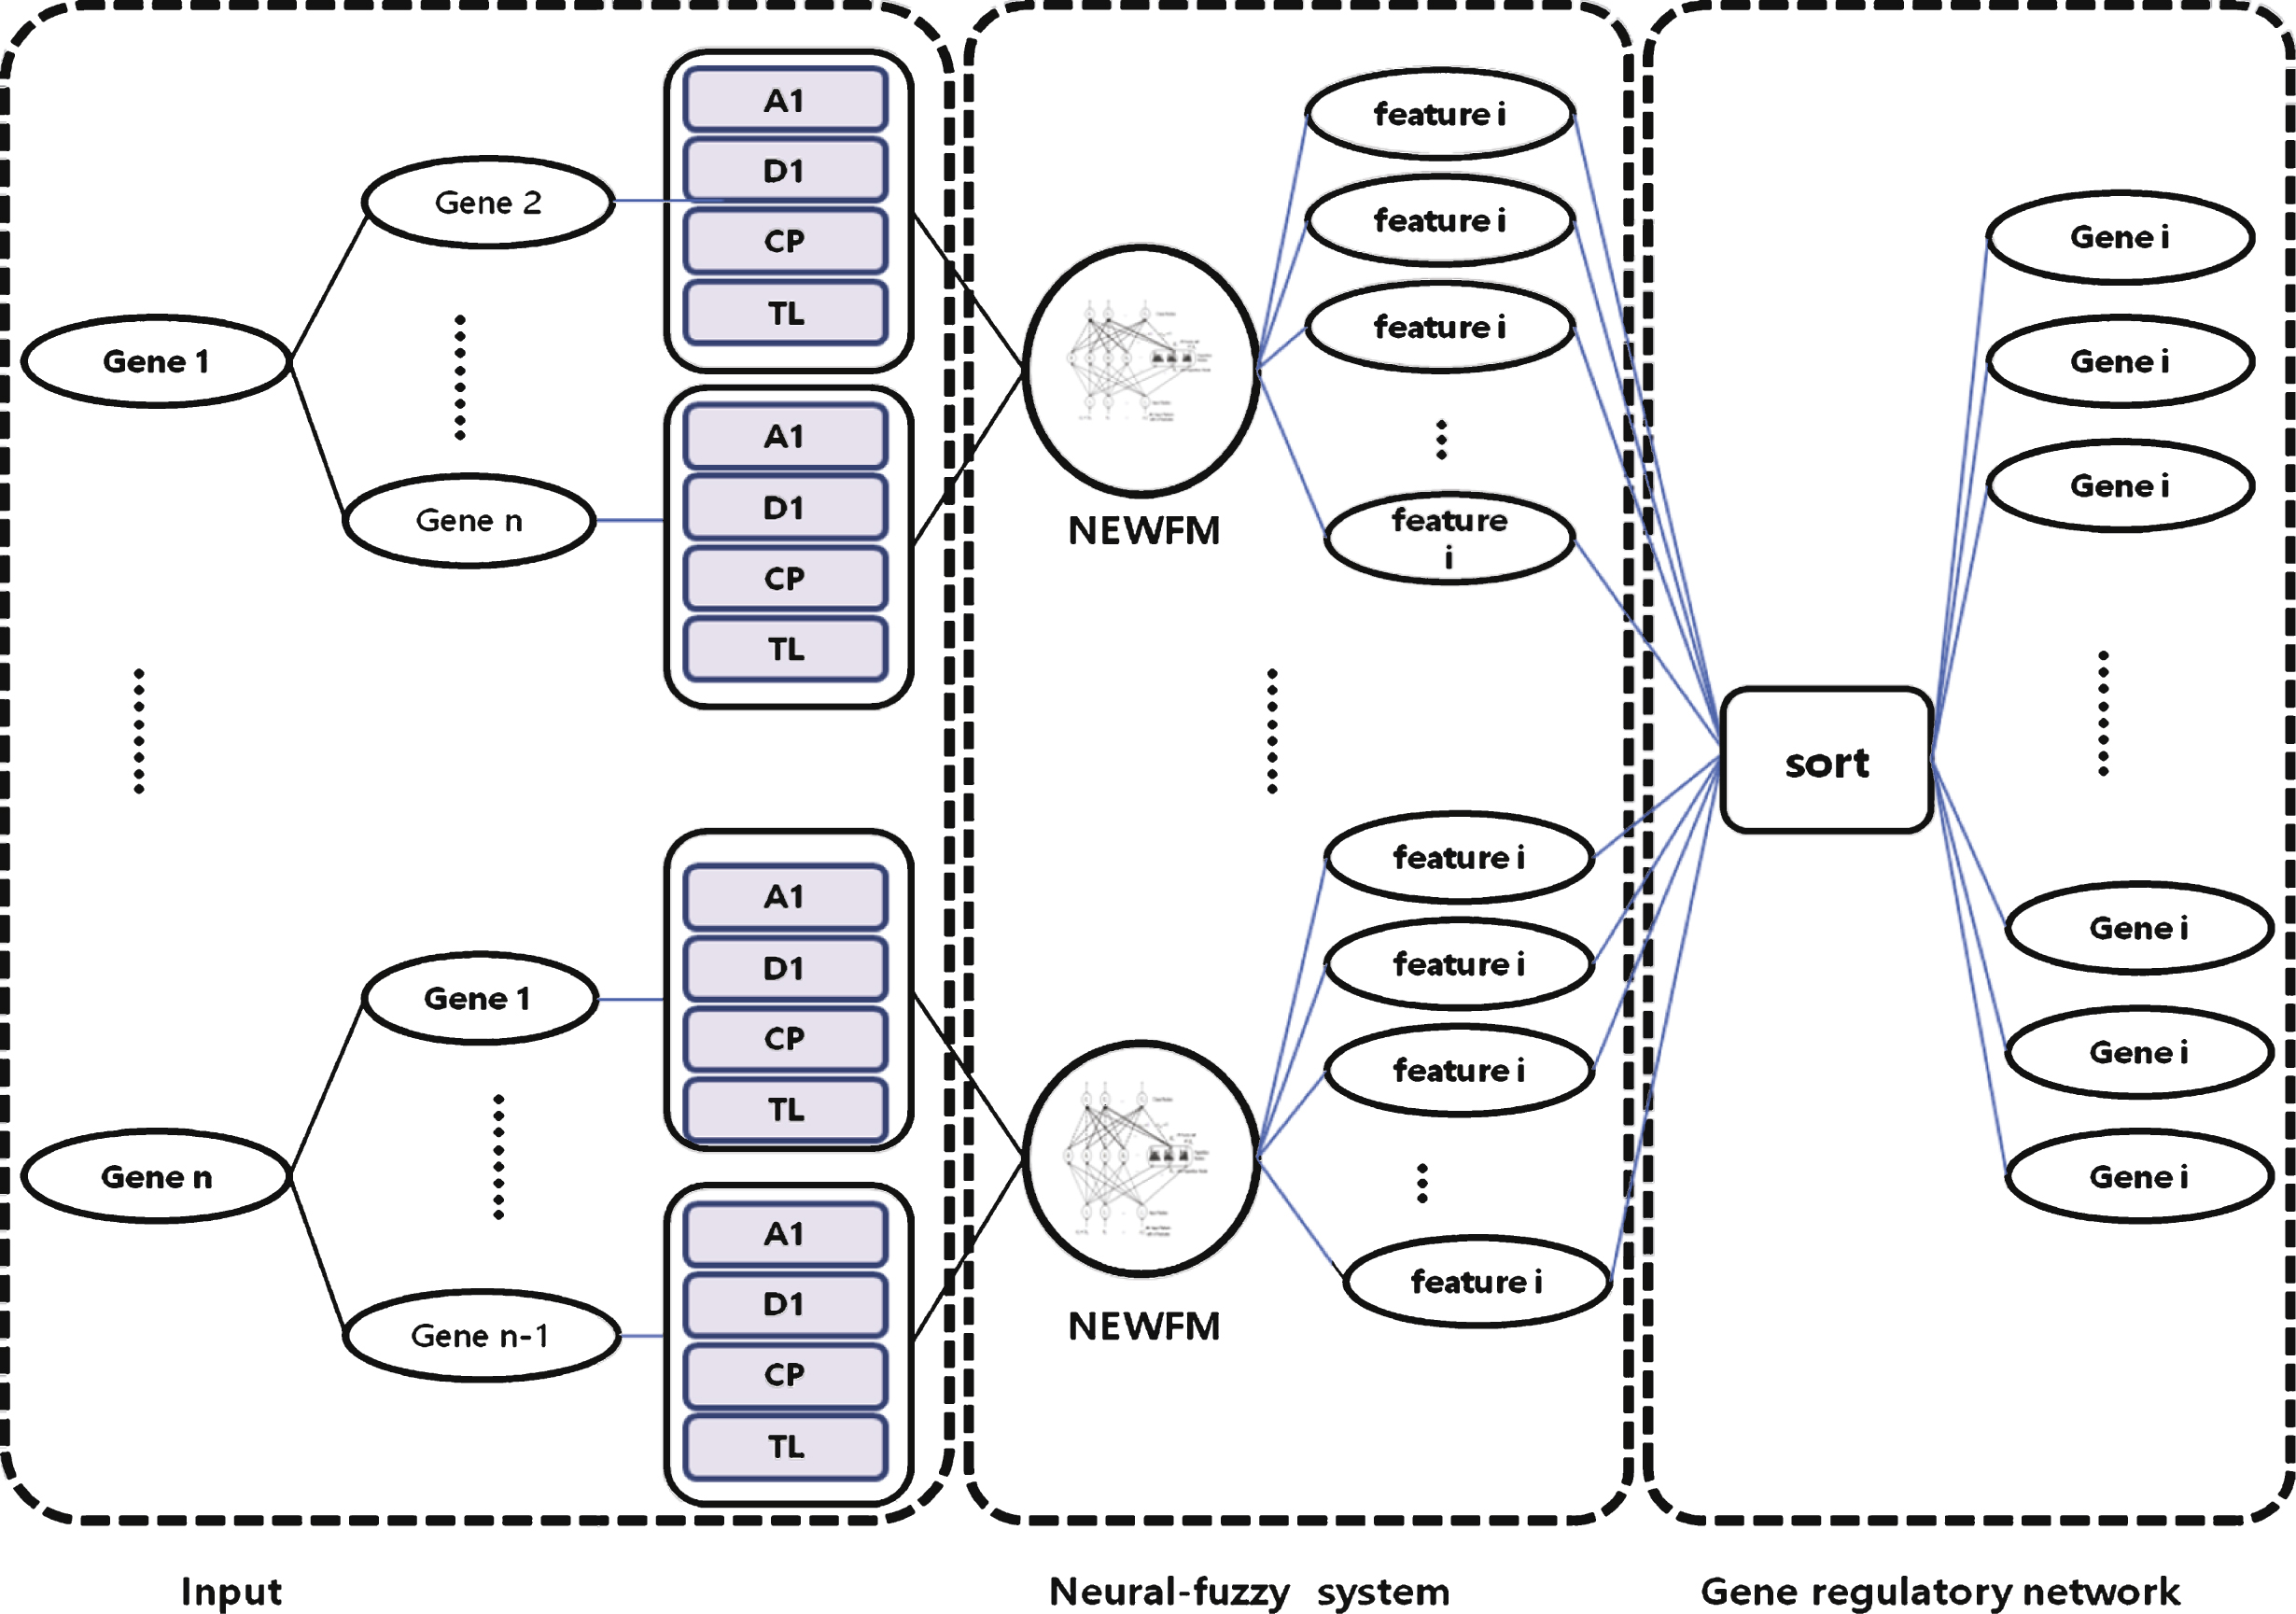
Fig.7
KEGG yeast cell cycle interactions.
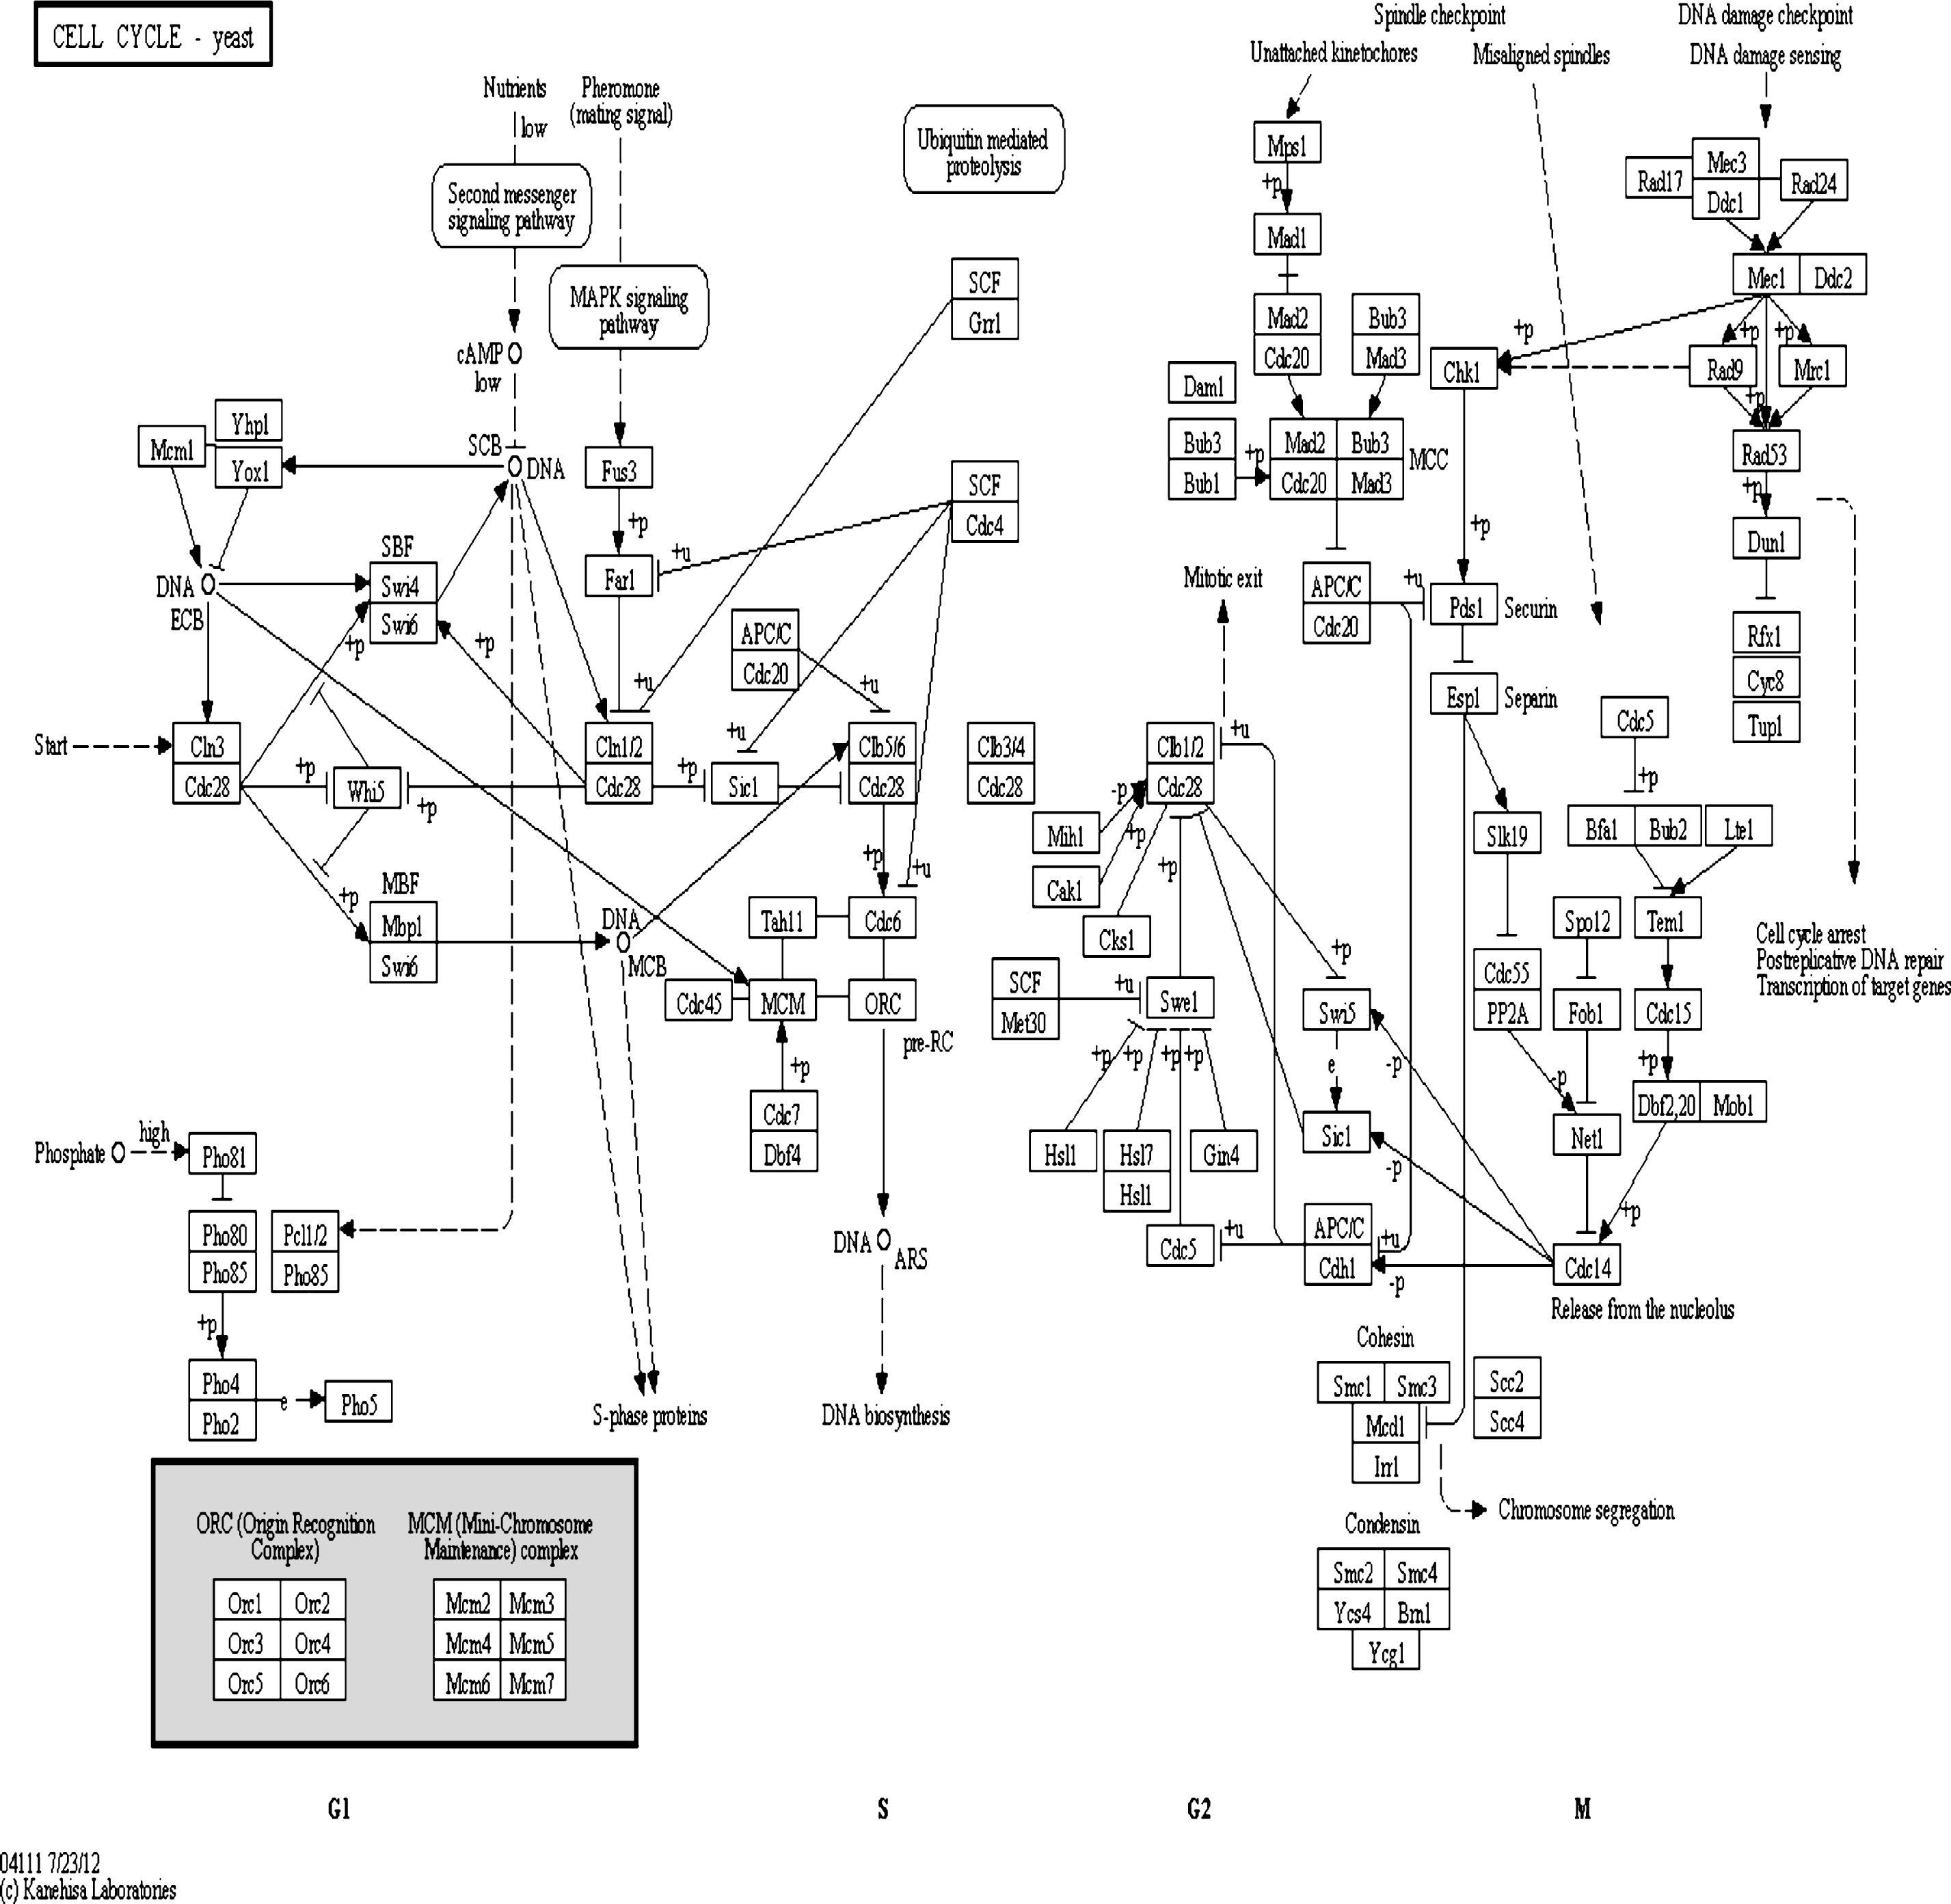
Fig.8
GRN reconstruction with NEWFM.
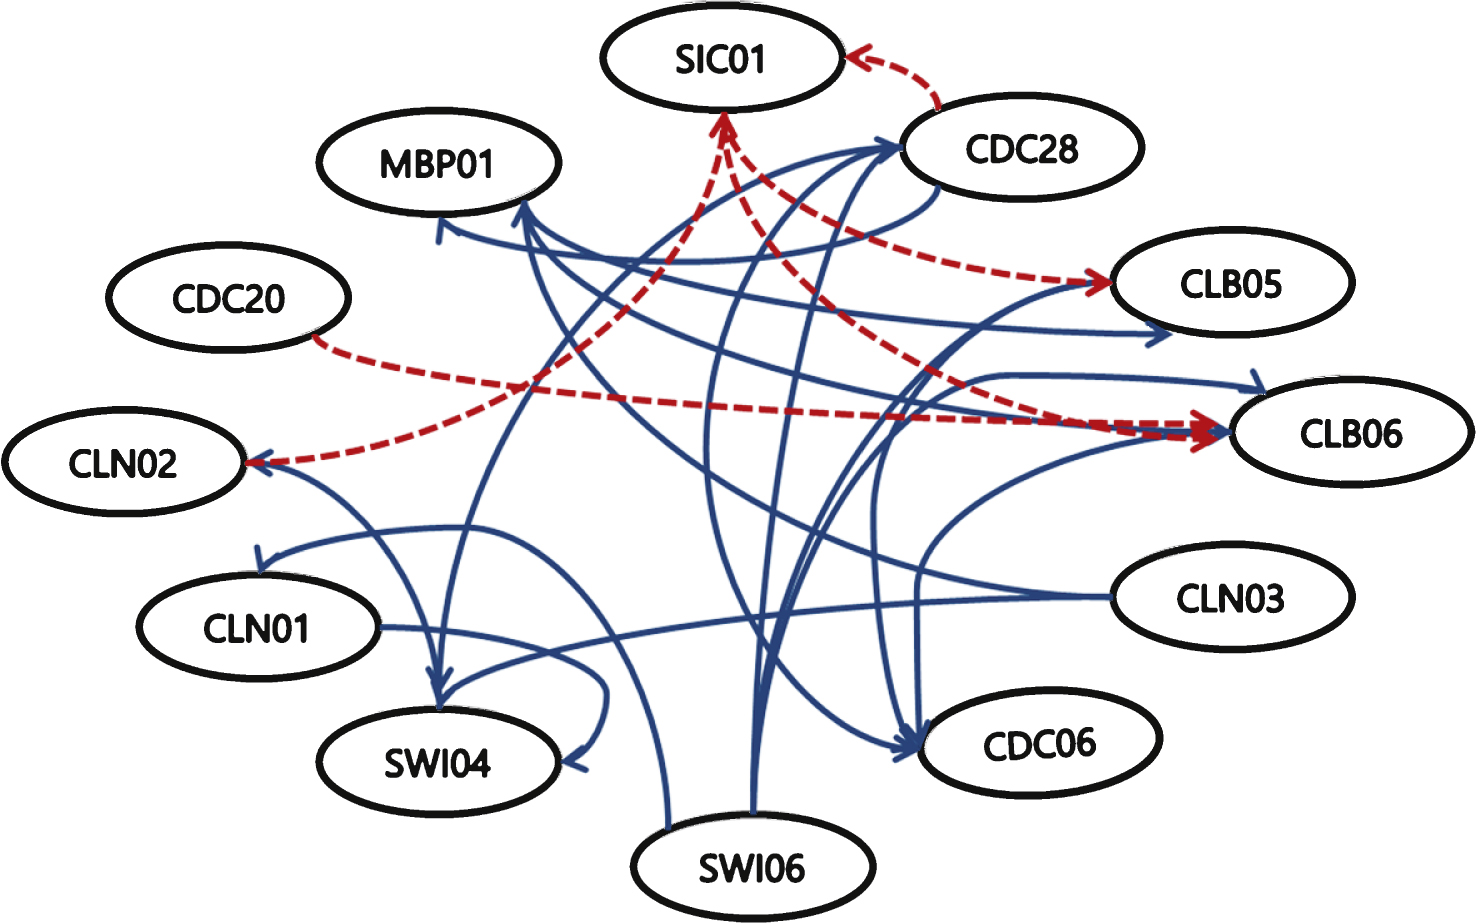
Table 1
The 12 genes of yeast cell cycle used to reconstruct the GRN [7]
| Gene name | ORF | Description |
| SIC01 | YLR079W | Inhibitor of the Cdc28-Clb protein kinase complex |
| CLB05 | YPR120C | B-type cyclin |
| CDC20 | YGL116W | Cell division control protein |
| CLN03 | YAL040C | G1/S-specific cyclin |
| SWI06 | YLR182W | Transcription factor, subunit of SBF and MBF |
| CLN01 | YMR199W | G1/S-specific cyclin |
| CLN02 | YPL256C | G1/S-specific cyclin |
| CLB06 | YGR109C | B-type cyclin |
| CDC28 | YBR160W | Cyclin-dependent protein kinase |
| MBP01 | YDL056W | Transcription factor, subunit of MBF |
| CDC06 | YJL194W | Initiates DAN replication, active late G1/S |
| SWI04 | YER111C | Transcription factor, subunit of the SBF factor |
Table 2
Sensitivity and precision comparison with other algorithms
| Algorithm | TP | FP | FN | Sensitivity | Precision | F-score |
| VBEM [2] | 5 | 3 | 28 | 15.2% | 62.5% | 23.5% |
| DBM [1] | 4 | 1 | 29 | 12.1% | 80% | 21% |
| Time delay ARACNE [9] | 10 | 2 | 23 | 30.3% | 83.3% | 44.4% |
| PF subject to LASSO [1] | 7 | 3 | 26 | 21.2% | 70% | 32.5% |
| HTBNF [11] | 13 | 3 | 20 | 39.4% | 81.3% | 53.1% |
| Proposed Process | 25 | 5 | 8 | 75.75% | 83.53% | 79.45% |


