
Fuzzy optimization control for NOx emissions from power plant boilers based on nonlinear optimization1
Abstract
Combustion optimization adjustment can effectively suppress NOx emissions from power plant boilers. Current combustion optimization adjustment methods involve nonlinear optimization based on the boiler combustion model, such as optimization by a genetic algorithm or particle swarm algorithm. The computational complexity of these methods results in poor real-time performance, which limits their practical applications. To solve this problem, a fuzzy optimization control method with better real-time performance is proposed. First, the space of the disturbance variables (DV), which are the input variables that combustion systems cannot adjust, is divided into a certain number of sub-spaces. Each sub-space center is then obtained using the corresponding optimal combustion mode by offline nonlinear optimization, thereby forming a complete expert rule base. The corresponding optimal manipulated variables (MV), which are the input variables that combustion systems can adjust, are then quickly obtained online by means of fuzzy inference for each inputted DV. The fuzzy optimization control of boiler combustion adjustment is then determined. Simulation has shown that both the fuzzy optimization control method and the nonlinear optimization method can achieve a consistent control effect. However, the fuzzy optimization control method has a better real-time performance.
1Introduction
Combustion optimization adjustment can effectively suppress NOx emissions from power plant boilers [23]. This adjustment ensures that the combustion condition adapts to the various operating conditions of the unit during boiler operation by adjusting the corresponding input parameters of the combustion system. Current combustion optimization adjustment methods involve nonlinear optimization based on the boiler combustion model, which often uses artificial neural networks,support vector machines, and other modeling methods to establish a boiler combustion model. Nonlinear optimization is based on the theory of biological evolution; animal population movement is used to obtain optimal values for the combustion system output variables, which are then directly utilized to guide online dynamic adjustment. Wang, et al. [22] introduced the use of the neural network model to describe the boiler combustion process and the use of a genetic algorithm to determine the optimal oxygen content in fuel gas. Yin, et al. [10] proposed the use of support vector machines to establish both boiler thermal efficiencies and the NOx emissions model. The group then optimized the model by PSO (Particle Swarm Optimization). However, the nonlinear optimization algorithm demonstrates poor real-time performance, is difficult to apply in engineering practice, and is time-consuming to improve.
Both the fuzzy control theory and the expert control theory have also been applied to the combustion optimization system. Gao [19] suggested providing optimum blast volume by an expert system to improve boiler combustion efficiency. Zhang [21] proposed the combination of the fuzzy control theory and expert systems to improve the design of the expert system fuzzy controller in the combustion system. Liu, et al. [17] introduced the use of fuzzy control strategy in the boiler combustion system. Yin, et al. [4] proposed using cascade fuzzy control and fuzzy self-optimization control in the pulverized coal boiler combustion system. However, fuzzy control and expert control can only achieve fuzzy inference control when the knowledge base is accurate and complete. Thus, the accuracy and integrity of the data in the knowledge base is one of the keys to fuzzy optimization control.
The key advantages to the nonlinear optimization method and fuzzy optimization control are the ability to obtain the optimal global solution and fast performance, respectively. This paper proposes an online fuzzy optimization control method with improved real-time performance. The first step is to divide the space of the disturbance variables (DV), which are the input variables that combustion systems cannot adjust, into a certain number of sub-spaces. Each sub-space center obtains a corresponding optimal combustion mode by offline nonlinear optimization, thereby forming a complete expert rule base. For any inputted DV, the corresponding optimal manipulated variable (MV), which is an input variable that combustion systems can adjust, is achieved by fuzzy inference, ultimately determining the fuzzy optimization control for boiler combustion adjustment. This method can not only provide the optimal global solution, but also solves the issues of the nonlinear optimization method, which is too time-consuming in the optimization process and is difficult for practical applications.
2Establishment of NOx emissions model
2.1Structure of NOx emissions model
The experimental boiler is a 1099.3t/H forced circulation boiler (Alsthom Ltd., France), and the double-arch furnace with a “W”-shape flame acts as the primary feature of its combustion system. The followingparameters were used for the experimental boiler [20]: ten input variables of model were selected, including three DVs, seven MVs, and one output variable. The DVs consist of load, L; the calorific value of the coal, Q; and the fuel volatility, V. The MVs are the pressure of primary air, PA; the jaw opening of the secondary air register, SE; the jaw opening of the tertiary air register, SR; and the oxygen content in fuel gas, O2. The output variable is NOx emission. The structure of the model is shown in Fig. 1.
2.2Establishment of NOx emissions LS-SVM (Least squares support vector machine) model
A total of 105 sets of modeling data were obtained under steady operation conditions by a large number of orthogonal experimental [7] and historical data sources [11, 12]. A selected portion of the modeling data is presented in Table 1.
The first 90 sets of data were selected as the training sample set, and the remaining 15 sets of data were selected as the test sample set. LS-SVM [8, 9] were used to establish NOx emission models. The modeling process is described in Equation 1.
(1)
Figure 2 shows the training sample error of the LS-SVM model, and Fig. 3 demonstrates the test sample error of the LS-SVM model. Absolute error was calculated according to Equation 2, relative error was calculated according to Equation 3, and the LS-SVM model error results are detailed in Table 2.
(2)
(3)
In Equations 2 and 3, e A is the absolute error, e R is the relative error, y P is the predictive value, and y P is the true value.
As shown in Table 2, the absolute error and the relative error of both training samples and test samples are exceptionally small. The output of the LS-SVM model is significantly close to the actual data, which indicates that the LS-SVM model is a useful approach in terms of performance, popularizing ability, and predictive accuracy.
3Establishment of expert rule base based on the nonlinear optimization
3.1Division of DV space
Three variables, L, Q, and V, were selected to constitute the DV space. First, the variables were normalized to fit in the same range [–1, 1]. The data was then converted to a dimensionless number. The ranges of standardized variables are denoted as domain UL, UQ, and UV. According to engineering practice, five fuzzy subset centers were assigned, including –1, –0.5, 0, 0.5, and 1. The given fuzzy subset center belongs to the domain [–1, 1]. The isosceles triangle membership function curve was then selected (Fig. 4), and the UL, UQ, and UV domains were simultaneously divided into five fuzzy subsets. The fuzzy word set was {VS, LS, MI, LB, VB}, where VS is Very Small, LS is Little Small, MI is Middle, LB is a Little Big, and VB is Very Big.
Domains UL, UQ, and UV constitute a three-dimensional Euclidean space, which can also be referred to as an “ordered pair” (L, Q, V) [5]. The given fuzzy subset center combines freely as the form (L, Q, V). Each (L, Q, V)represents a set of combustion conditions. Since each fuzzy subset center represents a corresponding fuzzy subset, the 125 freely-combined sets of combustion conditions can cover all actual combustion conditions. Each “ordered pair” (L, Q, V) also represents a corresponding subspace.
3.2Establishment of expert rule base based on nonlinear optimization
Each subspace center corresponding to the optimal combustion mode based on the NOx emission LS-SVM model can be obtained by the nonlinear optimization [1, 3, 18], i.e., the MV optimal value corresponding to 125 sets of freely-combined fuzzy subset centers is obtained. To ensure the stability and safety of the unit operation, each MV must be adjusted to fall within a certain range. Therefore, each MV must be within the actual adjustment range in the optimizing process. The adjustment ranges of the MVs are shown in Table 4.
According to the MV adjustment ranges, 125 sets of fuzzy rules were obtained [13], which were used to constitute the expert rule base [16]. The form of fuzzy rules in the expert rule base can be expressed as:
(4)
A portion of the expert rule base data is shown in Table 3.
4Fuzzy optimization control
4.1The structure of optimization control system
After fuzzification and related fuzzy inference achieved by the fuzzy inference engine and expert rule base, the fuzzy linguistic variables are defuzzified to obtain the exact optimal MV value for each set of actual inputted DVs. The structure of the optimization control system is shown in Fig. 5.
4.2Fuzzification for DV
Equation 5 is first used to standardize each input variable:
(5)
After standardization, each of the three input DV corresponding fuzzy subset membership degrees are obtained by the isosceles triangle membership function (Fig. 5). The process of DV fuzzification is then complete.
4.3Design of fuzzy inference engine
The fuzzy rules in the expert rule base are constituted by antecedent parameters [14] and consequent parameters. Antecedent parameters are freely combined fuzzy subset centers that are used to divide the DV space, and consequent parameters are corresponding optimal MV values obtained by nonlinear optimization, which can be expressed as DV ⇒ MV opt . Additionally, the membership degree of every fuzzy subset center corresponding to fuzzy sets is 1. Equation 6 can be used to calculate the membership degree of each set of DV corresponding to fuzzy rules.
(6)
After fuzzification of each DV inputted, there are two sets of fuzzy subsets that increase the corresponding membership degree to a positive value. Since the selected DV has three variables, there are eight types of fuzzy subset combinations, making each set of DV-corresponding fuzzy subset membership degree greater than zero. This can be described by corresponding fuzzy variables and level variables; each set of input DVs corresponds to eights sets of fuzzy rules in the expert rule base, which can be expressed as DV i ⇒ MV i opt (i = 1, 2, ⋯ , 8). Equation 6 is used to calculate the membership degree of each set of DVs corresponding to fuzzy rules. Each calculated value represents the membership degree of the DV input corresponding to fuzzy rules in the expert rule base.
4.4Defuzzification
The fuzzy variables are converted to final exact values by a weighted average judgment method [6, 15], demonstrated by the following equation:
(7)
5Simulation study
The PC machine for simulation had the following characteristics: operating system, Windows 7; CPU, 2.5 GHz; and RAM, 4GB. A total of 105 sets of modeling data were selected, and the corresponding NOx emissions derived from the method based on nonlinear optimization and the method based on fuzzy optimization control were compared (Fig. 6).
The predicted results based on fuzzy optimization control and the actual value are significantly close. The absolute error is 21.60896, and the relative error is 4.1396% . In addition to the similarity of results, they both meet environmental requirements. Moreover, the average time for each step of online optimization based on nonlinear optimization is 17.2s, while only 0.03s are required for each step of online optimization based on the fuzzy optimization control. It is evident that the online real-time optimization performance based on fuzzy optimization control is superior to the method based on nonlinear optimization.
6Conclusions
Fuzzy optimization control based on the nonlinear optimization of power plant boiler NOx emissions can be described as follows: First, the DV space is divided into a certain number of subspaces. Each subspace center obtains an optimal corresponding combustion mode by offline nonlinear optimization, thereby forming a complete expert rule base. The corresponding optimal MV is then quickly obtained online by fuzzy interference for each inputted DV. The fuzzy optimization control for the boiler combustion adjustment is then realized.
Both the method based on nonlinear optimization and the method based on fuzzy optimization control can produce the same control effect. However, the optimization process based on the fuzzy optimization control method offers a simpler algorithm and fewer calculations, is less time-consuming online, and is more suitable for the real-time application of combustion adjustment.
The combustion model established by the orthogonal experiment can only reflect the current characteristics of the boiler; once the boiler equipment, coal or environmental factors change, the model can no longer accurately reflect the boiler situation. Thus, further research must be conducted to improve the adaptive capacity of the model.
References
1 | St John D, Samuelsen S (1995) Optimal, active control of oxides of nitrogen (NOx) emissions from a natural gas-fired burner using a simple genetic algorithm Proceedings of the 4th IEEE Conference on Control Applications 673 678 |
2 | Ean , Seok , Wang KH, Lee Jin S (2006) A combustion control modeling of coke oven by swarm-based fuzzy system SICE-ICASE International Joint Conference 2006 2503 2507 Bexco, Busan, Korea |
3 | Kolsi E, Derbel N (2010) Fuzzy optimal control of nonlinear systems 7th International Multi-Conference on Systems Signals and Devices (SSD) 1 4 |
4 | Yin E (1994) Fuzzy Control Research for coal powder boiler combustion system Industrial Control Computer 4: 13 15 |
5 | Li H, Li XZ, Li S (2007) A three-dimensional fuzzy control methodology for a class of distributed parameter systems IEEE Transactions on Fuzzy Systems 3: 15 470 481 |
6 | Deng H, Yeh C-H (2006) Simulation-based evaluation ofdefuzzification-based approaches to fuzzy multiattribute decision making Systems, Man and Cybernetics, Part A: Systems and Humans, IEEE Transactions on 36: 5 968 977 |
7 | Liu H, Wang M (2010) Study on optimizing proportion of the briquette with orthogonal experiments Power and Energy Engineering Conference (APPEEC), 2010 Asia-Pacific 1 4 |
8 | Liu L, Liu H, Wang H (2012) Adaptive decoupling control systems based on SVM for large supercritical CFB boilers combustion system 10th World Congress on Intelligent Control and Automation (WCICA) 3401 3406 |
9 | Feng L, Gui W, Yang F (2009) Soft-Sensor Modeling on NOx Emission of Power Station Boilers Based on Least Squares Support Vector Machines 2009 Second International Conference on Intelligent Computation Technology and Automation 462 466 |
10 | Yin L, Wang M, Shang Q (2014) Power plant boiler combustion optimization based on support vector machine and particle swarm algorithm Boiler Technology 45: 4 13 17 |
11 | Zhong RY, Huang GQ, Lan S, Dai Q, Chen X, Zhang T (2015) A big data approach for logistics trajectory discovery from RFID-enabled production data International Journal of Production Economics 165: 260 272 |
12 | Zhong RY, Dai QY, Qu T, Hu GJ, Huang GQ (2013) RFID-enabled Real-time Manufacturing Execution System for Mass-customization Production Robotics and Computer-Integrated Manufacturing 29: 2 283 292 |
13 | Zhong RY, Huang GQ, Lan SL, Dai QY, Zhang T, Xu C (2015) A two-level advanced production planning and scheduling model for RFID-enabled ubiquitous manufacturing Advanced Engineering Informatics 10.1016/j.aei.2015.01.002 |
14 | Anandhavalli S, Srivatsa SK (2012) Evaluating the quality of test data under the influence of vigilance parameter in flexfis International Conference on Software Engineering and Mobile Application Modelling and Development (ICSEMA 2012) 1 8 |
15 | Halgamuge S (1998) A trainable transparent universal approximator for defuzzification in Mamdani-type neuro-fuzzy controllers IEEE Transactions on Fuzzy Systems 6: 304 314 |
16 | Mitsuishi T, Kawabe J, Wasaki K, Kawamoto P, Shidama Y (1999) Membership functions in L2 space and its applications to fuzzy optimal control Systems, Proceedings of 1999 IEEE International Conference on Man, and Cybernetics (IEEE SMC ’99) 51 55 |
17 | Liu X, Chai T, Liu H (1998) Fuzzy control strategy for power boiler combustion system Acta Automatica Sinica 24: 7 533 538 |
18 | Peng X, Wang P (2009) An improved multi objective Genetic Algorithm in optimization and its application to high efficiency and Low NOx emissions combustion, Asia-Pacific Power and Energy Engineering Conference 2009 (APPEEC 2009) 1 4 |
19 | Gao Y (2005) Boiler combustion system optimization control based on expert system Power Automation Equipment 25: 5 27 29 |
20 | Gu Y (2012) Power plant boiler combustion optimization based on support vector machine Tsinghua University Ph.D. Dissertation |
21 | Zhang Z (1995) Fluidized bed boilers combustion system based on Expert Fuzzy Control–A computer software controlsystem Journal of Guizhou Academy of Industry 24: 6 22 28 |
22 | Wang Z, Li J, Sun W (2008) Boiler combustion optimization method based on Neural Networks and Genetic Algorithm Journal of North China Electric Power University 35: 1 14 17 |
23 | Wen ZY, Song JH (2004) Effect of boiler combustion adjustment for nitrogen oxide emissions Guangdong Electric Power 17: 4 25 28 |
Figures and Tables
Fig.1
Structure of the model.
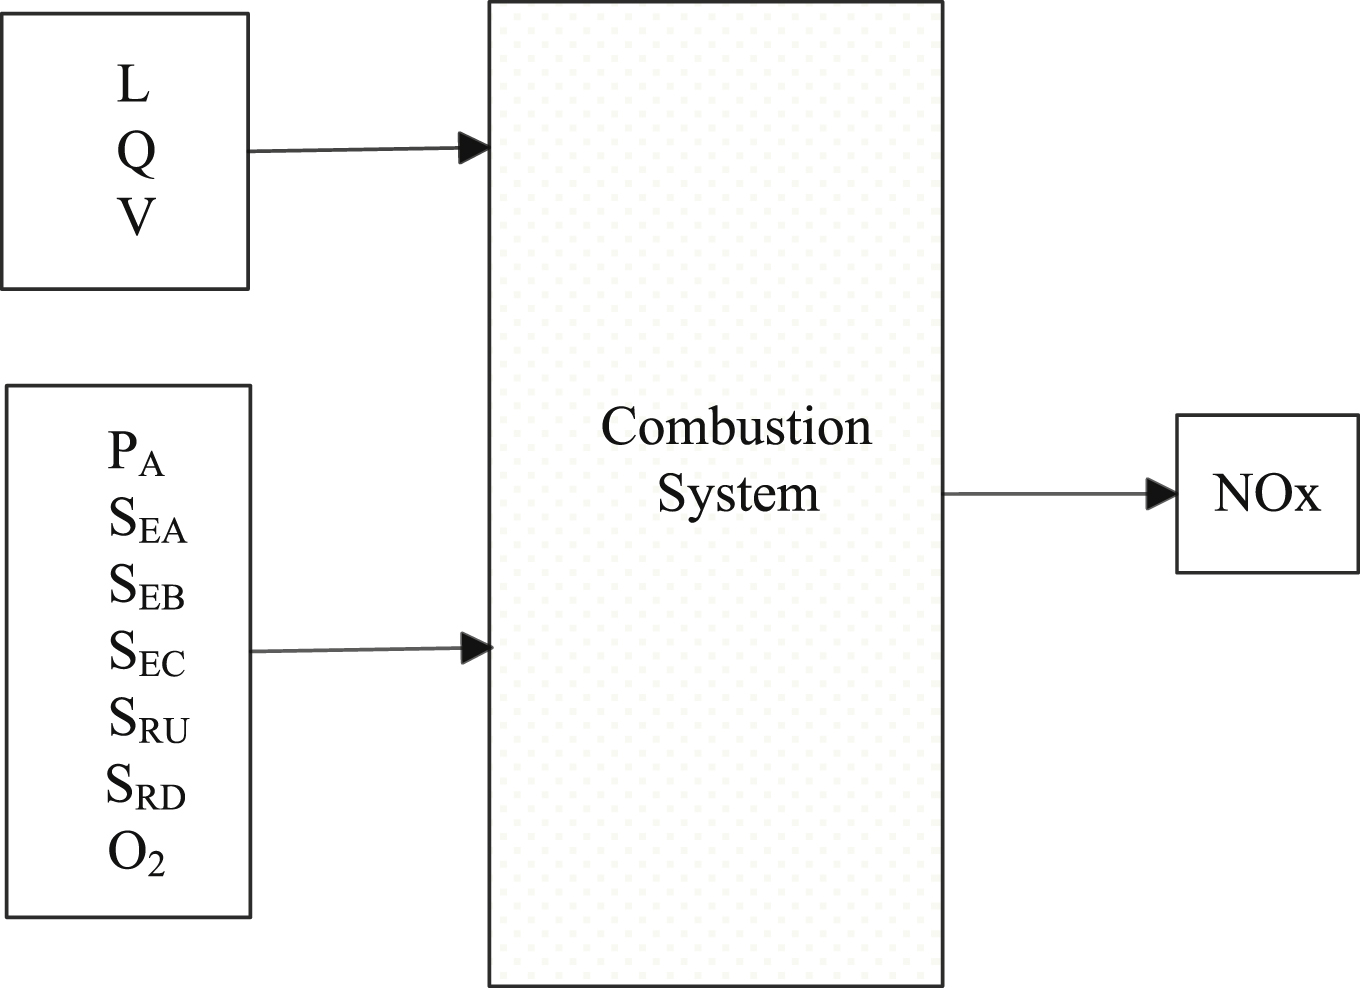
Fig.2
Training sample error of LS-SVM model.
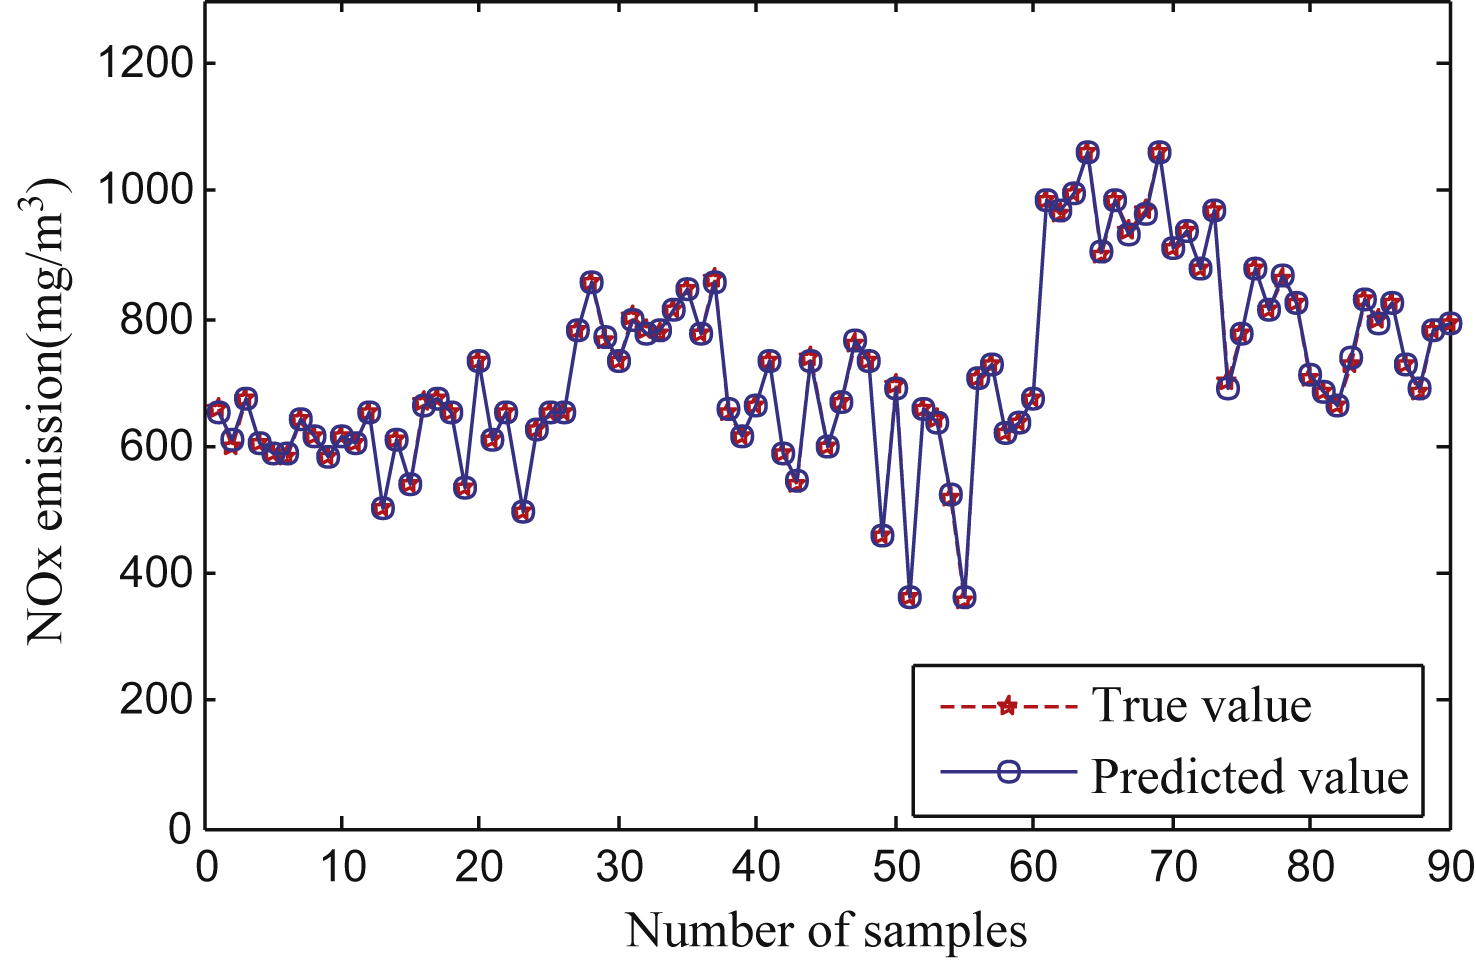
Fig.3
Test sample error of LS-SVM model.
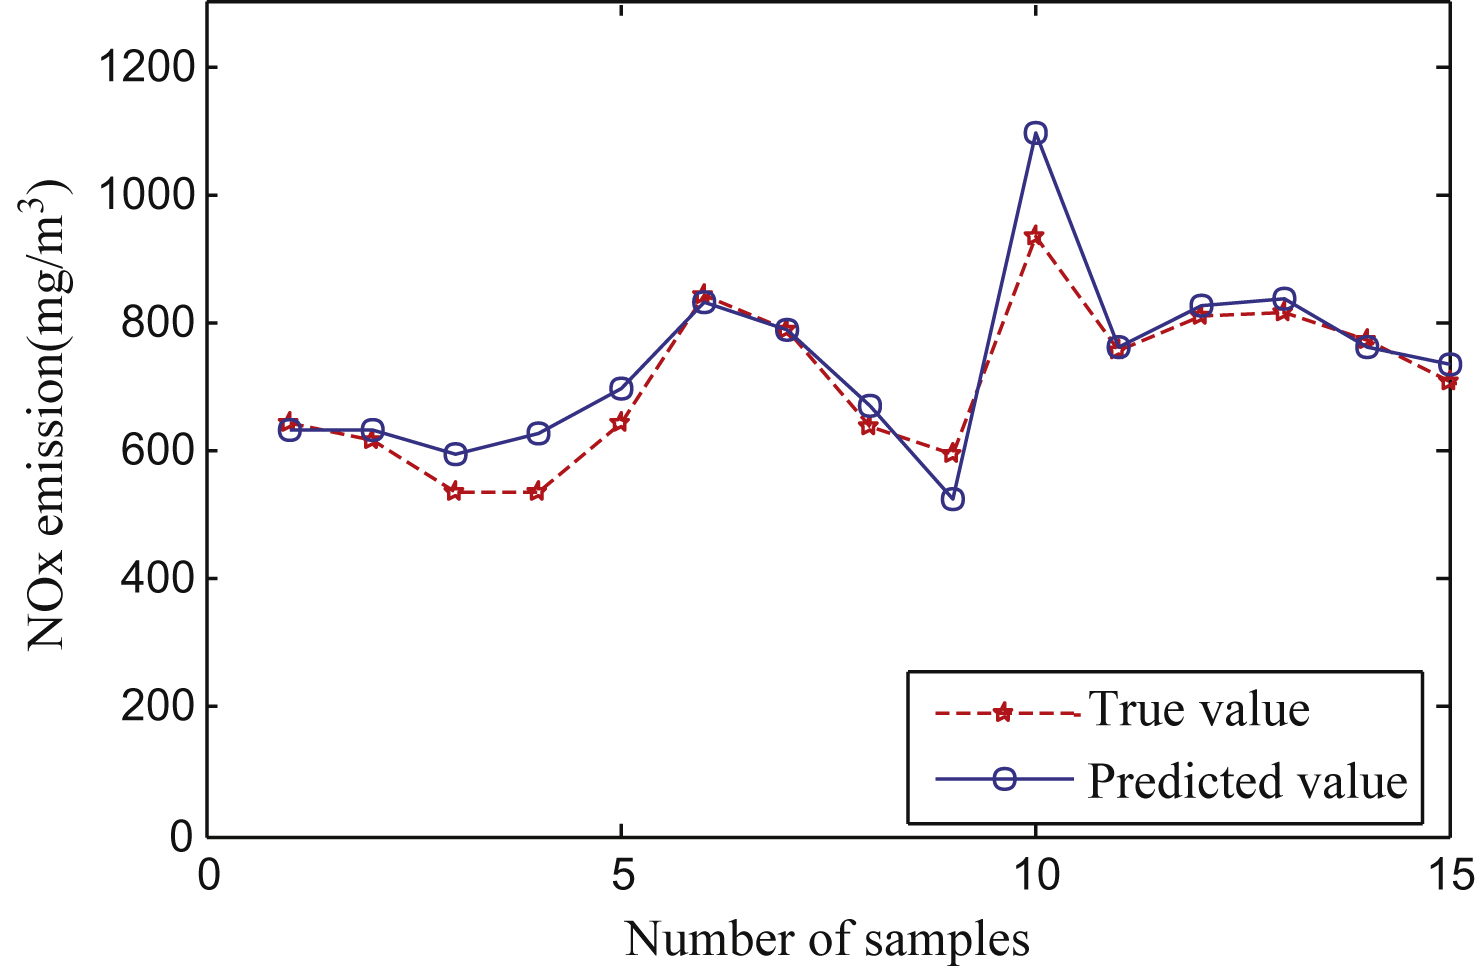
Fig.4
Isosceles triangle membership function curve.
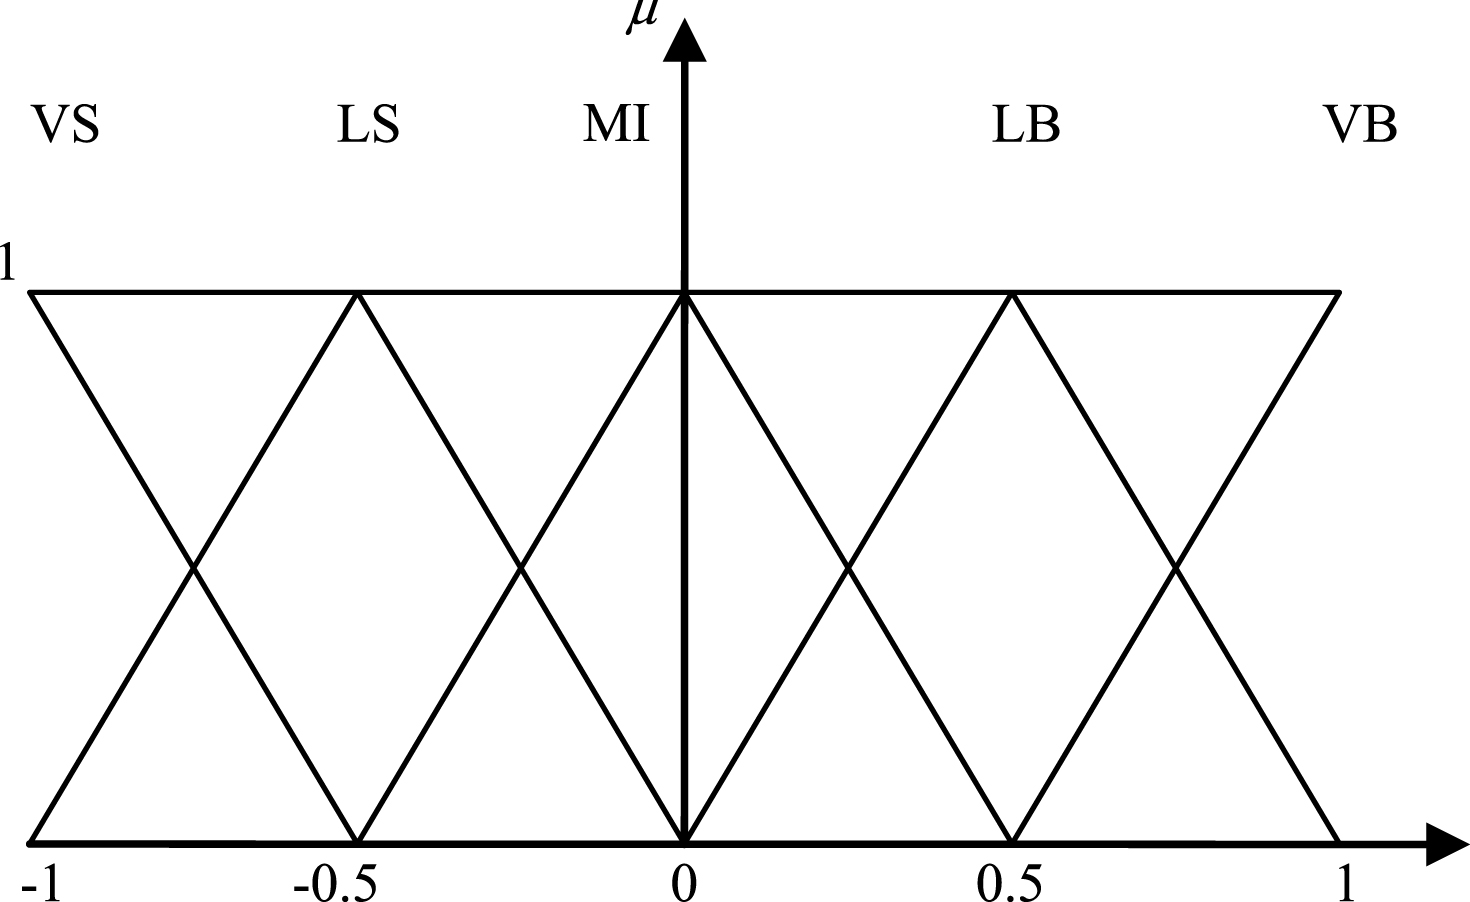
Fig.5
Structure of the optimization control system.
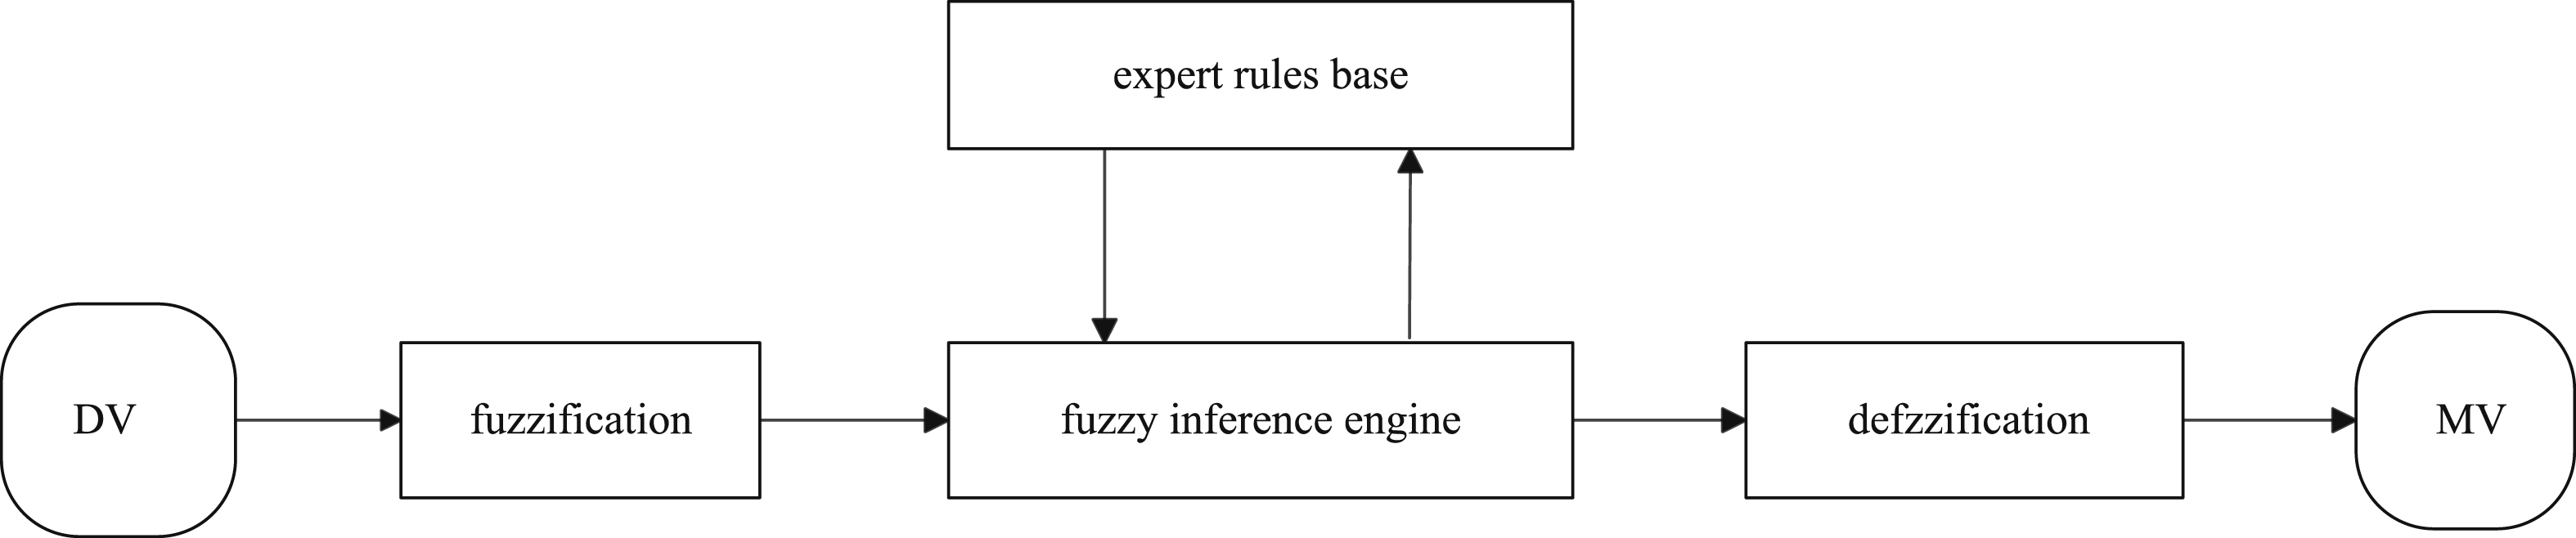
Fig.6
Corresponding NOx emissions obtained by the fuzzy and nonlinear optimization methods.
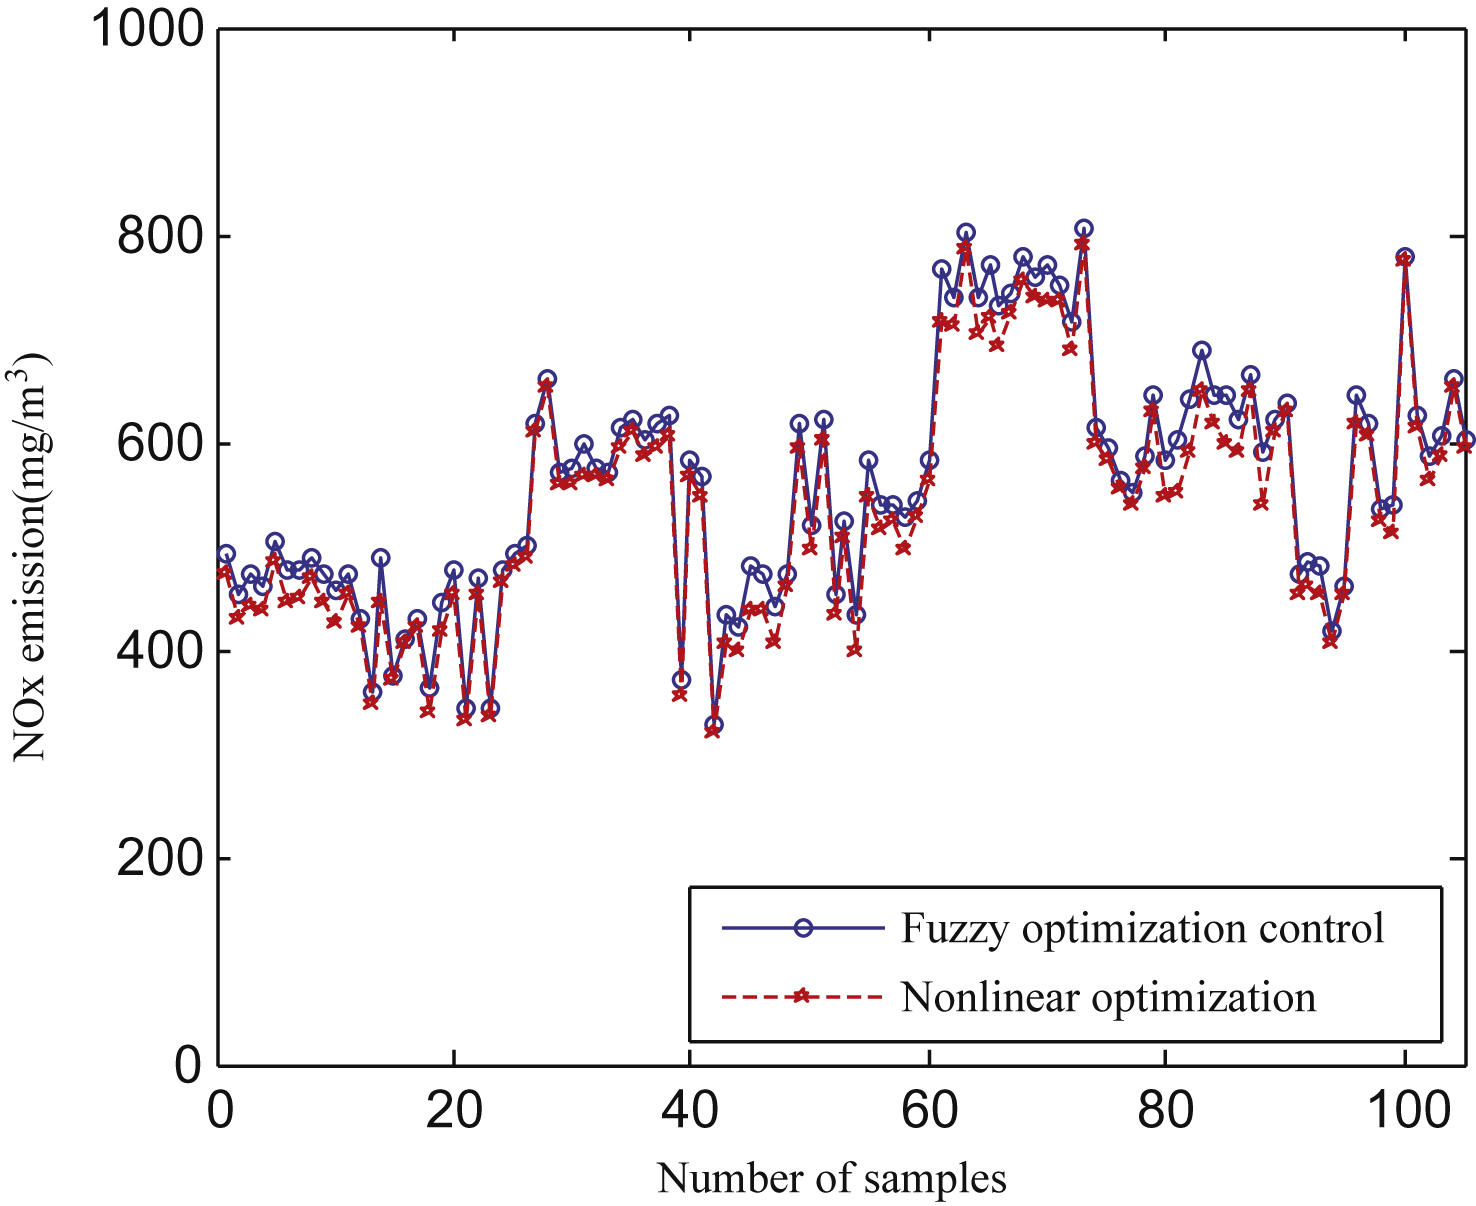
Table 1
A portion of the total 105 sets of modeling data
| DV | MV | Output | ||||||||
| L (MW) | Q (%) | V (%) | PA (KPa) | SEA (%) | SEB (%) | SEC (%) | SRU (%) | SRD (%) | O2 (%) | NOx (mg·m–3) |
| 238.78 | 22.79 | 9.02 | 3.46 | 41 | 7 | 30 | 20 | 50 | 3.33 | 675.82 |
| 238.87 | 22.65 | 8.95 | 3.46 | 41 | 1 | 42 | 20 | 50 | 3.33 | 604.63 |
| … | … | … | … | … | … | … | … | … | … | … |
| 254.04 | 21.68 | 9.44 | 3.1 | 41 | 5 | 30 | 50 | 100 | 3.71 | 733.14 |
| 254.43 | 19.36 | 9.77 | 2.94 | 41 | 10 | 42 | 20 | 50 | 2.69 | 608.85 |
| … | … | … | … | … | … | … | … | … | … | … |
| 348.3 | 21.02 | 9.27 | 4.13 | 67 | 30 | 55 | 33 | 57 | 1.16 | 708.77 |
| 348.92 | 21.08 | 9.46 | 3.85 | 80.5 | 30 | 47 | 33 | 45 | 1.26 | 685.34 |
| … | … | … | … | … | … | … | … | … | … | … |
Table 2
LS-SVM model error
| Training sampling error | Test sample error | ||
| Absolute error | Relative | Absolute Error | Relative |
| (mg·m–3) | error (%) | (mg·m–3) | error (%) |
| 1.5760 | 0.23 | 38.6923 | 5.73 |
Table 3
Selected expert rule base data
| DV | MV | ||||||||
| L (MW) | Q (%) | V (%) | PA (KPa) | SEA (%) | SEB (%) | SEC (%) | SRU (%) | SRD (%) | O2 (%) |
| 238.78 | 22.79 | 9.02 | 3.83 | 37.76 | 1.02 | 67.81 | 64.65 | 20.05 | 3.00 |
| 238.87 | 22.65 | 8.95 | 3.70 | 48.26 | 2.34 | 68.50 | 63.95 | 20.41 | 3.03 |
| … | … | … | … | … | … | … | … | … | … |
| 302.47 | 22.31 | 9.94 | 3.46 | 92.50 | 1.67 | 69.96 | 53.90 | 21.24 | 3.01 |
| 302.48 | 20.93 | 9.60 | 3.09 | 91.97 | 1.32 | 64.99 | 50.52 | 79.66 | 3.18 |
| … | … | … | … | … | … | … | … | … | … |
| 291.08 | 23.34 | 9.00 | 2.94 | 93.51 | 1.18 | 69.97 | 46.84 | 79.96 | 3.53 |
| 291.48 | 23.74 | 8.80 | 4.04 | 30.73 | 1.16 | 69.69 | 62.37 | 20.96 | 3.02 |
| … | … | … | … | … | … | … | … | … | … |
Table 4
Adjustment ranges of MVs
| MV | PA | SEA | SEB | SEC | SRU | SRD | O2 |
| (KPa) | (%) | (%) | (%) | (%) | (%) | (%) | |
| Upper Limit | 2.9 | 30 | 1 | 30 | 5 | 20 | 3 |
| Lower Limit | 4.2 | 94 | 38 | 70 | 65 | 80 | 4.5 |


