
Visual assessment of BIPV retrofit design proposals for selected historical buildings using the saliency map method
Abstract
With the increasing awareness of energy efficiency, many old buildings have to undergo a massive facade energy retrofit. How to predict the visual impact which solar installations on the aesthetic cultural value of these buildings has been a heated debate in Switzerland (and throughout the world). The usual evaluation method to describe the visual impact of BIPV is based on semantic and qualitative descriptors, and strongly dependent on personal preferences. The evaluation scale is therefore relative, flexible and imprecise. This paper proposes a new method to accurately measure the visual impact which BIPV installations have on a historical building by using the saliency map method. By imitating working principles of the human eye, it is measured how much the BIPV design proposals differ from the original building facade in the aspect of attracting human visual attention. The result is directly presented in a quantitative manner, and can be used to compare the fitness of different BIPV design proposals. The measuring process is numeric, objective and more precise.
1Introduction
1.1The Swiss urban planning law and solar installations
The Swiss Raumplannungsgesetz RPG (urban planning law) has been published in order to prevent the urban sprawl and to fully utilize the existing urban areas before occupying new, untouched rural lands. Generating clean energy with large-scale solar parks by destroying existing rural landscapes is therefore definitely not encouraged. Instead, small-scale building-integrated photovoltaic (BIPV) installations on the existing building facades are preferred. However, BIPV installations need to follow certain restrictions.
According to the RPG article 18a that came into force on May 1st 2014, it is stated that “Solaranlagen [...] dürfen solche Denkmäler (Kultur- und Naturdenkmälern) nicht wesentlich beeinträchtigen” (Solar installations [...] should not significantly influence the original appearance of the cultural and natural heritages) (RPG, 2014). ‘Cultural heritage’ hereby refers to historical buildings that are selected by the individual Swiss Cantons (Swiss Federal Constitution, 2014) and (to be) put into the cantonal inventory list of historical buildings. RPG article 18a was proposed with the purpose to ensure both a careful integration of new clean energy and protection of the heritage of Swiss urban and nature landscape. Regarding the historical buildings, aside from the RPG article 18a, the government has also published a document on their website, giving suggestions on the sensitive issues that a renovation work on a historical building may face (Bundesamt für Energie & Eidgenössische Kommission für Denkmalpflege, 2009). The general attitude of this document is to encourage keeping the historical buildings as original as possible, and the change after the solar facade renovation should be as less as possible compared to the buildings’ original state.
However, the exact meaning of the expression ‘not significantly’ in the RPG article 18a has been left to each cantonal/local authority to define. In this case, local authorities can refer to the canton government, commune (Gemeinde) or the local cultural heritage preservation department (Denkmalschutz). Some cantons have published guidelines on how to install solar panels on the house roof/facade so as to smoothen the process of solar installation applications (Kanton Basel, 2013, 2012; Kanton Luzern, 2014; Kanton Thurgau, 2009). In the guideline brochures, suggestions are being made so that the solar panels will ‘not significantly’ affect the existing historical building.
1.2Problem statement
The solar installation guidelines for historical buildings from the Swiss cantons are putting a lot of weight on its appearance rather than on its construction, and guidelines are mostly interpreted with semantic and qualified descriptors. The direct result of RPG Article 18a and its derivatives is that people of different backgrounds have different understandings on how solar panels are ‘not significantly’ affecting the historical buildings and whether they co-exist harmoniously or not. The biggest barrier for the solar installation often comes from local authorities with their disagreement on the changed appearance on the original building facade, leading to confusion and conflict between them and the applicants (Von Arx, 2013; Häne, 2012; Ludin, 2013; Stadt Zürich Hochbaudepartement, 2008; Vitelli, 2013; Zurbriggen, 2009).
The main reason for the conflict is because the applicants (building owner, architect and solar engineers etc.) and local authorities (e.g. cultural heritage preservation department) often have different interests in this matter. The building owners and the engineers prefer cost- and energy-efficiency of the solar installation, and attenuate its visual aspect subconsciously. Architects may weigh cost and energy-efficiency equally with the visual aspect of the building, while the cultural heritage preservation department focuses entirely on the visual aspect and harmony of the solar installation and the existing building (see Fig. 1).
Here people deal with the co-existence of qualified (visual) and quantified (cost, energy) descriptors. Qualified descriptors hereby refer to linguistic descriptions such as ‘good’, ‘ugly’, ‘not harmonious’ etc. to describe how one feels about the visual aspect of the solar installation. Quantified descriptors refer to energy conversion, cost etc. that can be presented with numbers. The drawback of a qualified and relative descriptor is that different preferences, different cases and different persons will have different opinions about what is called that the solar installation is ‘not significantly’ affecting the existing historical building. It is relative, subjective and not always reasonable. Quantified descriptors, on the opposite, are absolute, objective and the scale do not vary according to the case, situation or person. The co-existence of two entirely different value systems can lead to conflicts and hence the failure of the project. In order to guarantee a reasonable judgment, a coherent value system with a fixed evaluation scale should be developed. One way to do this is to develop a transformation system that can translate the qualified, subjective descriptor into a quantified, objective one, so as to ensure that everything is objective and absolute. In this paper, a method to quantify the term ‘significance’ is introduced, so as to be able to quantify the word ‘not significantly’ subsequently.
1.3Current approaches
Even though this paper deals with the visual assessment of BIPV installation, literature on visual assessments of both photovoltaics and solar thermal installations is being reviewed so as to gain a holistic perspective in this matter. The words solar panel and solar installation therefore refer to both photovoltaics and solar thermal installations.
The architectural and visual values of solar panels as a new building element are being discussed widely. Mostly people discuss whether the solar panel is well integrated into its environment (the building facade) by starting from evaluating its material, colour, form and detail integration, which is already an indirect investigation of the term ‘not significantly influencing the appearance of cultural heritage’ in an intuitive way. Guidelines and recommendations are developed on how to evaluate solar panels in a holistic manner (Frontini et al., 2013; Munari Probst & Roecker, 2009, 2011, 2012). BIPV is being analysed by dividing their main characteristics into three main categories – functional, constructive and formal, where the functional category includes the basic building envelope function and solar energy collection ability, questioning whether the BIPV product fulfil its multifunctional purpose as a facade element. The constructive category cares about whether the BIPV are integrated well into the overall facade construction. The formal category is evaluating the solar panels on sub-categories such as shape & size flexibility, pattern, colour, joint/frame, dummy part availability. The assessment gives + for positive,±for mean and – for negative evaluation of the above mentioned aspects. The result for a solar panel product is produced by listing all the categories in a list with + and – symbols. The evaluation process is made manually and intuitively, and offers three grades (positive, mean and negative) for each aspect.
Another way to discuss the term ‘not significantly’ is by investigating the visibility of the solar panels, namely to assess whether the solar panels are visible from the streets or not. This method was developed by using simple 2D geometry (Dessi, 2013). Others also focus on the visibility but have used a different approach. By adapting the Gaussian probability function, the probability of noticing the solar panel within the human visual scene is being calculated from a pure mathematical point of view (Xu, 2014). Both approaches, however, are radically simplified methods and only take the visibility element into consideration, where the colour, reflectivity, material properties, details of the solar panel and the overall building environment are omitted.
In another research, daylight reflection issues of BIPV are being singled out to study their impacts on the visual appearance of the building. By using Radiance software (WardOthers, n.d.) and annual weather data (Wittkopf et al., 2014; Yang et al., 2013), one is able to quantify whether the BIPV installation is ‘significantly’ visible by the amount of daylight reflection it produces. This kind of research only covers one small part of the visual aspect of solar facade and hasn’t taken the attention ability of human eye into consideration.
Another method covers a more complex energy refurbishment assessment for historical buildings with solar panels system. With the goal of achieving better visual results, one should aim for co-planarity, respect the lines of the existing building, shape, grouping, accuracy and visibility while installing the solar panels on the building envelope, on a difficulty scale ranging from 1 to 3, with 1 meaning that the goal is easy to accomplish, and 3 meaning very difficult to accomplish (López & Frontini, 2014). In this case, the evaluation process is different for each architecture, because each historical building has its unique aesthetic difficulties when it comes to solar panel installation. Therefore the standard of this method varies from case to case, and the deciding process of the difficulty scale is also subjective.
A more sophisticated method sets up a holistic benchmark for ‘good’ BIPV integration (Yu et al., 2009). The overall BIPV evaluation is calculated by the multiplication of the separated evaluation results of electricity generation, building integration and BIPV combined benefits, then multiply the result with a weight that comes from the evaluation of the aesthetic evaluation. The weight is higher when the BIPV is more appropriately installed, and lower when poorly installed, so that the distinction can be made that even when different BIPVs fulfil the same basic function, but by achieving different aesthetic results, each of them can still have distinctive overall results. The aesthetic weight is given based on evaluating the BIPV on items such as ‘pleasantness’, ‘uniqueness’, ‘specialness’, ‘obviousness’ etc. Those terms are qualified descriptors that do not have explicit nor quantified explanations, and the judgment therefore is flexible and subjective. Other similar BIPV evaluations are also available (Lucchi et al., 2014; Vassiliades et al., 2014).
1.4Limitations and challenges
From the examples in Section 1.2 it can be inferred that even though a better energy efficiency is the ultimate goal, normally it is the appearance of the historical buildings that stands in the spotlight. Its importance even outranks the other aspects of the historical buildings.
Therefore, despite the fact that most of the literature above has not referred specifically to the term ‘not significantly’, the evaluations all have the same goal, which is to make the solar installation exist with the existing building in harmony, or in other words – ‘not significantly affecting the cultural heritage’ in its appearance.
It is apparent from the literature review that regarding the ‘significance’ of solar installation on the building facade, it is often tried to transform the grading of linguistic descriptors into numeric ones. Usually set 1 with qualified terms is given (such as ‘bad’, ‘medium’, ‘good’), and each one of them is mapped into set 2 with quantified numbers (e.g. bad = 0, medium = 1, good = 2 and similar). There are two disadvantages with this kind of transformation method. One is that each person has his own opinion about the qualified terms. That is to say that every individual has his own subjective, individual and flexible opinion about what is called ‘bad’, ‘medium’ or ‘good’. The other drawback is that a reasonable, unified mapping process is lacking. Each author can decide the composition of set 1, set 2 and the mapping method based on his need, without having any theoretic reference for the mapping method, making it impossible to objectively compare the visual aspect of solar panel installations of different projects with a unified parameter.
Therefore considering these two disadvantages mentioned above, two things need to be investigated:
a. Is there a way to quantify the term ‘not significantly’ for BIPV in the context of historical buildings?
b. For the visual aspect, is there a reasonable, unified mapping process from set 1 (qualified descriptors) to set 2 (quantified descriptors) available?
2Saliency maps and applications
2.1Saliency
The English Oxford Dictionary defines the adjective salient as ‘most noticeable or important’. Saliency refers to the noticeability of an object (pixel, person etc.) within its visual environment. The saliency map is therefore a 3D map indicating the probability of obviousness and noticeability of each point within the human vision field.
2.2Saliency maps
Humans have the ability to rapidly scan through a certain visual field (25 to 50 ms per item) and recognize an object that is standing out from their environment, which relies solely on the basic instinct of human nature and is called the ‘bottom-up’ processing of human attention. This attention mode is developed during evolution so as to detect the potential danger in the surrounding environment. The second attention mode is the search for objects that are of interest to the person. With pre-selection criteria that interest him, it is called the ‘top-down’ processing. In this mode, the human can be in charge of his attention selection criteria. The speed of this visual scanning is much slower – 200 ms or more per item (Itti & Koch, 2001).
The concept of saliency map was introduced by Koch and Ullman (Koch & Ullman, 1985), where they assume that the higher the conspicuity (clear visibility) of a location in the visual scene, the higher the firing of the neuron in the eyes. This is based on the ‘bottom-up’ theory. Later, they have refined their approach where they distinctly define the early visual features of ‘bottom-up’ attention to be the intensity, the colour and the orientation of the input image (see Fig. 2) (Itti, Koch, & Niebur, 1998). Each of these features then will undergo a process called the ‘centre-surround’ operation, which is an imitation of the way the retinal ganglion cells’ receptive field (a part of the human eye) works – each receptive field is divided into the ‘centre’ area, and a concentric ring, the ‘surround’ area. If the light intensity on those two areas is different, then it will cause the eye to respond. E.g. a single light beam might increase response of the cell (difference in centre and surround areas), while an overall brightness in the scene (less difference between light intensities in centre and surround areas) would weaken the response (Hubel, 1995).
In this way contrast and hence edges of the objects are calculated. After the normalization processes, so as to globally promote maps that have small values but strong peaks, and discourage maps that have overall high values, the feature maps will be combined into three conspicuity maps. Those will be again linearly combined into a final saliency map. On the scale from 0 to 1, the higher the value of a spot, the more likely the human eye is noticing this spot (see Fig. 3).
They have also proposed a Winner Take All (WTA) mechanism. The ‘bottom-up’ saliency map is generated by iterative calculations of the colour, intensity and orientations value. At the beginning of each iteration, the most salient spot from the last iteration will be left out. This mechanism inhibits the saliency modelling returning to the same conspicuous place in the visual scene repeatedly. Instead, it allows the modelling to move to the next salient place in the next round of calculation.
The Itti-Koch saliency map is based on the theory of bottom up processing of human attention. Many other kinds of models are being developed after that, with Itti-Koch’s principle as the basis (Borji & Itti, 2013). A benchmark developed by Judd et al. (Bylinskii, Judd, Durand, Oliva, & Torralba, n.d.; Judd, Durand, & Torralba, 2012) lists all the existing saliency methods to evaluate the accuracy of those models. While e.g. the Judd Saliency model has achieved a much better accuracy score than the original Itti-Koch method, the principle of the Judd method is adding other pre-selection models on top of the Itti-Koch model, enhancing the recognition ability to identify cars, persons, faces and horizon within the visual scene (Judd, Ehinger, Durand, & Torralba, n.d.).
2.3Current application
The original goal of modelling the attention within a given visual scene is to simulate the realistic neural network models and to explain human attentional behaviours. This research area has been very active over the past 25 years (Borji & Itti, 2013). Aside from predicting the most salient spots within the human visual scene, inspired application of these models have also appeared. For example the saliency maps can help save the rendering time in high-fidelity image rendering. High quality rendering will only happen to places in an image where human attention is attached to, while rendering the rest of the image in low quality. This can result in a reduction of calculation time (Chalmers & Debattista, 2009; Longhurst, Debattista, & Chalmers, 2006). Another application is using the saliency map to help blind people in environments that are unfamiliar to them. This is achieved by using the three basic features (colour, intensity and orientation) to detect the indoor signs, after that the information can be translated into vocal or other kinds of information that are accessible to visually impaired people (Wang & Tian, 2011). Humanoid robots can benefit from saliency map information. The robot can be guided by the saliency maps, and its attention is then focused on the most obvious locations (Ruesch et al., 2008). The field of application for the saliency map is very broad. However, in architecture, its benefit has not been fully realized yet, even though architects are constantly heavily involved in visual experiments in their design works.
3Saliency map as visual assessment for BIPV installations
The research papers mentioned in part 1.3 all have the same ultimate goal, which is to make the solar panels exist in harmony with the existing building. To be more specific, the ‘popping out’ of the BIPV element is not desired and is to be avoided as much as possible. This is especially the case when it comes to BIPV installation on historical buildings, which is also the investigation object in this paper.
To answer the first question from Section 1.4 of this paper: the saliency map theory can provide a method to measure the ‘significance’ of BIPV in the context of historical buildings. The mapping process from what human vision is seeing (and hence feeling) to the quantification of the seeing/feeling is standardized, based on theories from biology, psychology and computer science, hence answering the second question. Moreover, a basis for numerical comparison can be provided. The saliency map theory can also objectively calculate the saliency difference with and without the BIPV installation in the visual scene. It can generate a comparison mechanism to cross compare several different BIPV designs on the same facade – which design is less conspicuous and exists more harmonious with the existing building facade – and decide the best design. This process would avoid the tedious procedure of having the human see the design first, feel it and then translate it in linguistic descriptor, transform the linguistic descriptor into numeric ones so as to make the evaluation of solar installation possible. Instead, an objective scale is used to decide the strength of change the BIPV has done to the building in the human visual scene, with the transformation of verbal descriptors to numeric descriptors omitted.
This paper adapts the Itti-Koch saliency method, because even though other advanced saliency methods, e.g. the Judd saliency method, are more accurate, the refinement criteria (face, people, car, horizon identification) may not be essential on architectural facade evaluations.
3.1Method
This assessment methodology is based on creating a reference rendering (‘as is’) and design proposal renderings (‘new’). The pre-processing stage includes digitally recreating historical buildings itself and different designs with BIPV on the computer as 3D CAD model. Renderings, which are computer-generated images, are being made from the models. The main processing work is calculating the saliency values of each rendering image. The post-processing step is to compare the saliency values of the pictures of the historical building before (‘as is’) and after BIPV installation (‘new’). After that, one can then see whether the BIPV are ‘not significantly’ enough to exist harmoniously with the existing building, and how much they have changed the existing building regarding attention-aspect. Since the general goal of the historical building protection is to change as less as possible, therefore a good BIPV design on the facade should cause as less saliency change in the visual scene as possible.
The specific workflow can be divided into five major steps (see also Table 1).
1) Capture the 2D photo ‘as is’
A photo of the building’s original state is taken. The viewpoint of the photo is set where there is the highest probability of seeing the building. Later the saliency of the visual scene will be investigated from this viewpoint.
2) Create the 2D rendering ‘as is’ as reference
3D digital models of the building are created. The photorealistic image that is produced from the 3D model is called rendering. All the important elements of the building facade are included in the model, such as the proportion, detail, colour, obvious texture etc. In creating the model, the face normal of the model surfaces always face outwards, so as to enable the later rendering with Radiance. The Radiance program is an advanced lighting simulation tool (Ward & Others, n.d.), and suits the purpose of rendering a photo-realistic picture well. The viewpoint of the rendering ‘as is’ is identical as the one of the photo ‘as is’.
3) Create the 3D BIPV designs and 2D renderings ‘new’
On the basis of the before-mentioned 3D model and viewpoint, building renderings with different designs (2D renderings ‘new’) of the BIPV installations are generated.
Since clear sky condition (CIE sky definition) will cause hard shadows and strong reflections in the renderings. They will have strong impact on the saliency maps. In order to avoid this situation, all the photos and renderings are made under overcast sky condition, which won’t result in hard shadows and exaggerated brightness. This enables the cross-comparison of saliency distribution between different designs (even solar installations on different buildings) under a unified condition that is independent of the daytime and location. After the rendering process, identical adjustments/optimization procedures are being applied to each rendering in order to make them more similar to the photo ‘as is’.
4) Saliency maps will be produced from the renderings ‘as is’ and ‘new’
Itti-Koch saliency map (Itti et al., 1998) are produced from the renderings ‘as is’ and ‘new’ by using a script written by Harel, Koch, and Perona (2006). The thus generated saliency map from the rendering ‘as is’ acts as the standard saliency map; its saliency values act as the standard saliency values.
5) Comparison between ‘as is’ and ‘new’ saliency values
Delta saliency maps are calculated by the difference between the standard saliency value and the saliency values from different design renderings ‘new’ (see formula (1)).
(1)
After comparison, the design with the smallest change in saliency values equals the least visual change through the BIPV installation, therefore the building is most similar to its original state, this design is then the most appropriate design for this historical building.
3.2Application
3.2.1The building
The building is a villa in Canton Nidwalden of Switzerland with the name ‘Seerose’. It was built around 1920 and is now under historical preservation level B, which means the house is considered to be integrated into the cantonal historical protection list later, but pending further investigation (Kanton Nidwalden & Fachstelle für Denkmalpflege, 2010). The villa is surrounded by a garden, with the entrance of the garden in the southwest and the Lake Lucerne in the immediate east vicinity (see Fig. 4).
The owner of the house, ‘ÜserHuus’, would like to install BIPV on the facade. In total, eight designs have been developed, each using ten solar panels with two variations in solar panel front glazing colour and four variations in layouts (see Fig. 5). There are four alternations in layout, which are each five panels below two windows; a horizontal continuous line under two windows, a cross and a vertically continuous line. On top of the layout variation, each also has its own variations in using two different BIPVs front glazing colour. Namely one is the traditional black photovoltaic (PV) with non-coloured front glazing, the other is black PVs with front glazing colour that is similar with the ‘old rose’ colour of the facade. All the BIPVs are installed on the southern facade.
Since this house is a private property and most people do not get to enter the garden, therefore the viewpoint chosen is when a person is standing at the main entrance and looking at the south facade of the house (Fig. 4, right side), which is the highest probability of the way the house is being seen. The photo and all the renderings are made from this viewpoint.
3.3Analysis
The visual scene of the human eye is rather rectangular, with the horizontal axis being longer, instead of having a square form and therefore the rendering size follows this aspect ratio. The original rendering pictures are being cropped with the proportion of 2 in length and 1 in height (image size 1181 × 591) due to this reason (see Fig. 6). The investigation area is emphasized on the area where the BIPV are being installed. The 2:1 proportioned rendering images, suits the human vision better on the one hand, on the other hand fits well into the investigation focus of the research. Saliency maps will be generated based on these cropped images. After the processing, the saliency map will be automatically resized to 148 × 74 (equals 10952 pixels in total), which is defined in the processing script (Harel et al., 2006).
After processing the images with the script written by Harel, Koch, & Perona (2006), saliency maps can be generated for the original building rendering ‘as is’ and all eight design renderings ‘new’ (see Figs. 7-9). While Fig. 8 provides an overall impression of the saliency value distribution, Fig. 9 can provide a more refined reading of the specific saliency values. On each saliency map ‘new’, the saliency values are given on a scale from 0 to 1, with 0 being the lowest probability of drawing people’s attention and 1 being the highest probability. Intuitively, it can be read from Figs. 8 and 9 that the highest peaks in saliency values come from the silhouette of the house, with values being approximately 0.6-0.9. The second highest peak comes from the porch area of the house because of its heavy black awning, with values varying from 0.5-0.6. The third obvious peak is caused by the black BIPV panels (regardless of their layout). They draw the most of the eye’s attention to themselves and cause the biggest change in attention distribution throughout the visual field, sometimes even topping the saliency value peaks from the building’s silhouette itself. The differences between each saliency map ‘new’ of BIPV with ‘old rose’ front glazings are not so straightforward. The numbers above each saliency maps in Figs. 8 and 9 show the average saliency value throughout each map. Even though it is stated that the average saliency value all stay within the range of 0.28-0.38, implying that the overall saliency value have not changed much, they do not reveal information about the peak values in the maps.
Therefore the delta saliency value between saliency map ‘as is’ and saliency maps ‘new’ is calculated, which can be achieved by the Equation (1). On the scale from 0 to 1, 0 means that there is absolute no change in saliency values between the saliency map ‘as is’ and saliency maps ‘new’, and 1 stands for the highest possible difference between these two kinds of maps. This delta saliency maps are shown in Fig. 10. The results proved our former intuitive readings from Figs. 8-9 to be right, that the black panels cause the largest saliency differences. The rest of the readings are still somehow blurred out, with a few vague white spots visible.
To make the deviance clearer, the pixels in the delta saliency maps that have a change in saliency value of more than 0.1 are counted (white area). Delta saliency values below the threshold of 0.1 are omitted because they are considered as noise that is produced during calculation:
(2)
The results are shown in Figure 11. The first line above each delta value map shows the percentage of white area in each map. Designs with black BIPV panels have more than 1000 pixels that have a change in saliency value, causing tremendous change in saliency distribution. The large white areas in the left of the delta value maps of column 1 reveal the special characteristic of saliency calculations – the saliency value of each point is calculated in relation with its visual environment. A change of colour, intensity or orientation will eventually lead to a butterfly effect – the saliency values of other points will also change accordingly. So we can conclude that an obvious change in BIPV glazing colour can cause the human eye to invest slightly more attention in the west facade of the villa.
Regarding the BIPV with ‘old rose’ glazing, the design in row 4, column 2 proved to be the one with the least pixel number (100) with changed saliency value. This means compared to other designs, this design will only cause a minor change in saliency value before and after the BIPV installation. The other design with similar result is the design in row 3 column 2, with 114 pixels having a change in saliency value.
In order to present the result in a clearer manner, the percentages of the pixels that have not changed in the saliency value in the saliency maps ‘new’ are being calculated (black area):
(3)
This is shown in the second line above each delta saliency map in Figure 11. This kind of result representation suits the purpose of keeping the historical building as original as possible better. The design in row 4, column 2 shows that 99.09% of the pixels in the rendering have stayed the same. BIPV designs with ‘old rose’ glazings generally have a rate of unchanged saliency value of more than 95% , while black BIPV designs generally have only less than 82% of pixels staying the same in saliency values. The higher the percentage of the unchanged pixel, the better the design is for the preservation of this historical building. This result is objective and the experiment results are reproducible at any time.
4Conclusion
This paper introduces a new way to evaluate the visual aspect of BIPV installations that take place on historical buildings. With the historical buildings as cultural heritage, they need to be kept as original as possible. Visually speaking, the installation of BIPV usually has negative impact on the historical building. In order to keep the negative impact below a certain threshold, many assessment methods are being developed. In common practice, the visual impacts of BIPV are mainly described linguistically, and later transformed into numerical descriptors, so as to be able to quantify those impacts. On the one hand, linguistic descriptors are subjective and qualitative, and on the other hand, when humans look at different BIPV designs, and compare them with the building’s original state, the differences are visible by the human eyes, but linguistic descriptors are not specific enough to describe those differences. Also the transformation of linguistic to numerical descriptors are not standardized. In this paper, the authors have found a way to objectively assess and quantify the visual impact of BIPV installation, where the transformation between linguistic to numeric descriptors is being omitted, and thus leading to a more reasonable judgment of whether the BIPV is ‘significantly’ influencing the existing building or not.
Since the saliency map is a neurobiological and psychological tool to predict human visual attention, it is used here to detect the conspicuity of the BIPV installations. First, 3D CAD models of the existing historical building and with different BIPV installation proposals are made. Renderings of the existing building (‘as is’) and design proposal with BIPV (‘new’) are being produced from Radiance software. Saliency maps are generated for each one of the above-mentioned renderings. The saliency map ‘as is’ is used as the reference saliency map. Differences in saliency values (delta saliency values) between the saliency map ‘as is’ and each one of the saliency map ‘new’ are calculated. The thus generated maps are called delta saliency maps. The pixels on the delta saliency maps that have a delta saliency value below ± 0.1 are counted together. The sum of the pixels can represent how much the saliency distribution within the human visual scene has changed after the BIPV installation, with the building’s original state as reference. Since for historical buildings, the appearance should be kept as original as possible, therefore the larger the sum of pixels in unchanged saliency value, the better it is.
5Discussion
The saliency map has shown good potential for the assessment of BIPV retrofit designs, but a few issues need to be adjusted in future research.
a) Energy yield
An evaluation method of solar facade design that is based merely on the objective visual aspect would be very incomplete. Evaluation of architecture designs usually involves personal preference and subjective opinions from the user or authorities. Besides, solar facade is a combination of architectural and energetic design. Therefore it is necessary to integrate the objective visual aspect, with personal opinions of different stakeholders, and energy production of BIPV into an integrated evaluation method. In the combination of these evaluation aspects, the weights of each aspect need to be developed so as to guarantee a meaningful holistic solar facade assessment.
b) The drawback of the existing saliency models
When humans look at architectures, empirically speaking their attention is prioritized to entrances and windows of the building, which is actually a top-down processing of attention. But at present, with many kinds of top-down attention models available, none of them are specifically trained to simulate human attention when looking at architectures. In fact, their accuracy is trained and evaluated based on the 300 standard natural pictures provided by the MIT saliency benchmark (Judd et al., 2012) instead of real life practices (such as using case-based eye-trackers to justify the accuracy of the model). Since the appropriate top-down attention model is missing, the only solution to simulate the ‘significance’ of BIPV is by completely leaving out the pre-selection criteria of human attention when looking at architectures, and only considering the most basic bottom-up attention criteria (colour, intensity and orientation). The validation of the method in this paper with actual human beings via eye-trackers to identify the most salient spots in the visual field is also desired in the future.
c) Colour calibration
The author’s current way of colour calibration is by sampling the colour value of certain pixels on the monitor screen to guarantee that the material colour in the render model is the same as the colour on the photo. For the future, a standardized colour sampling process should be developed, so as to guarantee a concerted preparing and evaluation process for all buildings.
d) Viewpoint decision
In this paper, only one viewpoint of the building perspective has been decided. For later development, several viewpoints should be chosen because a building is usually seen from multiple angles. Possible different results will be generated from different view angles, how to combine them is also a research issue for the future.
e) Daylight setting
For this paper, the daylight setting is set to overcast sky condition. However, reflection beams can occur under a clear sky condition. This might also lead to a huge visual impact on the historical building.
f) Extended application
At present, the visual impact of PV installations and wind farms on open landscapes has been a heated discussion. Compared to the saliency map method, the existing evaluation methods for visibility of PV installations (Chiabrando et al., 2009; Torres-Sibille et al., 2009, 2010) are less relevant to the biological principle of the human eye. Therefore comparisons between different methods in the future could be interesting.
Acknowledgments
The authors would like to thank the Projects KTI PV Fassade (funded by Swiss Commission for Technology and Innovation), IS Optische Raster für PV Module (funded by Lucerne University of Applied Sciences and Arts) and ÜserHuus P&D AIPV (funded by ÜserHuus) for financial support and opportunities provided. Gratefulness to Prof. Klaus Zahn from Lucerne University of Applied Sciences and Arts should be expressed for his help and inputs in saliency map discussions. Tremendous supports from Prof. J.-L. Scartezzini from LESO Lab, EPFL are also greatly appreciated.
References
1 | Borji A, Itti L(2013) State-of-the-art in visual attention modelingIEEE Transactions on Pattern Analysis and Machine Intelligence35: 1185207doi: 10.1109/TPAMI.2012.89 |
2 | Bundesamt fürEnergie, & Eidgenössische Kommission für Denkmalpflege (2009). Energie und Baudenkmal – Empfehlungen für die energetische Verbesserung von Baudenkmälern |
3 | Bylinskii, Z., Judd, T., Durand, F. D., Oliva, A., & Torralba, A. (n.d.). MIT Saliency Benchmark. Retrieved December 7, 2014, fromhttp://saliency.mit.edu |
4 | Chalmers, A., & Debattista, K. (2009). Level of Realism for Serious Games. Presented at the VS-GAMES 09 Proceedings of the 2009 Conference in Games and VirtualWorlds for Serious Applications, Coventry, United Kingdom: IEEE Computer Society doi:10.1109/VS-GAMES.2009.43 |
5 | Chiabrando R, Fabrizio E, Garnero G(2009) The territorial and landscape impacts of photovoltaic systems: Definition of impacts and assessment of the glare riskRenewable and Sustainable Energy Reviews13: 924412451 |
6 | Dessi V(2013) Methods and tools to evaluate visual impact of solar technologies in urban environment. Presented at the Cisbat 2013LausanneSwitzerland16 |
7 | Frontini, F., Maturi, L., Munari Probst, M. C., Roecker, C., & Scognamiglio, A. (2013). Designing photovoltaic systems for architectural integration – Criteria and guidelines for product and system developers. (C. Farkas) Report T.41. A.3/2: IEA SHC Task 41 Solar Energy and Architecture (pp. 1-92). |
8 | Harel J, Koch C, Perona P(2006) Graph-based visual saliency. Presented at the Advances in Neural Information Processing Systems 19Proceedings of the Twentieth Annual Conference on Neural Information Processing Systems 2006545552VancouverCanada |
9 | Häne, S. (2012). Heimatschutz warnt vor"Solarwelle" in Altstadt. Retrieved December 2, 2014, from http://www.tagesanzeiger.ch/zuerich/stadt/Heimatschutz-warnt-vor-Solarwelle-in-Altstadt/story/14894803 |
10 | Hubel DH(1995) Eye, brain, and vision2nd edW. H. Freeman publishers |
11 | Itti L, Koch C(2001) Computational modelling of visual attentionNature Reviews Neuroscience2: 3194203 |
12 | Itti L, Koch C, Niebur E(1998) A model of saliency-based visual attention for rapid scene analysisIEEE Transactions on Pattern Analysis and Machine Intelligence20: 1112541259 |
13 | Judd T, Durand F, Torralba A(2012) A Benchmark of Computational Models of Saliency to Predict Human FixationsComputer Science and Artificial Intelligence Laboratory Technical Report |
14 | Judd, T., Ehinger, K., Durand, F., & Torralba, A. (n.d.). Judd Saliency Model/README.txt. Retrieved December 2, 2014, from http://people.csail.mit.edu/tjudd/WherePeopleLook/Code/JuddSaliencyModel/README.txt |
15 | Kanton Basel (2013). Richtlinie für Solaranlagen im Kanton Basel-Stadt (Version Januar 2013). |
16 | Kanton Bern (2012). Richtlinien – Baubewilligungsfreie Anlagen zur Gewinnung erneuerbarer Energien (Version Juni 2012). |
17 | Kanton Luzern (2014). Richtlinien Solaranlagen – Photovoltaische/Solarthermische Anlagen (Version April 2014). |
18 | Kanton Nidwalden, Fachstelle für D(2010) Wegleitung Bauinventar125 |
19 | Kanton Thurgau (2009). Solaranlagen richtig gut – Richtlinien zur Anwendung von Artikel 18a des Bundesgesetzes über die Raumplanung (Version Juli 2009) |
20 | Koch C, Ullman S(1985) Shifts in selective visual attention: Towards the underlying neural circuitryHuman Neurobiology4: 219227 |
21 | Longhurst, P., Debattista, K., & Chalmers, A. (2006). A GPU based Saliency Map for High-Fidelity Selective Rendering, Presented at the AFRIGRAPH 2006 4th International Conference on Computer Graphics, Virtual Reality, Visualisation and Interaction (pp. 1-9). |
22 | López CSP, Frontini F(2014) Energy efficiency and renewable solar energy integration in heritage historic buildingsEnergy Procedia48: 14931502doi: 10.1016/j.egypro.2014.02.169 |
23 | Lucchi E, Garegnani G, Maturi L, Moser D(2014) Architectural integration of photovoltaic systems in historic districts – The case study of Santiago de CompostelaPresented at the International Conference in Energy Efficiency in Historic Buildings115MadridSpain |
24 | Ludin, P.W. (2013). Keine Solaranlagen aufWalliser KirchendNchern. Retrieved December 2, 2014, from http://www.kirchenblogs.ch/d/blogs/pWalterLudin/m96899 |
25 | Munari Probst MC, Roecker C(2009) Photovoltaic vs Solar Thermal: Very different building integration possibilities and constraintsPresented at the Cisbat 200916LausanneSwitzerland |
26 | Munari Probst MC, Roecker C(2011) Urban acceptability of building integrated solar systems: LESO-QSV approachPresented at the ISES Solar World Congress 2011KasselGermany |
27 | Munari Probst M.C., Roecker C(2012) Criteria for architectural integration of active solar systems IEA Task 41, Subtask A. (2014).Energy Procedia30: 11951204doi: 10.1016/j.egypro.2012.11.132 |
28 | RPG. Bundesgesetz über die Raumplannung (Raumplanungsgesetz, RPG), vom 22. Juni 1979 (Stand on 1. Mai 2014). |
29 | Ruesch, J., Lopes, M., Bernardino, A., Hörnstein, J., Santos-Victor, J., & Pfeifer, R. (2008). Multimodal Saliency-Based Bottom-Up Attention, A Framework for the Humanoid Robot iCub, Presented at the 2008 IEEE International Conference on Robotics and Automation, Pasadena, (pp. 1-6), CA, USA. |
30 | Stadt Zürich Hochbaudepartement (2008). Solaranlagen in der Stadt Zürich erwünscht. Retrieved December 2, 2014, from https://www.stadt-zuerich.ch/content/hbd/de/index/ueber_das_departement/medien/medienmitteilungen/2008/august/080822a.html |
31 | Swiss Federal Constitution (2014). Bundesverfassung der Schweizerischen Eidgenossenschaft vom 18. April 1999 (Stand on 18. Mai 2014). |
32 | Torres-Sibille ADC, Cloquell-Ballester V-A, Artacho Ramírez MÁ(2009) Aesthetic impact assessment of solar power plants: An objective and a subjective approachRenewable and Sustainable Energy Reviews13: 5986999 |
33 | Torres-Sibille A.D.C., García L, Ayuga F(2010) Visual impact assessment of human interventions of the landscape: The case of wind farms and solar power plantsUniversidad Polit 'ecnica de Valencia |
34 | Vassiliades C, Savvides A, Michael A(2014) Architectural Implications in the Building Integration of Photovoltaic and Solar Thermal systems – Introduction of a taxonomy and evaluation methodologyPresented at the World Sustainable Building 201417BarcelonaSpain |
35 | Vitelli, J. (2013). Interpellation Nr. 60 (September 2013) – betreffend fragwürdige Richtlinien für Solaranlagen. Retrieved December 2, 2014,from http://www.grosserrat.bs.ch/dokumente/100376/000000376090.pdf |
36 | Von Arx, S. (2013). Solaranlage auf Kirchendach:"Das Bauvorhaben kann nicht bewilligt werden". Retrieved December 2, 2014, from http://www.grenchnertagblatt.ch/solothurn/thal-gaeu-niederamt/solaranlage-auf-kirchendach-das-bauvorhaben-kann-nicht-bewilligt-werden-127238528 |
37 | Wang, S., & Tian, Y. (2011). Indoor Signage Detection Based on Saliency Map and Bipartite Graph Matching, Presented at the 2011 IEEE International Conference on Bioinformatics and Biomedicine Workshops BIBMW (pp. 518-525), Atlanta, USA. |
38 | Ward, G., Others. (n.d.). Radiance. Retrieved from http://radsite.lbl.gov/ |
39 | Wittkopf S, Yang X, XU R(2014) Reflection from PV facades and roofs – New assessment methods based on annual weather data2014Presented at the EU PVSEC 2014Amsterdam, Netherlands |
40 | Xu R(2014) Visuelle Beurteilung der BIPVPresented at the Swiss BauBaselSwitzerland |
41 | Yang X, Grobe L, Wittkopf S(2013) Simulation of reflected daylight from building envelopesPresented at the 13th Conference of International Building Performance Simulation Association18ChamberyFrance |
42 | Yu, P. M., Cheng, C. L., Liao, L. M., & Yu, Y. T. (2009). An Evaluation and Benchmarking Study of the Building Integrated Photovlatic (BIPV), Presented at the Proceedings of Green Building Towards Eco-City, (pp. 1-14), Taipei, Taiwan. |
Figures and Tables
Fig.1
Stakeholders and their approximate percentage of interests in energy & cost aspect versus in visual aspect.
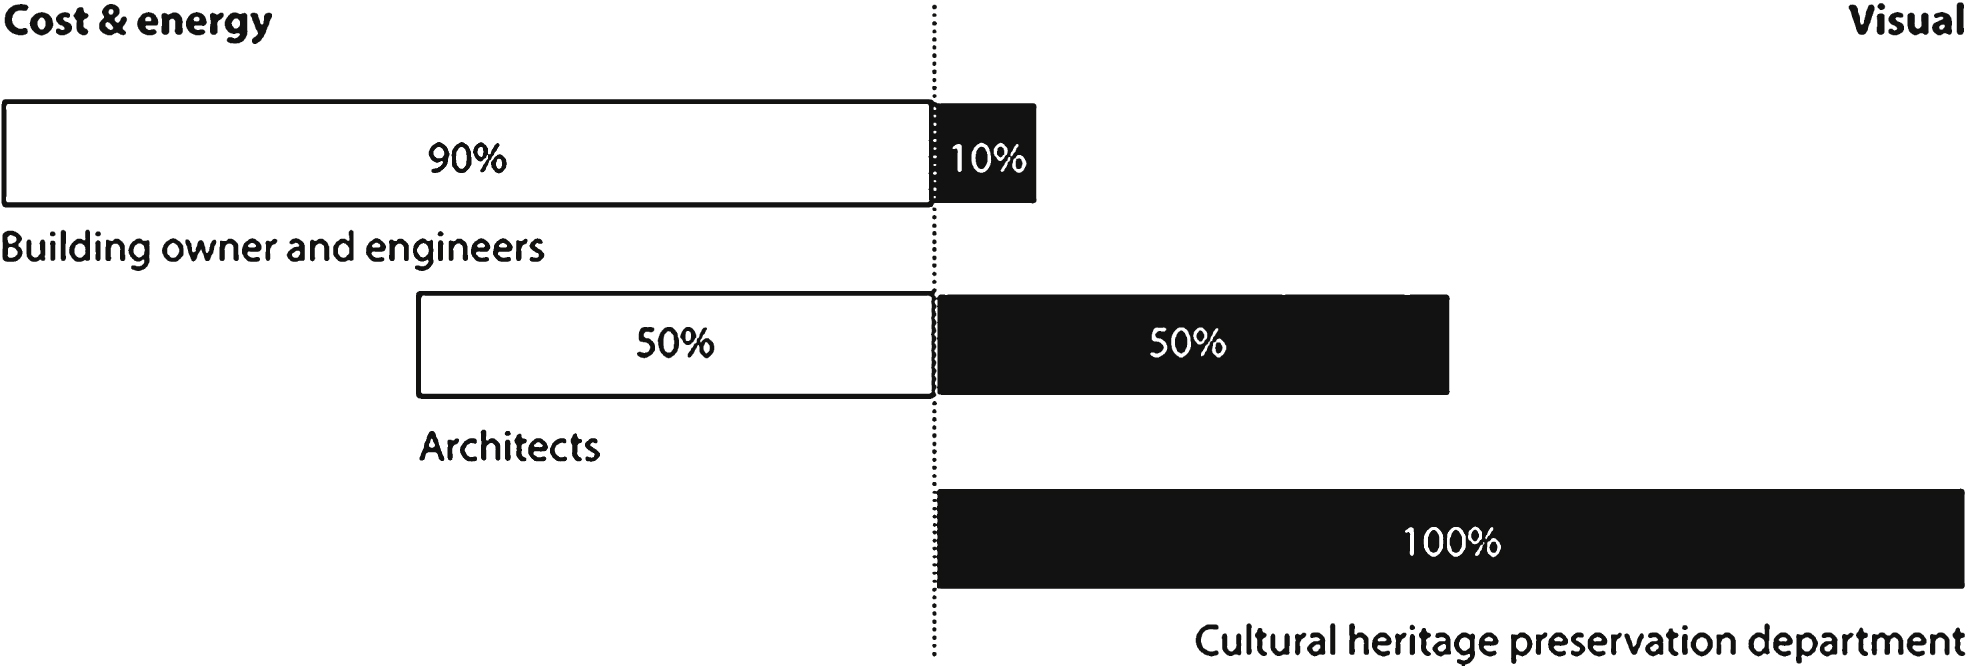
Fig.2
The general architecture of the Itti-Koch saliency map.
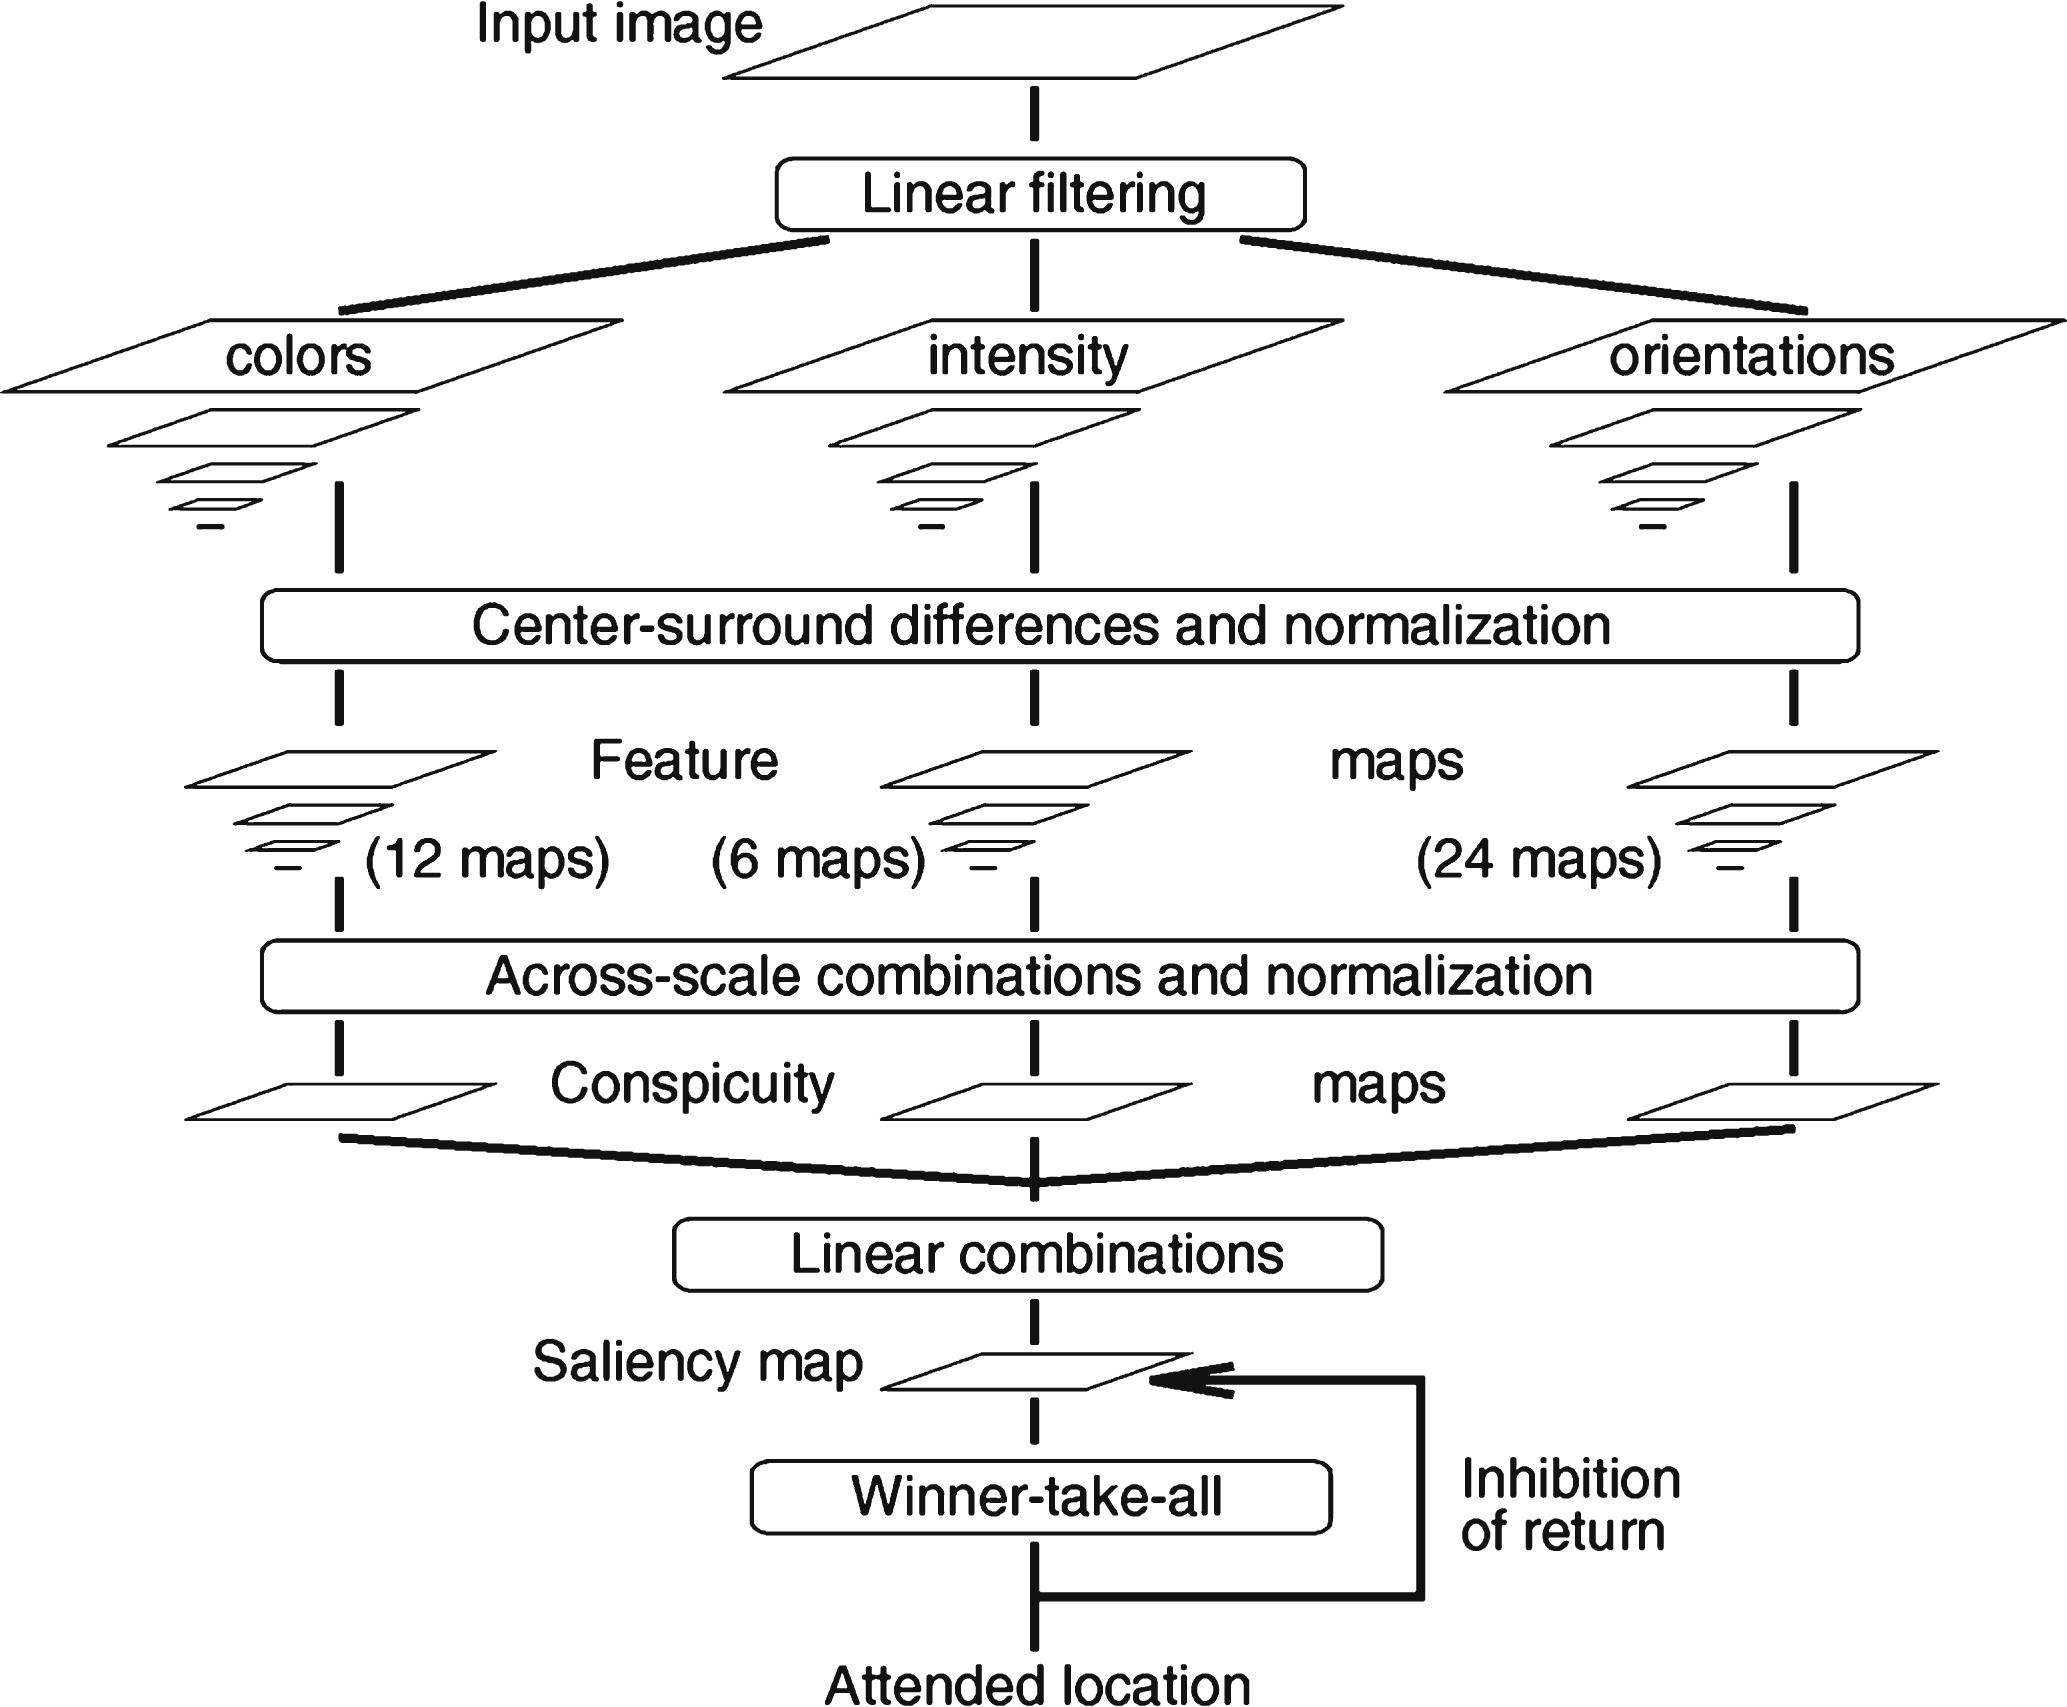
Fig.3
An example of the application of saliency map. Left: the original image. Right: The generated Itti-Koch saliency map by using a script written by Harel, Koch, & Perona (2006).
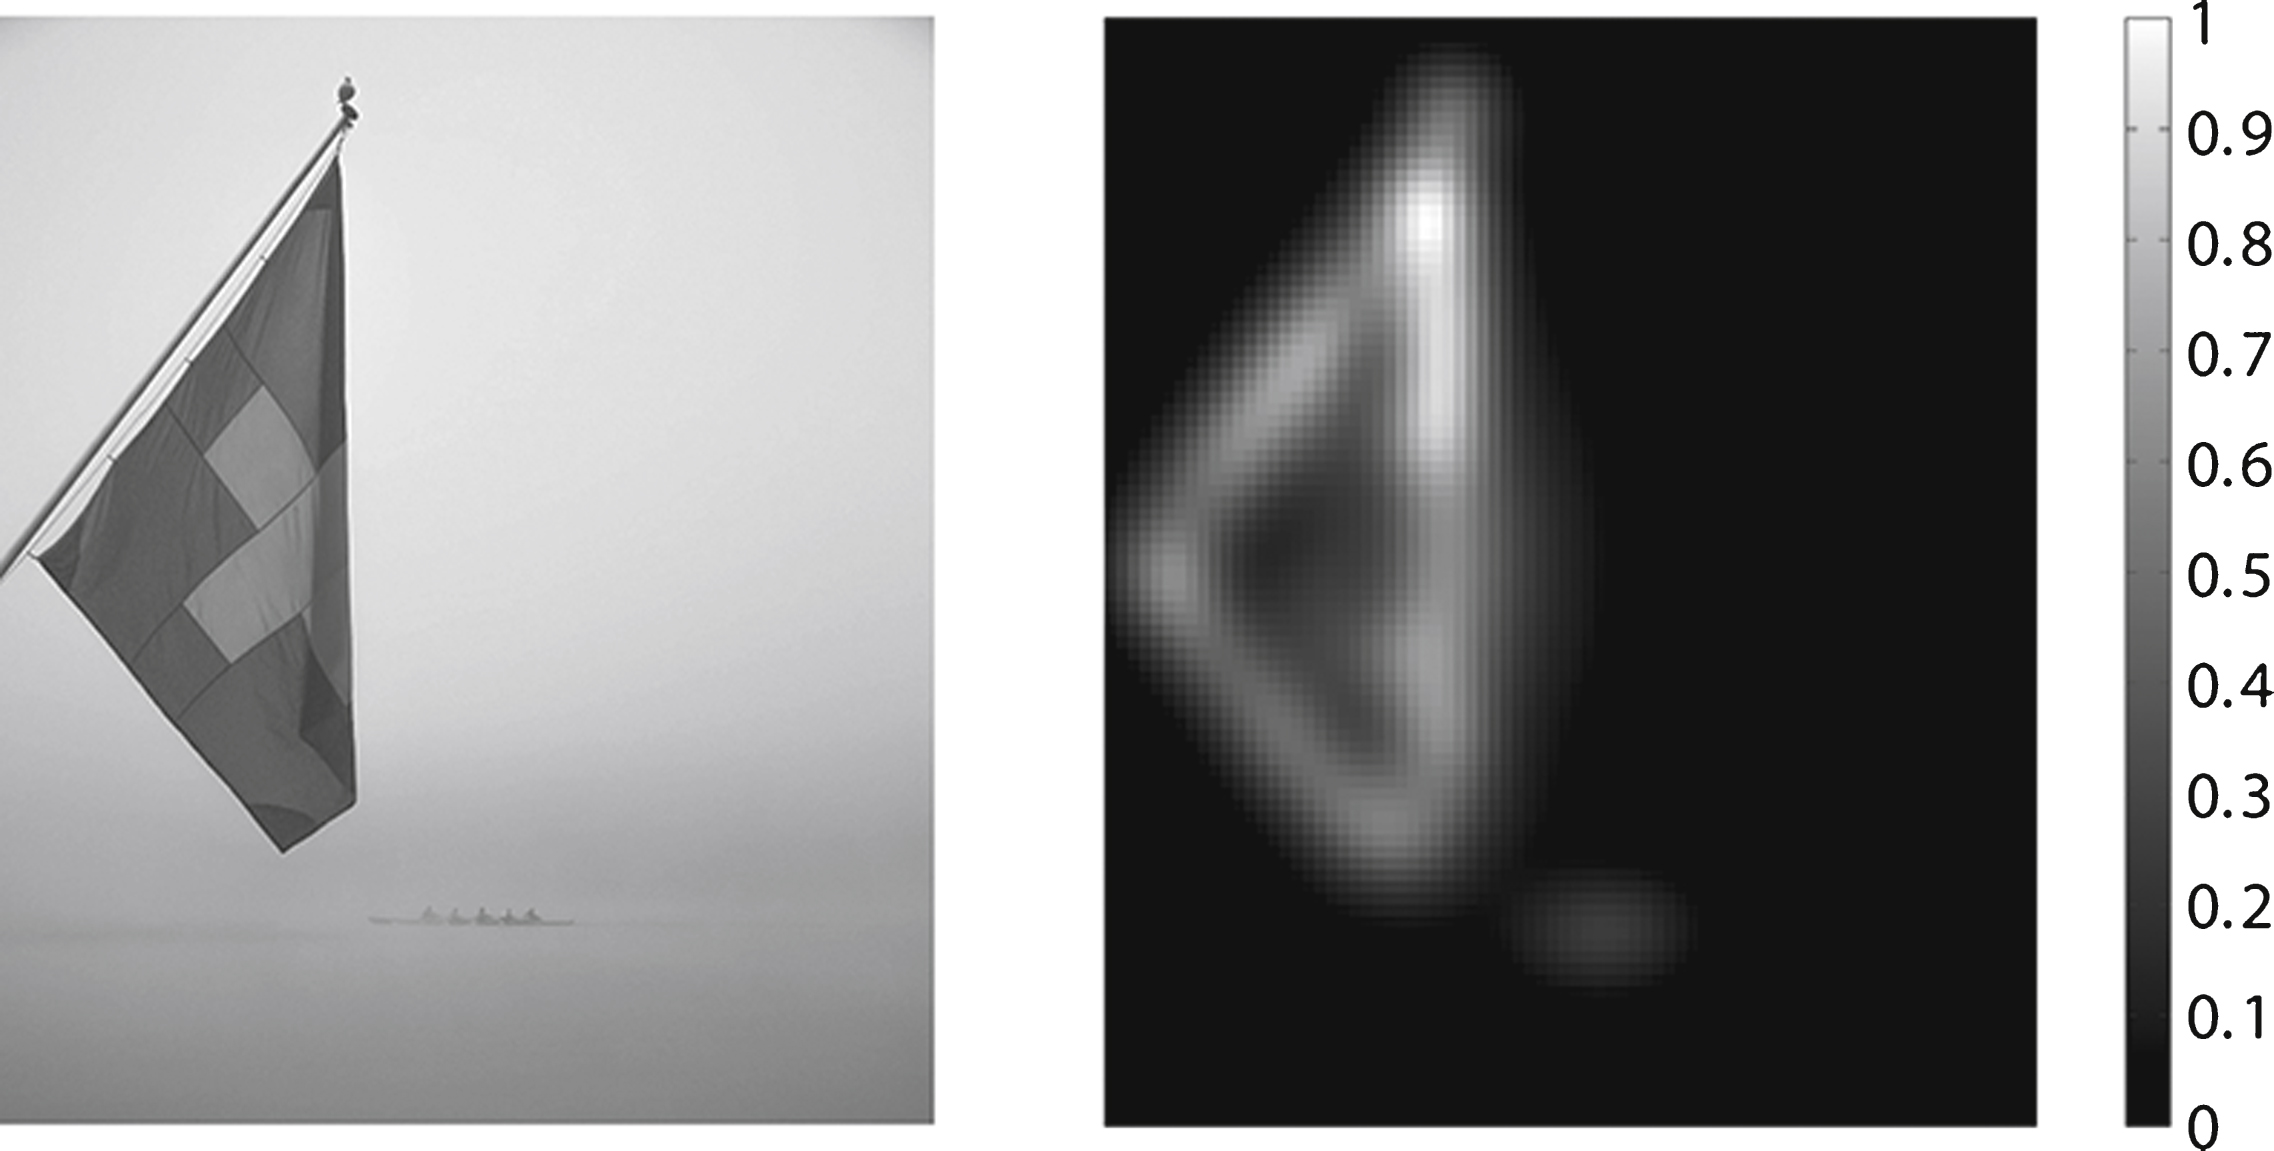
Fig.4
Site plan of the building ‘Seerose’ (left), photo ‘as is’ (right above) and rendering ‘as is’ (right below) with viewpoint from the garden entrance.
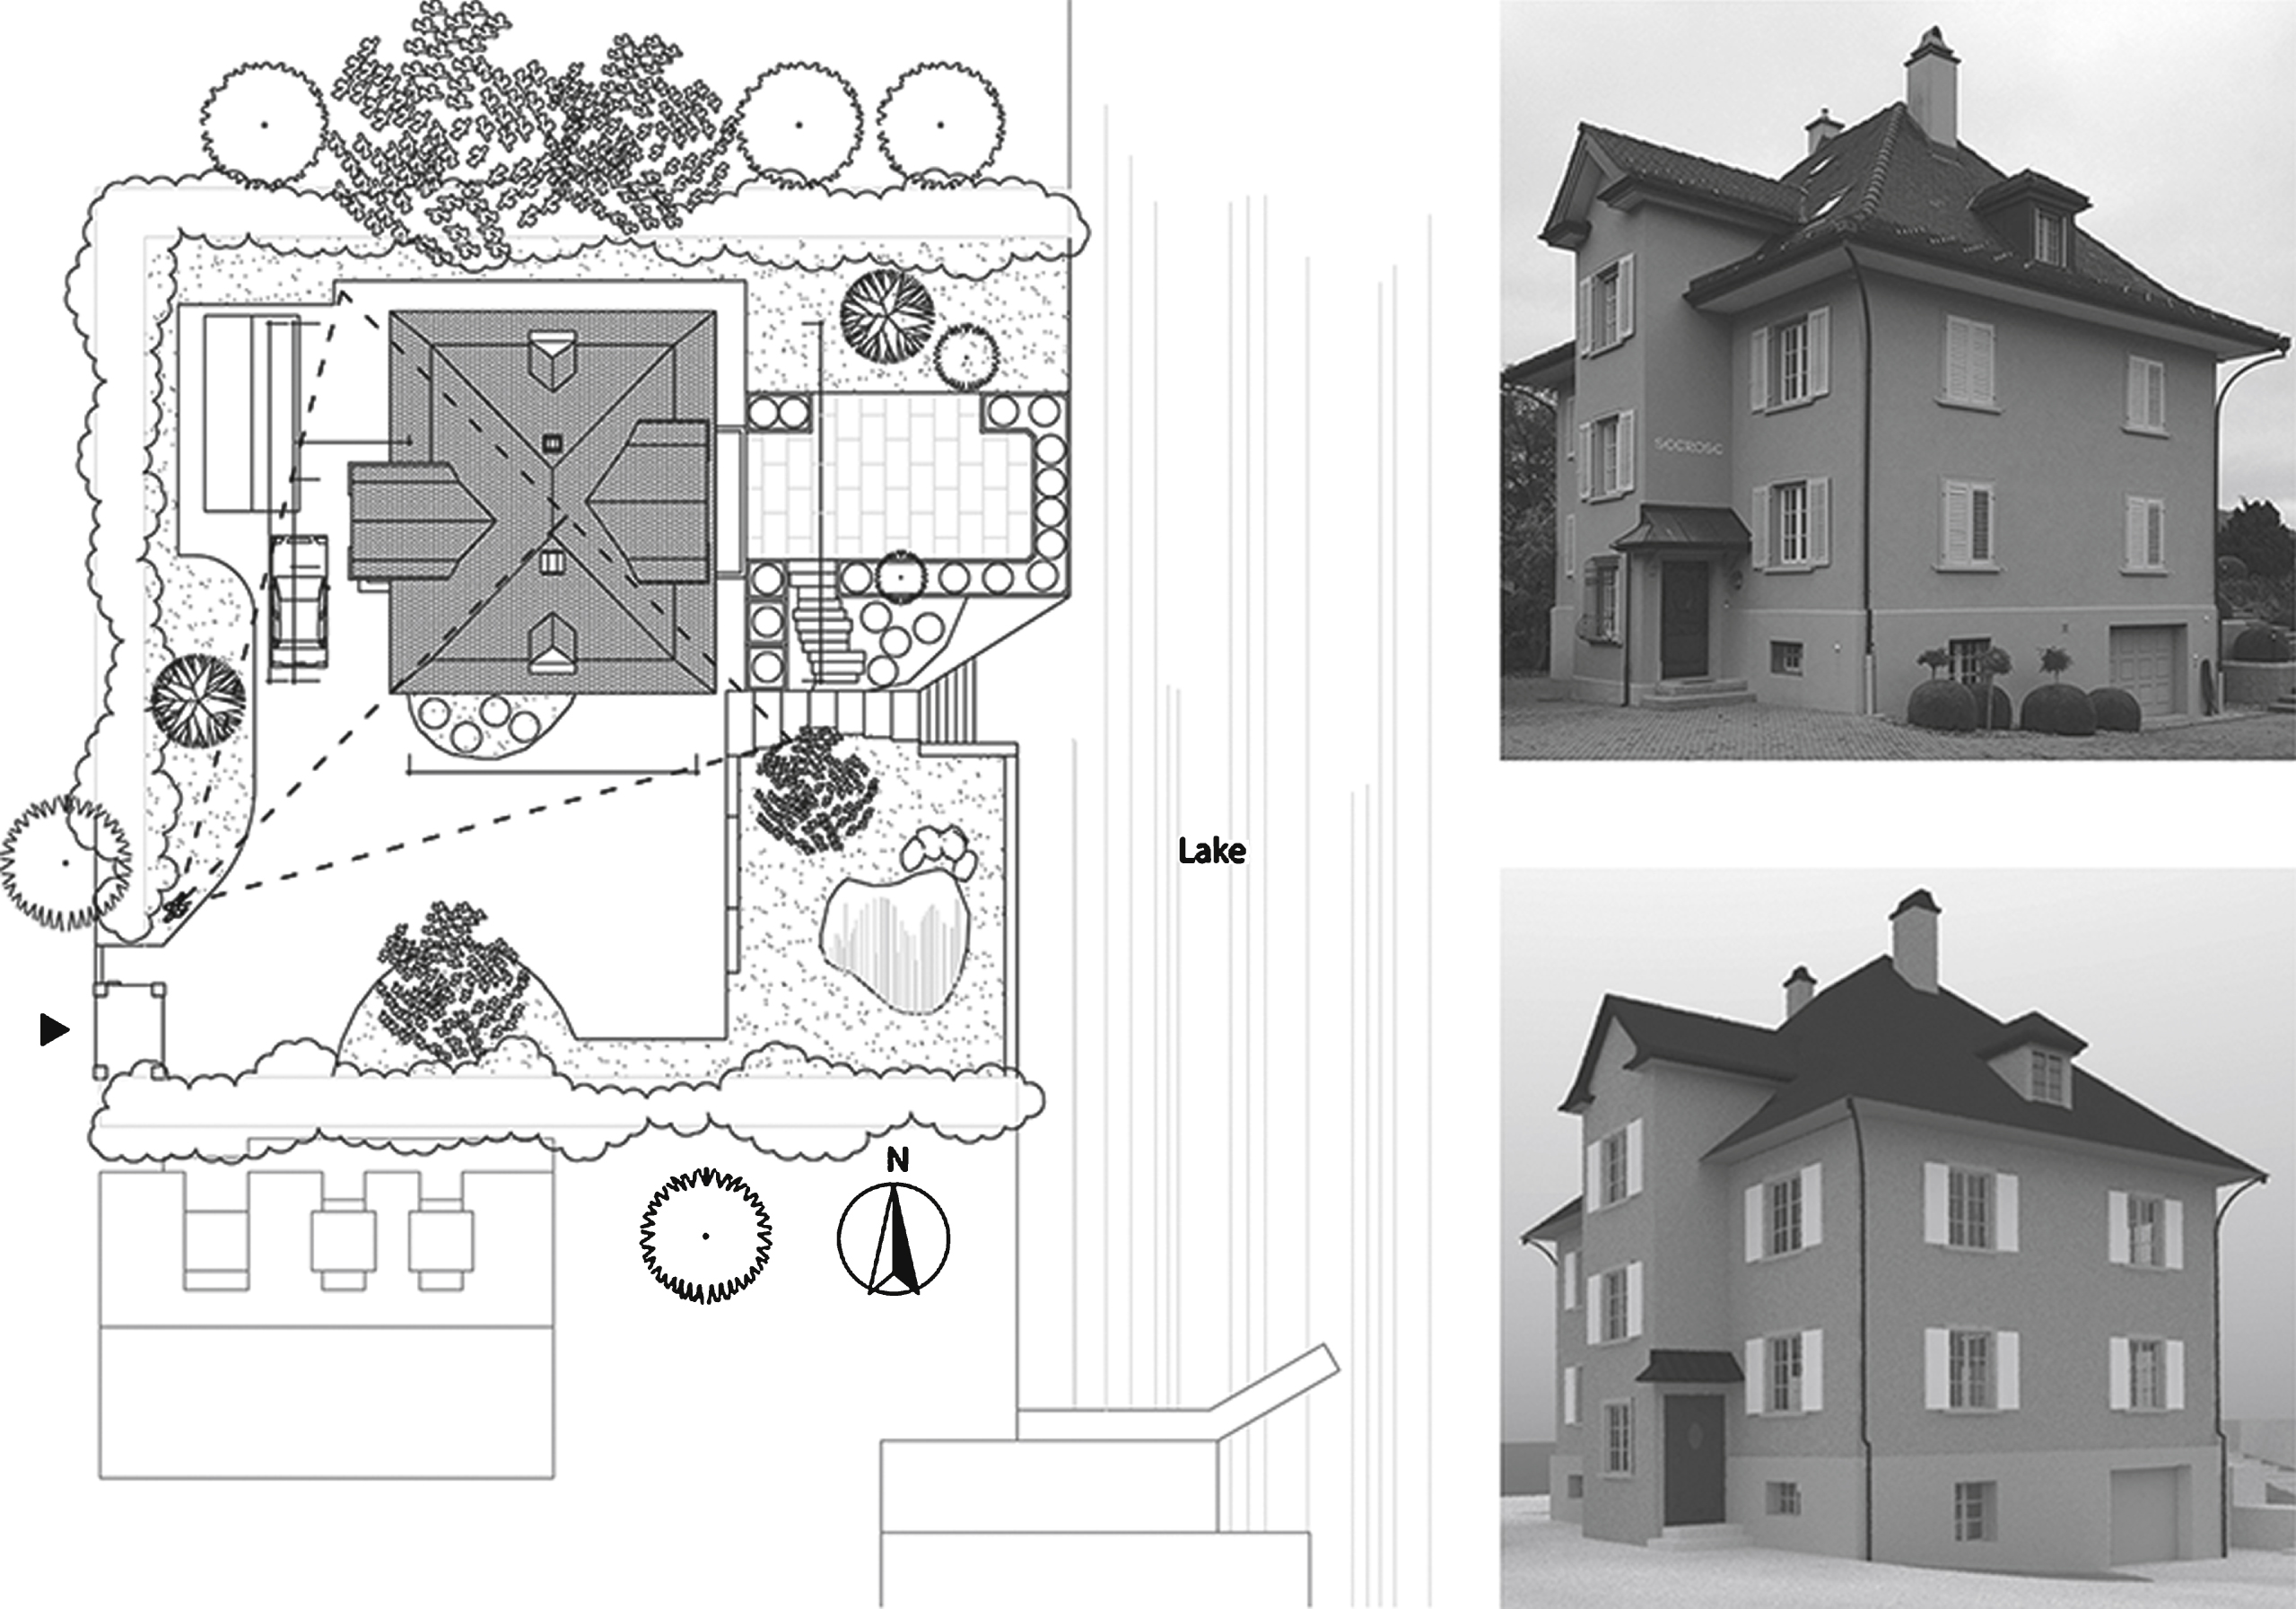
Fig.5
Left: Different BIPV layout variations. Right: Different front glazing colours for BIPVs. Resulting in eight different design proposals in total.
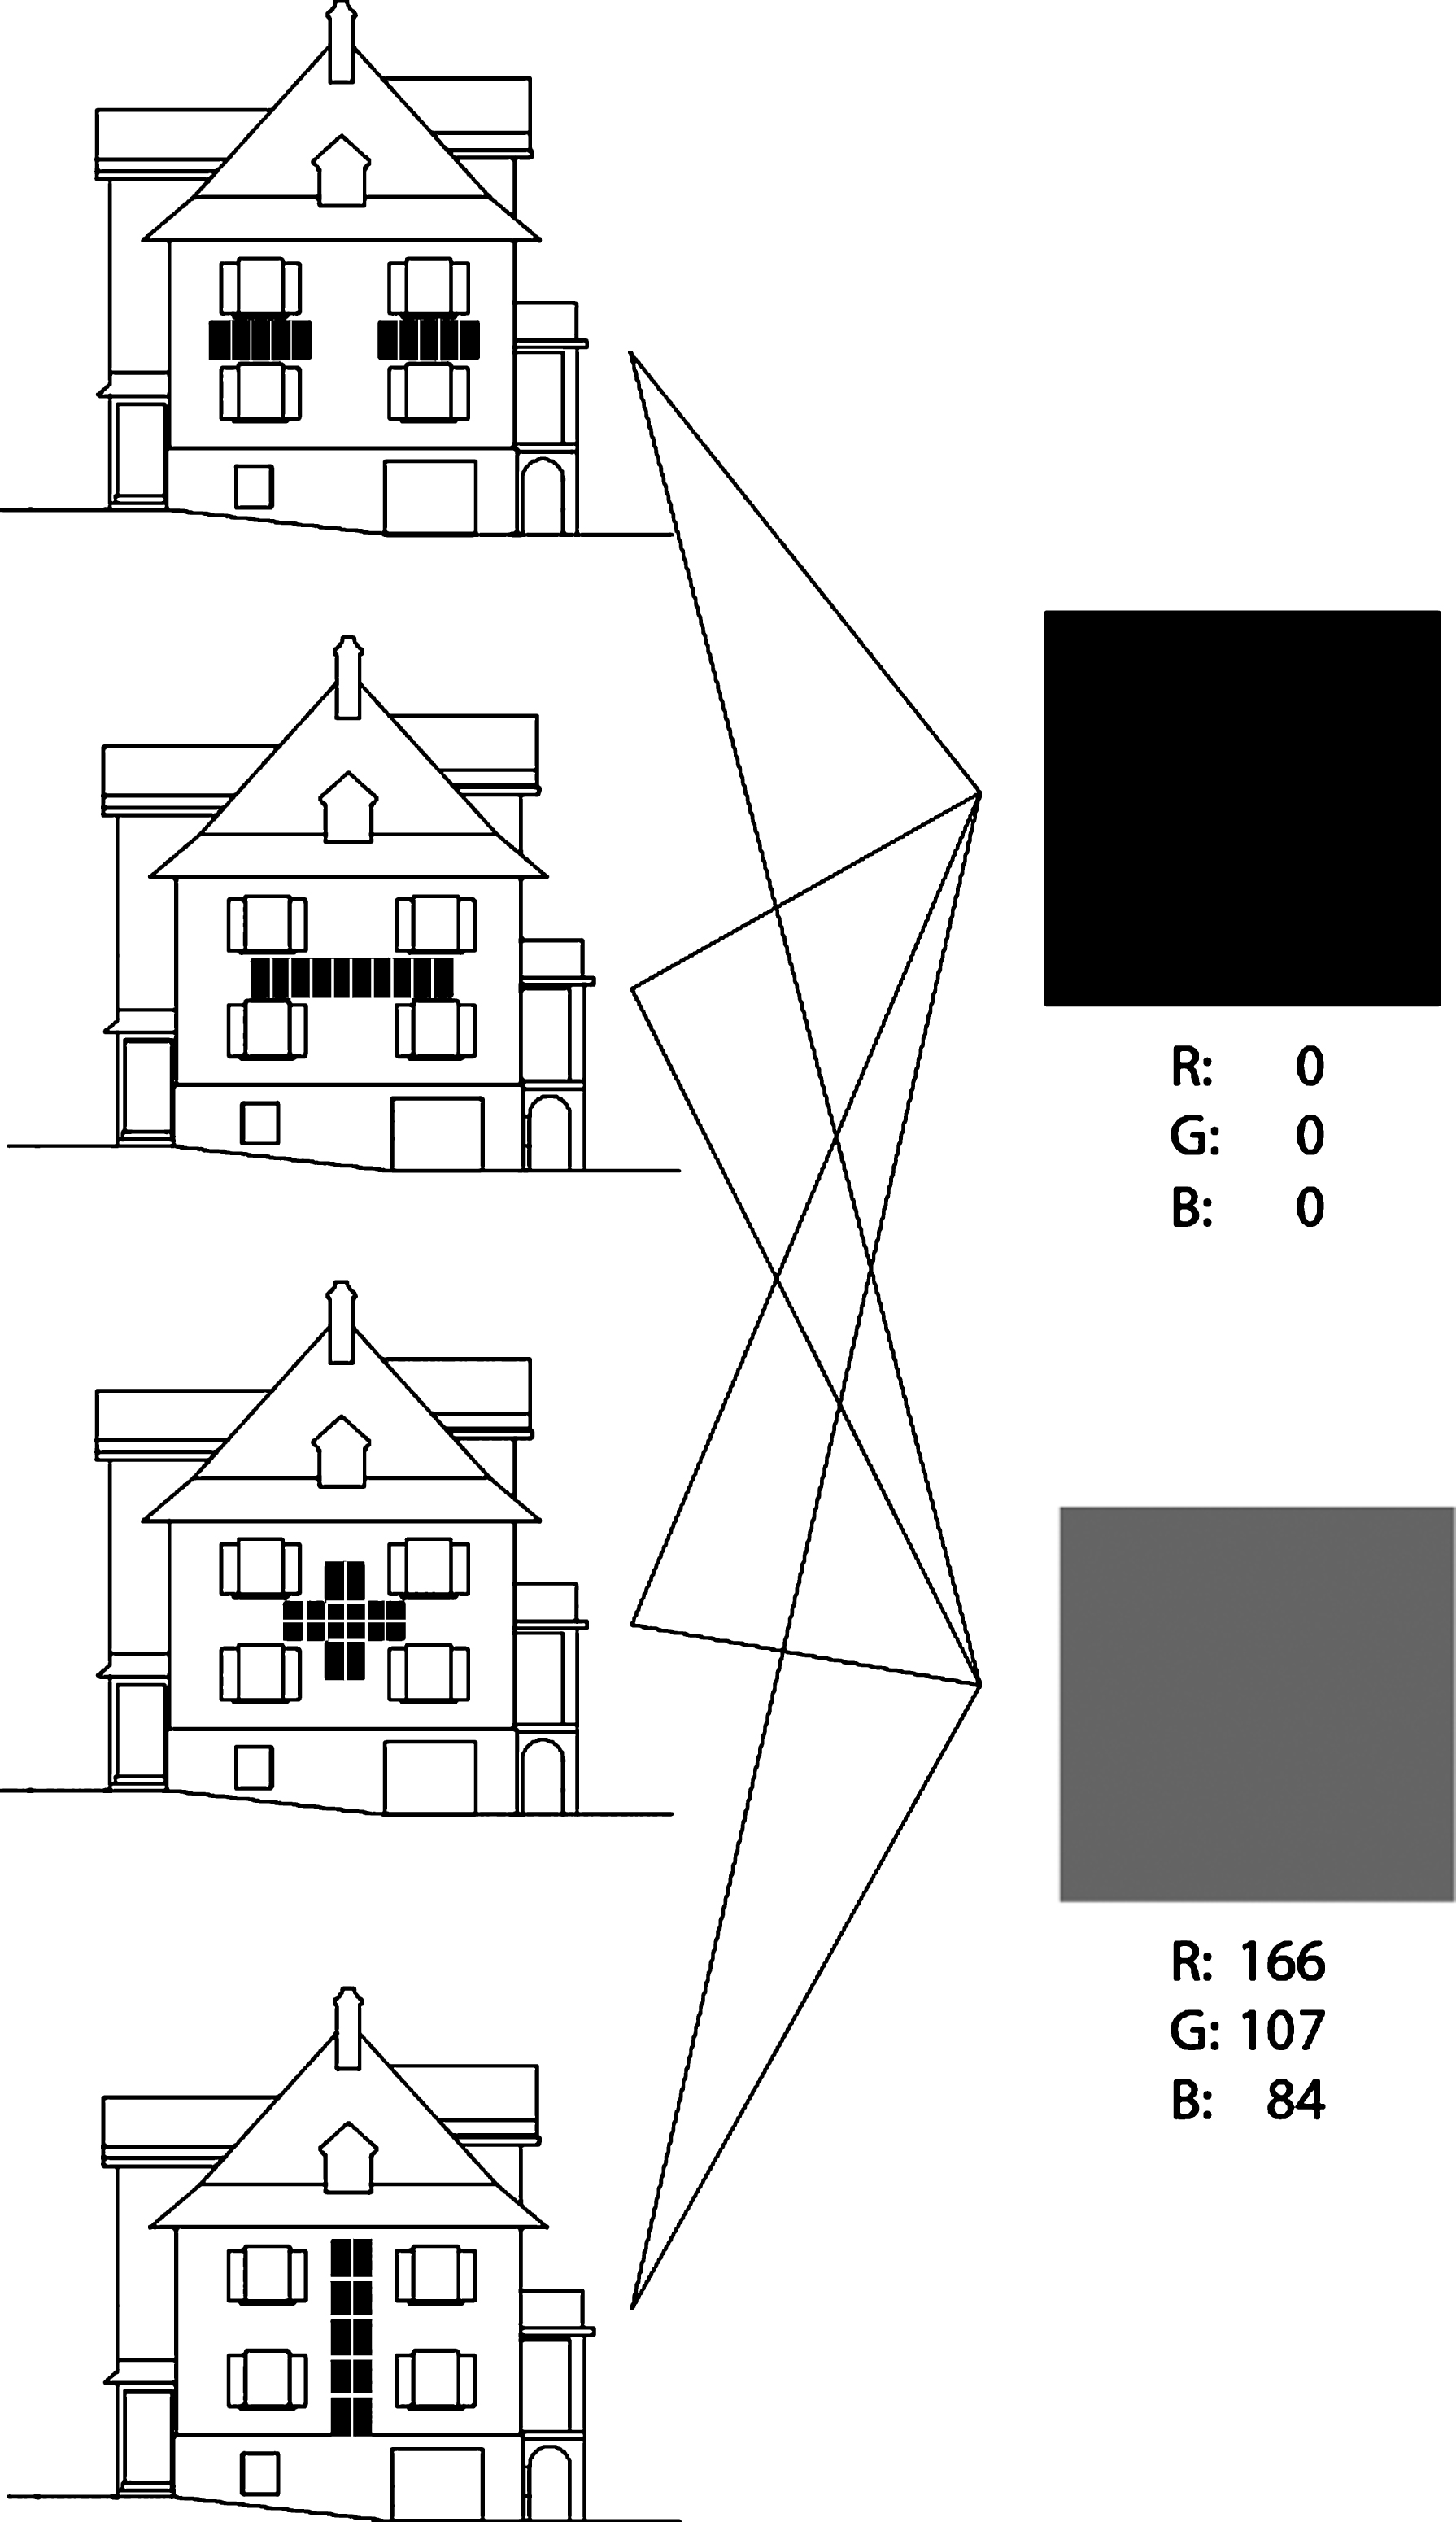
Fig.6
The cropped renderings ‘as is’ and ‘new’.
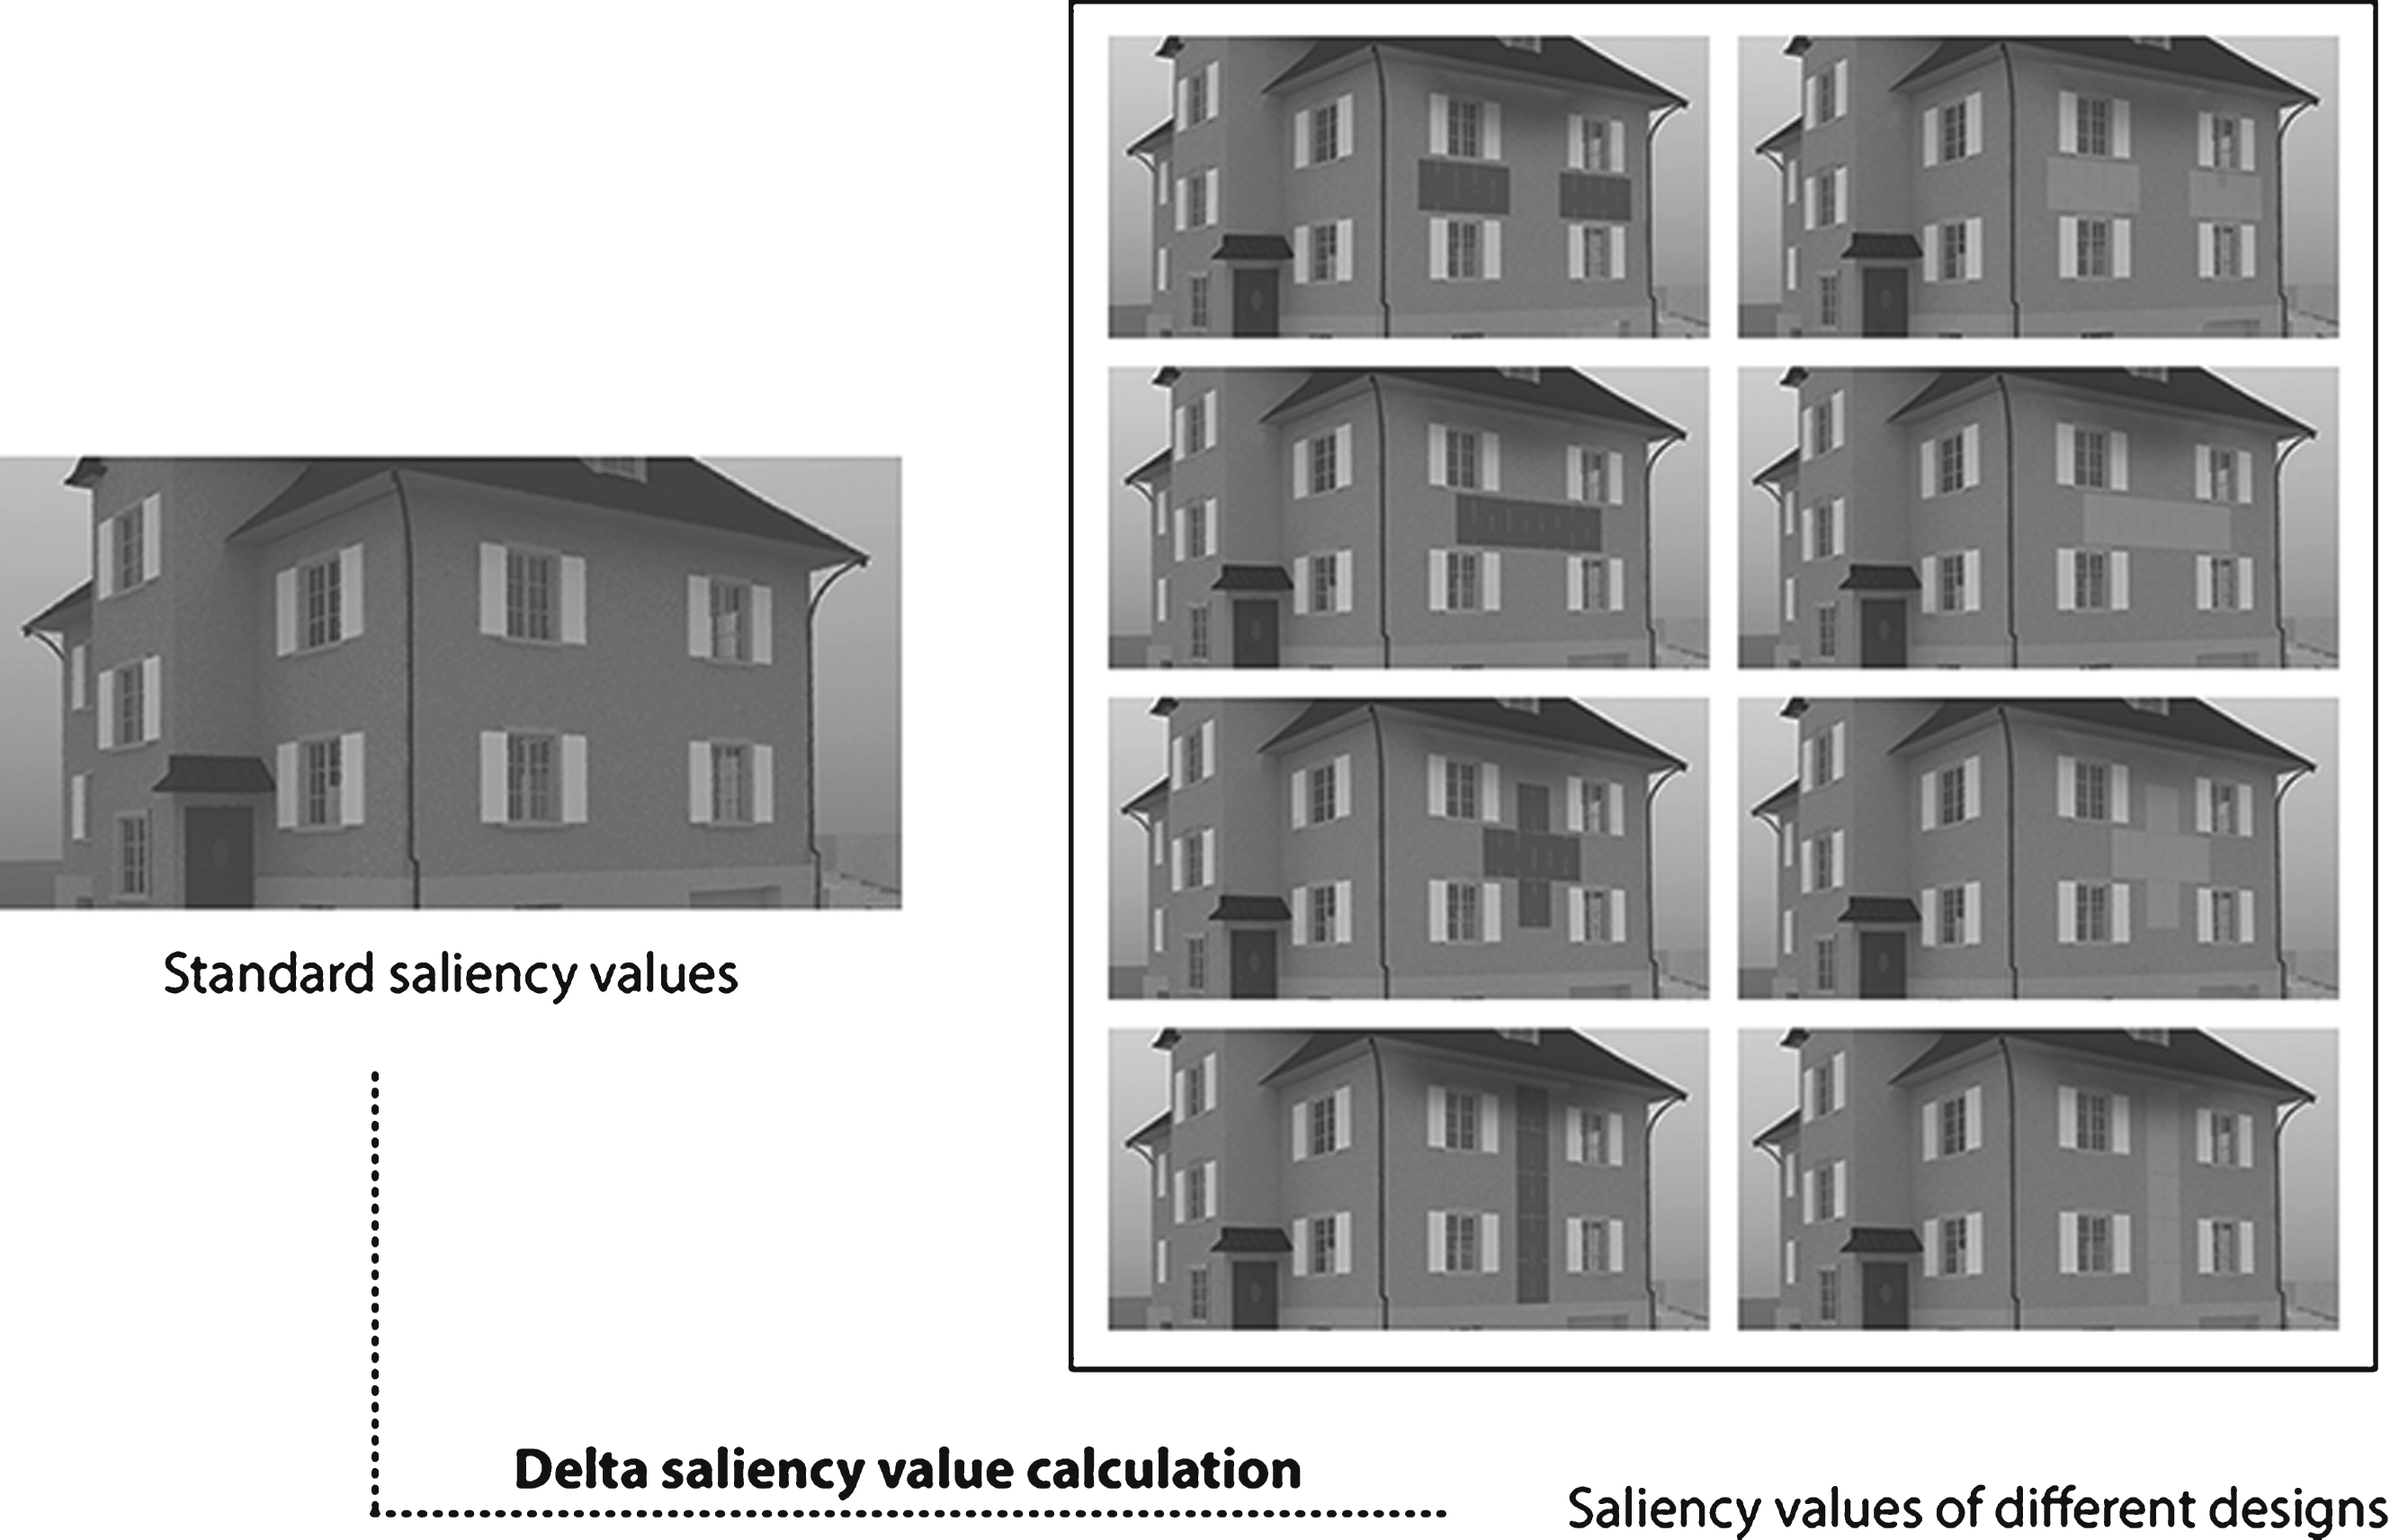
Fig.7
From left to right: the photo ‘as is’, the rendering ‘as is’ and the saliency map generated from rendering ‘as is’.
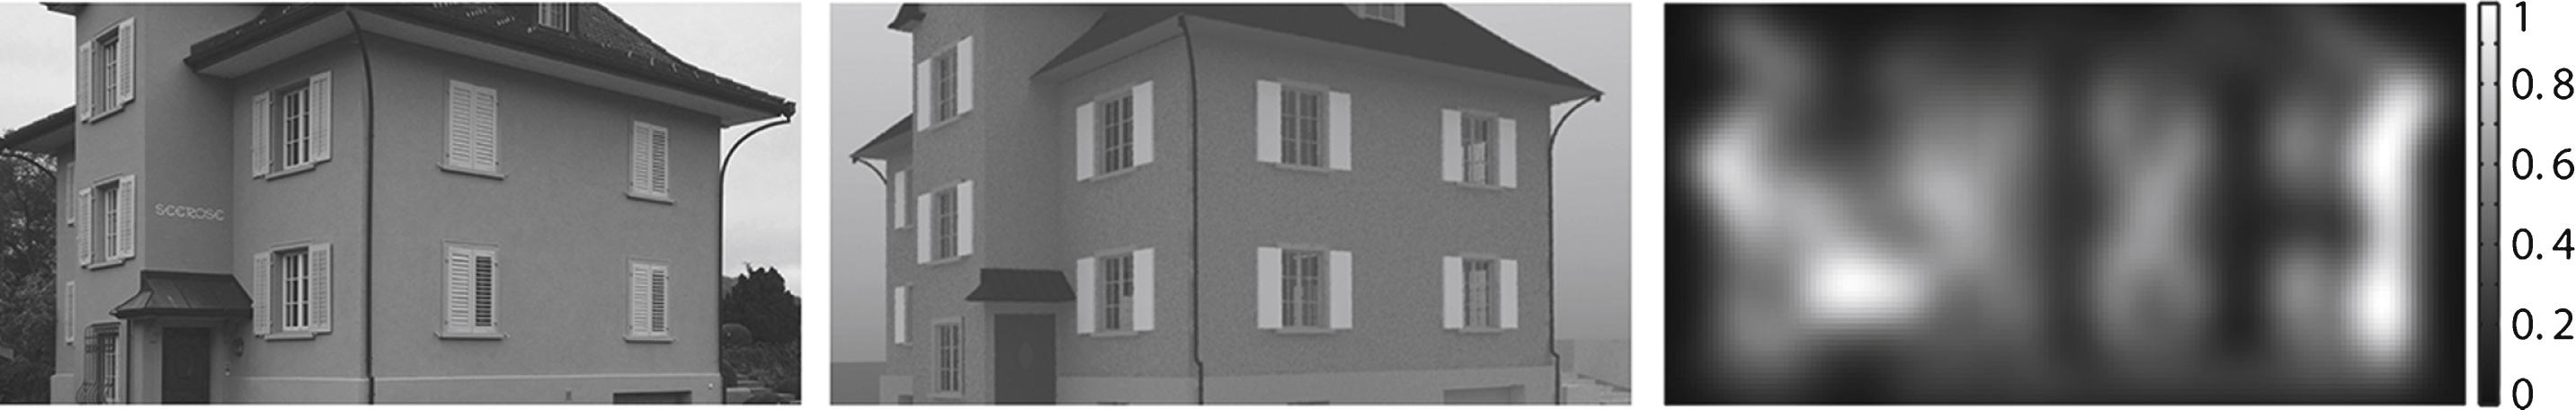
Fig.8
The saliency maps generated from renderings ‘new’.
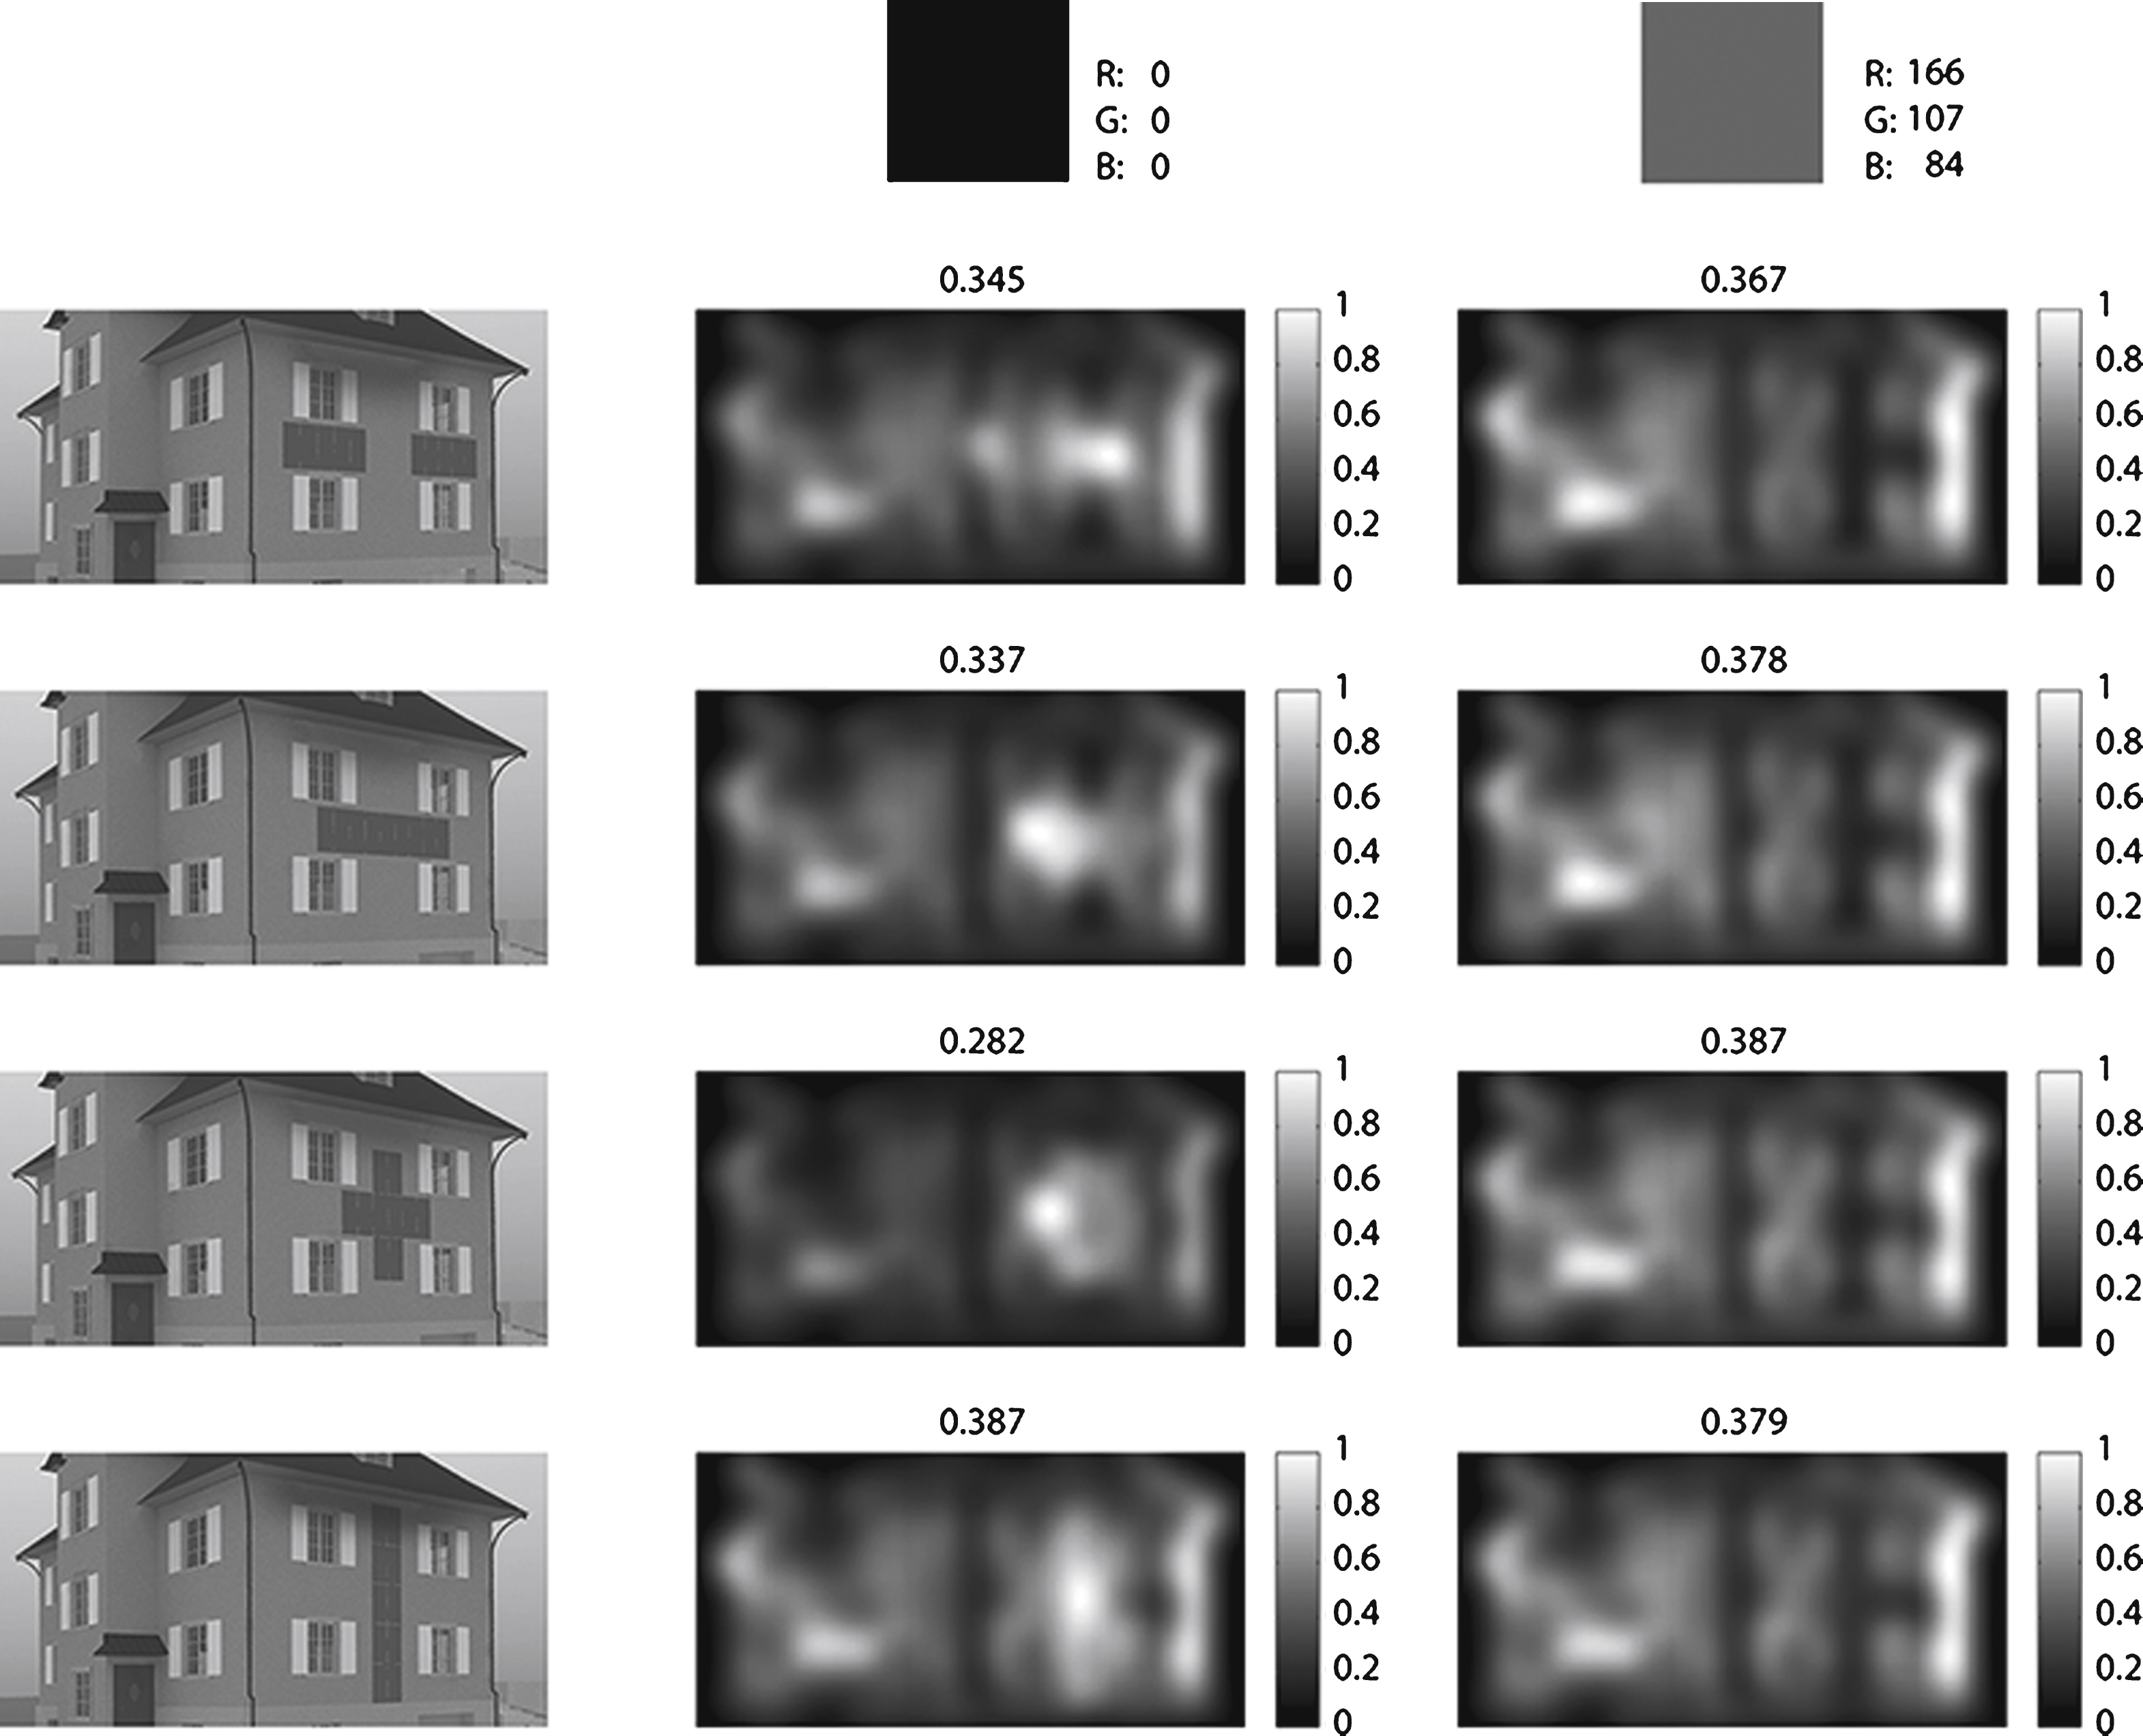
Fig.9
3D diagram of saliency values generated from renderings ‘new’.
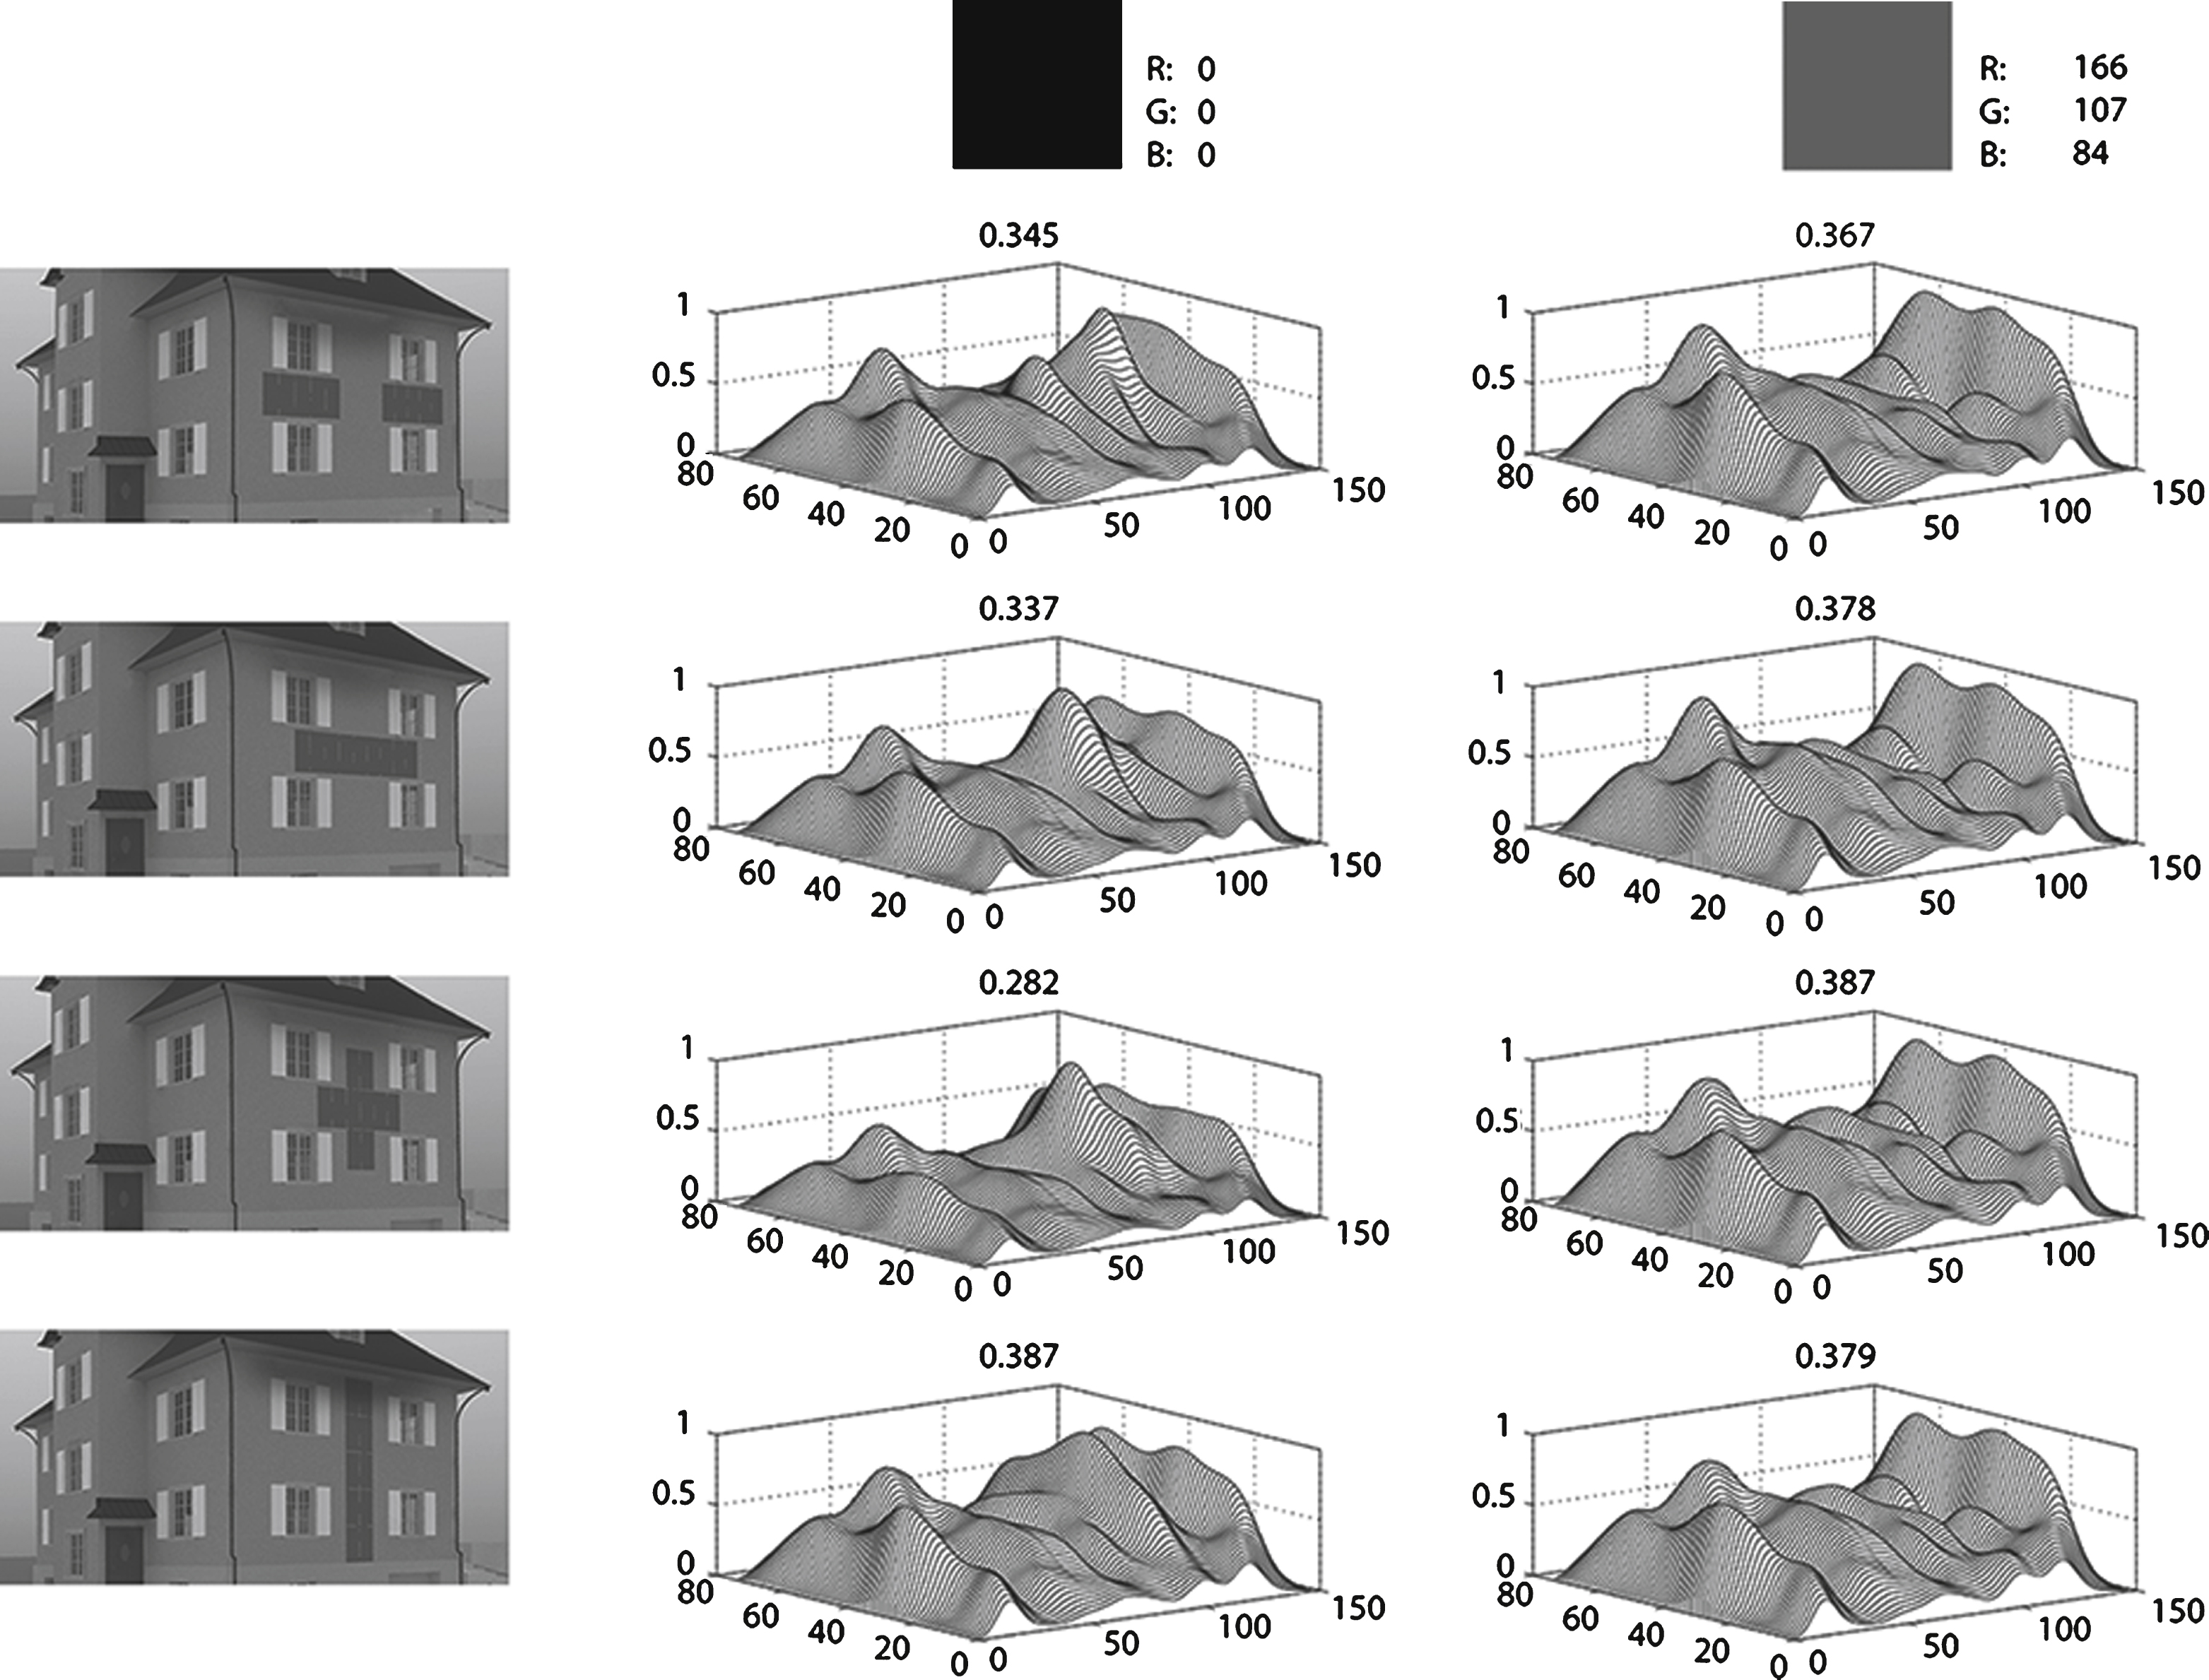
Fig.10
The delta saliency values between saliency map ‘as is’ and each ‘new’ saliency map, calculated from Equation (1).
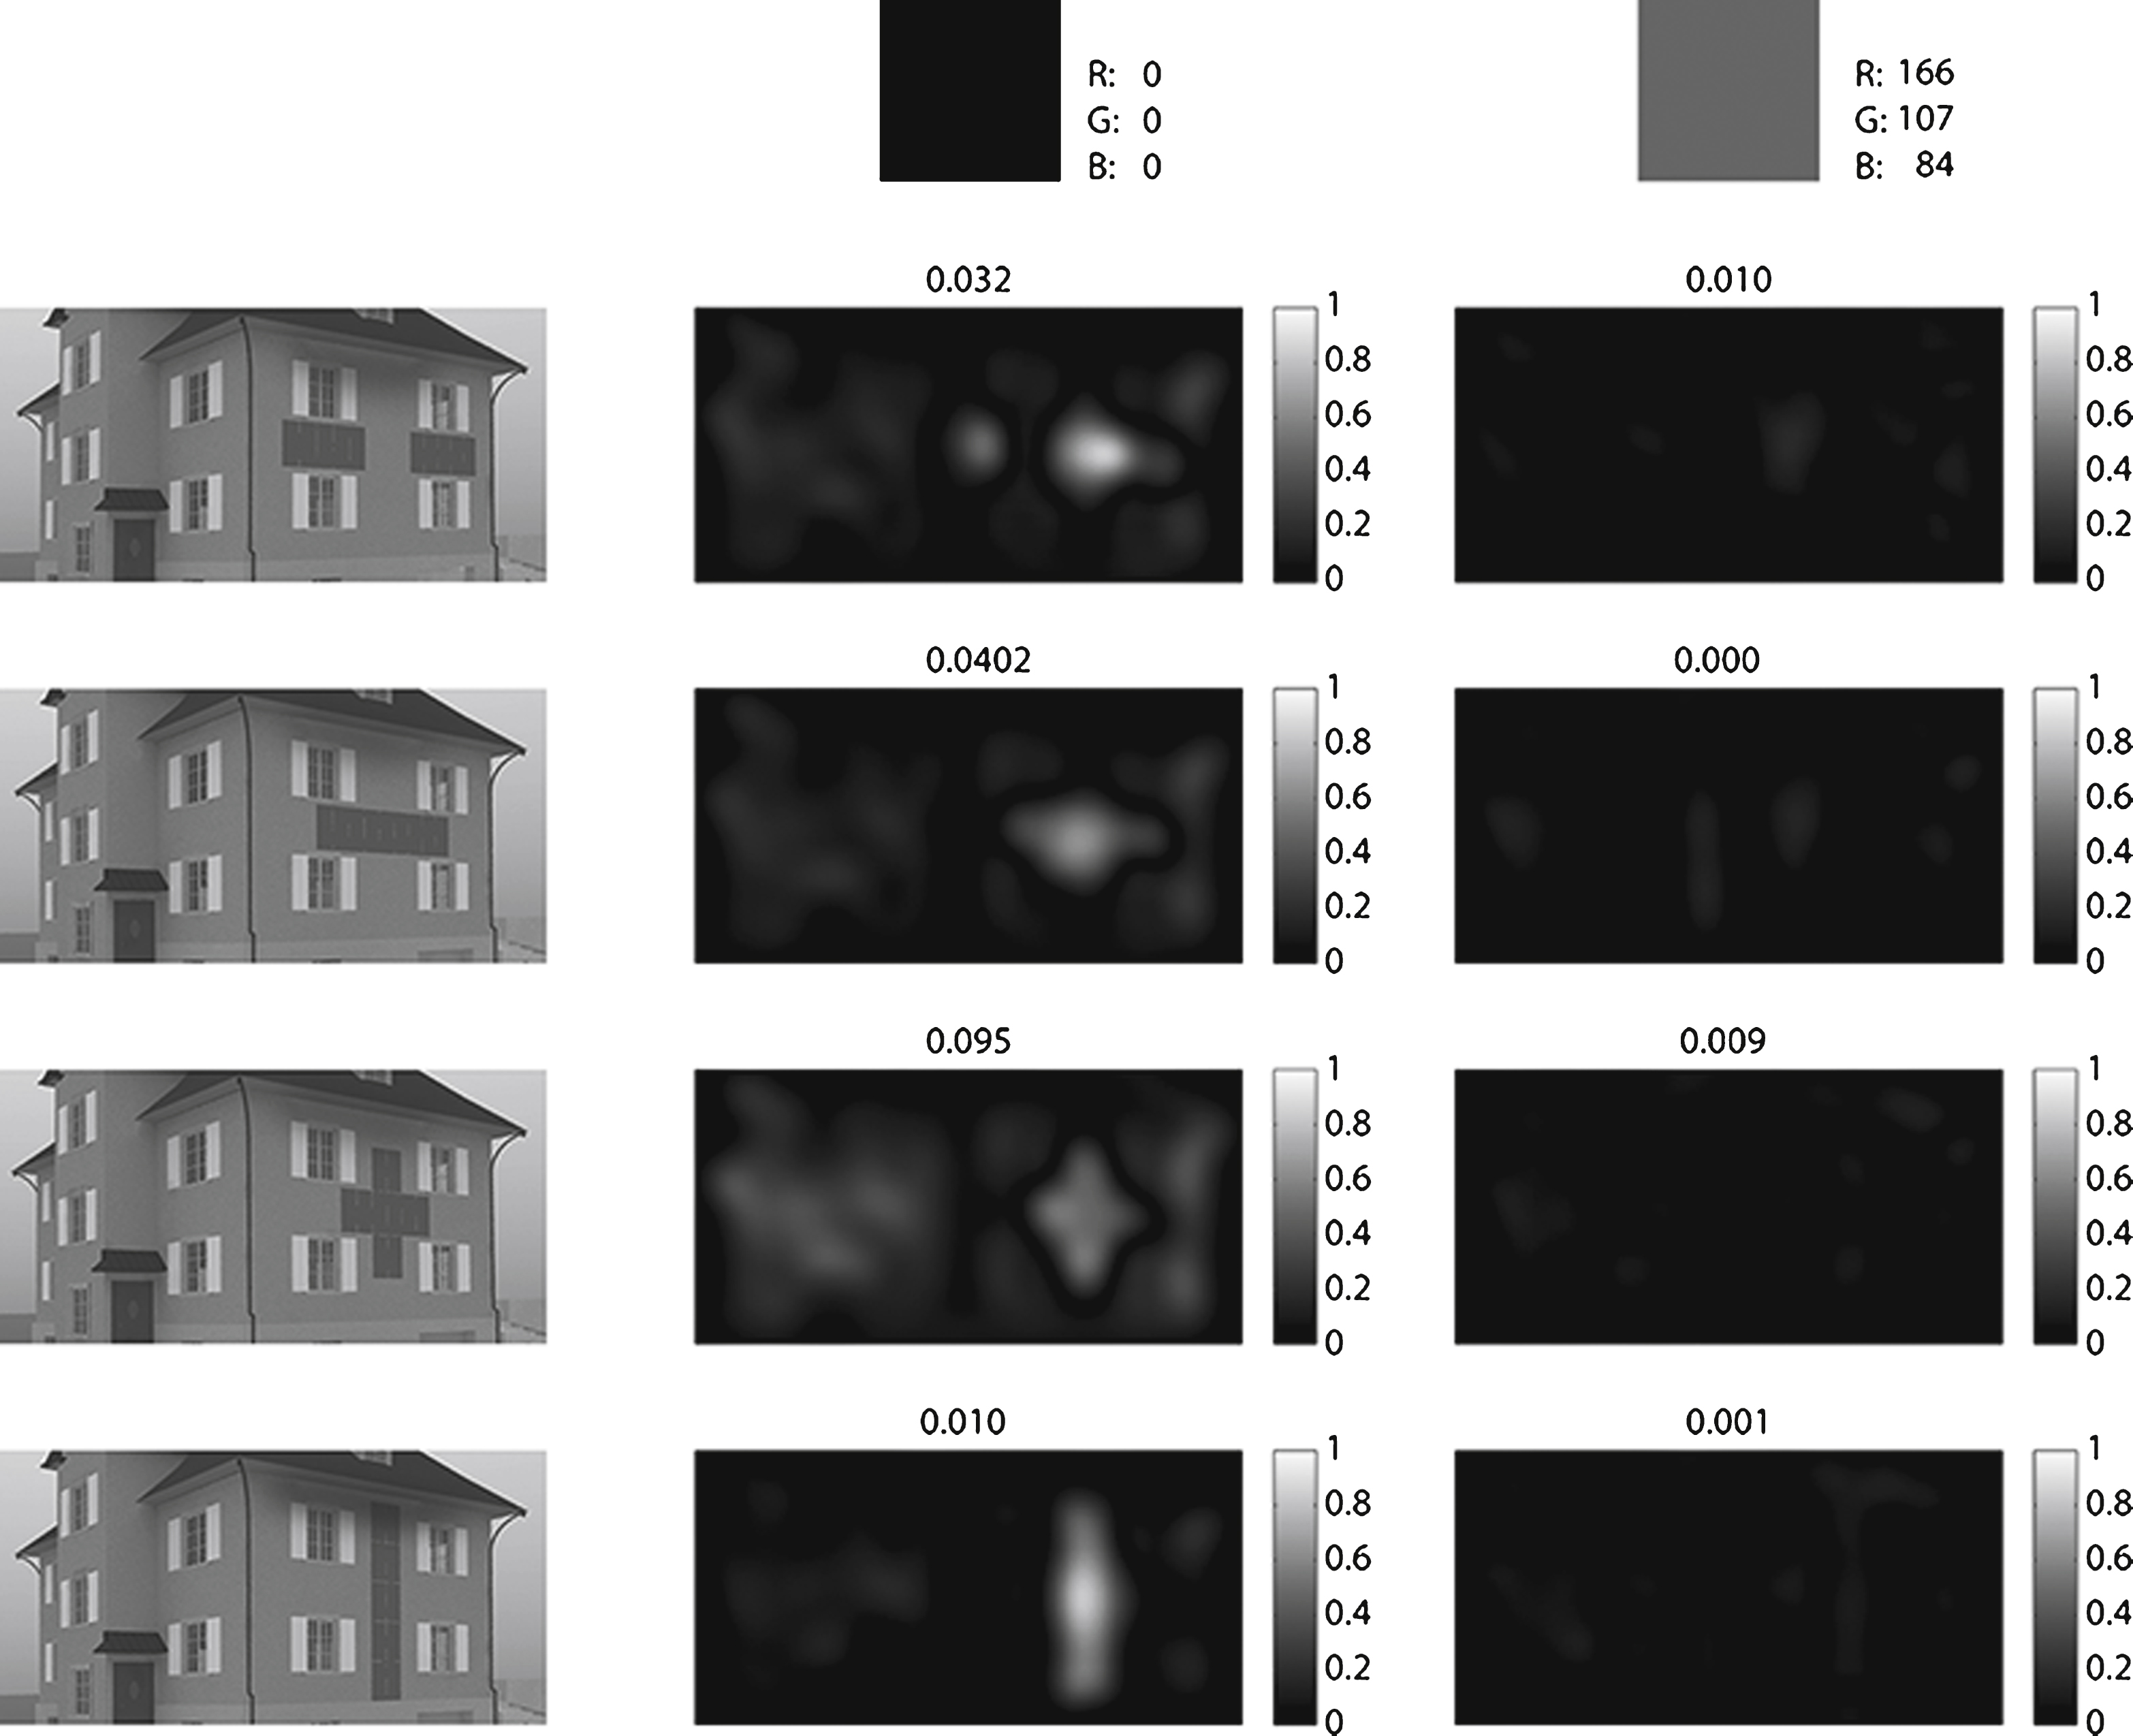
Fig.11
In the first row of each delta saliency map: the pixels that have a change in saliency value (white area) of more than 0.1 are counted (see formula (2)). In the second row of each delta saliency map: the percentage of pixels that do not have a change in saliency value (black area) of more than 0.1 are counted (see formula (3)).
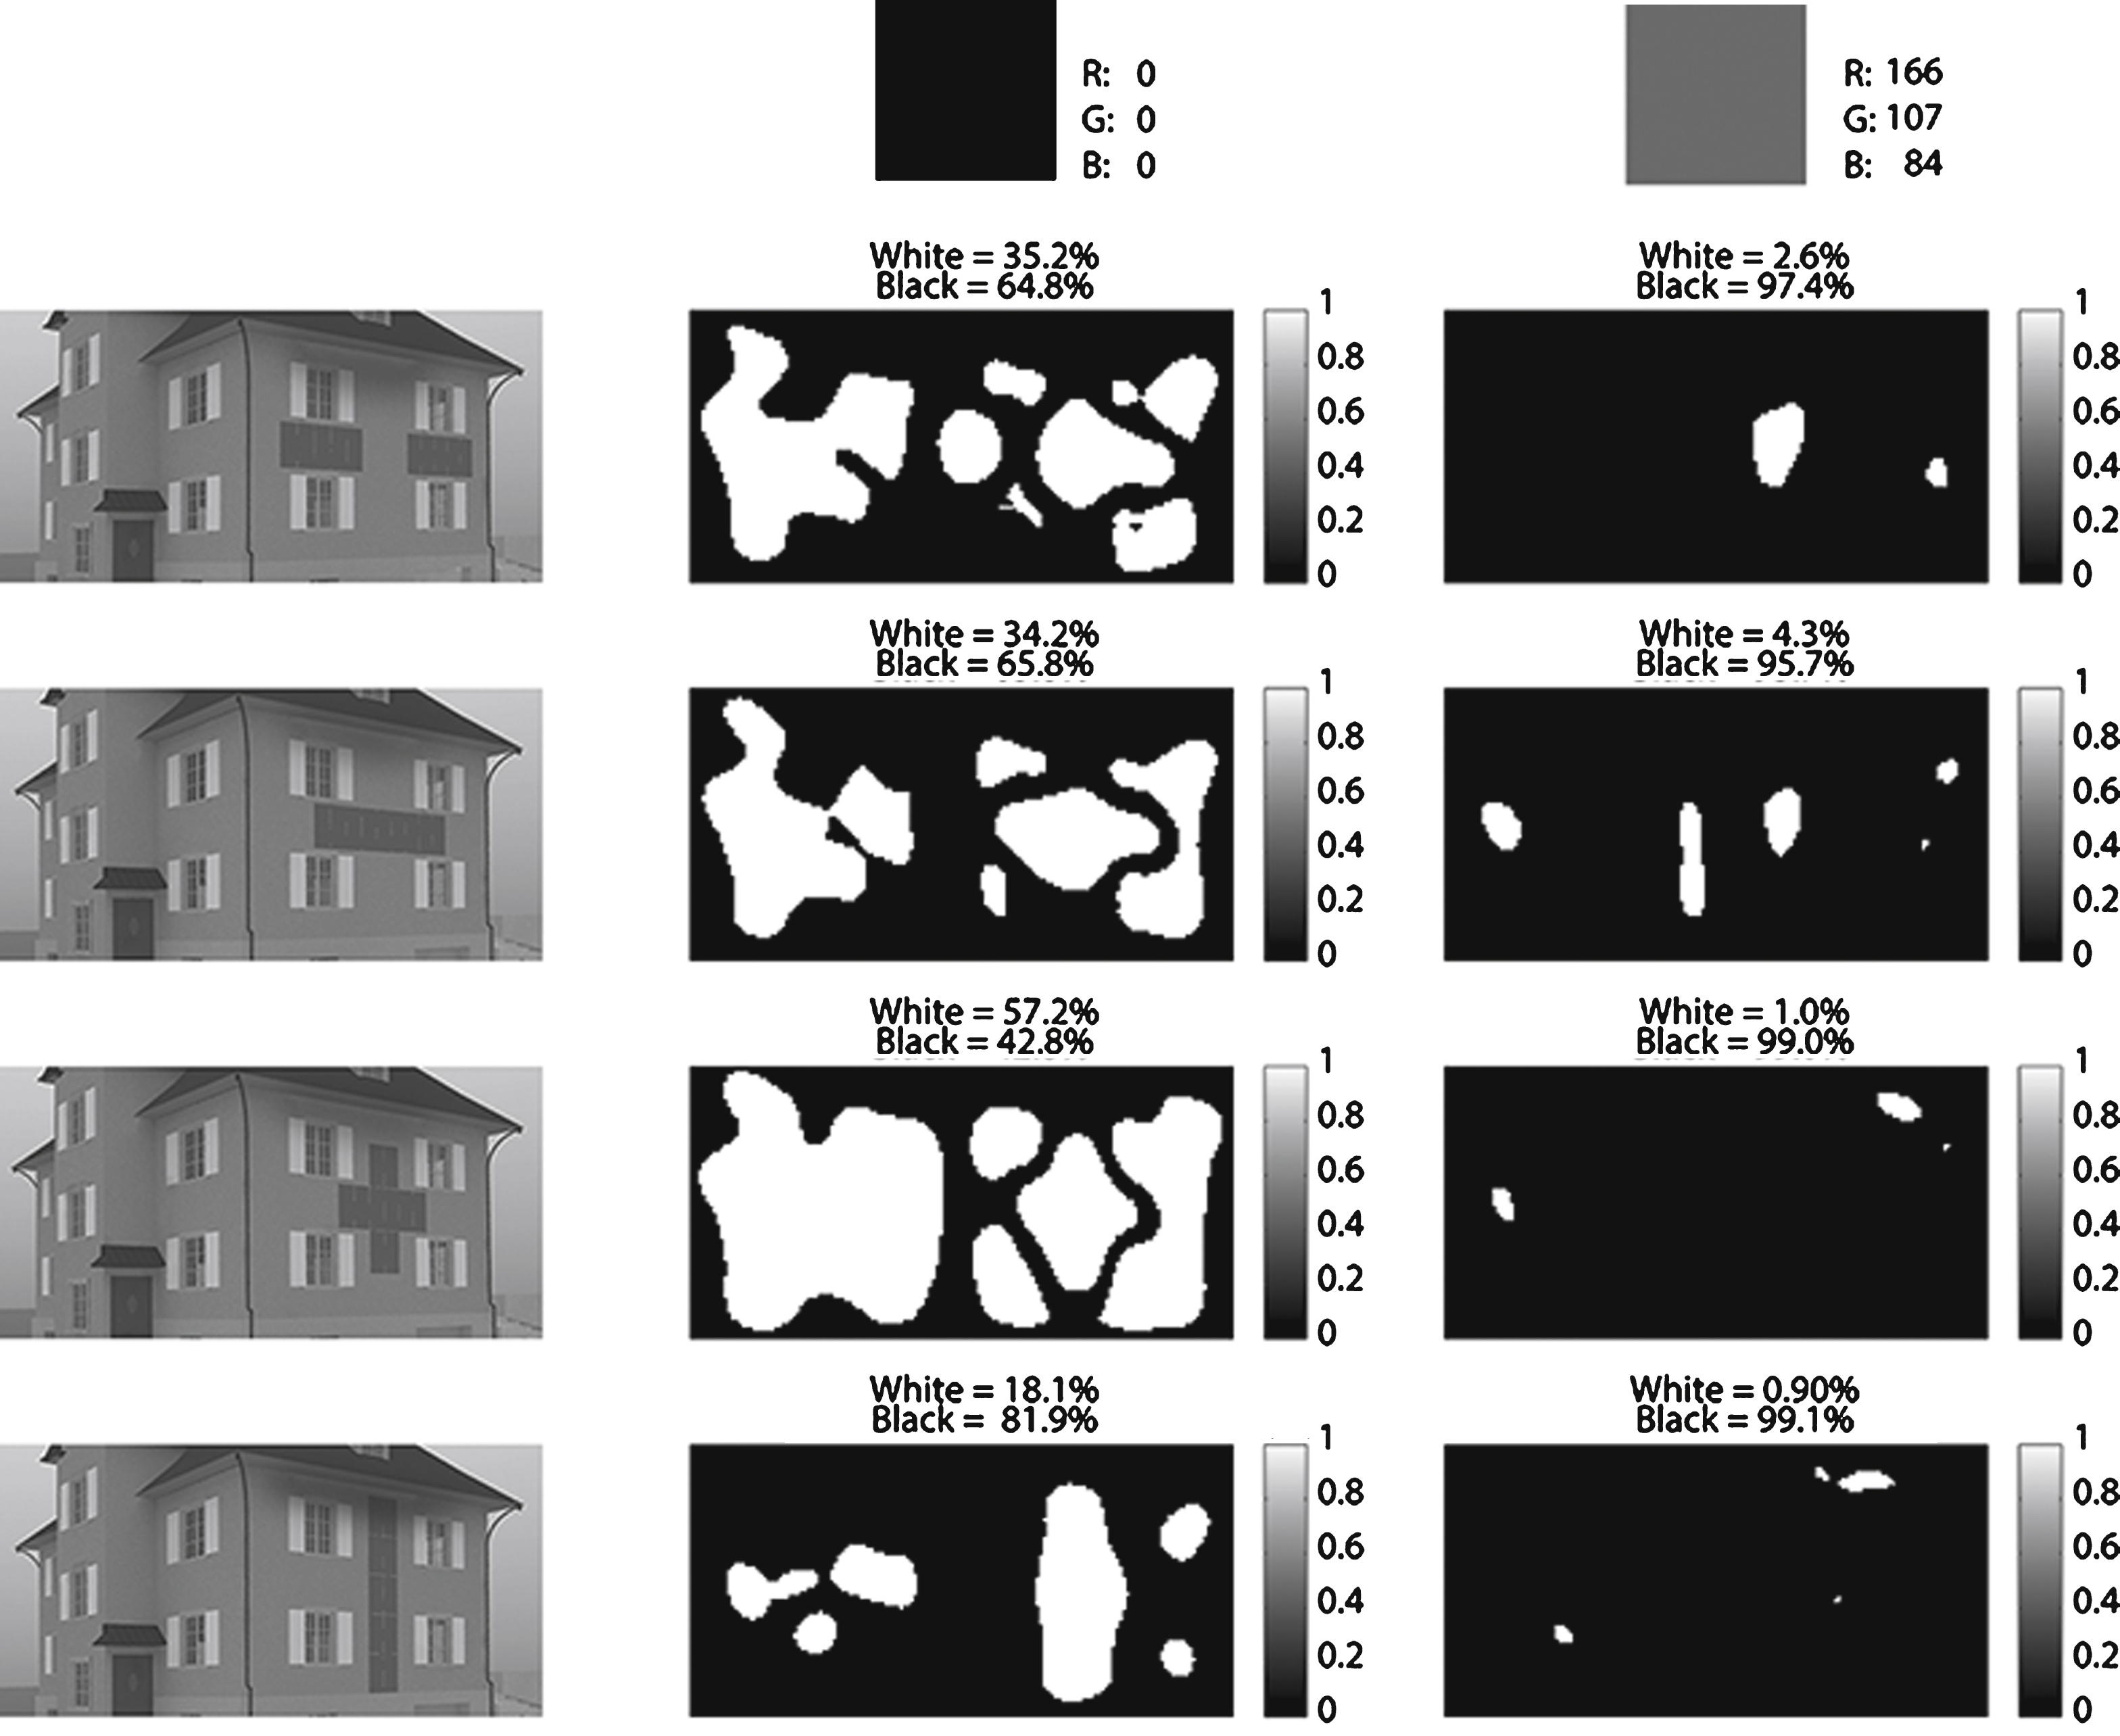
Table 1
The summary of work steps and deliverables
| Process Stage | No. | Step name | Description | Deliverable |
| Pre-processing | 1) | As is | Capture a photo of the historical building’s original state | 2D photo ‘as is’ |
| 2) | 3D model rendering of the historical building in its original state. Viewpoint must be the same as 2D photo ‘as is’. | 2D rendering ‘as is’ | ||
| 3) | BIPV Designs | 3D model renderings of the historical building with different BIPV designs. Viewpoint must be the same as 2D photo ‘as is’. | 2D renderings ‘new’ | |
| Processing | 4) | Saliency | Generate Itti-Koch saliency maps of all 2D renderings ‘as is’ and ‘new’ | 3D Itti-Koch saliency maps ‘as is’ and saliency maps ‘new’ |
| Post-processing | 5) | Comparison | Calculate differences between the saliency map ‘as is’ with each saliency map ‘new’ | Delta saliency maps |


