
Prevalence and factors associated with low back pain in warehouse workers: A cross-sectional study
Abstract
BACKGROUND:
Low back pain is a highly prevalent musculoskeletal disorder that leads to functional incapacity and absence from work.
OBJECTIVE:
To analyze warehouse workers’ prevalence and factors associated with low back pain.
METHODS:
Cross-sectional study design with 204 male warehouse workers (stocker, separator, checker, and packer) from motor parts companies. Age, body mass, marital status, education, the practice of physical exercise, presence of pain, low back pain intensity, comorbidities, time away from work, handgrip strength, flexibility, and trunk muscle strength were collected and analyzed. Data are presented as mean, standard deviation, absolute and relative frequency. A binary logistic regression was performed, with low back pain (yes or no) as the dependent variable.
RESULTS:
24.0% of the workers reported low back pain with an average intensity of 4.7 (
CONCLUSION:
Low back pain prevalence was 24% among young warehouse workers, more likely in separation tasks. A greater handgrip and trunk strength can be a protective factor to no low back pain.
1.Introduction
Musculoskeletal disorders represent one of the leading causes of absence from the work environment and may cause temporary and permanent disability, besides high costs [1, 2]. The symptoms of musculoskeletal affection are pain, fatigue, loss of strength, and functional limitation or even disability [1, 2, 3, 4]. Low back pain is a musculoskeletal disorder that most affects the world population, with more prevalence in females aged 40 to 80 [5, 6]. In addition, the overall prevalence of low back pain has been studied. It is estimated to be 31% of the population; the average point prevalence is 18%, and the one-year majority is 30% [6]. And that 39% of adults will suffer at least one episode of low back pain throughout their lives [6].
In Brazil, in 2008, a survey conducted by the Brazilian Institute of Geography and Statistics called the National Household Sample Survey (PNAD) pointed out that low back pain is the second largest complaint of Brazilians [7]. In Brazil, between 2012 and 2016, there are estimates for total expenses for low back pain of US $ 460 million, 880,000 diagnostic images, 59 million days away from work, with more men hospitalized than women [2, 8]. In European countries, it is estimated to spend 2 to 4 billion annually; in Australia, it is around 9 billion Australian dollars; in the United States, between 12 to 90 billion dollars with direct services (doctors and medicines) and from 9 to 29 billion dollars annually [9, 10].
The work-related musculoskeletal disorders have reasonable evidence of association with biomechanical, psychosocial, and individual risk factors such as weightlifting, awkward postures, repetitive movements, high body mass index, high psychosocial demands at work, presence of comorbidities, and smoking [11]. The risk factors associated with low back pain still need more studies. Still, it is already known that bending backward, pulling objects during work, and prolonged standing posture increases the chances of low back pain occurrence [12]. In addition, exposure to some mechanical biomechanical and psychosocial factors, even for a short time, can increase the risk of low back pain [13]. Among the occupational activities with the highest biomechanical exposure are warehouse workers, which include stocking, picking, checking, and packing tasks [14]. The occupational risk factors are physical layout, equipment, products handled, and work organization [14, 15, 16]. Manual load-handling activities are carried out an average of 74% of the working day, which is particularly hazardous for the low back [14]. Despite being very relevant results of prevalence and factors associated with low back pain, studies with warehouse workers are lacking [15, 16].
This study aimed to identify the prevalence of low back pain in warehouse workers and to evaluate the associated factors.
2.Methods
2.1Study design
This cross-sectional study aimed to evaluate the prevalence of low back pain in workers. It is reported according to the STROBE guideline. The Ethics Committee of the Universidade Cidade de São Paulo, São Paulo, Brazil approved the study (2.372.435) based on the Declaration of Helsinki.
2.2Setting and participants
Participants were the employees of a motorcycle parts importer with 15 distributors in several states of Brazil, with about 600 employees in the administrative and production sectors. It identified 240 warehouse workers from 7 distributors, considering occupational tasks performed (stockers, separators, checkers, and packers) between November and December 2017. The warehouse workers’ tasks: Stockers are responsible for receiving and storing incoming products, organizing stock, and delivering packaged products; they use 4-wheeled carts or skids. The separator tasks perform the separation of products and leave them near the checkers’ tables; they use carts with two wheels or skids; The checkers verify the separated goods and leave them on the table and sometimes already put them in the boxes along with the packer; they perform their work at the tables standing; The packers divide the goods into boxes, pack, pass the tape, then the sealing tape and will leave the boxes at the delivery address for the stockers to deliver the goods on the truck. There was no job rotation among the workers.
2.2.1Eligibility
2.2.1.1 Inclusion and exclusion criteria
All participants were male, between 18–60 years, had worked as warehouse workers for more than six months; 2) had signed the free and informed consent form; 3) workers with and without low back complaints were included in the research. All workers who were away on medical leave or had been working for less than one year in the company were excluded.
2.3Material and equipment
An evaluation form was used to collect information such as age, marital status, education, activity performed by the warehouse workers (stockers, separators, checkers, and packers), body mass index (BMI), the practice of physical exercise (yes or no), and exercise during rest breaks at work, leisure, domestic activity, use of medication, comorbidities, absences, hand dominance, right (R) and left (L) handgrip strength, trunk muscle strength, trunk flexibility-inclination, presence and intensity of low back pain.
The body mass index (IBM) was classified based on the WHO, which states that below 18.5 – underweight; between 18.5 and 24.9 – ideal weight; between 24.9 and 29.9 – overweight; between 30 and 34.9 – obese grade I (mild); between 35 and 39.9 – obese grade II (moderate); equal to or greater than 40 – obese grade III (severe).
Three pieces of equipment were used for direct measurement analysis: an electrogoniometer, hand, and lumbar dynamometer. The electrogoniometer and lumbar dynamometer measured trunk inclination and maximum strength, respectively, and the hand dynamometer measured grip strength bilaterally. The devices were connected to a microcomputer via a USB port.
2.4Procedure
After signing the informed consent form, all participants filled in their data (years old, marital status, education), occupational information, and the presence of low back pain. If they answered yes, we asked about pain intensity on an 11-point scale. The physical therapist collected this information in a simple questionnaire prepared by the research team. Then weight and height were measured to calculate the body mass index. After checking the dominance manual, we alternately measured the handgrip strength with three repetitions for each side (Right and Left). We wrote it down on the evaluation form according to the protocol recommended [17]. Next, the electrogoniometer was fixed on the side of the trunk (at the height of the 12th coastal arches), and asked the subject was to get on the lumbar dynamometer and perform the trunk flexion, making some observations such as: do not bend the knee – Fig. 1, pull for 10 s – command: “pull until I ask you to stop,” repeated three times. The data acquired were recorded on the computer and noted on the evaluation form. The data were collected according to the availability of workers during the workday over 15 days.
2.5Outcome measures
2.5.1Visual analog pain scale (VAS)
The VAS scale was used to assess the low back pain intensity in warehouse workers who, at the time of the interview, if they had musculoskeletal pain (yes or no) in this region of the body [18]. The VAS scale can be represented by a straight line divided by ten spaces of the same size numbered from 0 to 10, where 0 means total absence of pain, five moderate degrees of pain, and 10 is the maximum pain level bearable by the worker. Before applying the scale, the physical therapist explained to the warehouse workers that if there is no pain, the rating is zero (0); and the maximum pain reference scale is ten (10).
2.5.2Muscle strength analysis
A Lumbar Dynamometer (EMG System) calculated the lumbar muscle strength by maximum voluntary contraction. The participants initially positioned the spine in flexion at 30 degrees and exerted force to extend the trunk (Fig. 1). The dynamometer was connected to a microcomputer through the USB port that received the signal from the lumbar dynamometer, maximum capacity of 200 kgf. (Model EMG 830C, EMG System do Brasil Ltda), With a sampling frequency of 2 kHz per channel, resolution of 16 bits, amplification gain 2000 times, common mode rejection
Handgrip strength was measured by a dynamometer with three times repetition of the maximum grip force for 10 s and used the greatest value. Low handgrip strength [17] and reduced trunk strength [19] have been associated with low back pain [17, 19].
Figure 1.
Position of the trunk strength test on the lumbar dynamometer.
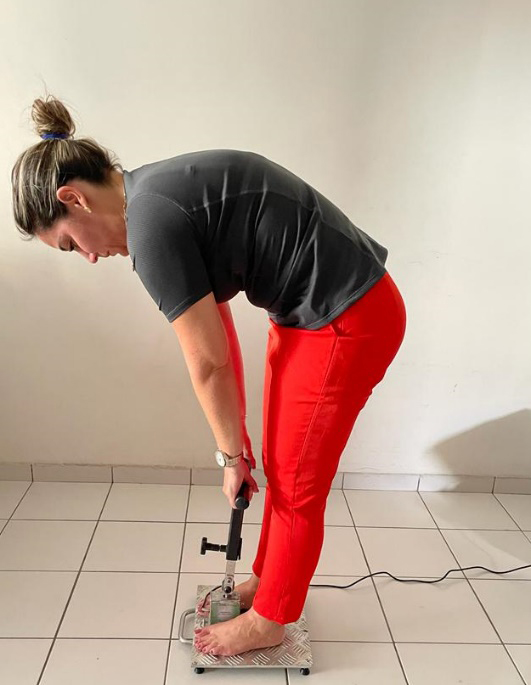
Table 1
Sociodemographic, occupational, living habits, and health condition variables of the participants (
| Variables | All participants ( | Low back pain ( | ||
| Age (years) | 33.0 | (6.7) | 34.7 | (8.0) |
| 20–29 | 73 | (35.8) | 15 | (30.6) |
| 30–39 | 100 | (49.0) | 24 | (49.0) |
| 40–49 | 25 | (12.3) | 6 | (12.2) |
| 6 | (2.5) | 4 | (8.2) | |
| Weight (kg) | 69.5 | (10.5) | 71.2 | (9.5) |
| Height (meters) | 1.7 | (0.0) | 1.7 | (0.0) |
| BMI (Kg/m | 24.5 | (3.4) | 24.7 | (3.3) |
| Marital status | ||||
| Single | 99 | (48.5) | 24 | (49.0) |
| Married | 86 | (42.2) | 23 | (46.9) |
| Common-law marriage | 17 | (8.3) | 1 | (2.0) |
| Divorced | 2 | (1.0) | 1 | (2.0) |
| Educational level | ||||
| Incomplete elementary school | 32 | (15.7) | 7 | (14.3) |
| Complete elementary school | 20 | (9.8) | 6 | (12.2) |
| Incomplete high school | 33 | (16.2) | 8 | (16.3) |
| Complete high school | 113 | (55.4) | 26 | (53.1) |
| Incomplete higher education | 6 | (2.9) | 2 | (4.1) |
| Occupational tasks | ||||
| Stocker | 104 | (51.0) | 12 | (24.5) |
| Separator | 52 | (25,5) | 19 | (38,8) |
| Checker | 24 | (11.8) | 11 | (22.4) |
| Packer | 24 | (11.8) | 7 | (14.3) |
| Time on the job (years) | 3.7 | (1.1) | 3.2 | (1.8) |
| Exercise at the workplace (yes) | 183 | (89.7) | 47 | (95.9) |
| Practice physical exercise (yes) | 100 | (49.0) | 23 | (46.9) |
| Domestic activity (yes) | 75 | (36.8) | 11 | (22.4) |
| Leisure activity (yes) | 183 | (89.7) | 44 | (89.8) |
| Low back pain intensity | – | 4.7 | (2.4) | |
| (0–10 points) | ||||
| Pain medication use (yes) | – | 3 | (6.1) | |
| Time off work (yes) | 53 | (26.0) | 11 | (22.4) |
| Manual dominance (right – | 187 | (91.7) | 47 | (95.9) |
| right-handed) | ||||
| Handgrip strength (R) (kgf) | 41.6 | (7.1) | 40.2 | (7.1) |
| Handgrip strength (L) (kgf) | 40.3 | (6.9) | 40.0 | (6.4) |
| Trunk inclination (degrees) | 30.8 | (13.8) | 31.7 | (15.6) |
| Trunk strength (kgf) | 61.4 | (34.5) | 45.9 | (28.6) |
Continuous variables are presented as Mean and Standard Deviation, and categories as absolute (n) and relative (%) frequency. D (Right), E (Left).
2.6Statistical analysis
Statistical analyses were performed in the SPSS 23.0 IBM
3.Results
Of the total warehouse workers in the company, 204 were interviewed according to eligibility criteria. All males had a mean age of 33.0 (6.7) years, most with complete high school education level, with normal body weight, and a mean of 3 years on the job (Table 1). Warehouse workers were classified according to their occupational task into 51% stockers, 25.5% separators, and 11.8% checkers and packers. Of the 24% (
As for manual dominance, most were right-handed, with a similar handgrip strength pattern and trunk inclination angles, although the trunk strength was much lower for those with low back pain (Table 1). Table 2 shows a likelier low back pain in separator tasks, with a trend more likely in older workers. The higher handgrip strength in the dominant (right) hand and trunk strength had associated with no low back pain.
Table 2
Binary Logistic Regression Analysis associated with pain (yes or no) final data and permanence of variables in the model after two rounds (
| Variables | B | OR | IC 95% | |
|---|---|---|---|---|
| Age | 0.065 | 1.067 | 0.998–1.140 | 0.050 |
| Occupational tasks | ||||
| Separator (Ref) | – | – | – | – |
| Stocker | 0.99 | 0.278–3.544 | 0.990 | |
| Packer | 0.68 | 0.188–2.474 | 0.561 | |
| Checker | 0.08 | 0.026–0.257 | 0.000 | |
| BMI | 0.123 | 1.13 | 0.990–1.293 | 0.071 |
| Physical exercise | 0.775 | 2.17 | 0.916–5.149 | 0.078 |
| Handgrip strength right | 0.93 | 0.893–0.988 | 0.015 | |
| Trunk strength | 0.97 | 0.957–0.985 | 0.000 |
OR – Odds Ratio.
4.Discussion
Our findings showed that the prevalence of pain was 24% among warehouse workers, higher for waste pickers. Low back pain was associated with an occupational task, greater risk for the separator, and lower handgrip and trunk strength values.
Low back pain is the musculoskeletal disorder with the highest prevalence worldwide. [3, 4, 5, 9] generating disability and much time off work (26 to 37%), and increased costs [4, 21]. The prevalence of pain among warehouse workers was 24% high, although lower than the overall prevalence of low back pain, estimated at 31%, and the one-year prevalence of 30%. Still, higher than the average point prevalence is 18% [6]. Best estimates in Brazil suggest that 11 to 12% of the population are disabled by chronic nonspecific low back pain [7, 21].
Our study verified that even young warehouse workers have low back pain associated with age, occupational tasks, handgrip strength, and trunk strength. Warehouse workers perform four tasks with no job rotation between them (stockers, separators, checkers, and packers), but only the sorter task significantly affects low back pain. The sorter lifts and transports cargo in two-wheeled carts, sorting goods, and constantly holds a clipboard in his dominant hand. This occupational task generates flexion and twisting of the trunk, and awkward postures are biomechanical factors associated with low back pain [12]. The awkward postures mean working in positions that deviate from neutral, increasing body parts overload and the risk factors of musculoskeletal disorders [11, 12]. The intensity and frequency of lifting materials in an occupational environment indicate low back pain; lifting over 25 kg and frequency greater than 25 times a day, low back pain may be more evident [22]. A possible solution to minimize the risk factors are ergonomic interventions in products, layout, and work organization [14, 15, 16].
The lower handgrip strength and the trunk strength were associated with the more likely the employee is to experience low back pain, corroborating the results of other studies [17, 19]. The handgrip strength is also a measure of functionality and health status, but it should be analyzed in association with age and gender [23]. A study comparing trunk muscle strength before and after the daily workday in shipbuilding workers found that with low back pain, strength reduces due to exertion and fatigue [24].
Low back pain limits activities of daily living in 17.3%, representing about 540 million people affected [19]. However, most study participants experienced pain, performed physical exercise at the workplace, 90% cherished their leisure, and only 3 took medication. These findings may be related to the effect of the healthy worker, the condition of those who are active at work, and thus demonstrate better health outcomes [25, 26]. Almost 50% of the employees who feel pain perform physical exercise inside (in the workplace during rest breaks) and regular physical exercise. The practice of physical exercise as single conduct is not shown to be effective for preventing chronic musculoskeletal disorders at work, such as low back pain [27]. Still, interventions can prevent and even minimize low back pain [27, 28, 29].
The survey on the prevalence of low back pain in warehouse workers was a strength of this study. This is the largest contribution ever seen in publications on these groups of workers. In addition, identify some potential risk factors associated with low back pain in these workers. To allows advances in the scientific findings and contribute to outcomes in longitudinal studies. Besides, assess the burden of disease in this specific population, plan actions and allocate health resources.
The study’s limitations may be related to the population of workers being young and having a short time on the job, which could generate some selection bias. However, this is a characteristic of workers hired for this type of regional occupational activity. However, verifying a trend in the association between low back pain and older workers has already been possible. The healthy worker effect may have influenced our results, as workers away from work were not included in the study. In addition, it is self-report by workers that may contain subjective information, exaggerated reports, or lack of response for fear that this information will reach managers. The cross-sectional studies have a potential risk of bias considering the interpretation of the results since it is impossible to ensure the cause and effect has concomitantly. Hence, it is necessary to perform a longitudinal study to confirm our findings for association data.
5.Conclusion
Low back pain prevalence was 24% among young warehouse workers. The separator tasks presented more likely the presence of pain; there is a more likely trend with older workers. The greater handgrip strength of the dominant right hand and trunk can be protective factors for these workers.
Ethical approval
The study was approved by the Ethics Committee of Universidade Cidade de São Paulo, São Paulo, Brazil (2.372.435).
Funding
The study was financed in part by the Coordenação de Aperfeiçoamento de Pessoal de Nível Superior – Brasil (CAPES) under finance code 001.
Informed consent
Informed consent was obtained from all subjects prior to enrollment.
Acknowledgments
The authors thank the physical therapists and everyone who contributed directly or indirectly to this work.
Conflict of interest
The authors declare that they have no conflict of interest.
References
[1] | Airaksinen O, Brox JI, Cedraschi C, Hildebrandt J, Klaber-Moffett J, Kovacs F, et al. COST B13 Working Group on Guidelines for Chronic Low Back Pain. Chapter 4. European guidelines for the management of chronic nonspecific low back pain. Eur Spine J. (2006) Mar; 15 Suppl 2(Suppl 2): S192-300. |
[2] | Delitto A, George SZ, Van Dillen L, Whitman JM, Sowa G, Shekelle P, et al. Orthopaedic section of the american physical therapy association. Low back pain. J Orthop Sports Phys Ther. (2012) Apr; 42: (4): A1-57. |
[3] | Blyth FM, Briggs AM, Schneider CH, Hoy DG, March LM. The global burden of musculoskeletal pain-where to from here? Am J Public Health. (2019) Jan; 109: (1): 35-40. |
[4] | GBD 2016 DALYs and HALE Collaborators. Global, regional, and national disability-adjusted life-years (DALYs) for 333 diseases and injuries and healthy life expectancy (HALE) for 195 countries and territories, 1990–2016: a systematic analysis for the Global Burden of Disease Study 2016 [published correction appears in Lancet. 2017 Oct 28; 390(10106): e38]. Lancet. (2017) ; 390: (10100): 1260-1344. |
[5] | Hagen K, Linde M, Heuch I, Stovner LJ, Zwart JA. Increasing prevalence of chronic musculoskeletal complaints. A large 11-year follow-up in the general population (HUNT 2 and 3). Pain Med. (2011) ; 12: (11): 1657-1666. |
[6] | Hoy D, Bain C, Williams G, March L, Brooks P, Blyth F, et al. A systematic review of the global prevalence of low back pain. Arthritis Rheum. (2012) Jun; 64: (6): 2028-37. |
[7] | Barros MB, Francisco PM, Zanchetta LM, César CL. Tendências das desigualdades sociais e demográficas na prevalência de doenças crônicas no Brasil, PNAD: 2003–2008 [Trends in social and demographic inequalities in the prevalence of chronic diseases in Brazil. PNAD: 2003–2008]. Cien Saude Colet. (2011) ; 16: (9): 3755-3768. doi: 10.1590/s1413-81232011001000012. |
[8] | Dagenais S, Caro J, Haldeman S. A systematic review of low back pain cost of illness studies in the United States and internationally. Spine J. (2008) Jan-Feb; 8: (1): 8-20. |
[9] | GBD 2019 Diseases and Injuries Collaborators. Global burden of 369 diseases and injuries in 204 countries and territories, 1990–2019: A systematic analysis for the Global Burden of Disease Study 2019. Lancet. (2020) Oct 17; 396: (10258): 1204-1222. |
[10] | de Luca K, Briggs AM, French SD, Ferreira ML, Cross M, Blyth F, et al. Disability burden due to musculoskeletal conditions and low back pain in Australia: Findings from GBD 2019. Chiropr Man Therap. (2022) May 3; 30: (1): 22. |
[11] | Alsiddiky AM, Algarni N, Alluhaidan A. Prevalence and associated factors of low back pain among clinicians of a major referral hospital. Med J Malaysia. (2015) Feb; 70: (1): 12-7. |
[12] | Parreira P, Maher CG, Steffens D, Hancock MJ, Ferreira ML. Risk factors for low back pain and sciatica: An umbrella review. Spine J. (2018) Sep; 18: (9): 1715-1721. |
[13] | Taylor JB, Goode AP, George SZ, Cook CE. Incidence and risk factors for first-time incident low back pain: A systematic review and meta-analysis. Spine J. (2014) Oct 1; 14: (10): 2299-319. |
[14] | St-Vincent M, Denis D, Imbeau D, Laberge M. Work factors affecting manual materials handling in a warehouse superstore. Int. J. Ind. Ergonomics. (2005) ; 35: (1): 33-46. |
[15] | Basahel AM. Investigation of work-related musculoskeletal disorders (MSDs) in warehouse workers in Saudi Arabia. Procedia Manuf. (2015) : 3: : 4643-4649. |
[16] | Ozguler A, Leclerc A, Landre MF, Pietri-Taleb F, Niedhammer I. Individual and occupational determinants of low back pain according to various definitions of low back pain. J Epidemiol Community Health. (2000) Mar; 54: (3): 215-20. |
[17] | Park SM, Kim GU, Kim HJ, Kim H, Chang BS, Lee CK, Yeom JS. Low handgrip strength is closely associated with chronic low back pain among women aged 50 years or older: A cross-sectional study using a national health survey. PLoS One. (2018) Nov 26; 13: (11): e0207759. |
[18] | Hjermstad MJ, Fayers PM, Haugen DF, Caraceni A, Hanks GW, Loge JH, Fainsinger R, Aass N, Kaasa S; European Palliative Care Research Collaborative (EPCRC). Studies comparing Numerical Rating Scales, Verbal Rating Scales, and Visual Analogue Scales for assessment of pain intensity in adults: A systematic literature review. J Pain Symptom Manage. (2011) Jun; 41: (6): 1073-93. |
[19] | Cho KH, Beom JW, Lee TS, Lim JH, Lee TH, Yuk JH. Trunk muscles strength as a risk factor for nonspecific low back pain: A pilot study. Ann Rehabil Med. (2014) Apr; 38: (2): 234-40. |
[20] | Hosmer Jr, David W. Lemeshow, Stanley; Sturdivant, Rodney X. Applied logistic regression. John Wiley & Sons. (2013) ; 518p. |
[21] | GBD 2017 Disease and Injury Incidence and Prevalence Collaborators. Global, regional, and national incidence, prevalence, and years lived with disability for 354 diseases and injuries for 195 countries and territories, 1990–2017: A systematic analysis for the Global Burden of Disease Study 2017. Lancet. (2018) Nov 10; 392: (10159): 1789-1858. |
[22] | Coenen P, Gouttebarge V, van der Burght AS, van Dieën JH, Frings-Dresen MH, van der Beek AJ, et al. The effect of lifting during work on low back pain: A health impact assessment based on a meta-analysis. Occup Environ Med. (2014) Dec; 71: (12): 871-7. |
[23] | Budziareck MB, Pureza Duarte RR, Barbosa-Silva MC. Reference values and determinants for handgrip strength in healthy subjects. Clin Nutr. (2008) Jun; 27: (3): 357-62. |
[24] | Mendes AAMT, de Freitas SMSF, Amorin CF, Cabral CMN, Padula RS. Electromyographic activity of the erector spinae: The short-effect of one workday for welders with nonspecific chronic low back pain, an observational study. J Back Musculoskelet Rehabil. (2018) ; 31: (1): 147-154. |
[25] | Chowdhury R, Shah D, Payal AR. Healthy worker effect phenomenon: Revisited with emphasis on statistical methods – a review. Indian J Occup Environ Med. (2017) ; 21: (1): 2-8. |
[26] | Dantas RG, Perracini MR, Guerra RO, Ferriolli E, Dias RC, Padula RS. What are the sociodemographic and health determinants for older adults to continue to participate in work? Arch Gerontol Geriatr. (2017) ; 71: : 136-141. |
[27] | Foster NE, Anema JR, Cherkin D, Chou R, Cohen SP, Gross DP, et al. Prevention and treatment of low back pain: Evidence, challenges, and promising directions. Lancet. (2018) ; 391: (10137): 2368-2383. |
[28] | Skamagki G, King A, Duncan M, Wåhlin C. A systematic review on workplace interventions to manage chronic musculoskeletal conditions. Physiother Res Int. (2018) ; 23: (4): e1738. |
[29] | Santos HG, Chiavegato LD, Valentim DP, Padula RS. Effectiveness of a progressive resistance exercise program for industrial workers during breaks on perceived fatigue control: A cluster randomized controlled trial. BMC Public Health. (2020) ; 20: (1): 849. |


