
Assessment of systemic joint laxity in the clinical context: Relevance and replicability of the Beighton score in chronic fatigue
Abstract
BACKGROUND:
Persistent symptoms in patients with systemic joint laxity (SJL) are often equivalent with complications. Screening for SJL is an important part of the assessment of musculoskeletal phenotype. The common measuring tool, the Beighton score (BS), still has unclear evidence.
OBJECTIVE:
To assess the Beighton score in a clinical context for (1) ability to classify SJL as absent or present (criterion validity), and (2) interrater reliability (physician-physiotherapist), for a dichotomous cut-off (yes/no), as well as for interpretation in categories (no, some, clear SJL).
METHODS:
This real-world observational study included 149 consecutive patients seeking secondary care for investigation of possible myalgic encephalomyelitis/chronic fatigue syndrome. Assessment was done during a routine examination. Data were evaluated with Cohen’s kappa and Spearman’s rho.
RESULTS:
BS criterion validity showed poor agreement with the assessment of SJL: percentage agreement was 74 % and kappa 0.39 (3-cut level), 73 % and kappa 0.39/0.45 (4-/5-cut level). The best interrater reliability was moderate (rho 0.66) for interpretation in categories.
CONCLUSIONS:
The BS alone was not a reliable proxy for SJL and should be supplemented with a targeted history. Nevertheless, its interrater reliability was acceptable, and the categorised score appears to have greater clinical relevance than the dichotomous score.
1.Background
Musculoskeletal conditions are the main cause (17%) worldwide behind ‘years lived with disability’, according to the World Health Organization [1]. These conditions limit mobility and capacity, leading to early retirement, lowered quality of life and constrained societal participation [1].
Systemic joint laxity because of overly elastic connective tissue, here defined as a range of motion beyond normal limits in multiple joints [2], is common, being present in 20–30% of the population [3] and with women in majority [4]. When this is accompanied by persistent symptoms, it is termed hypermobility spectrum disorder [2], or the hypermobility type of Ehlers-Danlos syndrome [5] (definition-wise, the latter encompasses a more pronounced over-elasticity in soft tissue), with a prevalence of around 0.2% [6]. Patients who have a hypermobility spectrum disorder risk to develop persistent grave discomfort, including the condition chronic fatigue syndrome (CFS), also referred to as myalgic encephalomyelitis (ME) [7]. ME/CFS is a complex and debilitating disorder that account for a large portion of the primary care work load [8]. ME/CFS is similar to conditions such as fibromyalgia and whiplash-associated disorder (WAD) [9, 10], in that it is a ‘central sensitivity syndrome’ [9, 11]. Post-exertional malaise (PEM) is considered to be distinguishing for ME/CFS [12]. This has been more acknowledged in recent years [7, 13], and stricter standards are needed for accurate clinical assessment of systemic joint laxity in the initial health care contact [14]. Perhaps the most common instrument today is the Beighton score (BS). Given its prominent place in diagnostics, it must also be dependable at a primary level of care, in a bedside assessment in less experienced hands. A scientific evaluation of the Beighton score’s factual classification capacity would result in better-defined study populations in research, and would pave the way in the clinic for adequate interventions and a suitable regimen when the musculoskeletal durability to load was challenged.
The outcome of the BS has traditionally been dichotomised to reflect its role in the clinic. Either a 4- or a 5-cut level is usually considered a positive test outcome indicating systemic joint laxity [15]. To acknowledge the patient’s past joint mobility status (and not just their current status), the Five-part Questionnaire (5PQ) [16] is considered to be a psychometrically sound method. Both the BS and the 5PQ are widely used and have the prerequisites to contribute to the investigation [15]. The latest systematic review on the BS measurement properties [17] concluded that it is a highly reliable tool, but that the reproducibility between assessors from different professional fields has not yet been studied. A systematic review from 2017 deemed its criterion validity not sufficiently researched, especially regarding modes of interpretation [15]. Since systemic joint laxity is a continuum [18, 19], an interpretation of the degree of such laxity may be expected to serve patient management better than a dichotomous one. To the best of our knowledge, only one previous study [19] examined the stability of an interpretation in categories, and no previous study used an entirely clinical setting for this large group of patients. Our hypothesis was that the BS would also live up to earlier acceptable results for interrater reliability in this clinical setting. We further hypothesised that there would be a better unity and thereby a better measurement stability in the instrument when hypermobility was handled as a graded phenomenon. Furthermore, we assumed a BS alone would be able to identify or exclude systemic joint laxity to a great extent.
The aims of this study were to evaluate in a clinical context (1) if the BS alone was indicative of the condition systemic joint laxity (criterion validity), with 3-, 4- and 5-cut level (3 points being the minimum indication of the mid category, some systemic joint laxity) [19] for a group with persistent severe fatigue; and (2) interrater reliability in the BS, for dichotomous interpretation (yes/no) and for interpretation in categories (no, some, clear systemic joint laxity).
2.Methods
The screening was part of a routine clinical investigation with standardised content chosen at the clinic. The present report complies with the quality standards of the Strengthening the Reporting of Observational studies in Epidemiology (STROBE) for cohort studies [20].
Table 1
The Beighton score measurement tool [23]
| 5th metacarpophalangeal joint passive extension | One point per side |
|---|---|
| Thumb touching the volar forearm | One point per side |
| Elbow hyperextension | One point per side |
| Knee hyperextension | One point per side |
| Trunk flexion in standing, palms to the floor without flexing the knees | One point |
| Total maximum 9 points |
2.1Study design and population
This was a prospective diagnostic observational study conducted at the privately managed, publicly funded clinic in Stockholm, Sweden. The clinic is a specialist clinic for myalgic encephalomyelitis/chronic fatigue syndrome (ME/CFS), and thus investigates patients with severe persistent fatigue throughout Sweden. All study participants were referred to the clinic for ME/CFS investigations. At the time, recommendations for referring physicians were posted in the digital support hub for primary healthcare professionals, as follows: If medical specialist care necessary, if rehabilitation with a team-based approach necessary, or in cases of diagnostic doubts after the initial management within the primary healthcare system. All adults (
• Inclusion criteria: 1) Patients with severe fatigue affecting physical and/or mental functioning for a minimum of 6 months and who were admitted for investigation at Bragée Clinics.
• Exclusion criteria: 1) Any acute or chronic condition that would limit study participation, and 2) being unable to communicate in English or Swedish.
The required sample size was estimated to be a little less than 100 patients, based on recommendations by Shoukri et al. [21] with the parameters a required statistical power of 80%, a minimum accepted agreement of kappa 0.4 and an expected agreement of kappa 0.7, and with the prevalence of systemic joint laxity among patients attending the clinic estimated to be about 0.55, as for fibromyalgia [22]. However, the current study was part of a larger project with 275 participants, so the same group (
2.2Data collection
The first screening for hypermobility consisted of the BS, and the second screening of a semi-structured history, the 5PQ, and the BS. Here, a semi-structured history meant gathering information about musculoskeletal health (current and past), possible instability of the ankles and sometimes such matters as were brought to attention in an extended discussion with the patient around the 5PQ, such as their experiences of physical activity and exercise. No education or training for assessors took place prior to the data collection. Screening 1 was done by one of four specialist physicians (family medicine, anaesthesiology, neurology, psychiatry) and screening 2 by a specialist physiotherapist (sports medicine). Both the physicians and the physiotherapist had many years of clinical experience. The physiotherapist had no knowledge of the outcome of screening 1.
The electronic health records (Take Care) of all study participants were reviewed. For those who had had a screening, data were extracted from the responsible physician’s/physiotherapist’s documentation and were grouped in an Excel file, in the following main categories: quantitative outcome of first screening; quantitative outcome of second screening; and integrated assessment regarding systemic joint laxity according to assessor 2 (present/not present). Age and sex were also documented, as was the timespan between the first and second screening. In cases where notes in the patient’s file were lacking, so that interpretation was not possible, notes were filed as missing data. In cases where the assessor had registered a point interval instead of a valid score (e.g. 2–4), the mean was used (3 in the example).
Figure 1.
Test positions included in the Beighton score. © Susanne Staubli University Children’s Hospital Zurich, published with permission.
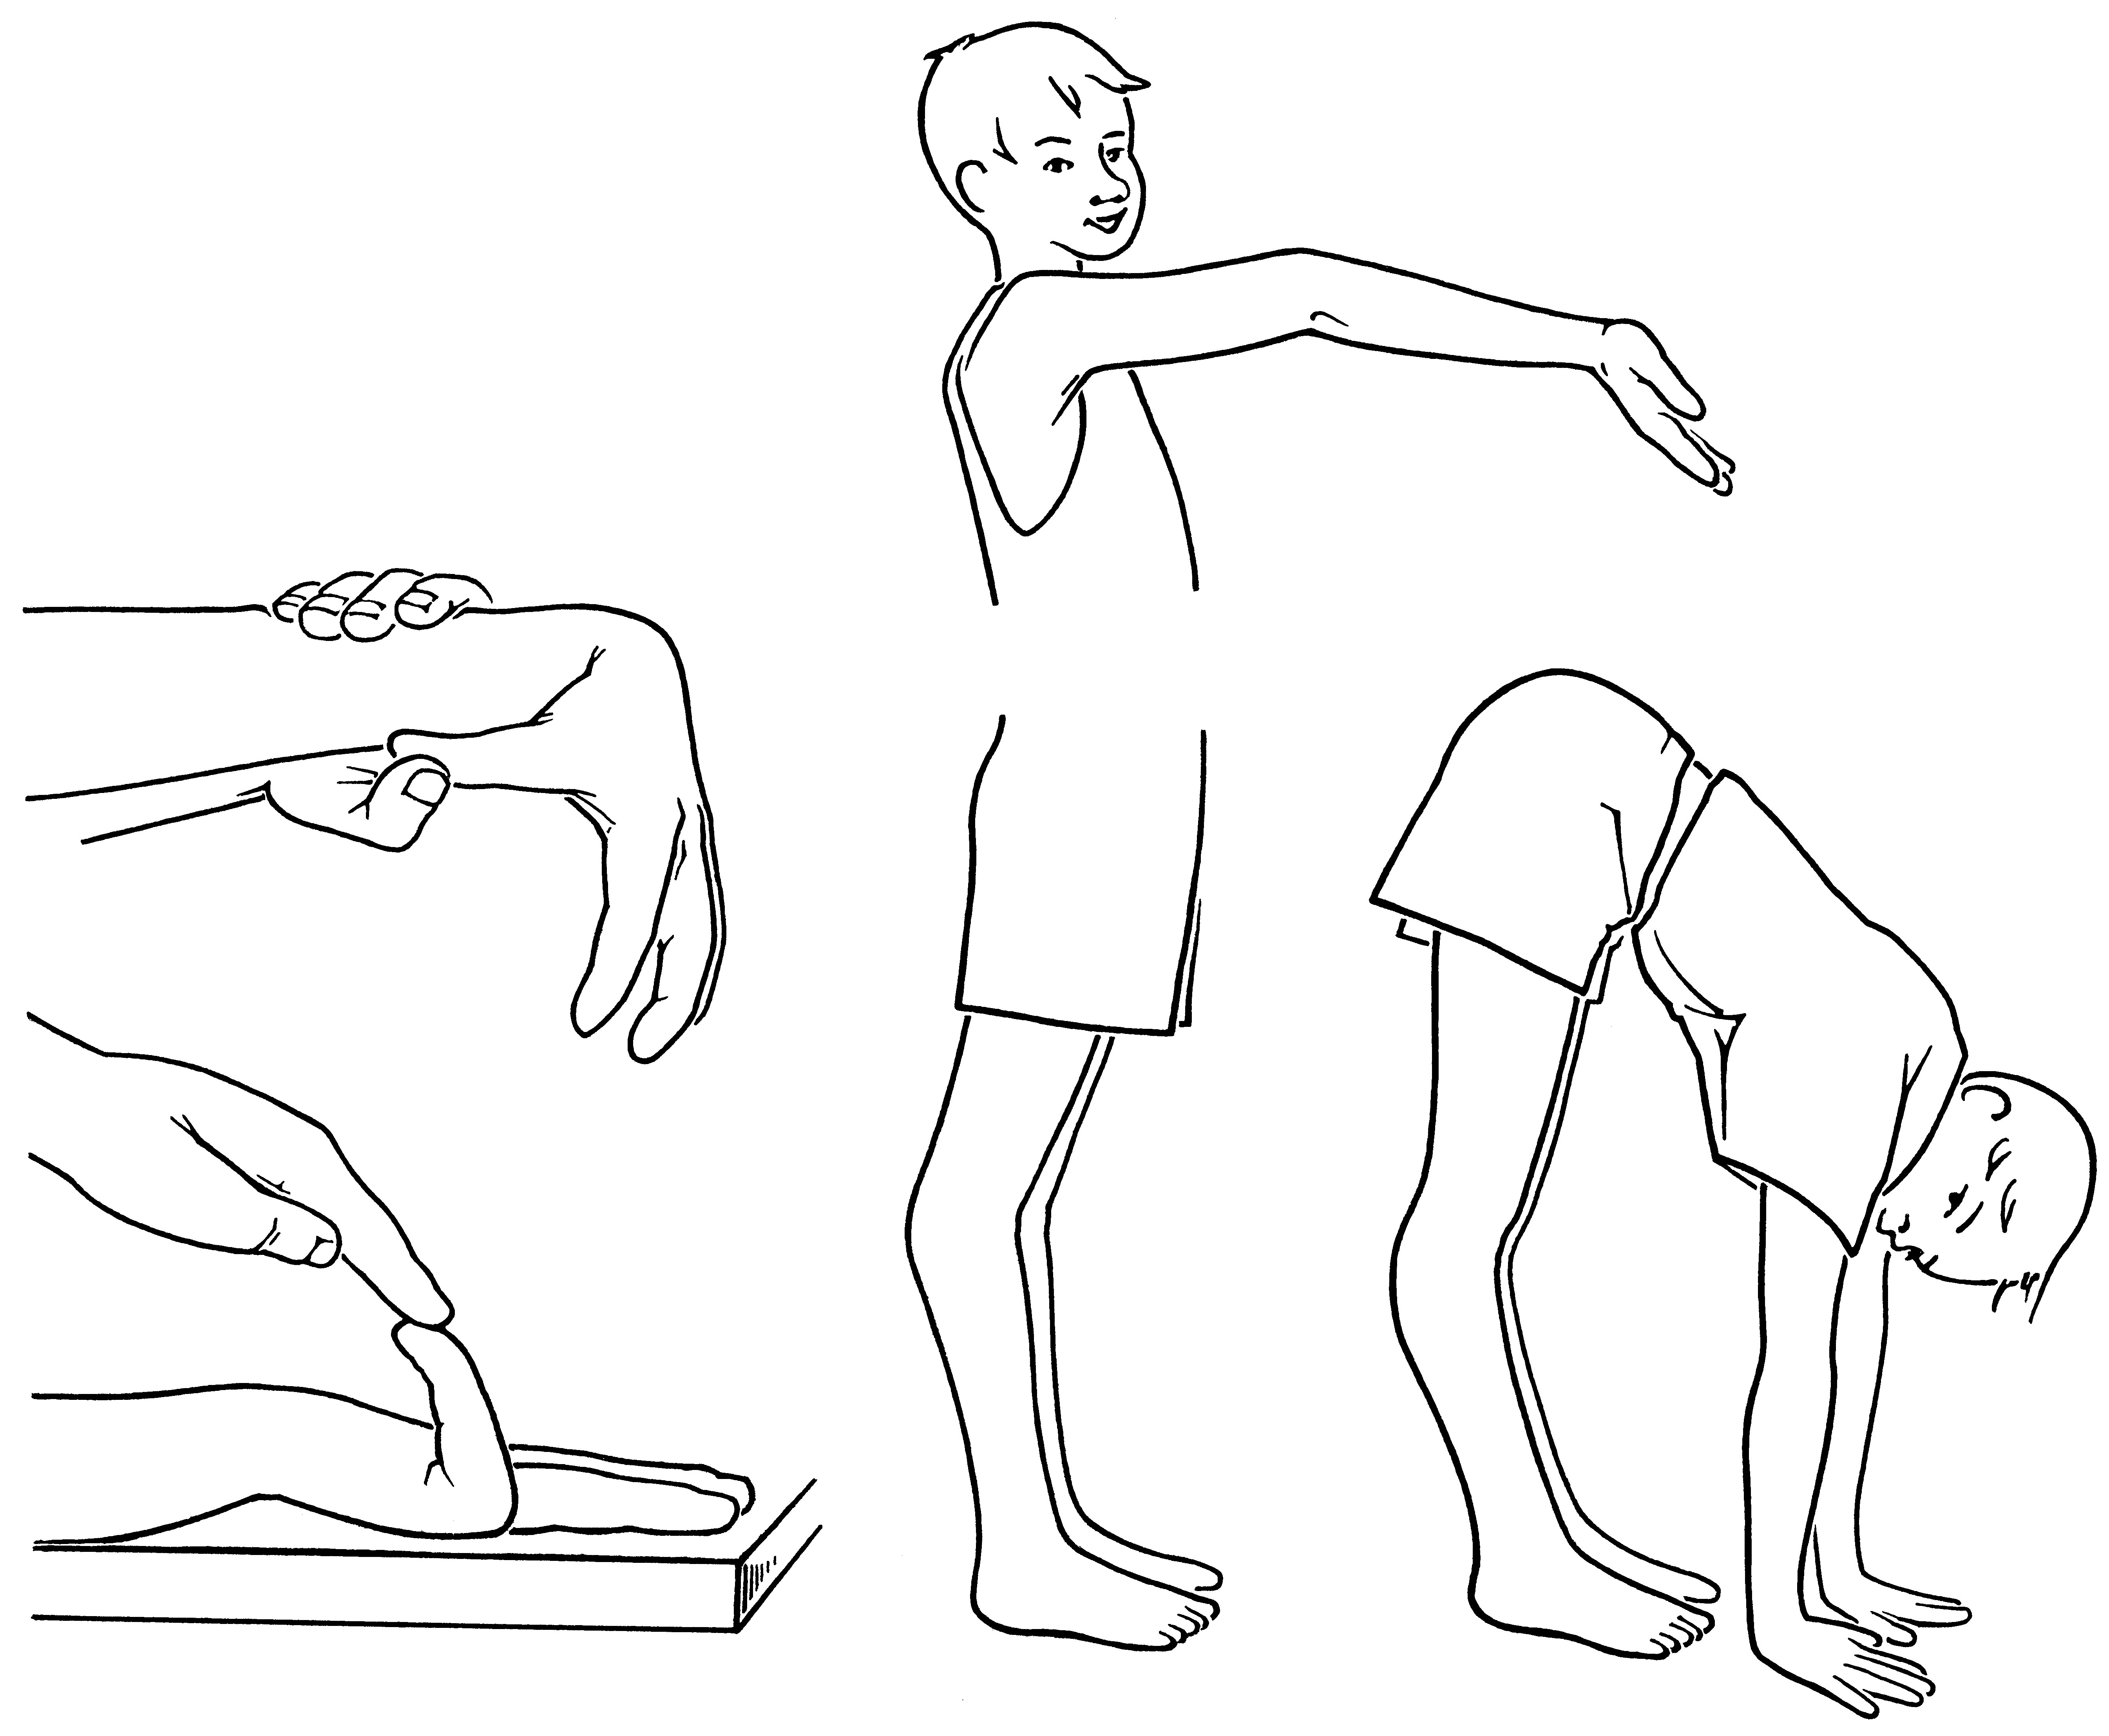
Table 2
Recommended qualitative judgements of correlation coefficients
| Correlation coefficient |
|
| ||||
|---|---|---|---|---|---|---|
| 1 | Almost perfect | Perfect | ||||
| 0.9 | Almost perfect | Very strong | ||||
| 0.8 | Strong | Very strong | ||||
| 0.7 | Moderate | Moderate | ||||
| 0.6 | Moderate | Moderate | ||||
| 0.5 | Weak | Fair | ||||
| 0.4 | Weak | Fair | ||||
| 0.3 | Minimal | Fair | ||||
| 0.2 | Minimal | Poor | ||||
| 0.1 | None | Poor | ||||
| 0 | None | None |
2.3Beighton score
The BS is a modified version of the Carter and Wilkinson assessment tool from 1964 [23]. It was made mainly for epidemiological studies where information was sought regarding hypermobility of groups of people [4]. It is easy to manage and therefore suitable for screening (Table 1, Fig. 1). The maximum total score is 9 points, indicating a physique with pronounced systemic joint laxity. A physique with a standard type of connective tissue has been defined with a BS of 0–2 points [19]. There is no complete consensus for optimal cut levels. Different levels have been recommended based on age, among other things [4]. For example, the recommended cut level according to The 2017 International classification of the Ehlers-Danlos syndromes [2] is:
However, it is also stated that if the BS is 1 point below the age- and sex-specific level and the 5PQ is positive, this indicates presence of systemic joint laxity [2].
2.4Five-part questionnaire (5PQ)
The 5PQ is a brief survey with five questions about hypermobility previously in life. Affirmative answers to two or more questions suggest systemic joint laxity [16].
1. Can you now (or could you ever) place your hands flat on the floor without bending your knees?
2. Can you now (or could you ever) bend your thumb to touch your forearm?
3. As a child, did you amuse your friends by contorting your body into strange shapes OR could you do the splits?
4. As a child or teenager, did your shoulder or kneecap dislocate on more than one occasion?
5. Do you consider yourself double-jointed?
2.5Data analysis
Data were analysed three times: first, for agreement between the assessors’ classifications of systemic joint laxity as being absent or present (Beighton score versus a routine clinical expert assessment); second, for agreement between assessors with BS as a dichotomous measure; and third, for agreement between assessors with BS as a category measure (no, some, clear systemic joint laxity).
2.5.1Beighton score’s criterion validity
The BS’s ability to classify SJL as absent or present (first screening) was evaluated in terms of cut levels applied in the clinic for this population, to catch true systemic joint laxity, and free a standard physique from diagnosis. Agreement was analysed between a dichotomous outcome (3-, 4- and 5-cut level) and our gold standard the routine expert assessment (described under Data collection). Cohen’s kappa, which corrects for the agreement that would be reached by chance, was used to reflect agreement between the first screening and the reference assessment [24]. The strength of the correlation was appreciated in accordance with Table 2 [25]. In addition, sensitivity and specificity were analysed to describe test performance.
2.5.2Beighton score’s interrater reliability
Cohen’s kappa was used for the analysis of measurement stability between the assessors (physician and physiotherapist) with a dichotomous mode of interpretation, while interpretation with categories was analysed with Spearman’s correlation coefficient. The interpretation placed an assessment into one of three ranked categories: No general joint laxity (0–2 p); Some general joint laxity (3–4 p); or Clear general joint laxity (5–9 p). Correlation coefficients were interpreted according to Chan [26] (Table 2).
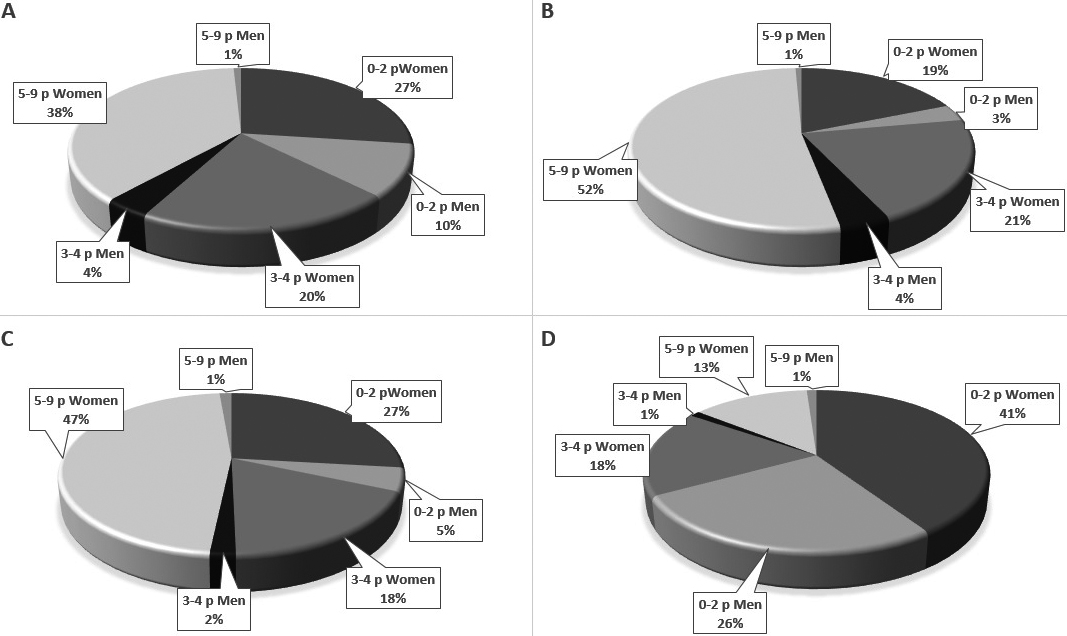
Figure 2.
Categorisation from Beighton score. A: 1
2.6Ethical aspects
The present study was performed in accordance with the Declaration of Helsinki [27] and all procedures with patients involved were granted approval by the Swedish Ethical Review Authority (2018/1754). Written informed consent was received from all of the study participants.
3.Results
3.1Study demographics
During the period of data collection, February 2019–February 2020, a total of 275 patients were included in the study. Of the 275 who agreed to participate, 240 patients had the first screening for possible hypermobility with a physician, of whom 37% were considered to have 0–2 points, 24% 3–4 points and 39% 5–9 points (Fig. 2A). Of those, 149 had a second screening by a physiotherapist. The latter group (
3.2Missing data
Data was missing from 126 study participants: for 35 participants, no first screening by a physician was made. For 91 participants, there was a first screening, but no 2
3.3Beighton score’s criterion validity
The agreement was minimal – weak between BS in the first screening and the integrated assessment of systemic joint laxity, whether 3-, 4- or 5-cut level was applied (Table 3). When a dichotomous interpretation with a 3-cut level was applied, i.e. the minimum score for some systemic joint laxity, the percentage agreement was 74% and kappa 0.39. When applying a 4-cut level, the percentage agreement was 73% and kappa 0.39. The results for a 5-cut level were 73 % and kappa 0.45.
Table 3
Overview of the data base for calculations of criterion validity in the Beighton-score regarding the condition systemic joint laxity
| Gold standard (an expert’s integrated assessment) | ||||||||||||||
| Positive | Negative | |||||||||||||
| A | 1 | 86 | 32 | |||||||||||
| screening | 79 | 27 | ||||||||||||
| Positive | 66 | 13 | ||||||||||||
| 1 | 7 | 24 | ||||||||||||
| screening | 14 | 29 | ||||||||||||
| Negative | 27 | 43 | ||||||||||||
|
|
|
|
| |||||||||||
|
|
| |||||||||||||
|
|
| |||||||||||||
| C | Sensitivity | 92/43% | ||||||||||||
| /specificity | 85/52% | |||||||||||||
| 71/77% | ||||||||||||||
A: Agreement with a 3-, 4- and 5-cut level (3-cut level the minimum of some systemic joint laxity, according to Boyle et al. 2003). B: Kappa coefficient (Cohen’s kappa) for agreement between the result from the 1
Sensitivity and specificity were examined in the BS alone (first screening) regarding its diagnostic accuracy in finding individuals with systemic joint laxity. The sensitivity was naturally the highest when a low cut level was applied,
3.4Beighton score’s interrater reliability
Interrater reliability was at best moderate (rho 0.66), when a three-category interpretation was used (Table 4). It was also moderate for the dichotomous interpretation with a 5-cut level (percentage agreement 81% and kappa 0.61), although weak with a 4-cut level (percentage agreement 74% and kappa 0.43) (Table 4).
4.Discussion
The present study investigating the BS’s relevance in the diagnostics of systemic joint laxity, as well as its replicability, demonstrated that the BS is unreliable in establishing systemic joint laxity, but is a stable measurement tool.
We found that a BS alone had effectively no ‘diagnostic ability’, with a minimal – weak kappa coefficient for comparison with the gold standard. As evidenced by Table 3, the data suggest that the BS alone is an insufficient instrument for identification of patients with systemic joint laxity. This strongly implies that individuals may have a physique with systemic joint laxity despite a low BS, and the opposite may also be true: someone who seems to have systemic joint laxity may have a standard physique in terms of connective tissue. Using the 3-cut level is preferred to optimise sensitivity (92%), but the assessment needs to be supplemented with accessory instruments. In clinical work, in case of doubt, it may be preferable to defer the ruling-out of suspected systemic joint laxity, since false negative assessment may risk grave consequences ensuing after inadequately stressful self-care or treatment. Cohen originally suggested a somewhat more generous interpretation of the low Kappa-outcomes: within medicine, however, a more restricted interpretation is called for, so that new clinical guidelines will be well founded [25].
Table 4
Basis for analysis of interrater reliability (n = 149), dichotomous interpretation (yes/no) whether systemic joint laxity was present with 4- and 5-cut level, and interpretation in categories of possible systemic joint laxity. No systemic joint laxity built on a Beighton-score of 0–2, some systemic joint laxity on 3–4 points, and clear on 5–9 points
| 2 | |||||||||||
| Yes | No | ||||||||||
| Yes | 78 | 28 | |||||||||
| 61 | 18 | ||||||||||
| No | 11 | 32 | |||||||||
| 11 | 59 | ||||||||||
|
|
|
| |||||||||
|
|
| ||||||||||
| 2 | |||||||||||
| No | Some | Clear | Total | ||||||||
| No | 24 | 5 | 2 | 31 | |||||||
| Some | 15 | 15 | 9 | 39 | |||||||
| Clear | 7 | 11 | 61 | 79 | |||||||
| 46 | 31 | 72 | 149 | ||||||||
| Spearman’s rho | |||||||||||
Previous studies of construct validity [15] examined agreement with pain or comorbidity, for instance, and found at best some support, but the findings were contradictory. It is possible that the relative weakness of the association between BS and systemic joint laxity found in the present study gave rise to the modest correlations in those studies as well. This study supports the notion that screening with the help of BS needs to be complemented with a targeted history-taking when the object is to assess systemic joint laxity [15]. Joint mobility often decreases with age and trauma, and therefore any past hypermobility should also be taken into consideration.
Interrater reliability between different professions was found to be acceptable, and best when an interpretation in categories was applied (moderate agreement). Boyle et al. engaged women aged 15–45 in the general population [19]. We approximated this to be clinically suitable for those over 50 years of age too, and included study participants
We found that the measurement stability between assessors increased when a categorised score was used (rho
Measurement stability was higher in the group with clear systemic joint laxity (
Limitations in the present study were, firstly, the number of missing data. Only complete pairs of data were put in the analysis, and incomplete cases (no second screening) were excluded. Therefore, the analysis group cannot be trusted to reflect the circumstances for the entire population. However, the analysis group was still rather large, allowing for satisfactory power in identifying a significant outcome, and still seemed to have a balanced distribution (percentage) of soft tissue phenotype between categories. Many in the missing data group had a low score, and there were also many persons with a low score in the analysis (Fig. 2C). Moreover, a greater proportion of individuals with clear systemic joint laxity were in the analysis group from which the results were built. This may have made the analysis group relatively easier to assess, as noted above, and could, in that way, have enhanced the strength of this study’s evidence regarding criterion validity. However, the consequences of the missing data are complex and difficult to evaluate fully. Another limitation is that the results have bearing mainly for women as men were sparsely represented.
A third limitation is that the time interval between the first and the second assessments was highly variable, ranging from only a few hours after the first screening to an interval of up to almost 6 months. The mean interval was about 50 days, and no actual difference in the patient situation was expected. The main potential factors altering joint mobility are older age (years) or trauma [2], and neither were relevant, as no trauma was reported by any patients between the examinations. The lesser factors with an influence on joint mobility, such as temperature, any prior warming-up or inertia-reducing activity, knowledge of the test or mental energy, may be expected to bring about their destabilizing variance regardless of the time interval between the assessments.
The strengths of the present study are that a relatively large study population gave statistical strength despite the missing data, and that the results appeared to have a very high external validity.
5.Conclusion
The Beighton score alone was not a reliable proxy for systemic joint laxity; to optimise its potential for patient management, it should be supplemented with a targeted history. Nevertheless, its interrater reliability was acceptable in a purely clinical context, and the categorised score (no, some or clear systemic joint laxity) appears to have greater clinical relevance than the dichotomous score.
Conflict of interest
None to report.
References
[1] | World Health Organization [homepage on the Internet]. Copenhagen: WHO; 2021 [updated 2021 February 8; cited 2021 Dcember 17]. Available from: www.who.int/. |
[2] | Castori M, Tinkle B, Levy H, Grahame R, Malfait F, Hakim A. A framework for the classification of joint hypermobility and related conditions. Am J Med Genet C Semin Med Genet. (2017) ; 175: (1): 148-157. doi: 10.1002/ajmg.c.31539. |
[3] | Hakim AJ, Cherkas LF, Grahame R, Spector TD, MacGregor AJ. The genetic epidemiology of joint hypermobility: a population study of female twins. (2004) ; 50: (8): 2640-4. doi: 10.1002/art.20376. |
[4] | Remvig L, Jensen DV, Ward RC. Are diagnostic criteria for general joint hypermobility and benign joint hypermobility syndrome based on reproducible and valid tests? A review of the literature. J Rheumatol. (2007) ; 34: (4): 798-803. |
[5] | Malfait F, Francomano C, Byers P, Belmont J, Berglund B, Black J, et al. The 2017 International classification of the Ehlers-Danlos syndromes. Am J Med Genet Part C Semin Med Genet. (2017) ; 175C: : 8-26. doi: 10.1002/ajmg.c.31552. |
[6] | Demmler JC, Atkinson MD, Reinhold EJ, Choy E, Lyons RA, Brophy ST. Diagnosed prevalence of Ehlers-Danlos syndrome and hypermobility spectrum disorder in Wales, UK: a national electronic cohort study and case-control comparison. BMJ Open. (2019) ; 9: (11): e031365. doi: 10.1136/bmjopen-2019-031365. |
[7] | Hakim A, De Wandele I, O’Callaghan C, Pocinki A, Rowe P. Chronic fatigue in Ehlers-Danlos syndrome-Hypermobile type. Am J Med Genet C Semin Med Genet. (2017) ; 175: (1): 175-180. doi: 10.1002/ajmg.c.31542. |
[8] | Cullinan J, Pheby DFH, Araja D, Berkis U, Brenna E, de Korwin J-D, et al. Perceptions of European ME/CFS experts concerning knowledge and understanding of ME/CFS among primary care physicians in Europe: a report from the European ME/CFS Research Network (EUROMENE). Medicina (Kaunas). (2021) ; 57: (3): 208. doi: 10.3390/medicina57030208. |
[9] | Phillips K, Clauw DJ. Central pain mechanisms in chronic pain states: maybe it is all in their head. Best Pract Res Clin Rheumatol. (2011) ; 25: (2). 141-154. |
[10] | Styrke J, Sojka P, Björnstig U, Stålnacke BM. Symptoms, disabilities, and life satisfaction five years after whiplash injuries. Scand J Pain. (2014) ; 5: (4): 229-236. |
[11] | Yunus MB. Central sensitivity syndromes: a unified concept for fibromyalgia and other similar maladies. J Indian Rheum Assoc. (2000) ; 8: (1): 27-33. |
[12] | Wormgoor MEA, Rodenburg SC. The evidence base for physiotherapy in myalgic encephalomyelitis/chronic fatigue syndrome when considering post-exertional malaise: a systematic review and narrative synthesis. J Transl Med. (2021) ; 19: (1): 1. doi: 10.1186/s12967-020-02683-4. |
[13] | Bénistan K, Martinez V. Pain in hypermobile Ehlers-Danlos syndrome: new insights using new criteria. Am J Med Genet A. (2019) ; 179: (7): 1226-1234. doi: 10.1002/ajmg.a.61175. |
[14] | Malek S, Reinhold EJ, Pearce GS. The Beighton Score as a measure of generalized joint hypermobility. Rheumatol Int. (2021) Oct; 41: (10): 1707-1716. doi: 10.1007/s00296-021-04832-4.. Epub 2021 Mar 18. |
[15] | Juul-Kristensen B, Schmedling K, Rombaut L, Lund H, Engelbert RHH. Measurement properties of clinical assessment methods for classifying generalized joint hypermobility: a systematic review. Am J Med Genet C Semin Med Genet. (2017) ; 175: (1): 116-147. doi: 10.1002/ajmg.c.31540. |
[16] | Hakim AJ, Grahame R. A simple questionnaire to detect hypermobility: an adjunct to the assessment of patients with diffuse musculoskeletal pain. Int J Clin Pract. (2003) ; 57: (3): 163-166. |
[17] | Bockhorn LN, Vera AM, Dong D, Delgado DA, Varner KE, Harris JD. Interrater and intrarater reliability of the beighton score: a systematic review. Orthop J Sports Med. (2021) ; 9: (1): 2325967120968099. doi: 10.1177/2325967120968099. |
[18] | Wood PH. Is hypermobility a discrete entity? Proc R Soc Med. (1971) ; 64: (6): 690-692. |
[19] | Boyle KL, Witt P, Riegger-Krugh C. Intrarater and Interrater Reliability of the Beighton and Horan Joint Mobility Index. J Athl Train. (2003) ; 38: (4): 281-285. |
[20] | von Elm E, Altman DG, Egger M, Pocock SJ, Gøtzsche PC, Vandenbroucke JP, STROBE Initiative. The Strengthening the Reporting of Observational Studies in Epidemiology (STROBE) statement: guidelines for reporting observational studies. PLoS Med. (2007) ; 4: (10): e296. doi: 10.1371/journal.pmed.0040296. |
[21] | Shoukri MM, Asyali MH, Donner A. Sample size requirements for the design of reliability study: review and new results. Stat Methods Med Res. (2004) ; 13: : 1-21. |
[22] | Ofluoglu D, Gunduz OH, Kul-Panza E, Guven Z. Hypermobility in women with fibromyalgia syndrome. Clin Rheumatol. (2006) ; 25: (3): 291-293. doi: 10.1007/s10067-005-0040-1. |
[23] | Beighton P, Solomon L, Soskolne CL. Articular mobility in an African population. Ann Rheum Dis. (1973) ; 32: (5): 413-418. doi: 10.1136/ard.32.5.413. |
[24] | Cohen J. A coefficient of agreement for nominal scales. Educ Psychol Meas. (1960) ; 20: (1): 37-46. |
[25] | McHugh ML. Interrater reliability: the kappa statistic. Biochem Med (Zagreb). (2012) ; 22: (3): 276-282. |
[26] | Chan YH. Biostatistics 104: correlational analysis. Singap Med J. (2003) ; 44: (12): 614-619. |
[27] | World Medical Association. World Medical Association Declaration of Helsinki: ethical principles for medical research involving human subjects. JAMA. (2013) ; 310: (20): 2191-4. doi: 10.1001/jama.2013.281053. |
[28] | Schlager A, Ahlqvist K, Rasmussen-Barr E, Krefting Bjelland E, Pingel R, Olsson C, et al. Inter- and intra-rater reliability for measurement of range of motion in joints included in three hypermobility assessment methods. BMC Musculoskelet Disord. (2018) ; 19: (1): 376. doi: 10.1186/s12891-018-2290-5. |


