
Radar placement for fall detection: Signature and performance
Abstract
Two popular mounting positions of Doppler radar for human fall detection are in the ceiling center and at the torso level. This paper examines the fall signatures observed by a Doppler radar at the two positions and evaluates their consistencies with respect to the fall directions and locations. The complementary characteristics of the fall signatures motivate the integration of the features from the ceiling mounted and torso level radars to improve the fall detection performance. Experimental results using the data collected of an elderly at a senior residence apartment for almost a year support our studies and the benefit of using both radars. The false alarm rate is reduced by a factor of 10 at 100% detection rate when compared to using a ceiling radar alone.
1.Introduction
The use of Doppler radar for human fall detection has attracted considerable interests [2,5,8,13,16] in recent years. A Doppler radar is able to characterize through the Doppler effect the motion dynamics of a human fall, which can be explored for its detection. The distinguished radar signature of a human fall can facilitate a promising technology for human fall detection.
The Doppler radar sensor addresses the privacy concerns compared to the other fall detection sensors including cameras and acoustics. On the other hand, non-fall motions appear regularly in a daily living environment, causing active radar returns all the time. Separating falls from normal activities is perhaps the dominant factor for the effectiveness of fall detection using Doppler radar.
Due to the time-varying nature of the dynamics of a fall, time-frequency analysis has found some success to process the radar signal and extract the features for fall detection. The early work [12] used the short time Fourier transform (STFT) to preprocess the data and applied the Mel-Frequency Cepstral Coefficient (MFCC) features to distinguish between fall and non-fall activities. Reference [1] investigated the performance improvement by using the extended modified B-distribution (EMBD) in high-resolution time-frequency distributions kernels (TFDs). Reference [8] took a hybrid approach of utilizing compressive sensing as well as multi-window analysis based on the Slepian or Hermite function to extract the human activity features for fall detection.
A human fall has a fast motion of short duration at the beginning and a slow motion of long duration when hitting the ground. Such dynamics make wavelet transform ideal for the time-frequency analysis [10,18]. In particular, [19] uses the discrete stationary wavelet transform (SWT) and [4] applies the continuous wavelet transform for fall detection. Encouraging results were reported in laboratory setting environments and senior residence apartments.
In addition to the Doppler radar, other variations of radar have also been examined for fall detection [2,7,16,20].
The response of a Doppler radar is proportional to the velocity component along the human-radar direction. Placing the radar at a different position can affect the fall signature and the detection results. The study in [11] mounted the radar in the attic or the ceiling. On the other hand, many other investigations [4,5] position the radar in the torso level. Some initial studies [11,15] indicate that placing the radar in the ceiling yields better results than at the torso level. Reference [15] reaches the conclusion by illustrating the strengths of the Doppler radar returns of the two radar without providing the detection vs false alarm results. The evaluations in [11] were based on the ROC curve comparisons using the MFCC features. The MFCC features are attractive for acoustic sensors but performance is inferior to the wavelet features [19]. In addition, the comparisons were experimentally based and little reason was provided for the observations. The goal of this paper is to revisit the effect of radar location on human fall detection performance, using the better wavelet features and providing the rationale behind the findings.
In contrast to the previous studies, we analyze the behaviors of the radar signatures of the same fall observed by a ceiling mounted and a torso level radar. The effects of fall directions as well as fall locations are examined, using the iVAT [6] image assessment tool. The study indicates that fall signatures from the ceiling mounted radar are more consistent than the other. Furthermore, the two radars have complementary characteristics in the fall signatures, which leads to the use of the features from both together to improve fall detection. The newly proposed fall detection method has shown promising performance, using the data of human falls collected from the residence of a senior over 11 months.
We shall provide in the next Section a quick overview of the radar system and the wavelet transform algorithm for fall detection. Section 3 presents the processing of radar signal for fall detection. Section 4 elaborates on the datasets used in this study. Section 5 analyzes the consistencies of fall signatures from the ceiling and torso radars and examines their complementary behaviors. Section 6 presents the experimental results and Section 7 draws the conclusion.
2.System description
The Doppler radar used in this study is a commercially available product GE Doppler Range Control Radar (RCR50)11 with a price of approximately fifty US dollars. The dimension of the radar is
The experimental system has two identical radars, one is mounted in the center of the ceiling facing down and the other is attached on a wall at about 1 meter above the ground facing front. We shall refer them as the ceiling and torso radars for simplicity. The outputs of the two radars are digitized at the same rate of 960 Hz for processing.
Fig. 1.
The Doppler radar human fall detection system.
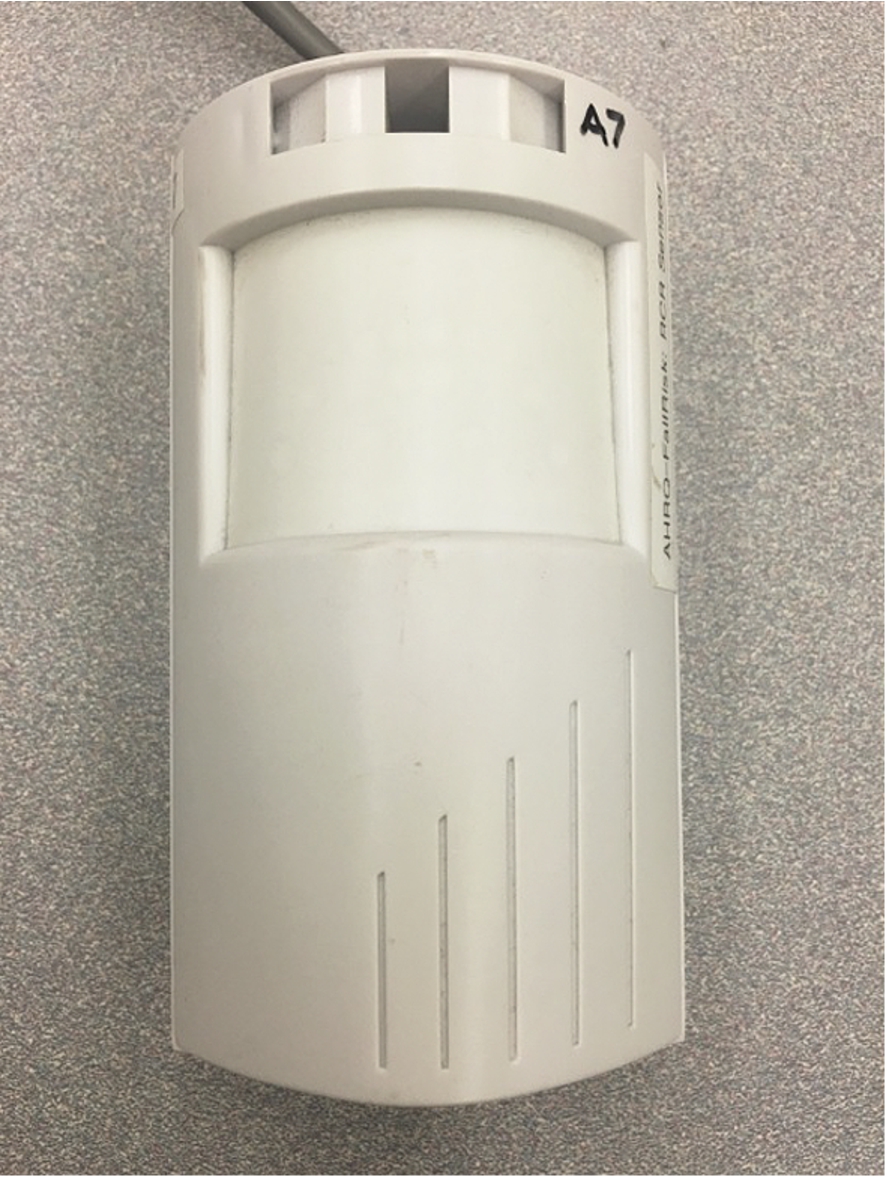
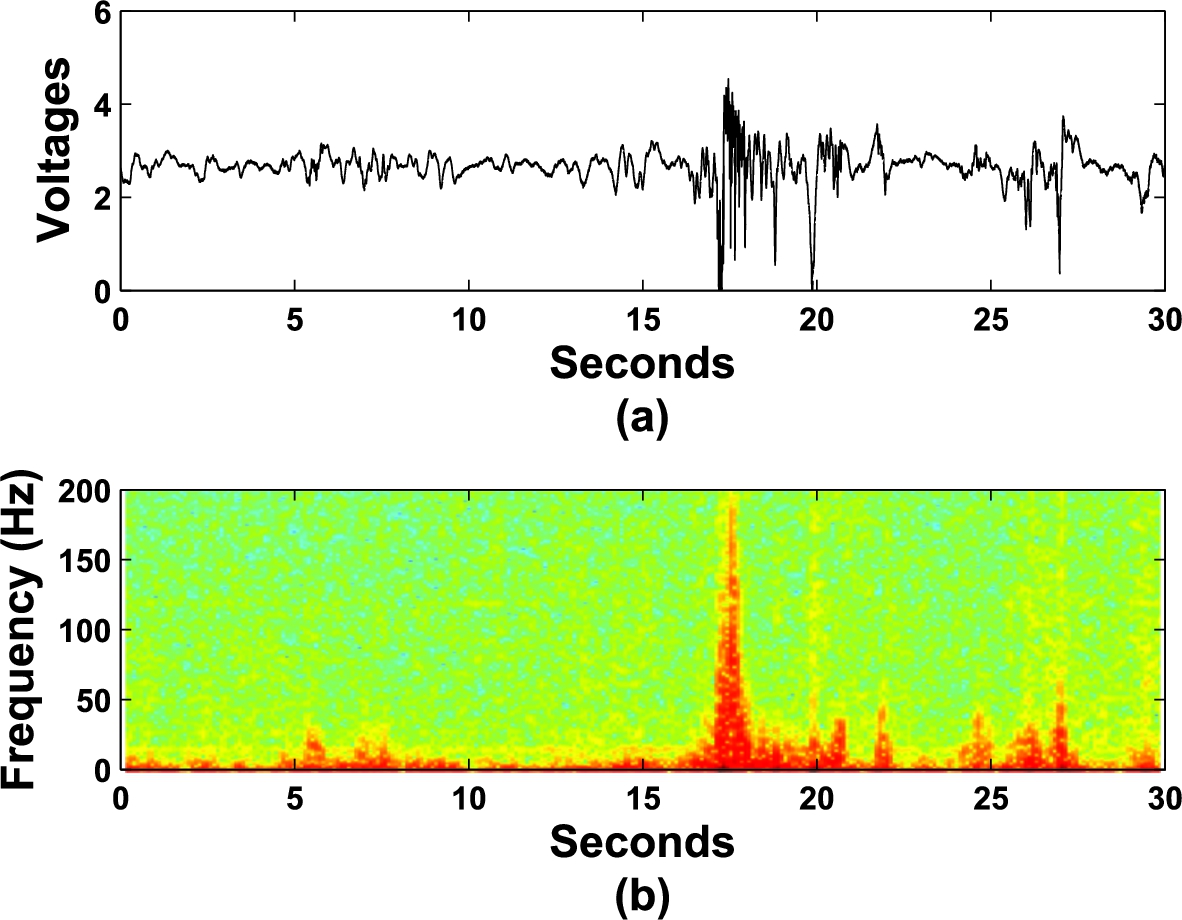
Figure 2(a) gives an example of the ceiling radar output during a human fall at about 17.5 sec. Figure 2(b) shows the corresponding spectrogram.
Fig. 2.
(a) The radar output of a human fall occurred at 17.5 seconds, (b) the spectrogram of (a).
3.Data processing
We shall summarize the data processing for completeness, more details can be found in [19].
Fig. 3.
The flow chart of Doppler radar human fall detection with wavelet transform.
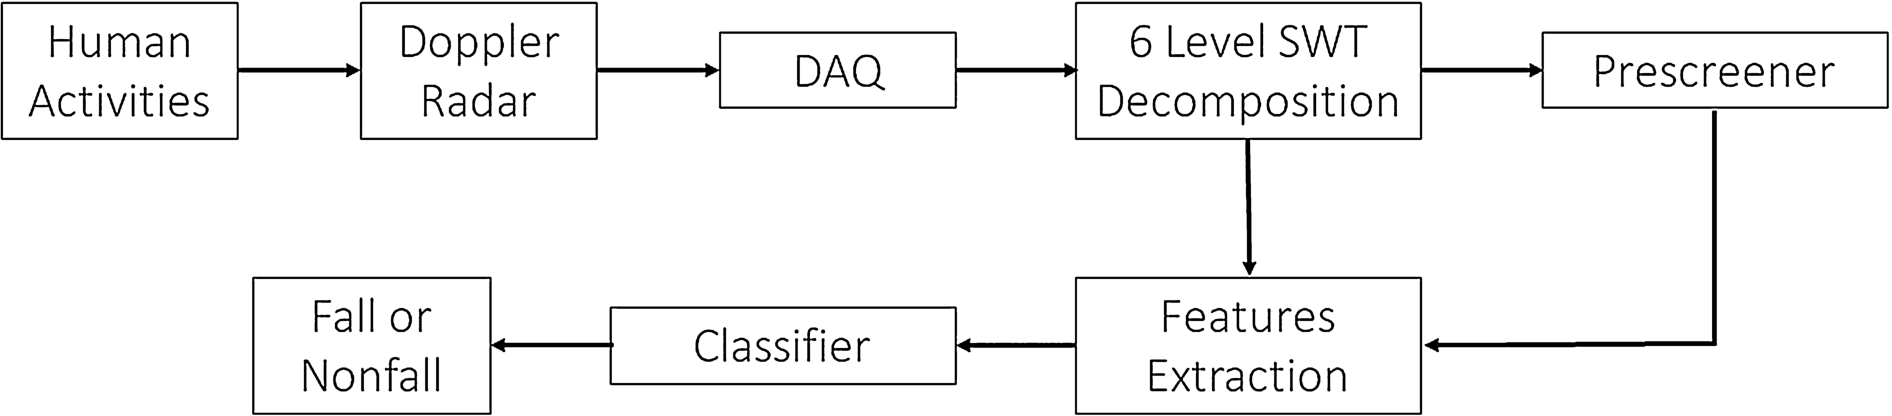
The data processing block diagram is shown in Fig. 3. The human motion observed by a Doppler radar produces time-varying signal characteristics. Instead of using the traditional Fourier transform, we shall apply the Stationary Wavelet Transform (SWT) [17] at dyadic scales [3] to analyze the radar signal for human fall detection. Different from the Discrete Wavelet Transform (DWT), SWT is shift invariant but redundant, where at each scale it has the same number of samples as in the original. Figure 4 gives an example of SWT decomposition of a segment of a Doppler radar signal, in which the radar is mounted in the ceiling and the wavelet function is “rbio3.3” [3]. It contains a human fall which occurred at 12.5 seconds. There are other human activities before 7 seconds and after 18 seconds. The SWT coefficients at the first six dyadic scales are shown, where
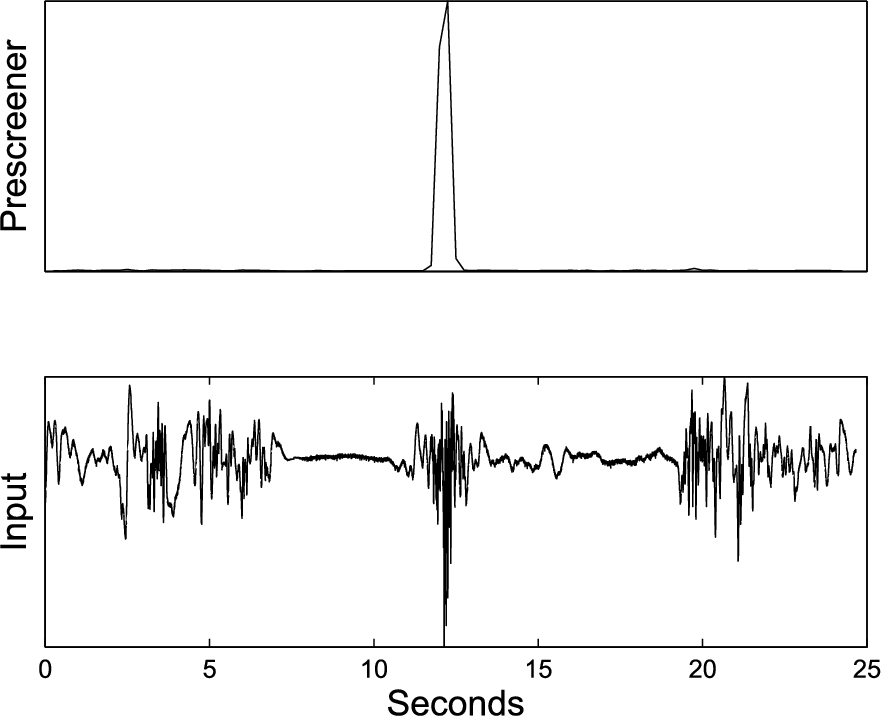
The human fall detection strategy has two phases – prescreening and classification. The prescreening phase processes the SWT coefficients at scale 4 to determine if a possible fall activity has occurred. It generates a detection value at every 0.25 second from the energy of the scale-4 SWT coefficients obtained over a moving window of 0.5 second. To be specific, the prescreener detection value is
Figure 5 illustrates the prescreener detection values of the input signal shown, where the fall is in the middle. It is clear the prescreener detection profile identifies clearly the fall and rejects the nonfall activities. Whenever the precreener detection profile exceeds a pre-determined threshold, the corresponding SWT coefficients over several dyadic scales around that time instance will be used for feature extraction and classification.
Fig. 4.
The SWT at 6 dyadic scales of a attic mounted Doppler radar signal. The human fall is occurred at 12.5 seconds. Other human activities are shown before 7 seconds and after 18 seconds.
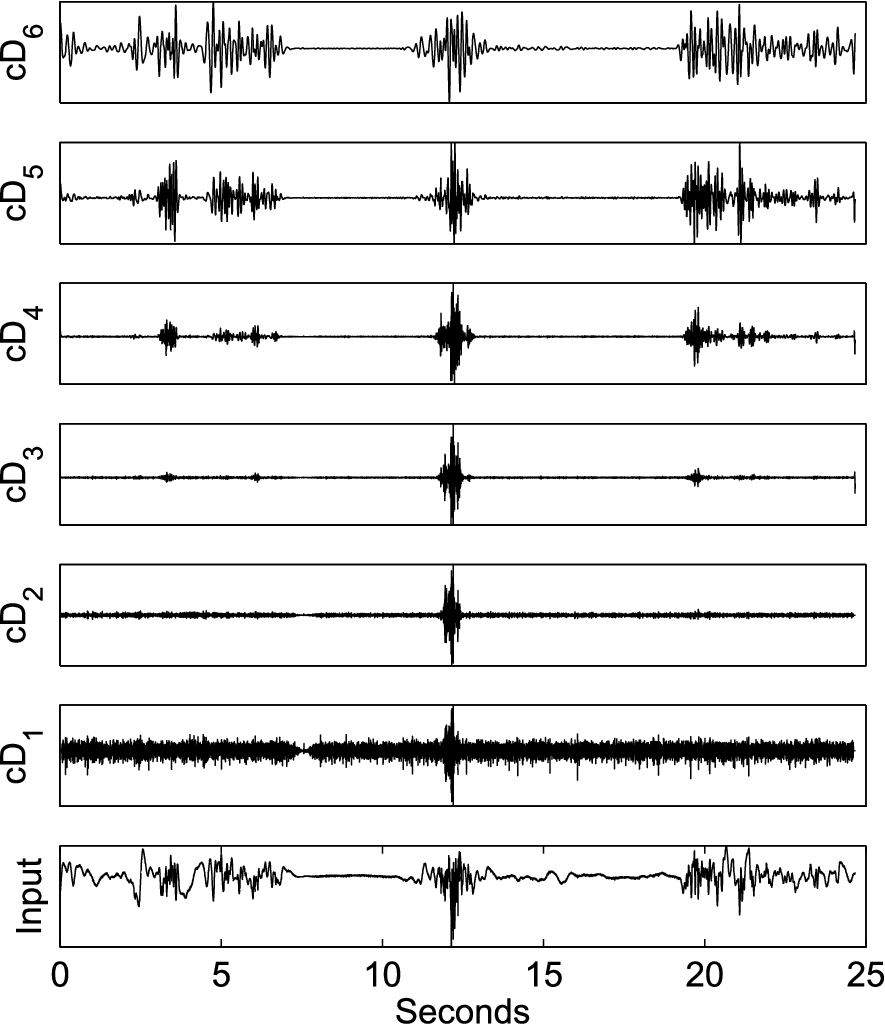
Fig. 5.
An illustration of the prescreener detection profile from SWT at scale-4.
In the classification phase, the features for fall detection are essentially the short-term SWT energies over 0.5 second from the 6 levels of dyadic scale SWT decomposition. Using k as the frame index with a step of 0.25 second and j the dyadic scale index, the feature values are:
Fig. 6.
The short-term SWT energies of a attic mounted Doppler radar signal.
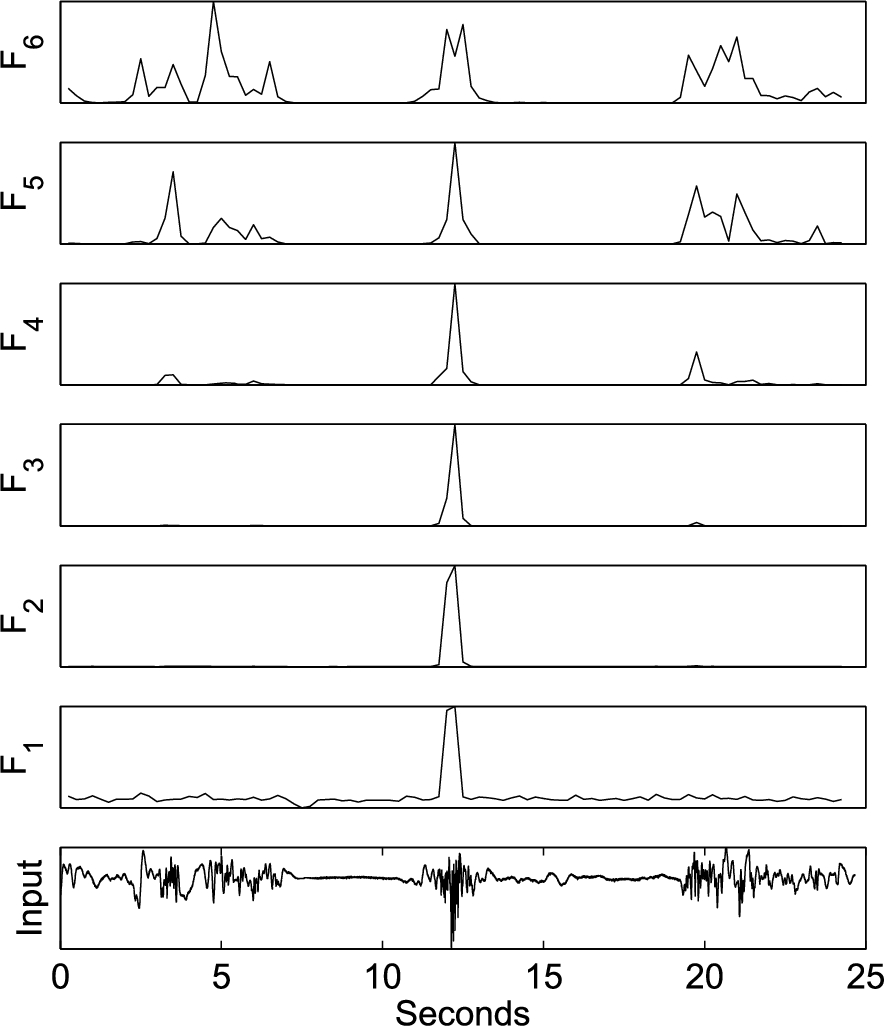
A human fall occupies a certain time duration. We therefore collect the short-term energies in a time segment of 1 second before and 1.5 seconds after the detection time location p identified by the prescreener to form the feature set. There is a 50% overlap when obtaining the short-term energies, yielding 9 values for each of the 6 dyadic scales. The 9 values are normalized to unity sum:
The whole set of features for classification is
The classifier is the k-Nearest Neighbor with k equal to 1 (NN). Given a test sample, the confidence for fall is simply the difference of the distance to closest member in the nonfall training sample cluster and the distance to that of the fall training sample cluster, where the distance is computed by the first norm. Although simple, NN classifier appears to perform better than other classifiers such as support vector machine in the experiments we performed.
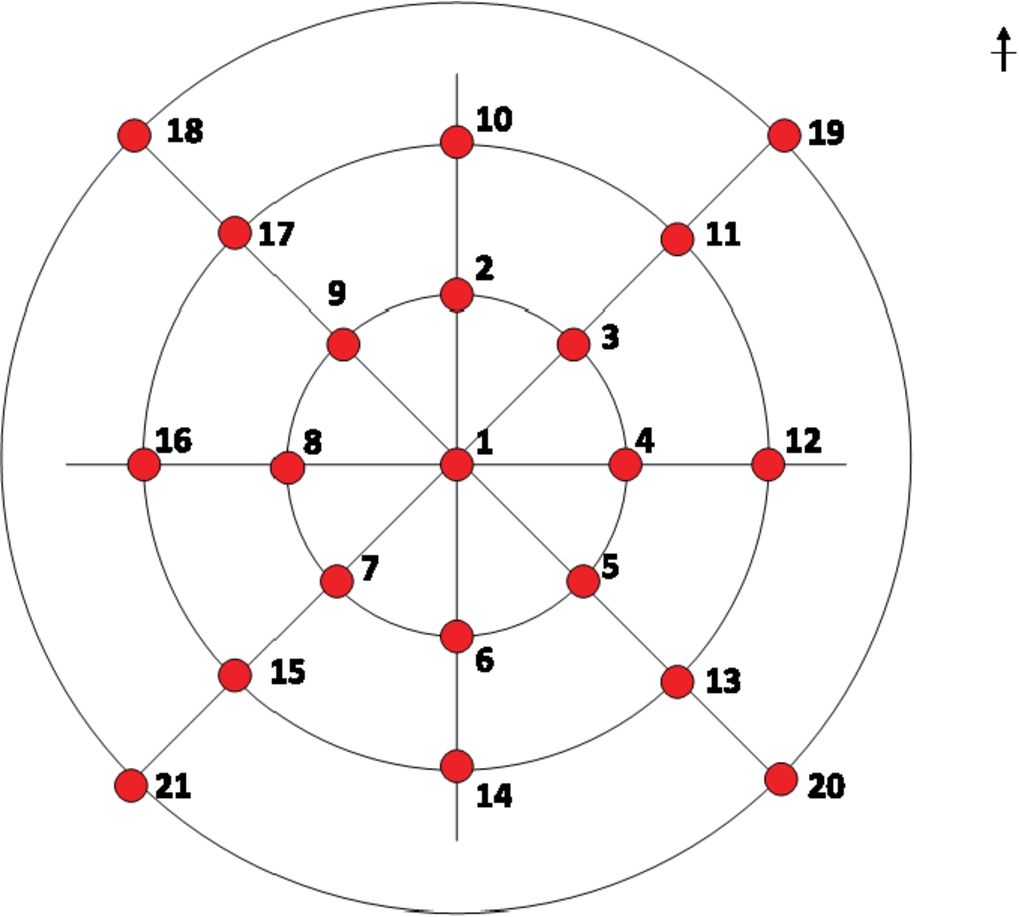
Fig. 7.
The 21 fall positions in dataset D0.
4.Data description
The study in this work uses two datasets. The first dataset D0 was collected in a laboratory that simulates a home environment. The second dataset D1 was acquired in a senior residence apartment at TigerPlace22 from 2014 to 2015 (336 days) containing actual falls from an elderly resident. The data collections have been approved by the Institutional Review Board (IRB) at the University of Missouri with number 63573.
For D0, the dimension of the simulated living room was 9 m × 8.2 m × 3 m (L × W × H). The ceiling radar is pointing down. The torso radar is attached in the north part of the wall at a height of 1.27 m facing horizontally towards the room center. The dataset contains 3 directions of falls at different positions of the room as shown in Fig. 7 for each radar. The three directions are north, west and east. Each position is along the circumference of a circle centered at the room. There are three circles and their radii are 1 m, 2 m and 3 m. The total number of fall positions is 21. Two subjects perform the falls and their statistics are summarized in Table 1. Each subject falls once in each direction and at each position. The total number of falls is 126 for each radar. The data is collected over 63 minutes. The non-falls in this dataset come from activities during the data collection such as warming up, active movements right before or after falls, moving the fall protection pad and standing up after each fall. All of these activities contribute to the non-fall events.
The dataset D1 is obtained from the daily living activities of an elderly resident. The ceiling radar was placed above the middle of the living room (4.4 m × 6.4 m × 2.7 m) in the attic and the torso radar is placed at the corner of the room 1 m above the ground. Figure 8 shows the layout of the apartment and the positions of the ceiling and torso radars which are denoted by CR and TR. The ceiling radar is facing down and the arrow indicates the viewing direction of the torso radar. Dataset D1 contains 336 days of data acquired in a continuous fashion. It contains 11 actual falls, randomly distributed in the living room, from the senior resident. The normal daily activities create non-fall events for the radar. The subject has a cat that weighs about 3.8 Kg, which can cause significant amounts of non-fall activities to the radars from various jumping motions. The statistics of the in-home subject are summarized in Table 2.
5.Radar signatures and consistencies
5.1.Wavelet function selection
Computing SWT requires a wavelet function. For a radar mounted in the attic, previous studies have found that using the decomposition wavelet function “rbio3.3” [3] gives the best fall detection performance, for both prescreening and classification. Here we present the study of wavelet function selection when the radar is mounted in the torso level.
Table 1
Subject information of D0
| Subject | Gender | Height (cm) | Weight (kg) |
| Subject A | male | 183 | 83 |
| Subject B | male | 171 | 61 |
Fig. 8.
The layout of the apartment and the positions of the two radars.
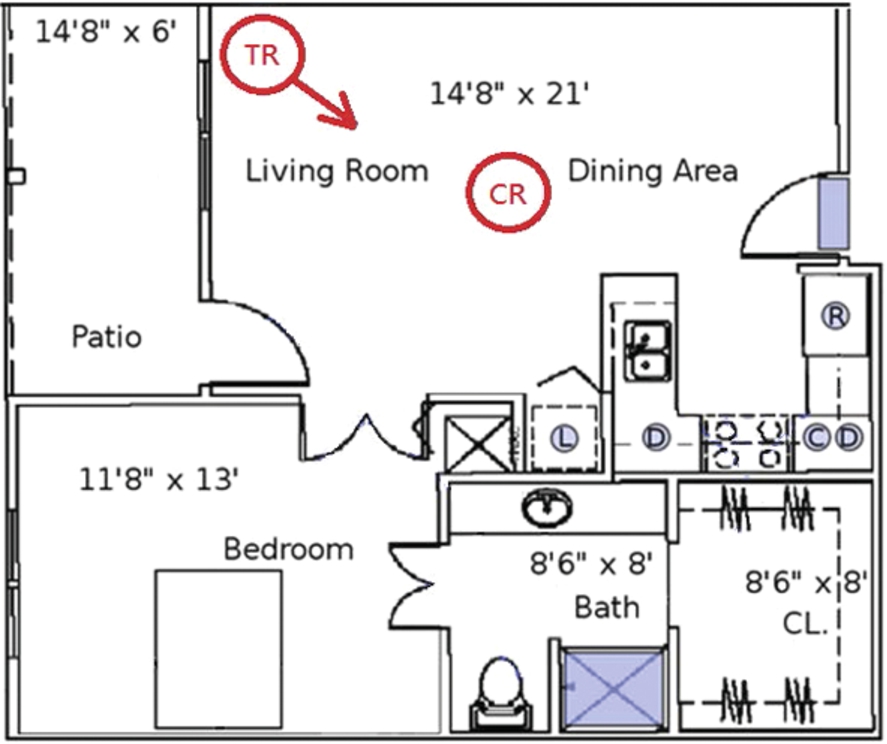
Table 2
Subject information of D1
| Subject | Gender | Age | Height (cm) | Weight (kg) |
| S1 | female | 76 | 160 | 63.5 |
We shall use the receiver operating characteristic (ROC) [21] curves to examine the fall detection performance. A total of 111 commonly used wavelet functions has been tested [3,14]:
– Daubechies (db) 1–45
– Bi-orthogonal (bior) and reverse Bi-orthogonal (rbio) series. (1.1, 1.3, 1.5, 2.2, 2.4, 2.6, 2.8, 3.1, 3.3, 3.5, 3.7, 3.9, 4.4, 5.5, 6.8)
– Coiflets (coif) 1–5
– Discrete approximation of Meyer wavelet (dmey)
– Symlets (sym) 1–30
The cross symbol in Fig. 9 shows the prescreener stage results of wavelet function selection for a torso radar by using dataset D0. For each wavelet function tested, we recorded the best result over the six dyadic scales. The areas under the ROC curves are normalized with the largest value and sorted in descending order. The best five mother wavelet functions for prescreening are “rbio3.3”, “rbio3.5”, “coif1”, “db2”, and “sym2”.
Fig. 9.
The relative detection performance from different wavelet functions for the torso radar.
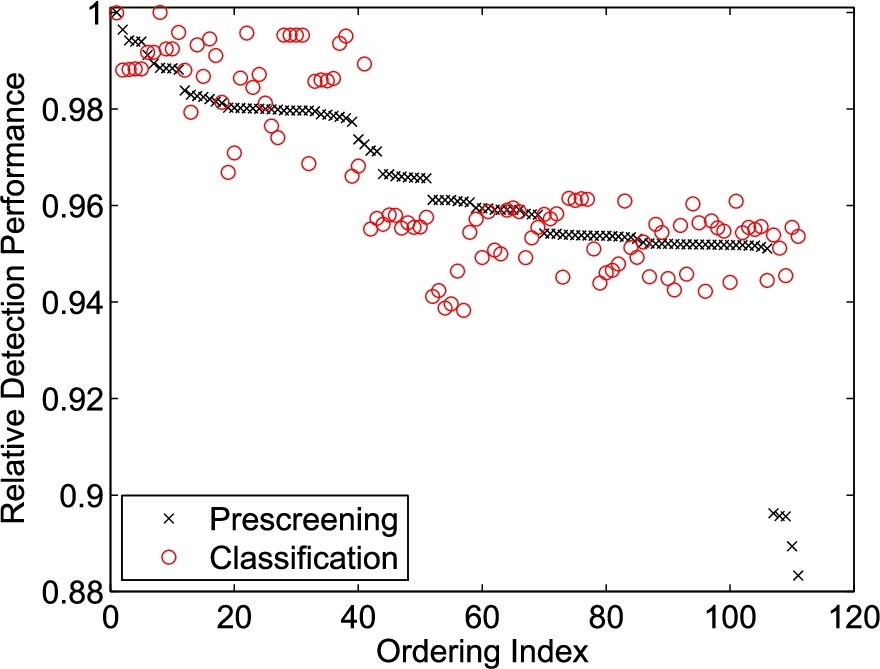
Fig. 10.
The prescreening ROCs of D0 using the wavelet coefficients from rbio3.3 at different scales for the torso radar.
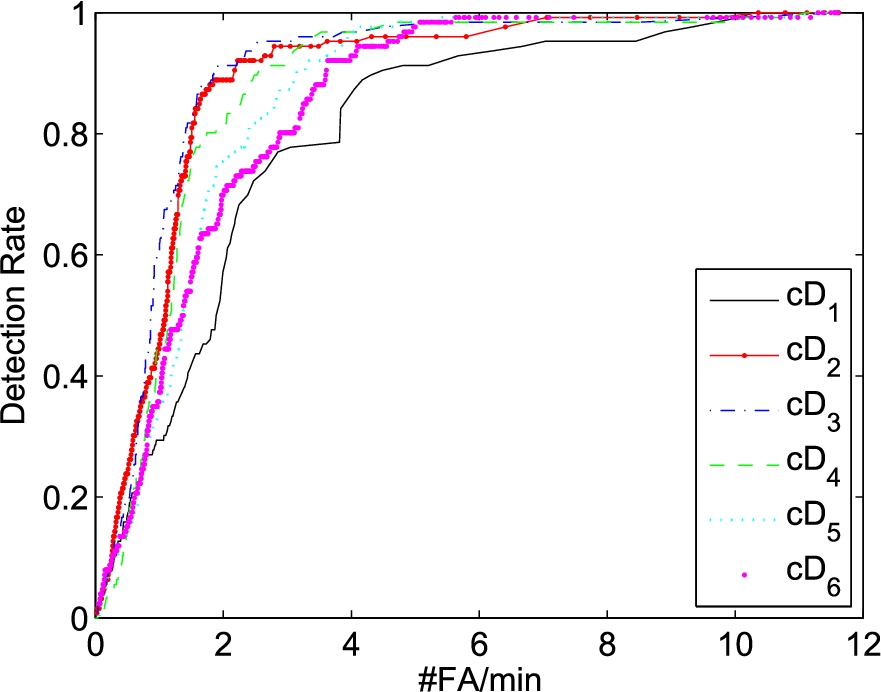
Figure 10 shows the prescreening results from the six different levels SWT decomposition. Scales 4 and 8 give comparable results, and this observation is consistent with the ceiling radar.
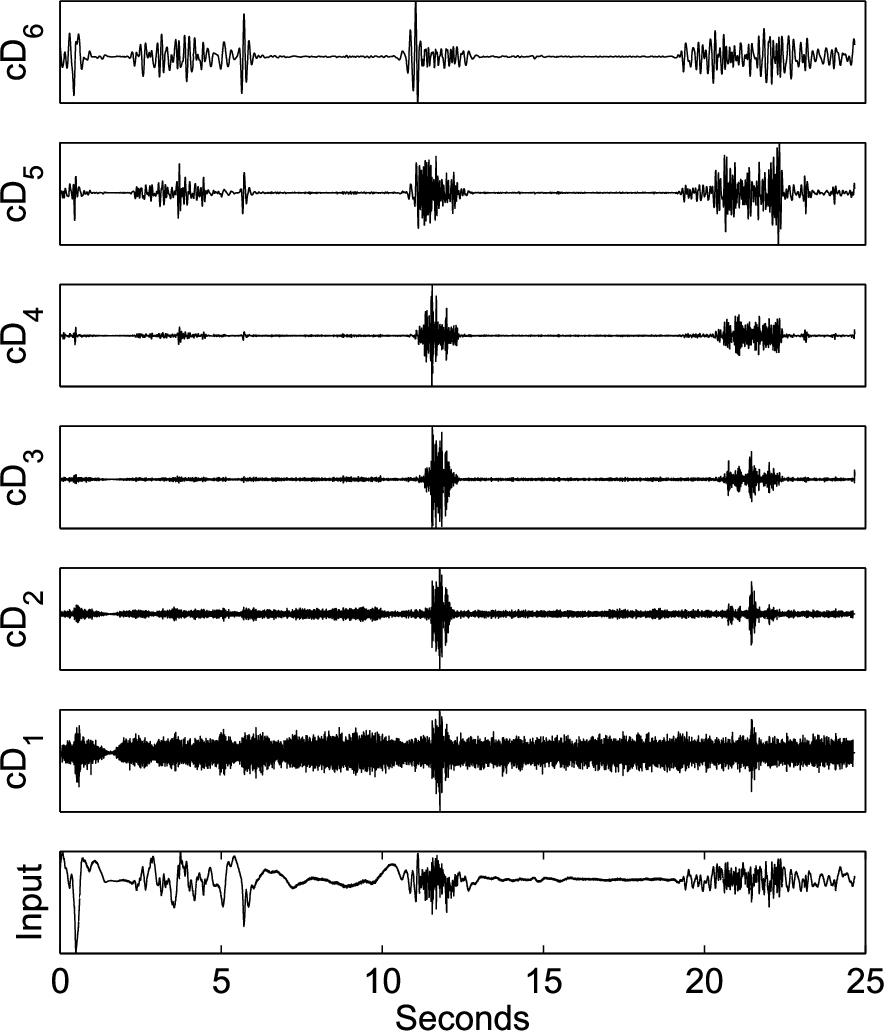
Fig. 11.
The SWT decomposition of a Doppler radar signal from the torso radar. The human fall occurred at 12.5 seconds. Other human activities are shown before 7 seconds and after 18 seconds.
We then examine the performance of different wavelet functions for classification. The results are shown in Fig. 9 with red circles, where the ordering index is the same as the prescreener. The best five wavelet functions are “rbio3.3”, “rbio4.4”, “rbio1.3”, “rbio1.5”, and “db1”. The “rbio3.3” and “rbio4.4” have similar performance in the classification stage. Based on Figs 9 and 10, we choose the “rbio3.3” as the wavelet function to process the torso radar signal.
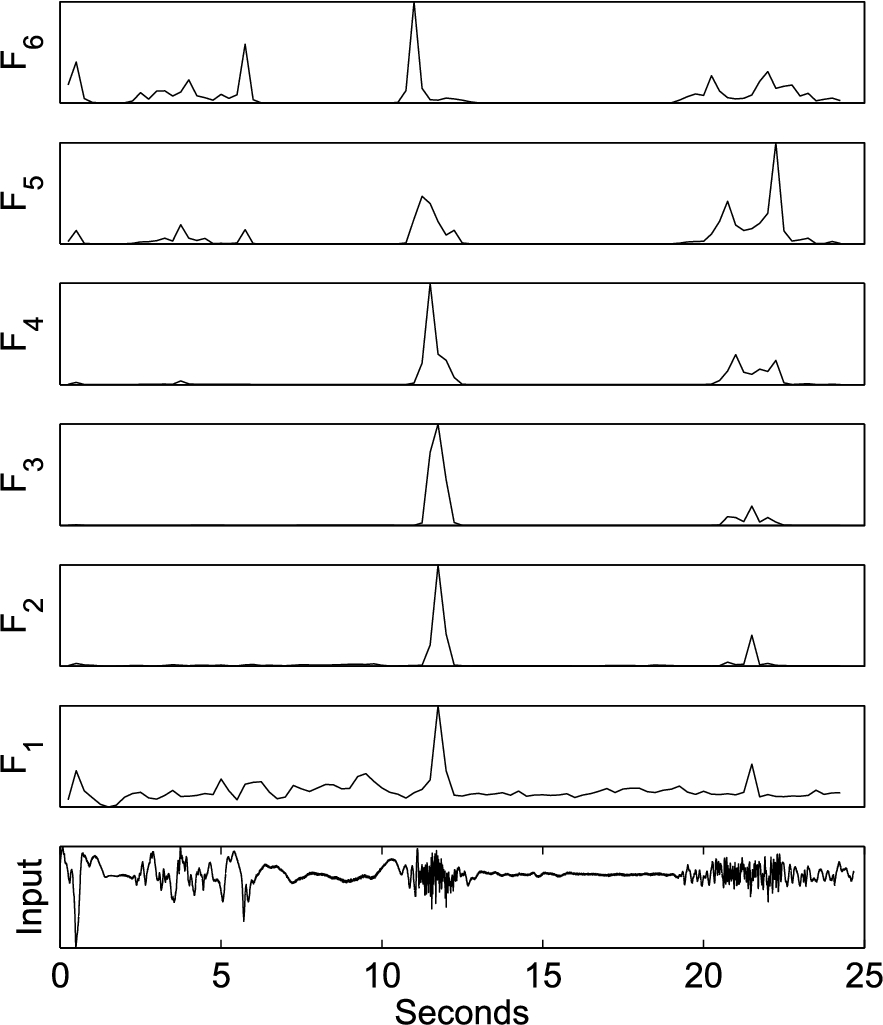
For comparison purpose, Fig. 11 gives the SWT decomposition uses the same data segment as in Fig. 4 using the wavelet function equal to “rbio3.3”. Figure 12 is the energy of multi-level wavelet decomposition of Fig. 11. A ceiling mounted radar appears to provide better results.
Fig. 12.
The short-term SWT energies of the torso radar signal to be used for features.
5.2.Feature consistency
The output of a Doppler radar is proportional to the velocity projected along the direction between the radar and the subject. In addition to the radar position, the geometric effect also affects the radar fall signature when the fall happens in different directions or positions. It is imperative to investigate the consistency of fall signatures when varying the positions and directions of the falls, at a certain radar position. We expect a robust fall detector to have consistent features that are not too sensitive to the fall directions or positions.
In this regard, we first generate the correlation coefficient of the feature vector of each fall with respect to the others. This process essentially forms a matrix of 126 by 126, where the
Fig. 13.
iVAT image of the correlation coefficients from the ceiling radar.
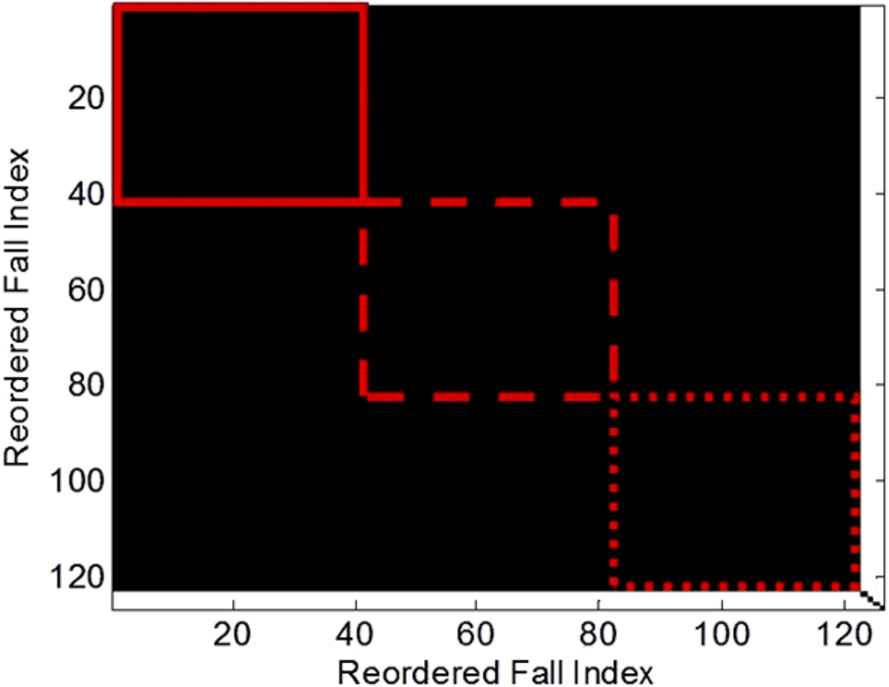
For the ceiling radar, the smallest correlation is 0.88, which comes from the north direction fall in position 19 with the west direction fall in position 3. To gain further insight, we use the iVAT image [6] to provide visual similarity assessment. The iVAT image represents the correlations by clustering the falls of high similarity together. At a correlation threshold of 0.9, Fig. 13 gives the binary iVAT image, where the horizontal and vertical axes represent the re-ordered numbering of the 126 falls. The dark areas correspond to correlations larger than the threshold. The upper left dark area is large, implying the similarity of the fall features is high. We further sort the falls by grouping them for the same fall direction. They are indicated by different line styles of “solid line”, “dashed line” and “dotted line” for the three directions – north, west and east. The distributions for the fall directions are quite uniform in the highly correlated region, suggesting the fall features are not sensitive to the fall directions.
We repeat the same study for the torso radar. The smallest correlation value is 0.61, from the east direction fall at position 7 with the east direction fall at position 8. Figure 14 is the binary iVAT image of all 126 falls at the correlation threshold of 0.9. Comparing Fig. 13 with Fig. 14, the upper left dark area is much smaller, indicating the similarity for the fall features is less. Regarding the fall directions, the signatures from the north direction falls appear to be less consistent than those from the other two directions, since the solid line area in the upper left dark region is smaller. The consistency of the falls in the other two directions are similar.
Fig. 14.
iVAT image of the correlation coefficients from the torso radar.
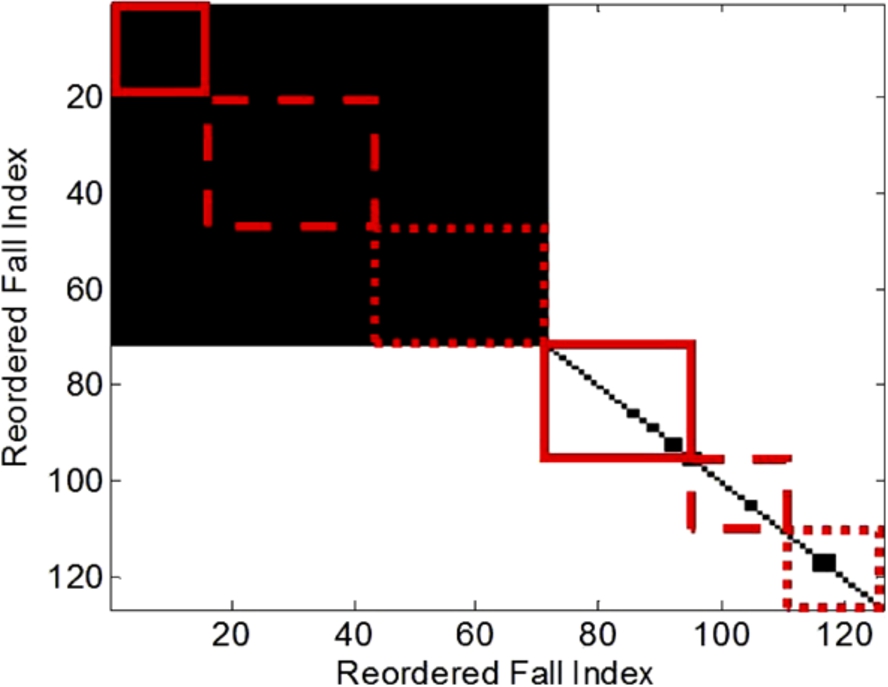
Fig. 15.
iVAT image from the correlation coefficients of the 21 different positions; ceiling radar: left, torso rador: right.
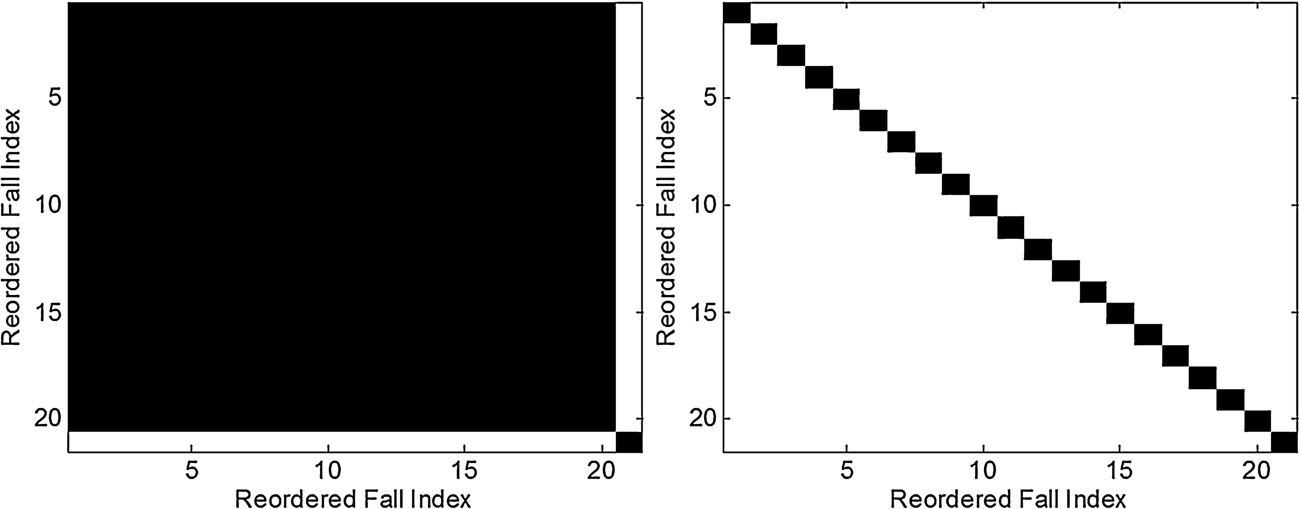
Fig. 16.
iVAT image from the correlation coefficients of the 21 different positions with different thresholds.
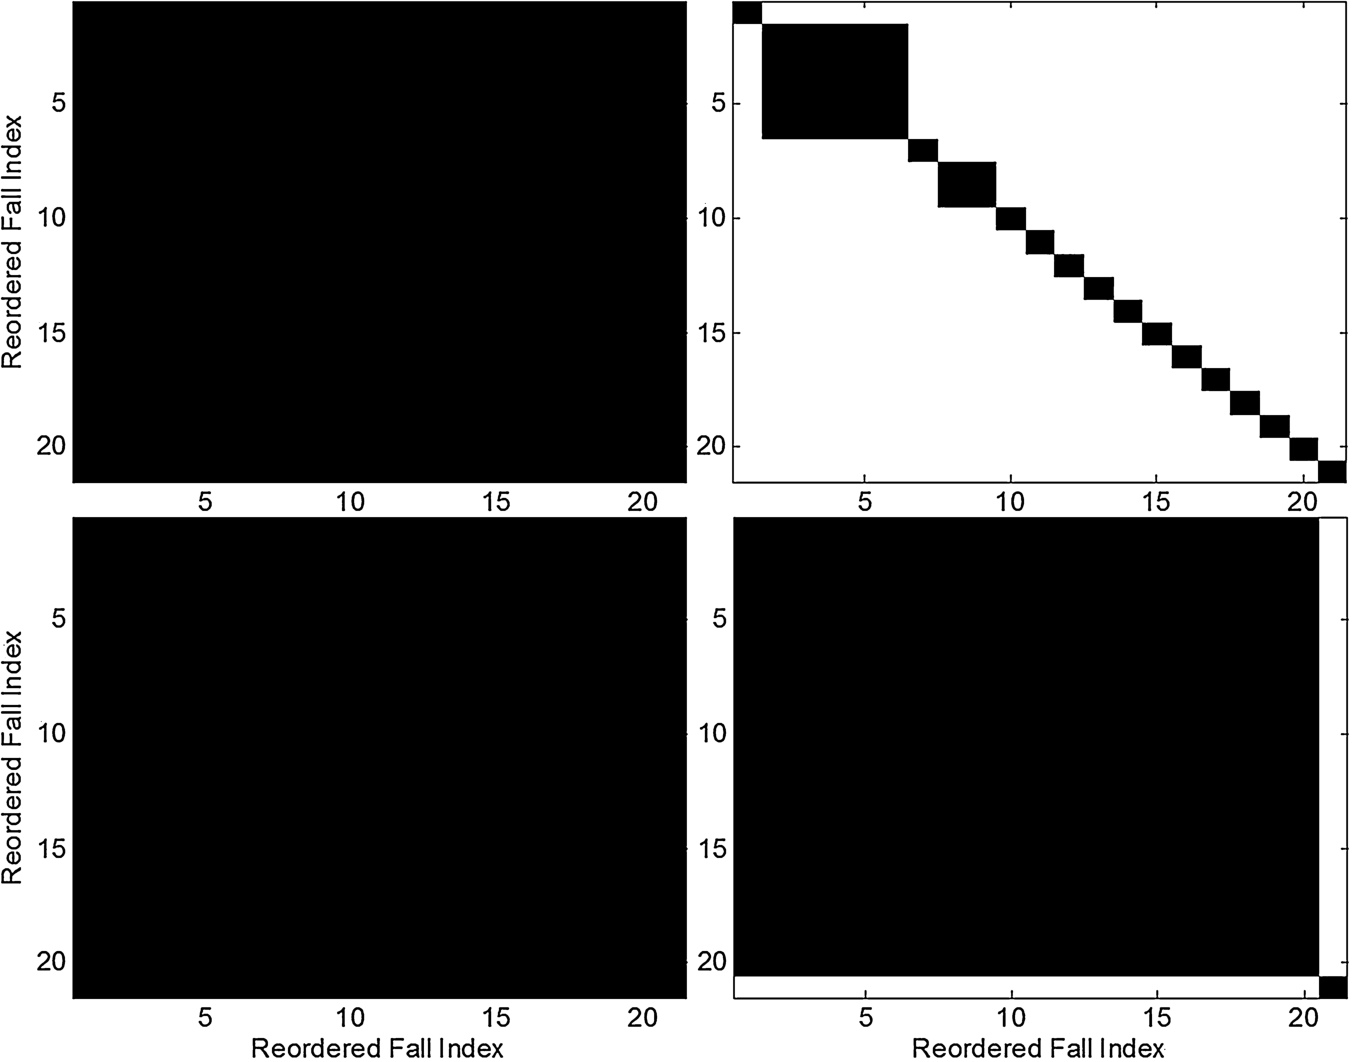
Next, we examine the effect of fall positions. For each position, we average the correlation coefficients for the three fall directions and the two subjects, resulting in a correlation coefficient matrix of size 21. The corresponding binary iVAT images are shown in Fig. 15. The left subfigure is for the ceiling radar and the right one is for the torso radar, where the correlation threshold is set at 0.9, the same value as in Fig. 13 and Fig. 14. Interestingly, the features from the ceiling radar is quite insensitive to the fall positions and this is not the case for the torso radar. Figure 16 illustrates the binary iVAT images at different correlation thresholds, where the top two subfigures uses a value of 0.8 and bottom two 0.7. The left two subfigures are from the ceiling radar and the two right ones are from the torso radar. It is clear that the ceiling radar is insensitive to fall positions where the correlations among them are at least 0.8. This is not the case in the torso radar, only six fall positions have correlations larger than 0.8 and there are two fall positions having correlations less than 0.7.
The study concludes the ceiling radar has more robust features for fall detection with respect to fall directions and positions, thereby expecting to outperform the torso radar. This is consistent with the observations in [11] and the ROC results in Section 5.
5.3.Complementary radar features
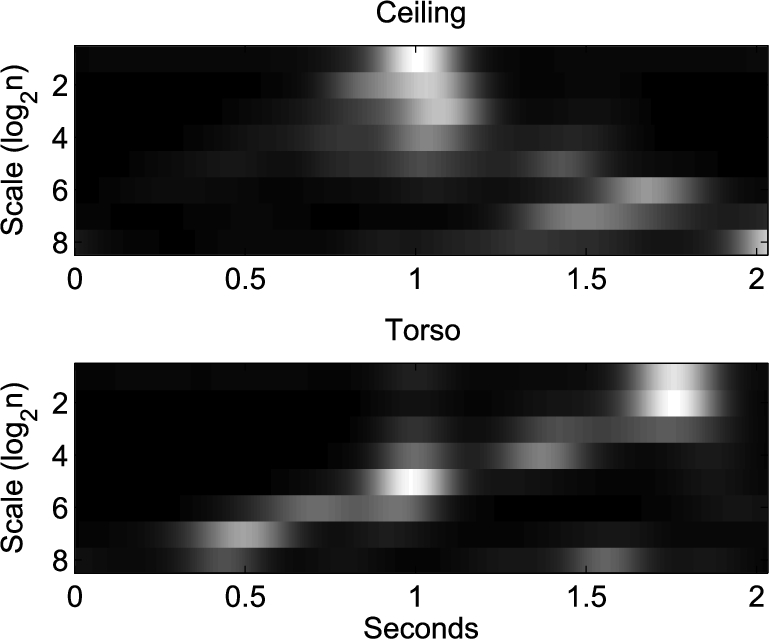
We now examine the similarity of the signatures from the ceiling and torso radars. It is realized that the ceiling radar to subject direction and the torso radar to subject direction are nearly orthogonal. The two radars could observe different characteristics of a fall. Figure 17 shows their signals and spectrograms, for the fall at the center of the room falling towards the north direction. It is obvious their time domain responses are different. The spectrograms reveal high to low frequency content for the ceiling radar and the reverse for the torso radar. The corresponding SWT features at several dyadic scales that characterize the time-frequency behaviors over the 2-second fall segments are shown in Fig. 18, where a smoothing window of 0.5 is applied to give better visualization. The upper subfigure is for the ceiling radar and the lower for the torso radar. The ceiling radar has strong responses in the small scales (high frequency) at the beginning and in the large scales (low frequency) towards the end of the fall. For the same fall, the torso radar essentially provides the opposite behavior where low frequency responses appear at the beginning of the fall followed by high frequency responses while the subject reaches the ground. The explanation comes from the fact that the fall motion is moving downward followed by lying horizontally.
Fig. 17.
The ceiling and torso radar outputs and the corresponding spectrograms of a human fall at position 1 towards north.
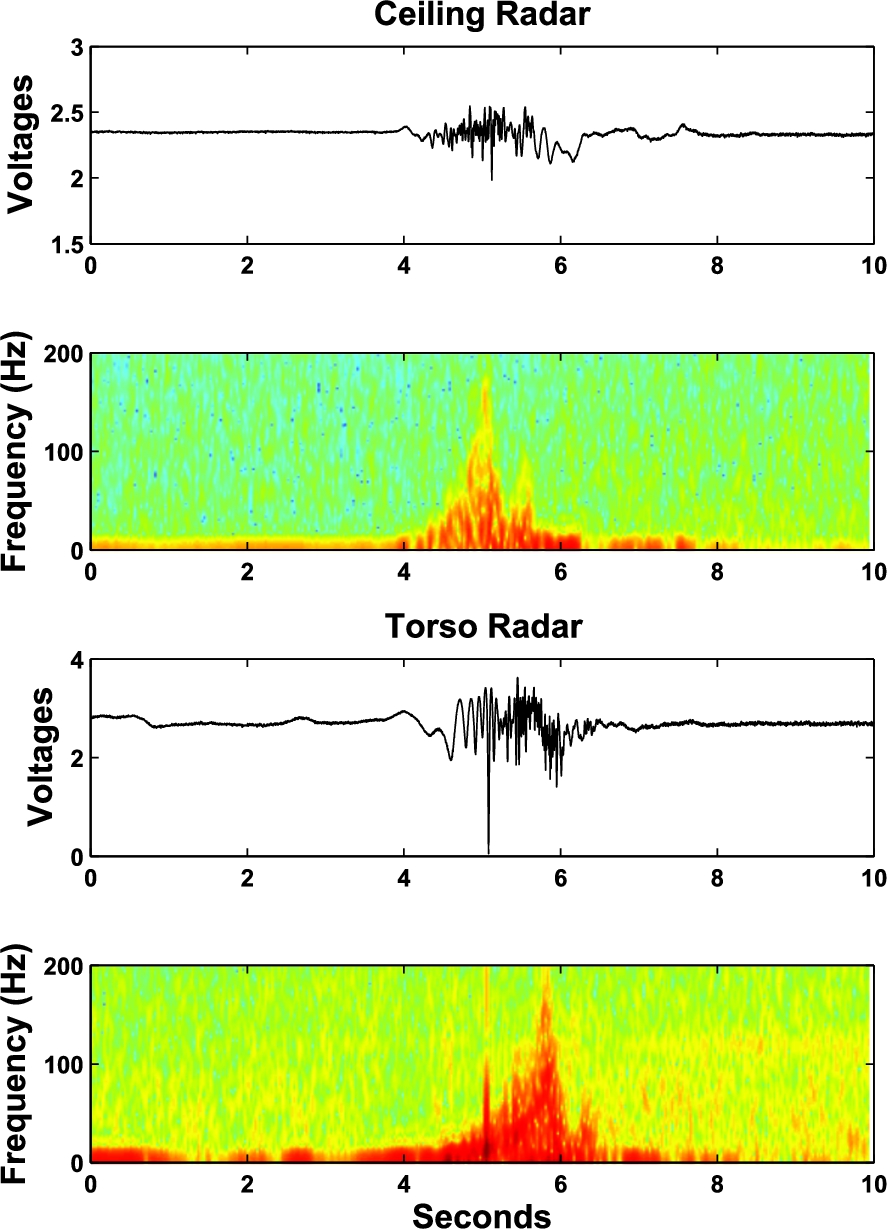
Fig. 18.
SWTs for the two radars of the fall at position 1 towards north.
To examine further, we compute the correlation coefficients of the same fall observed by the ceiling and the torso radar. Figure 19 depicts the correlation values sorted in decreasing order, where the results from the three fall directions are shown separately. The trends in the three fall directions show similar behavior. The highest correlations for the same fall are at position 7, 15 and 14 for the north, west and east directions. The worst correlations appear for the falls at position 1, 17 and 17 for the three directions.
There is little similarity of the fall signatures observed by the two radars, due to their nearly orthogonal radar to subject directions. Indeed, the ceiling radar captures the fall dynamics in the vertical direction and the torso radar the horizontal direction. We expect that integrating the features from both radars together can improve the fall detection performance and reduce the false alarms.
Fig. 19.
The correlation coefficients between ceiling and torso radars for the same falls.
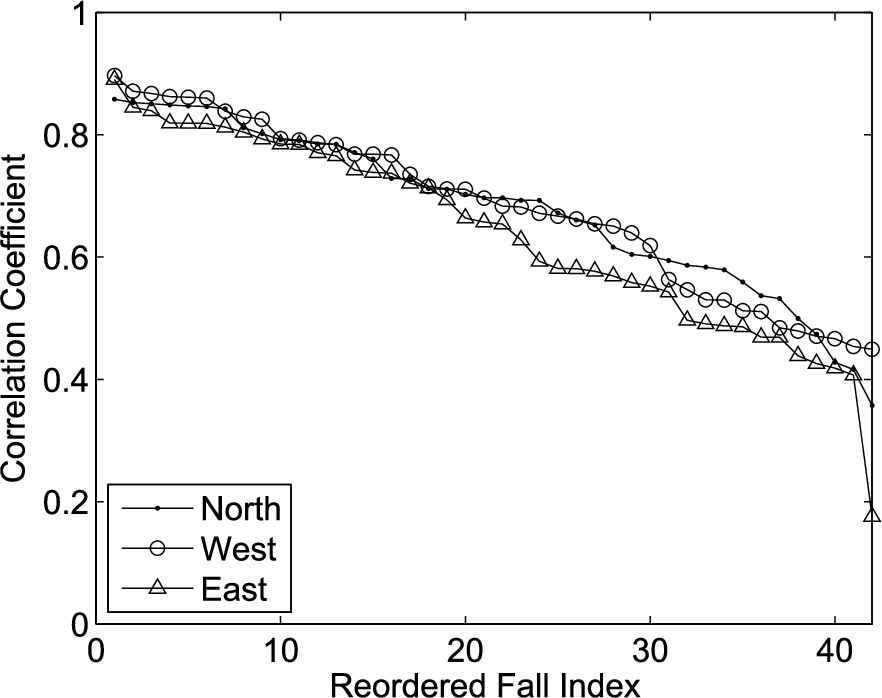
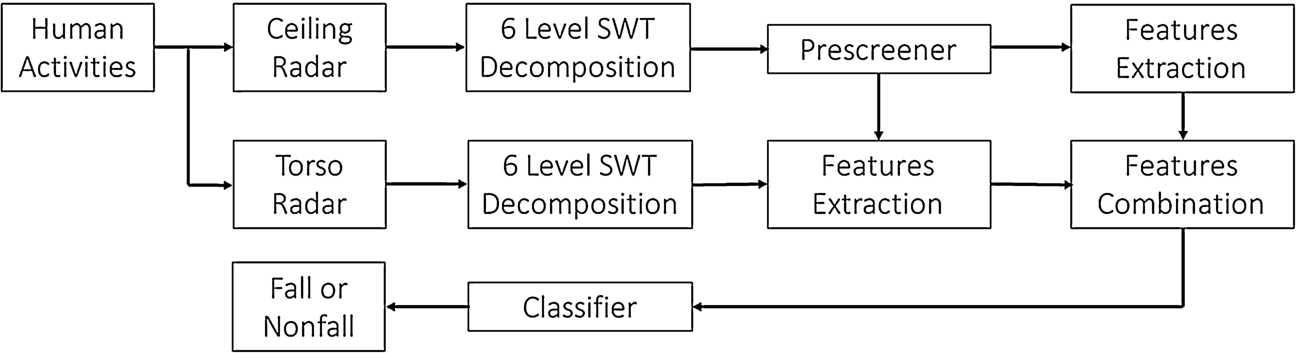
Fig. 20.
The flow chart of human fall detection by using two Doppler radars.
5.4.Performance improvement by using two radars
We shall propose to integrate the features from both radars together for fall detection. The processing block diagram is shown in Fig. 20. First, we utilize the prescreener alarms from the ceiling radar to extract the SWT features for the ceiling and torso radars at the same temporal region. The features from both radars are concatenated to form a single feature vector that has a length of 108, twice as the individual. The feature vector is applied to train a nearest-neighbor classifier for fall vs non-fall classification.
The radar placed in the attic captures the motion projected along the z-axis and the one on the wall captures the motion along the x and y axes. Both radars together provide better understanding of the motions in the three axes and thereby yielding better detection performance.
6.Results
Both radars apply the same algorithm to perform prescreening for identifying the temporal regions having possible falls and to extract features for fall vs non-fall classification. The prescreening detection does not require training and the classification results use leave one out cross-validation [9]. The wavelet function “rbio3.3” is used for SWT, which is found to yield the best results for both radars.
For dataset D0, Fig. 21 contrasts the prescreening performance of the ceiling and torso radars, which are denoted by CR and TR. The ceiling radar yields much better prescreening performance than the torso. At the same detection rate, the number of false alarms is at least halved.
Fig. 21.
The prescreener results of dataset D0.
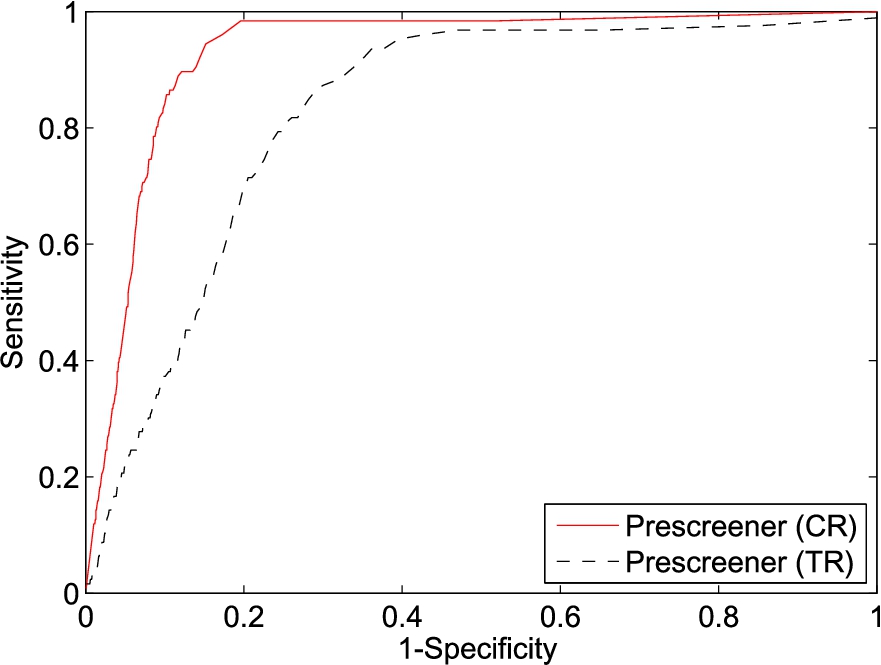
Figure 22 illustrates the results of the second level processing of classification. It improves the prescreening results considerably. The ceiling radar continues to outperform the torso radar significantly, except at near 100% detection where the torso radar is better.
Fig. 22.
The classifier results of dataset D0.
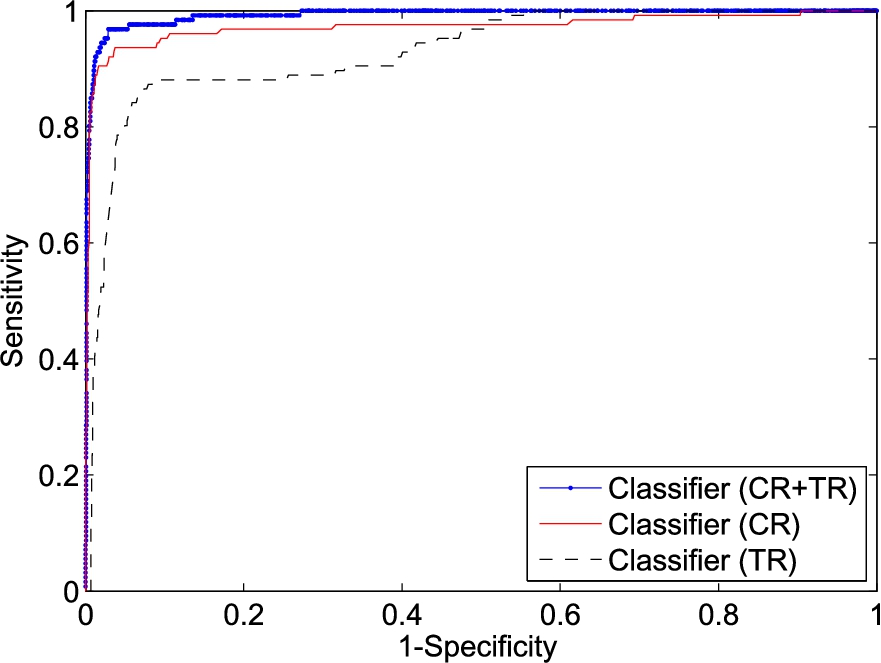
Also shown in Fig. 22 are the detection results when using the concatenated features from both radars. It provides considerable improvement to detect the last few hard to detect falls.
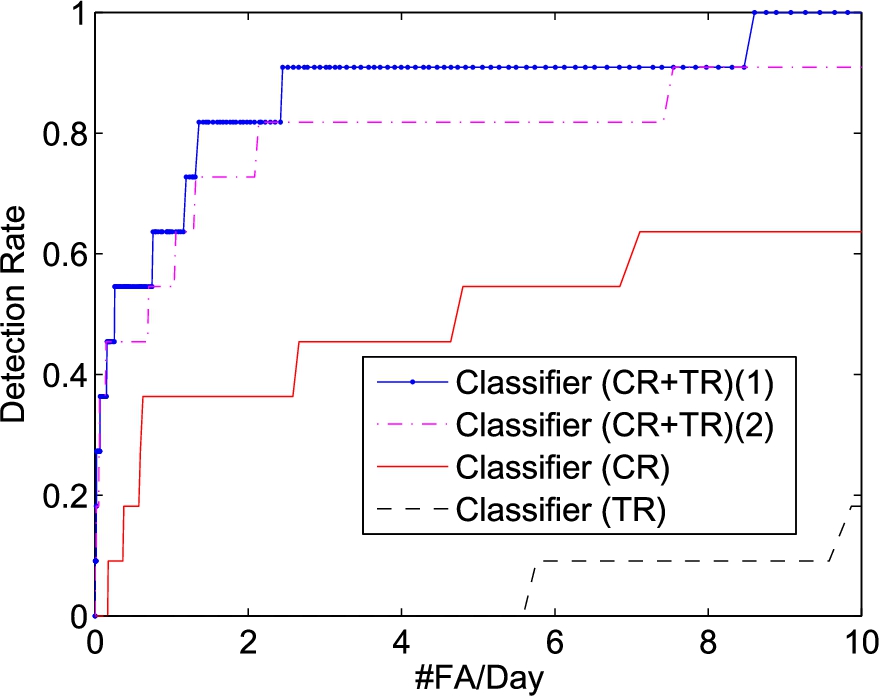
We next evaluate the performance using dataset D1. The radar data were processed continuously and no data portions were removed. The fall activities were identified through the depth image video collected in conjunction with the radar data. Due to the low number of falls, only 11, in the dataset, we include always the falls from D0 in the training but exclude them in the testing for cross validation. The prescreening performance is shown in Fig. 23 and the classification results in Fig. 24, Classifier (CR+TR)(1). The prescreener from the ceiling radar gives about 250 alarms per day. The torso radar prescreener produces almost 400 alarms per day. The classification performance from the ceiling radar is far better than the torso radar. It confirms our investigations in Section 4 that the features from ceiling radar are more consistent and generalize better than the torso radar for classification. Nevertheless, there remains 30.7 false alarms to reach 90% detection rate and 83.7 for 100% when using the ceiling radar alone.
Fig. 23.
The prescreener results of dataset D1.
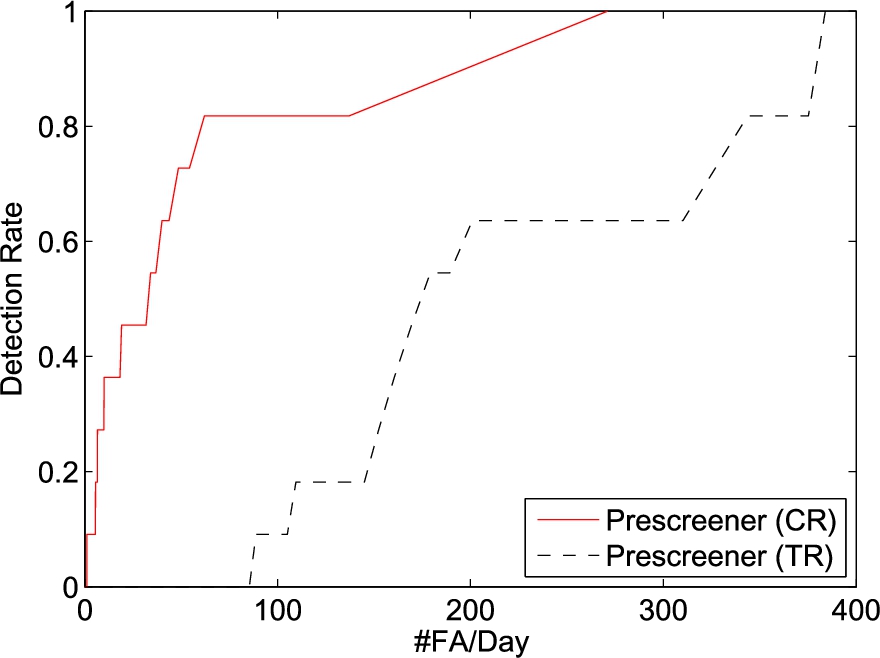
Fig. 24.
The classifier results of dataset D1.
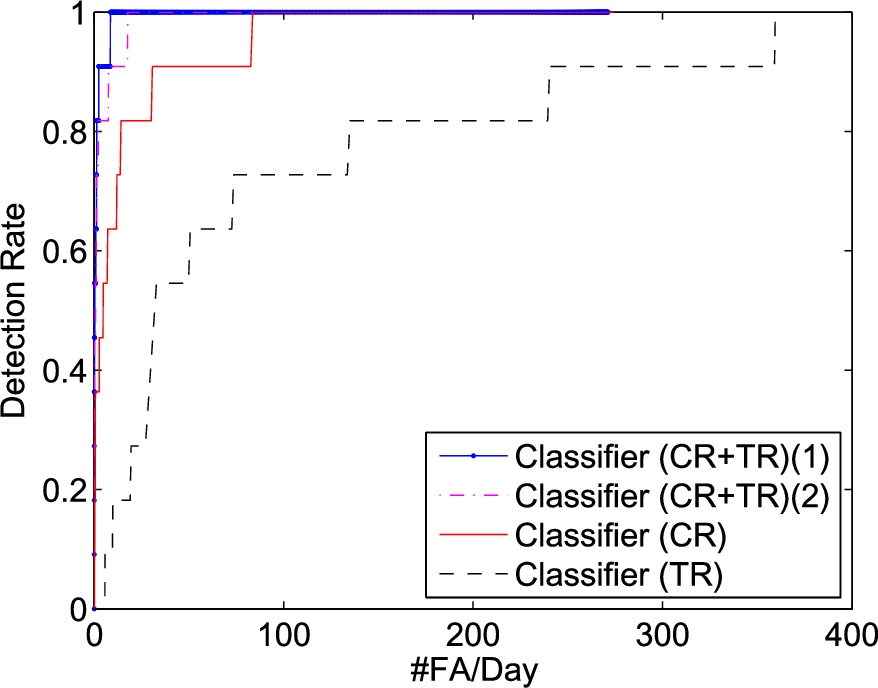
When using both radars together to form the features, the number of false alarms reduces to 2.4 per day at 90% detection. To reach 100% detection the number of false alarms is 8.6 per day. The weakest fall occurred at the edge of the coverage areas of both radars and they don’t capture well the motion of this fall. The false alarm rate decreases to 2.4 per day if we ignore that particular fall.
The previous work [19] used only the ceiling radar for fall detection. At 100% detection, it reported 1.6 false alarms per day over 10 days, where the data portions with staff or visitors present were removed. Isolating the data when the subject is alone is found to be not practical for fall detection in reality. If we apply the same processing as in Fig. 24 to this dataset without removing the data portions where staff or visitors are present, the number of false alarms is 58.3 per day to reach 100% detection after classification. Having both ceiling and torso radar not only improves fall detection but also increases system robustness.
To ease the concern that the classifier could be overfitted on the subject, also shown in Fig. 24, Classifier (CR+TR)(2), is the ROC curve where the classifier is trained using the falls from D0 only, instead of using leave-one-out cross validation when testing the detection of falls of D1. At 70% Detection Rate, the performance is nearly identical with leave-one-out cross validation. The results remain encouraging in reaching 100% Detection Rate and are much better than using either radar by itself. We would also like to add that the fall detection system is to be used to detect the falls of a particular elder person in his/her residence. It is not unreasonable of training a classifier to fit the falls of that particular individual, which could lead to better detection performance.
The results in Figs 21–25 ascertain better performance when the radar is mounted in the ceiling center than in the torso level. This observation can be explained by the fact that the response of a Doppler radar is proportional to the velocity component along the radar-subject direction. Fall is a downward motion. A ceiling mounted radar aligns the radar-subject direction with the velocity better than a torso level attached radar, and as a result leading to better performance.
7.Conclusion
We have analyzed the fall signatures from the ceiling mounted and the torso-level attached radar. The time-frequency (wavelet) features from the ceiling radar are more consistent than the torso radar, irrespective of the fall directions and fall positions. As a result, having the radar in the ceiling would provide better fall detection performance. The fall features from both radars have shown to complement each other. Integrating the features from both radars is able to improve the detection performance, especially for the hard to detect falls. The results from both the laboratory data and the extensive senior residence data confirm our studies and illustrate the advantages of using both radars.
Although promising, the number of false alarms may still be considered not sufficiently low for practical use. We are continuing this research and having additional radars for better spatial coverage would improve performance. In addition, when integrating the radar fall detection system with other sensor modalities such as acoustics and cameras, the number of false alarms could be reduced considerably.
There are many directions to extend the work of using radar for elder care. One is the estimation and monitoring of vital signs. Another would be the tracking of a subject remotely such as behind walls.
Notes
1 Available at: http://utcfssecurityproducts.com/.
2 TigerPlace is an assisted living facility in Columbia, Missouri, USA. Available at: http://eldertech.missouri.edu/.
Acknowledgements
This project was supported by grant R01HS018477 from the Agency for Healthcare Research and Quality. The content is solely the responsibility of the authors and does not necessarily represent the official views of the Agency for Healthcare Research and Quality.
References
[1] | M.G. Amin, Y.D. Zhang and B. Boashash, igh-resolution time-frequency distributions for fall detection, in: Proc. SPIE, Baltimore, USA, (2015) . |
[2] | B. Cagliyan and S.Z. Gurbuz, Micro-Doppler-based human activity classification using the mote-scale bumblebee radar, IEEE Geosci. Remote Sens. Lett. 12: (10) ((2015) ), 2135–2139. doi:10.1109/LGRS.2015.2452946. |
[3] | I. Daubechies, Ten Lectures on Wavelets, SIAM, (1992) . |
[4] | A. Gadde, M.G. Amin, Y.D. Zhang and F. Ahmad, Fall detection and classification based on time-scale radar signal characteristics, in: Proc. SPIE, Baltimore, USA, (2014) . |
[5] | C. Garripoli et al., Embedded DSP-based telehealth radar system for remote in-door fall detection, IEEE J. Biomed. Health Inform. 19: (1) ((2015) ), 92–101. doi:10.1109/JBHI.2014.2361252. |
[6] | T.C. Havens and J.C. Bezdek, An efficient formulation of the improved visual assessment of tendency (iVAT) algorithm, IEEE Trans. Knowl. Data Eng. 24: (5) ((2012) ), 813–822. doi:10.1109/TKDE.2011.33. |
[7] | J. Hong, S. Tomii and T. Ohtsuki, Cooperative fall detection using Doppler radar and array sensor, in: Proc. IEEE Int. Symp. on PIMRC, London, UK, (2013) , pp. 3492–3496. |
[8] | B. Jokanovic, M.G. Amin, Y.D. Zhang and F. Ahmad, Multi-window time-frequency signature reconstruction from undersampled continuous-wave radar measurements for fall detection, IET Radar Sonar Navig. 9: (2) ((2015) ), 173–183. doi:10.1049/iet-rsn.2014.0254. |
[9] | R. Kohavi, A study of cross-validation and bootstrap for accuracy estimation and model selection, in: Proc. IJCAI, Montreal, Quebec, Canada, (1995) , pp. 1137–1143. |
[10] | J.J. Lee, S.M. Lee, I.Y. Kim, H.K. Min and S.H. Hong, Comparison between short time Fourier and wavelet transform for feature extraction of heart sound, in: Proc. Int. IEEE TENCON Conf, Cheju Island, Korea, (1999) , pp. 1547–1550. |
[11] | L. Liu, M. Popescu, K.C. Ho, M. Skubic and M. Rantz, Doppler radar sensor positioning in a fall detection system, in: Proc. 34th Annu. Int. IEEE Eng. Med. Biol. Soc. Conf, San Diego, USA, (2012) , pp. 256–259. |
[12] | L. Liu, M. Popescu, M. Skubic, M. Rantz, T. Yardibi and P. Cuddihy, Automatic fall detection based on Doppler radar motion signature, in: Proc. 5th Int. Conf. on PervasiveHealth, Dublin, Ireland, (2011) , pp. 222–225. |
[13] | L. Liu, M. Popescu, M. Skubic, M. Rantz and P. Cuddihy, An automatic in-home fall detection system using Doppler radar signatures, J Ambient Intell Smart Environ 8: (4) ((2016) ), 453–466. doi:10.3233/AIS-160388. |
[14] | S. Mallat, A Wavelet Tour of Signal Processing, Academic Press, (2008) . |
[15] | M. Mercuri et al., Analysis of a fall detection radar placed on ceiling and wall, in: Proc. APMC, Sendai, Japan, (2014) , pp. 947–949. |
[16] | M. Mercuri, D. Schreurs and P. Leroux, SFCW microwave radar for in-door fall detection, in: Proc. IEEE BioWireleSS Conf, Santa Clara, CA, USA, (2012) , pp. 53–56. |
[17] | G.P. Nason and B.W. Silverman, The stationary wavelet transform and some statistical applications, Lecture Notes in Statistics 103: ((1995) ), 281–299. doi:10.1007/978-1-4612-2544-7_17. |
[18] | O. Rioul and M. Vetterli, Wavelets and signal processing, IEEE Signal Processing. Mag. 8: ((1991) ), 14–38. doi:10.1109/79.91217. |
[19] | B.Y. Su, K.C. Ho, M.J. Rantz and M. Skubic, Doppler radar fall activity detection using the wavelet transform, IEEE Trans. Biomed. Eng. 62: (3) ((2015) ), 865–875. doi:10.1109/TBME.2014.2367038. |
[20] | H. Wang, L. Ren, E. Mao and A.E. Fathy, Phase based motion characteristics measurement for fall detection by using stepped-frequency continuous wave radar, in: Proc. IEEE BioWireleSS Conf, Austin, TX, USA, (2016) , pp. 43–45. |
[21] | M.H. Zweig and G. Campbell, Receiver-operating characteristic (ROC) plots: A fundamental evaluation tool in clinical medicine, Clin. Chem. 39: ((1993) ), 561–577. |


