
Identification of Blood Biomarkers Related to Energy Metabolism and Construction of Diagnostic Prediction Model Based on Three Independent Alzheimer’s Disease Cohorts
Abstract
Background:
Blood biomarkers are crucial for the diagnosis and therapy of Alzheimer’s disease (AD). Energy metabolism disturbances are closely related to AD. However, research on blood biomarkers related to energy metabolism is still insufficient.
Objective:
This study aims to explore the diagnostic and therapeutic significance of energy metabolism-related genes in AD.
Methods:
AD cohorts were obtained from GEO database and single center. Machine learning algorithms were used to identify key genes. GSEA was used for functional analysis. Six algorithms were utilized to establish and evaluate diagnostic models. Key gene-related drugs were screened through network pharmacology.
Results:
We identified 4 energy metabolism genes, NDUFA1, MECOM, RPL26, and RPS27. These genes have been confirmed to be closely related to multiple energy metabolic pathways and different types of T cell immune infiltration. Additionally, the transcription factors INSM2 and 4 lncRNAs were involved in regulating 4 genes. Further analysis showed that all biomarkers were downregulated in the AD cohorts and not affected by aging and gender. More importantly, we constructed a diagnostic prediction model of 4 biomarkers, which has been validated by various algorithms for its diagnostic performance. Furthermore, we found that valproic acid mainly interacted with these biomarkers through hydrogen bonding, salt bonding, and hydrophobic interaction.
Conclusions:
We constructed a predictive model based on 4 energy metabolism genes, which may be helpful for the diagnosis of AD. The 4 validated genes could serve as promising blood biomarkers for AD. Their interaction with valproic acid may play a crucial role in the therapy of AD.
INTRODUCTION
Alzheimer’s disease (AD) is a progressive neurodegenerative disorder characterized by cognitive decline.1 Aging, female, and apolipoprotein E (APOE) ɛ4 allele are widely considered as major risk factors for AD. Early diagnosis of AD is clinically challenging due to its high prevalence and insidious onset.2 Currently, positron emission tomography (PET) and cerebrospinal fluid (CSF) biomarkers are widely used in clinical practice.3,4 Extensive researches have demonstrated that blood biomarkers certainly have some clinical diagnostic value, such as amyloid-β (Aβ)42, Aβ40, Aβ40/42 ratio according to the Aβ deposition pathology;5 phospho-tau 181 (p-tau 181), p-tau 217, p-tau 231 for the neurofibrillary tangling mechanism;6–8 glial fibrillary acidic protein (GFAP) and neurofilament based on neuroinflammatory mechanism.9,10 However, due to the complexity of AD pathogenesis, solely focusing on these mainstream neuropathological features is insufficient for clinical diagnosis and interventional therapy.
In recent years, numerous studies have provided evidence that the pathological features of AD are accompanied by energy metabolism disturbances.11,12 The glucose metabolic homeostasis is particularly crucial for brain energy metabolism.13 Neurons rely heavily on glucose and ATP for physiological activities, such as learning, memory and cognition.14 Meanwhile, astrocytes supply neurons with glycolytic products like lactate to fulfill the high energy metabolic demands of neurons.14 Study has reported a reduction expression of glucose transporter 1 (GLUT1) in AD.15 Furthermore, impaired energy metabolism in AD disrupts the efficient neuronal Aβ clearance, leading to cognitive decline.16 Increased astrocyte reactivity and multiple metabolic disorders are also early AD pathological features, resulting from abnormal accumulation of Aβ in the brain,17,18 which in turn affect neuronal function and cognitive ability.17,19 These findings highlight the close relationship between energy metabolic impairments and AD progression.20 Recent study has even identified patients with glucose metabolism and mitochondrial dysfunction prior to clinical AD symptom onsets.21 Of note, it is crucial to identify energy metabolism-related genes with potential diagnostic value and to construct diagnostic models and search for potential drugs for treatment. These efforts are essential for slowing down the AD progression, improving prognosis, and enabling early prevention in populations at risk of cognitive impairment.
Machine learning, a form of artificial intelligence, such as random forests (RF) and generalized linear regression models, has been employed and widely utilized in the study of AD pathogenesis and the search for biomarkers that can serve as diagnostic or prognostic purposes. Examples of biomarkers include autophagy-related genes,22 mitochondria-related genes,23,24 ferroptosis-related genes,25 and oxidative stress biomarkers26 have been explored as potential AD biomarkers. Additionally, researchers have increasingly used machine learning to develop AD diagnostic or prognostic prediction models, which have demonstrated high objectivity, predictability, and stability.27–29 For instance, Qiang et al.29 utilized machine learning algorithms to quantitatively assess and stratify the significance of plasma metabolites in AD, revealing their important contribution to diagnosis. Similarly, Tao et al.30 identified 18 serum proteins and 21 CSF protein biomarkers that could differentiate AD stage through screening their discovery cohort. Wang et al.27 discovered characteristic urinary proteins that could differentiate AD and mild cognitive impairment (MCI), while Ferreiro et al.31 identified intestinal markers for preclinical AD. In addition, Lian et al.28 identified and built a diagnostic model by 8 genes bridged metabolic status and AD subtypes pathogenesis, but merely used the brain tissue samples and verified in the mouse model. However, studies utilizing machine learning to identify blood biomarkers from AD patients at the level of a more specific energy metabolism mechanisms for diagnosis, have not yet been reported.
In the field of AD treatment research, currently FDA-approved drugs, such as memantine and galantamine, are used to improve symptoms.1 Additionally, anti-Aβ monoclonal antibodies are used to alleviate the dementia progression.32,33 However, these drugs are limited to prevent or reverse the underlying causes of AD.34 To address this, researchers have been combining machine learning and molecular docking in recent years for new drug development and drug repurposing in AD.35 The approach aims to expedite the drug development process, reduce experimental costs, and shorten the research and development cycle. Moreover, computational drug repurposing has been proved to be a promising method for identifying candidate therapeutic medications and developing treatments for neurodegenerative diseases36 and other newly emerging infectious diseases.37 In a high-throughput target-trial study of drug repurposing in AD, real-world data were used to identify indications for 5 medications (pantoprazole, gabapentin, atorvastatin, fluticasone, and omeprazole) that could potentially benefit AD patients.38 Oliveros et al.39 repurposed ibudilast as a potential drug in AD. Azmi et al.40 utilized virtual screening and molecular docking, along with machine learning, to identify hesperidin as a promising flavonoid for future AD treatment. He et al. identified 5 traditional medicines that could be used for AD treatment in combination with conventional drugs by using an artificial intelligence algorithm consisting of deep learning models.41 Therefore, the integration of machine learning methods and molecular docking techniques hold promise in identifying and screening AD blood biomarkers related to energy metabolism, as well as potential drugs or compounds. This approach may offer new strategies for the future diagnosis, intervention, and treatment of AD.42
In this study, we utilized 2 independent AD cohorts from the GEO database, consisting of European individuals, as training and validation cohorts. Additionally, we included an AD clinical cohort of Asians as a local validation cohort. Limma, WGCNA, and machine learning algorithms (e.g., LASSO and RF) were employed to identify key genes related to energy metabolism. Subsequently, functional analyses of the identified biomarkers revealed their existing functions on energy metabolism-related pathways and immune feature correlation with GSEA enrichment. TF-mRNA interactions and ceRNA network suggested the possible regulatory mechanism of 4 biomarkers. Diagnostic models for the training and validation cohorts were constructed using ROC and multivariate Cox regression analysis, and the performance of the models was evaluated using calibration curves, DCA analysis tools and various machine learning algorithms. Further research evaluated the effects of aging and gender risk factors on differential gene expression. Furthermore, computational protein-drug molecular docking and molecular dynamics simulation analyses were conducted to screen potentially active drugs based on the energy metabolism-related biomarkers and molecular docking. In conclusion, this study aimed to identify diagnostic candidate markers and potential drugs for AD based on the pathogenesis of energy metabolism. Additionally, an optimal AD diagnostic prediction model was constructed to provide valuable insights for clinical decision.
METHODS
Data extraction
The microarray RNA sequencing data set GSE6306043 was downloaded from the GEO database (https://www.ncbi.nlm.nih.gov/geo/), comprising 145 AD peripheral blood samples and 104 control samples from European ancestors, as the training cohort for later model construction (Table 1, Supplementary Table 1). GSE6306143 included 139 AD and 134 control peripheral blood samples from another European ancestors, and was treated as the validation cohort (Table 1, Supplementary Table 1). A total of 5,256 energy metabolism-related genes (EMRGs) were obtained from the GeneCards database (http://www.genecards.org/) with a score threshold >10.44
Table 1
Information of GEO datasets
| Dataset | Platform | Control (n) | AD (n) | Type |
| GSE63060 | GPL6947 Illumina HumanHT-12 V3.0 expression beadchip | 104 | 145 | peripheral blood |
| GSE63061 | GPL10558 Illumina HumanHT-12 V4.0 expression beadchip | 134 | 139 | peripheral blood |
N, number; AD, Alzheimer’s disease.
Differentially expressed genes analysis
In the training cohort (GSE63060), limma (v 3.56.2) package was used to identify the differentially expressed genes (DEGs) between AD and control samples (adjusted p < 0.05 and | log2 (fold change) | >0.5). R packages ggplot2 (v 3.4.4) and pheatmap (v 1.0.12) were used to draw volcano plot and heatmap of all DEGs, respectively.
Key genes identification with weighted gene co-expression network analysis (WGCNA)
WGCNA (v 1.72-5)45 was employed to determine the most significant module genes associated with AD. Initially, we conducted gene clustering by matching clinical phenotypes with sample data. Next, we defined the parameters of the topological network, including the soft threshold (β), and computed the scale-free distribution topology matrix. Once the β was determined, we built a weighted co-expression network and identified various gene modules. Ultimately, we established a link between gene modules and AD phenotypes, revealing that the red gene modules were most significantly associated with AD. The correlation between gene modules and phenotype was appraised through Spearman’s method. Subsequently, the Venn diagram illustrated the 15 key genes, through overlapping the DEGs, EMRGs and the red module genes. Thereafter, the circos track plot was employed to map the location of key genes on chromosomes with circlize (v 0.4.15).
Functional enrichment analysis
Gene Ontology (GO) and Kyoto Encyclopedia of Genes and Genomes (KEGG) pathway enrichment analysis of 4 AD biomarkers were carried out by using clusterProfiler (v 4.8.3) to explore the possible associated energy metabolism pathways. GO enriched results were then performed to show the following aspects of biological processes (BP), molecular functions (MF), and cellular components (CC). The summary of 4 AD biomarker genes and family homologous genes involved in AD and other diseases were collected in Supplementary Table 2. Single-gene gene set enrichment analysis (GSEA) was performed on biomarkers with gene set variation analysis (GSVA), and the reference gene set was C2: KEGG gene sets from Molecular Signatures Database (MSigDB, https://www.gsea-msigdb.org/gsea/msigdb).46,47 And the p value <0.05 was set as the standard, regarding to be significant. Additionally, the results of energy metabolism functional enrichment analysis were displayed with bubble, Sankey, lollipop charts and GSEAplots by igraph (v 1.4.1), ggraph (v 2.1.0), ggalluvial (v 0.12.3), ggplot2 (v 3.4.4) and enrichplot (v 1.24.0).
Machine learning in screening biomarkers
To narrow down and identify the biomarkers and prepare to construct a diagnostic model of AD, least absolute shrinkage and selection operator (LASSO) regression analysis was initially employed to refine the candidate biomarkers from the aforementioned 15 key genes with the glmnet (v 4.1-8) package. Then, the RF algorithm was employed to narrow down the candidate biomarkers with the randomForest (v 4.7-1.1), integrating multiple trees through the idea of ensemble learning to gain better accuracy. The overlapping genes of LASSO model and RF model were defined as biomarker genes for developing a diagnostic model of AD ultimately. Then, circlize (v 0.4.15) was used to display the location of biomarkers on chromosomes.
Construction and validation of nomogram
The nomogram was constructed based on the 4 biomarker genes by using the rms (v 6.3-0) package. The area under curve (AUC) was drawn to evaluate the performance of each biomarker and the nomogram in the diagnosis of AD. Furthermore, ROC curve was performed to determine whether the nomogram-based decision was conducive to AD diagnosis. Finally, the calibration curves and decision curve analysis (DCA) curves were carried out to assess the nomogram predictive efficiency in AD. Thereafter, to verify the accuracy of our AD diagnosis model, which is based on 4 biomarkers, we employed 6 different machine learning algorithms: K-Nearest Neighbor (KNN), RF, Support Vector Machine (SVM), Gaussian Navie Bayes, Logistic Regression, and Decision Tree.28 These algorithms were employed to evaluate the accuracy of our nomogram. We compared the classification performance of the 6 models by utilizing evaluation indicators such as ROC curve, sensitivity, and specificity, while indicating better performance of our diagnostic AD nomogram. Utilizing the glmnet (v 4.1-8), survival (v 3.3.1), rmda (v 1.6), regplot (v 1.1), nomogramFormula (v 1.2.0.0), randomForest (v 4.7-1.1), e1071 (v 1.7-14), kernlab (v 0.9-32), naivebyes (v 0.9.7), caTools (v 1.18.2), and caret (v 6.0-94) R packages, we constructed and validated the nomogram model based on biomarkers. The ROC curves, nomograms and calibration curves of each biomarker were visualized on GSE63060 and GSE63061, respectively. The AUC values and corresponding 95% confidence intervals were calculated to distinguish AD and control groups.
Immune characteristics and correlation analysis
GSVA (v 1.50.0)47 was used to conduct single sample gene set enrichment analysis (ssGSEA) of 28 immune gene set samples to evaluate the immunological properties of AD patients. A correlation matrix was constructed for all 28 immune cell subtypes, as well as biomarkers and correlation coefficients between immune cells with significantly different expressions. The abundance score for each immune cell type was calculated in both AD and control samples, and visualized using box plots generated with the Wilcoxon rank-sum test. The correlation between biomarkers and differential immune cells was calculated by Spearman’s method (p < 0.05, |cor| >0.5).
TF-biomarkers regulatory network
The TFs and biomarkers regulation relationships were performed and extracted from the NetworkAnalyst database (https://www.networkanalyst.ca/).48 All predicted TF targets were derived from the JASPAR TF binding site profile database.49 Cytoscape (v.3.8.2) was employed for visualizing the network.50
LncRNA-miRNA-biomarker ceRNA network construction
The microRNAs (miRNAs) interacting with biomarkers was predicted by using ENCORI/starBase (https://rnasysu.com/encori/).51 Then the long noncoding RNAs (lncRNAs) of the predicted miRNA was predicted following the same way. Finally, the predicted lncRNA-miRNA pairs and miRNA– biomarker pairs were extracted and combined to construct lncRNA-miRNA-biomarker regulatory networks based on competitive endogenous RNA (ceRNA) regulatory mechanisms. The overall ceRNA network was constructed and visualized by Cytoscape.
Correlation analysis
Correlation analysis was conducted between the expression levels of biomarkers (NDUFA1, MECOM, RPL26, and RPS27) and risk factors in all participants from the GSE63060 and GSE63061. The coefficient for correlation was performed using Pearson’s correlation analysis. Then, the expression levels of biomarkers and aging factors (TP53, CDKN1A, CDKN2A) were conducted the correlation in two cohorts from GSE63060 and GSE6061, respectively. The correlation was analyzed by Spearman’s correlation coefficient. And the p value for significance of the correlation was calculated. The correlation analysis was performed using cowplot (v 1.1.3) R package.
Human subjects
The blood samples, including 13 AD patients diagnosed with magnetic resonance imaging (MRI) and computed tomography (CT), and 12 healthy subjects (Supplementary Table 1), were acquired from the Aerospace Center Hospital in China, Peking University School of Clinical Aerospace Medicine. This study was conducted in accordance with Good Clinical Practice Guidelines and the Helsinki Declaration. All patients were provided with informed consent forms for blood sampling. The ethical declaration and ethical approval have been approved by the Ethics Review Committee of Aerospace Center Hospital (2022008).
Real-time quantitative polymerase chain reaction (RT-qPCR)
Total RNA was extracted from 25 whole blood samples by TRIzol™ reagent (15596026, Invitrogen, Thermo Fisher Scientific Co., Ltd) according to the manufacturer’s instructions, using a 1:3 ratio of sample: TRIzol™ reagent. After applying the reverse transcription, RT-qPCR was performed using Fast SYBR Green Master mix (4385610, Applied Biosystems™, Thermo Fisher Scientific Co., Ltd) or Taqman Fast Advanced Master Mix (4444556, Applied Biosystems™, Thermo Fisher Scientific Co., Ltd), and data was normalized to the house-keeping gene GAPDH. The primer sequences used in this study are provided in Supplementary Table 3. After completing the reaction, the quantitative method used 2−ΔΔCT to represent the gene expression level.
Enzyme linked immunosorbent assay (ELISA)
Serum was collected from 25 fresh whole blood samples. And pipettes were used to separate serum after centrifugation for 20 mins at 5000× g, then stored at – 80°C for later usage. Serum GFAP levels were assessed using the commercially available GFAP ELISA kit (F0825-A, Fankew, Shanghai FANKEL Industrial Co., Ltd) following the manufacturer’s instructions.
Drug prediction analysis
All potential therapeutic drugs interacting with biomarkers were obtained from disease signature database (DSigDB, https://dsigdb.tanlab.org/DSigDBv1.0/).52 Then, a drug-biomarker interaction network was constructed and displayed with Cytoscape. Thereafter, the three-dimensional (3D) or two-dimensional (2D) structure of drugs was downloaded from PubChem (https://pubchem.ncbi.nlm.nih.gov/) (Table 2), as well as the homologous structure of biomarkers were downloaded from RCSB Protein Data Bank (PDB, https://www.rcsb.org/pdb)53 and the corresponding PDB ID (Table 3). After removing water molecule, hydrogenate, adding charges, setting the grid parameters, and determining the central grid frame, the initial drug-biomarker combination test was conducted. Docking center parameters were determined with respect to the binding site of the protein receptor and the original ligand. The AutoDock Vina (v 1.2.0, https://autodock.scripps.edu/)54 software was employed for semi-flexible molecular docking. The affinity (kcal/mol) between all biomarkers and potential drugs was calculated. A lower affinity value indicates a more stable interaction between the biomarker and the drug. Finally, all drugs that have the potential to modify AD by increasing biomarkers expression can be screened based on the affinity values, arranged from high to low. Then the most potential drug (valproic acid) was selected for global molecular docking to screen the optimal binding site. The binding process was visualized using 3D images to further ascertain the binding method and interaction mode between valproic acid and biomarkers. Visualization of docking results were employed by PyMol software (v 2.5, https://pymol.org/2/). The docking results were sorted and the docking score ≤–5 kcal/mol was considered to have good binding affinity for compound-target pairs.55
Table 2
Potential drugs and molecules
| Term | PubChem CID | p | Adjusted p | Combined score | Genes | Structure |
| Valproic acid | 3121 | 2.98E-02 | 2.03E-01 | 164219.01 | RPS27 MECOM NDUFA1 RPL26 |  |
| Hydralazine | 3637 | 2.26E-04 | 1.33E-02 | 626.29 | RPS27 NDUFA1 RPL26 |  |
| Metformin hydrochloride | 14219 | 9.96E-03 | 2.03E-01 | 625.39 | NDUFA1 |  |
| Hydroxyurea | 3657 | 1.91E-02 | 2.03E-01 | 276.51 | MECOM |  |
| Chlorpyrifos oxon | 21804 | 2.12E-02 | 2.03E-01 | 240.95 | NDUFA1 |  |
| Solanine | 262500 | 2.52E-02 | 2.03E-01 | 193.57 | MECOM |  |
| 1-Methyl-3-nitro-1-nitrosoguanidine | 135436526 | 2.61E-02 | 2.03E-01 | 184.20 | MECOM |  |
| Temozolomide | 5394 | 4.02E-02 | 2.03E-01 | 104.46 | MECOM |  |
| 8-azaguanine | 135403646 | 4.08E-02 | 2.03E-01 | 102.47 | MECOM |  |
| Vinblastine | 13342 | 4.46E-02 | 2.03E-01 | 90.66 | NDUFA1 |  |
Statistical analysis
Descriptive statistics were utilized to summarize the baseline information of the cohorts in this study. Continuous variable (age) was presented as the mean±standard deviation (SD), and compared using the t-test. Categorical variable (gender) was presented as frequencies and percentages in the population, and compared using Chi-Square test or Fisher’s exact test. Pearson’s and Spearman’s correlations were employed to examine relationships between variables. All analyses were conducted using R software (v 4.3.1) and GraphPad Prism (v 10.1.0) software. Statistical comparisons were carried out with Wilcoxon rank-sum test, Chi-Square test, Fisher exact test, t-test, and one-way ANOVA. Statistical significance was defined as p < 0.05. Details for each analysis can be found in the figure legends.
RESULTS
Identification of AD key genes
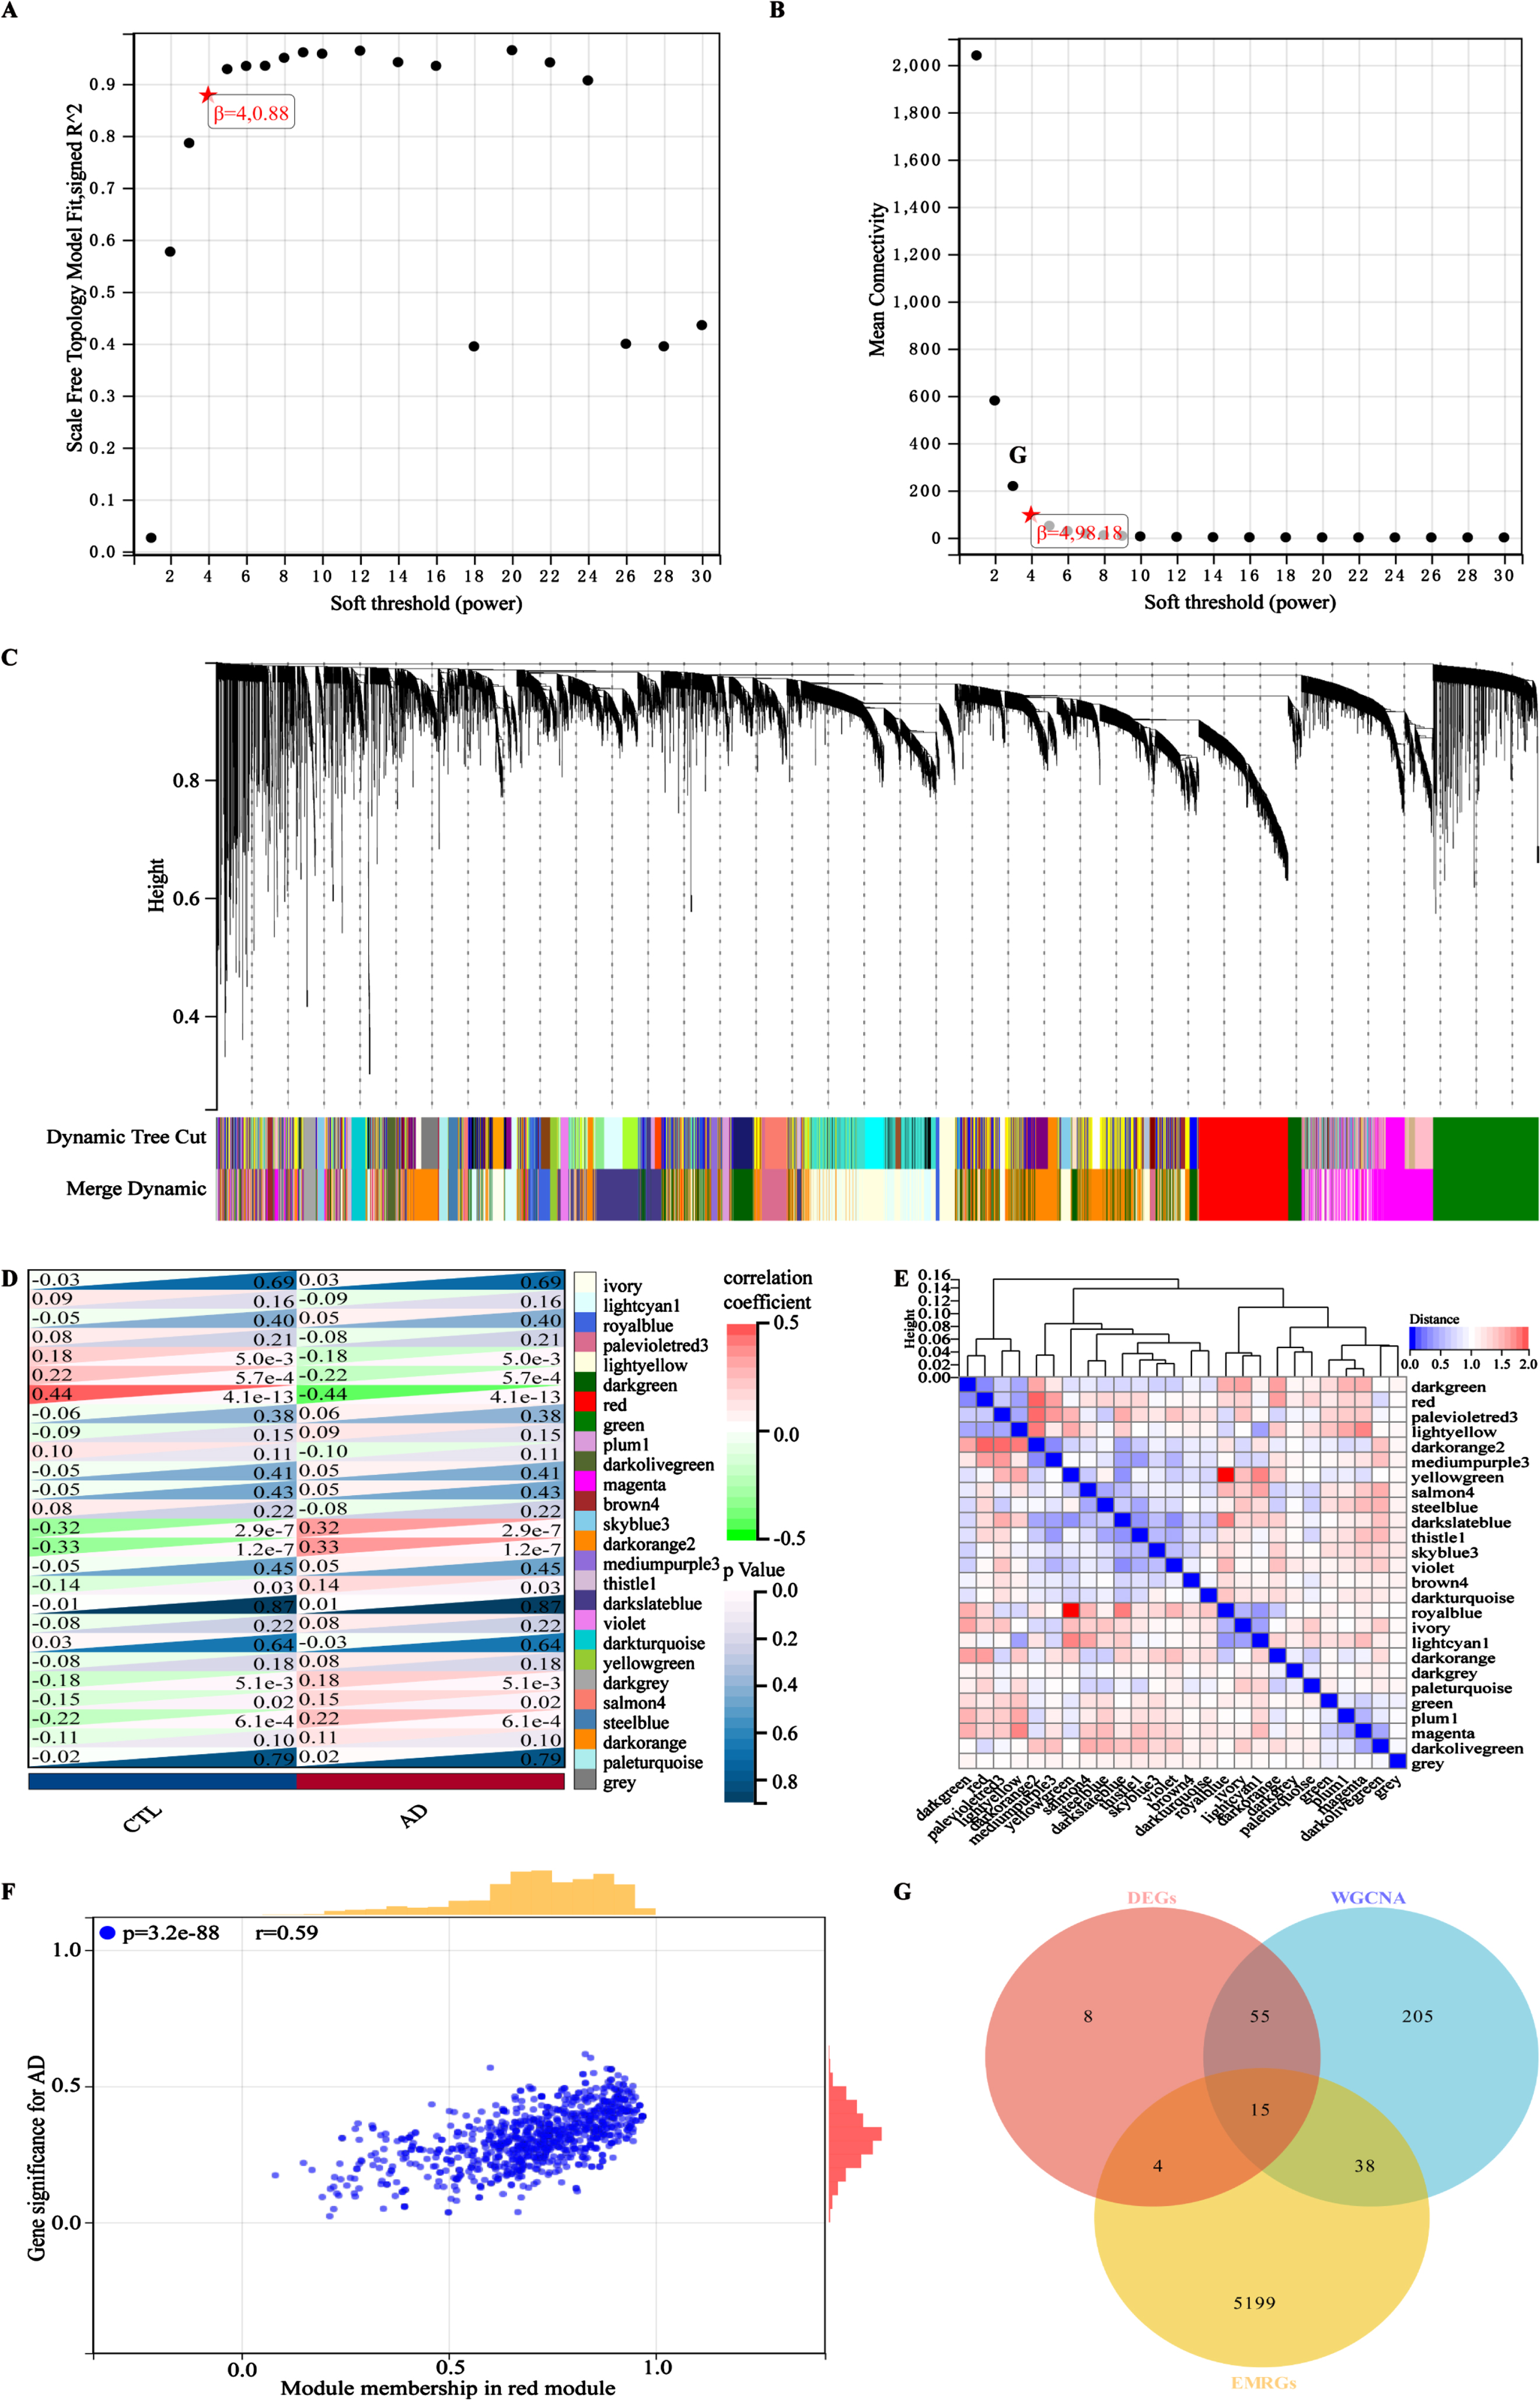
The design and analysis of this study are systematically displayed in the flowchart (Fig. 1). To identify AD key genes, a total of 82 DEGs were identified between AD and control samples in the training cohort GSE63060, containing 2 upregulated and 80 downregulated genes (Fig. 2A, B). Meanwhile, a total of 5,256 EMRGs were selected with a score threshold >1044 from the GeneCards database. Furthermore, to identify AD-related gene modules, we used WGCNA algorithm to construct gene-trait co-expression modules. After determining the fitting index and the average connectivity of the soft threshold (Fig. 3A, B), 26 co-expression modules were constructed and displayed in different colors (Fig. 3C). Heatmaps were used to display the module connections between genes and phenotypes (Fig. 3D), as well as gene clustering modules and their correlations (Fig. 3E). The heatmap results showed the red module was significantly correlated with the AD-phenotype (coefficient = –0.44, p = 4.1e-13) among all modules (Fig. 3D). These results were further validated in the scatter plot, where the red module with 313 genes was indeed significantly correlated with the AD-phenotype (r = 0.59, p = 3.2e-88) (Fig. 3F). Then, we identified 15 key genes through overlapping DEGs, EMRGs and red-module genes from WGCNA (Fig. 3G). The chromosomal location of a gene can provide information about its evolutionary history, including gene duplication patterns and gene duplication events.56 Herein, we used the circos plot to perform chromosomal localization analysis on key genes involved in energy metabolism, aiming to provide new insights into the evolution of these genes. The results showed that the 15 key genes were relatively stable distributed on 13 chromosomes to maintain energy metabolism homeostasis (Supplementary Figure 1).
Fig. 1
Overview of the study design and framework analysis.
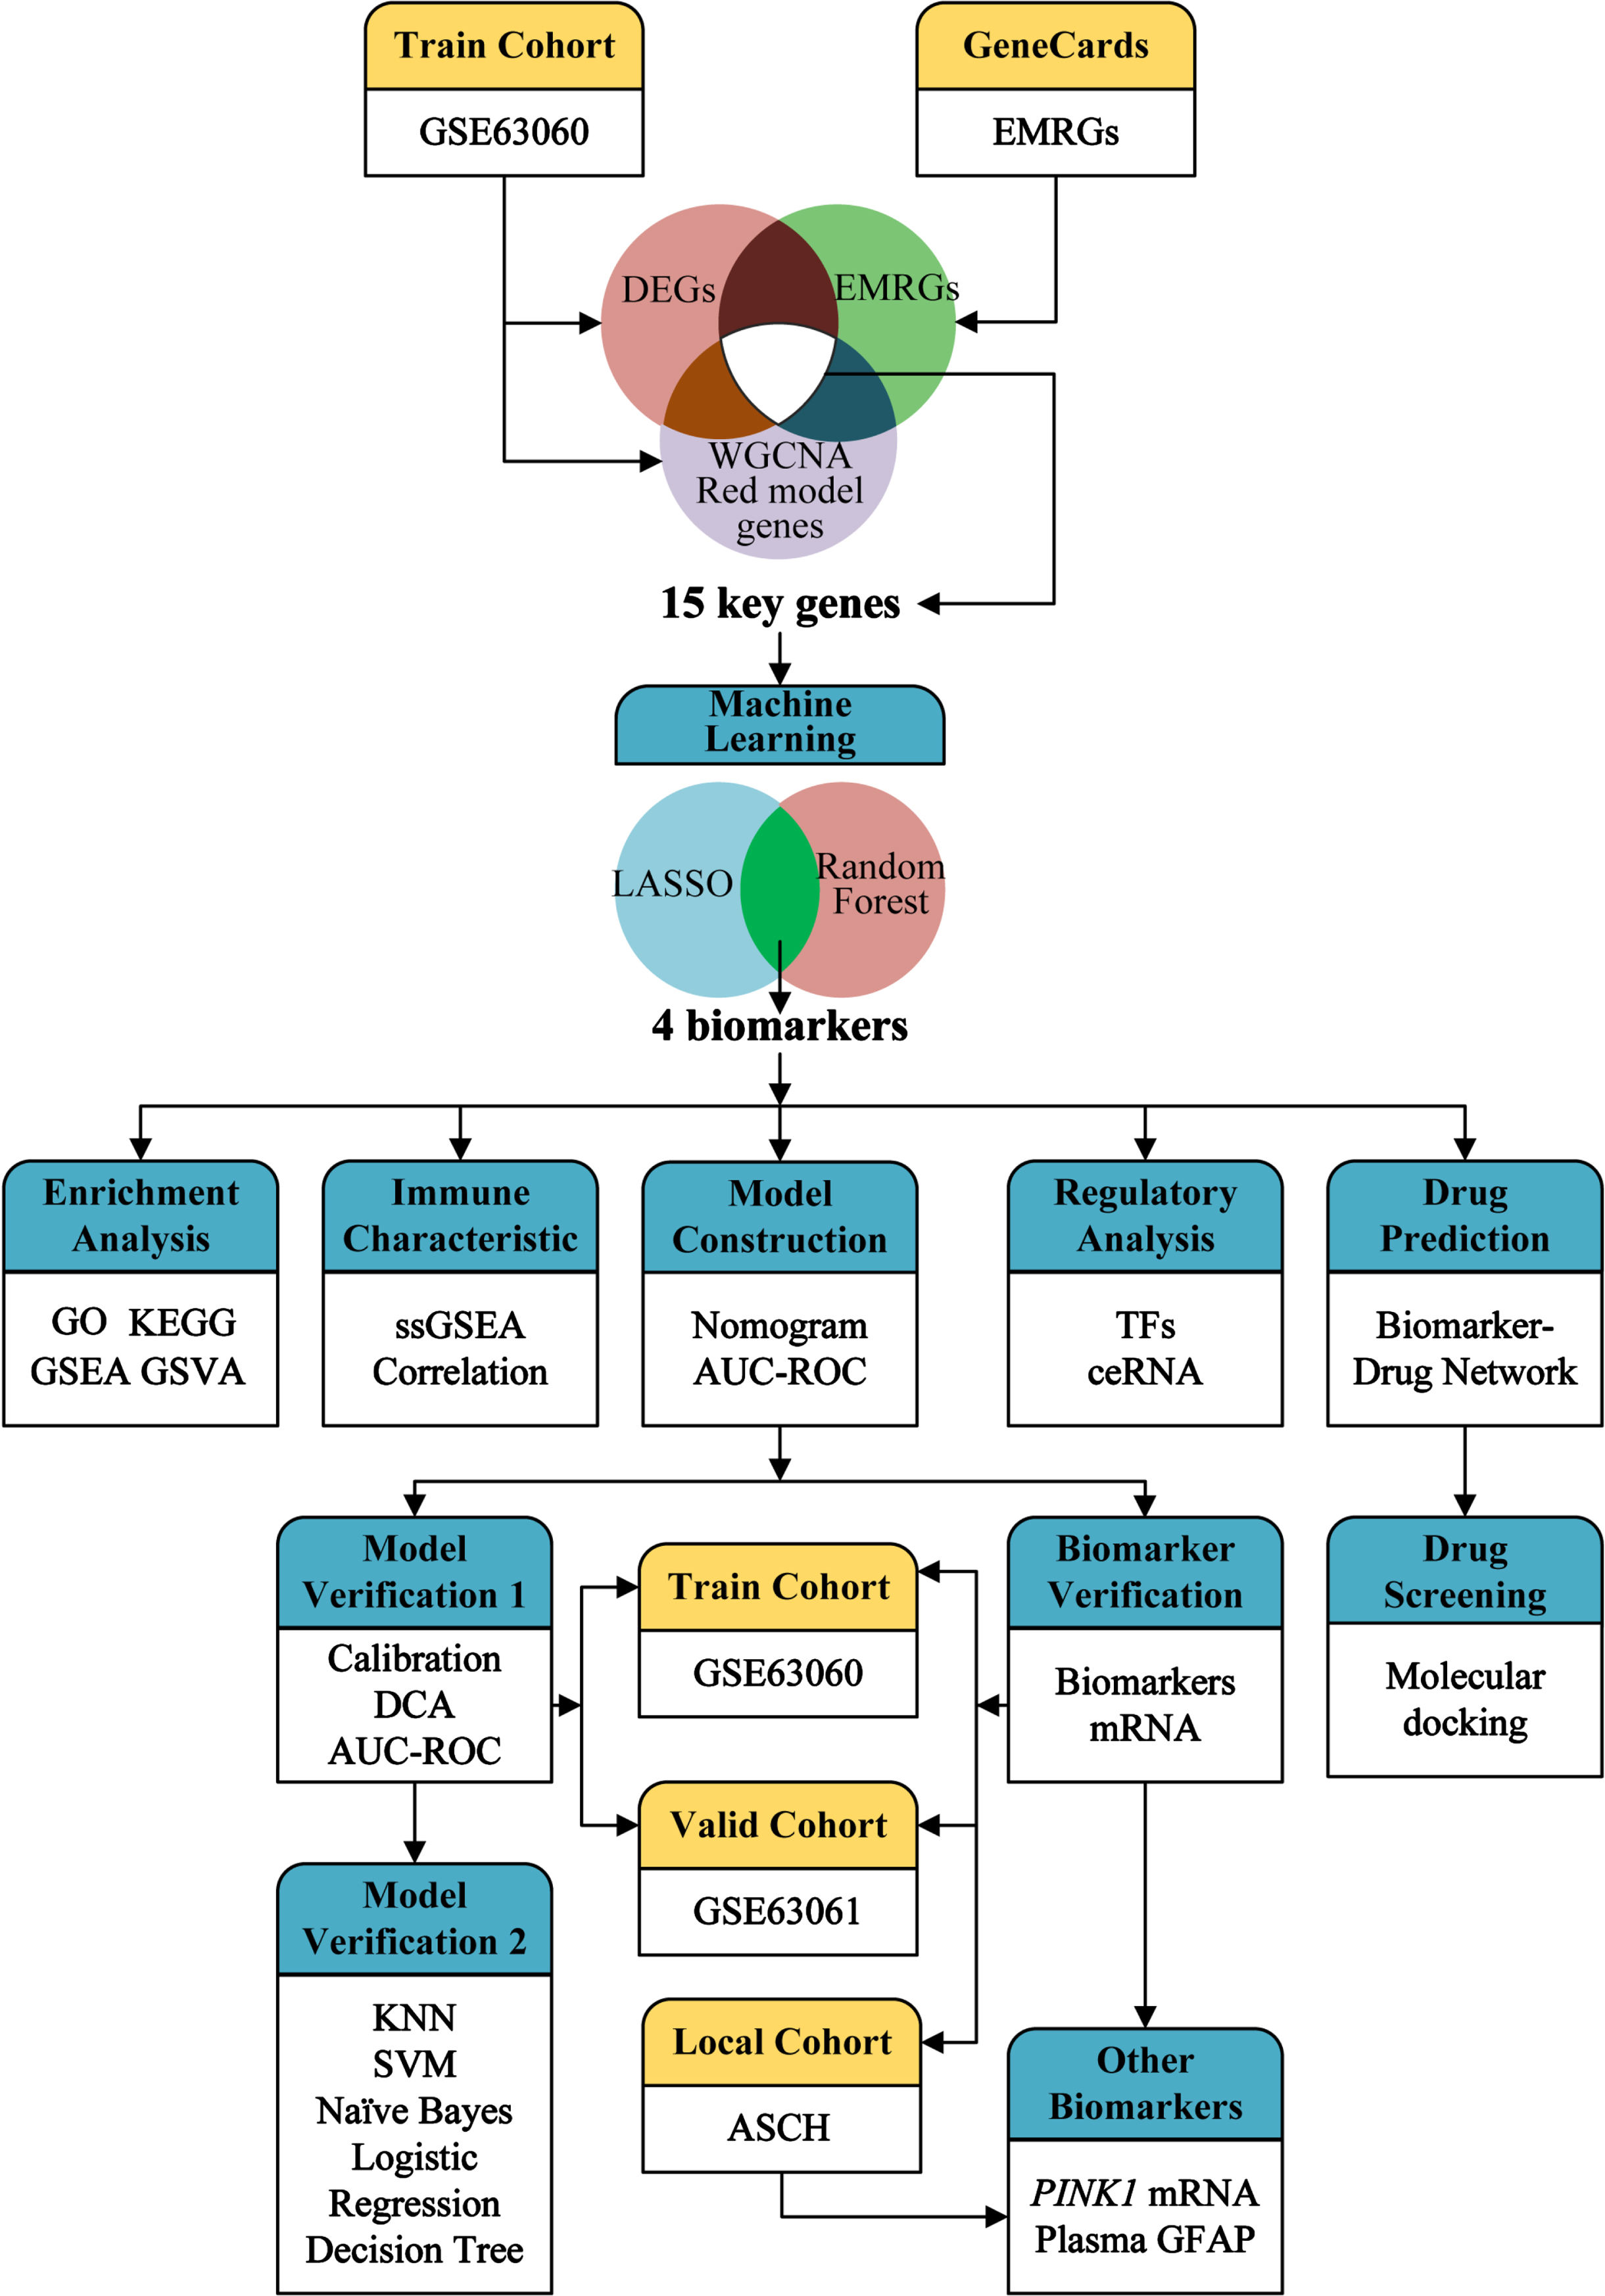
Fig. 2
Identification of DEGs between AD and control samples. A) Volcanic map of DEGs determined in the training cohort GSE63060. B) Heatmap of DEGs in the training cohort GSE63060. Red for upregulation, blue for downregulation.
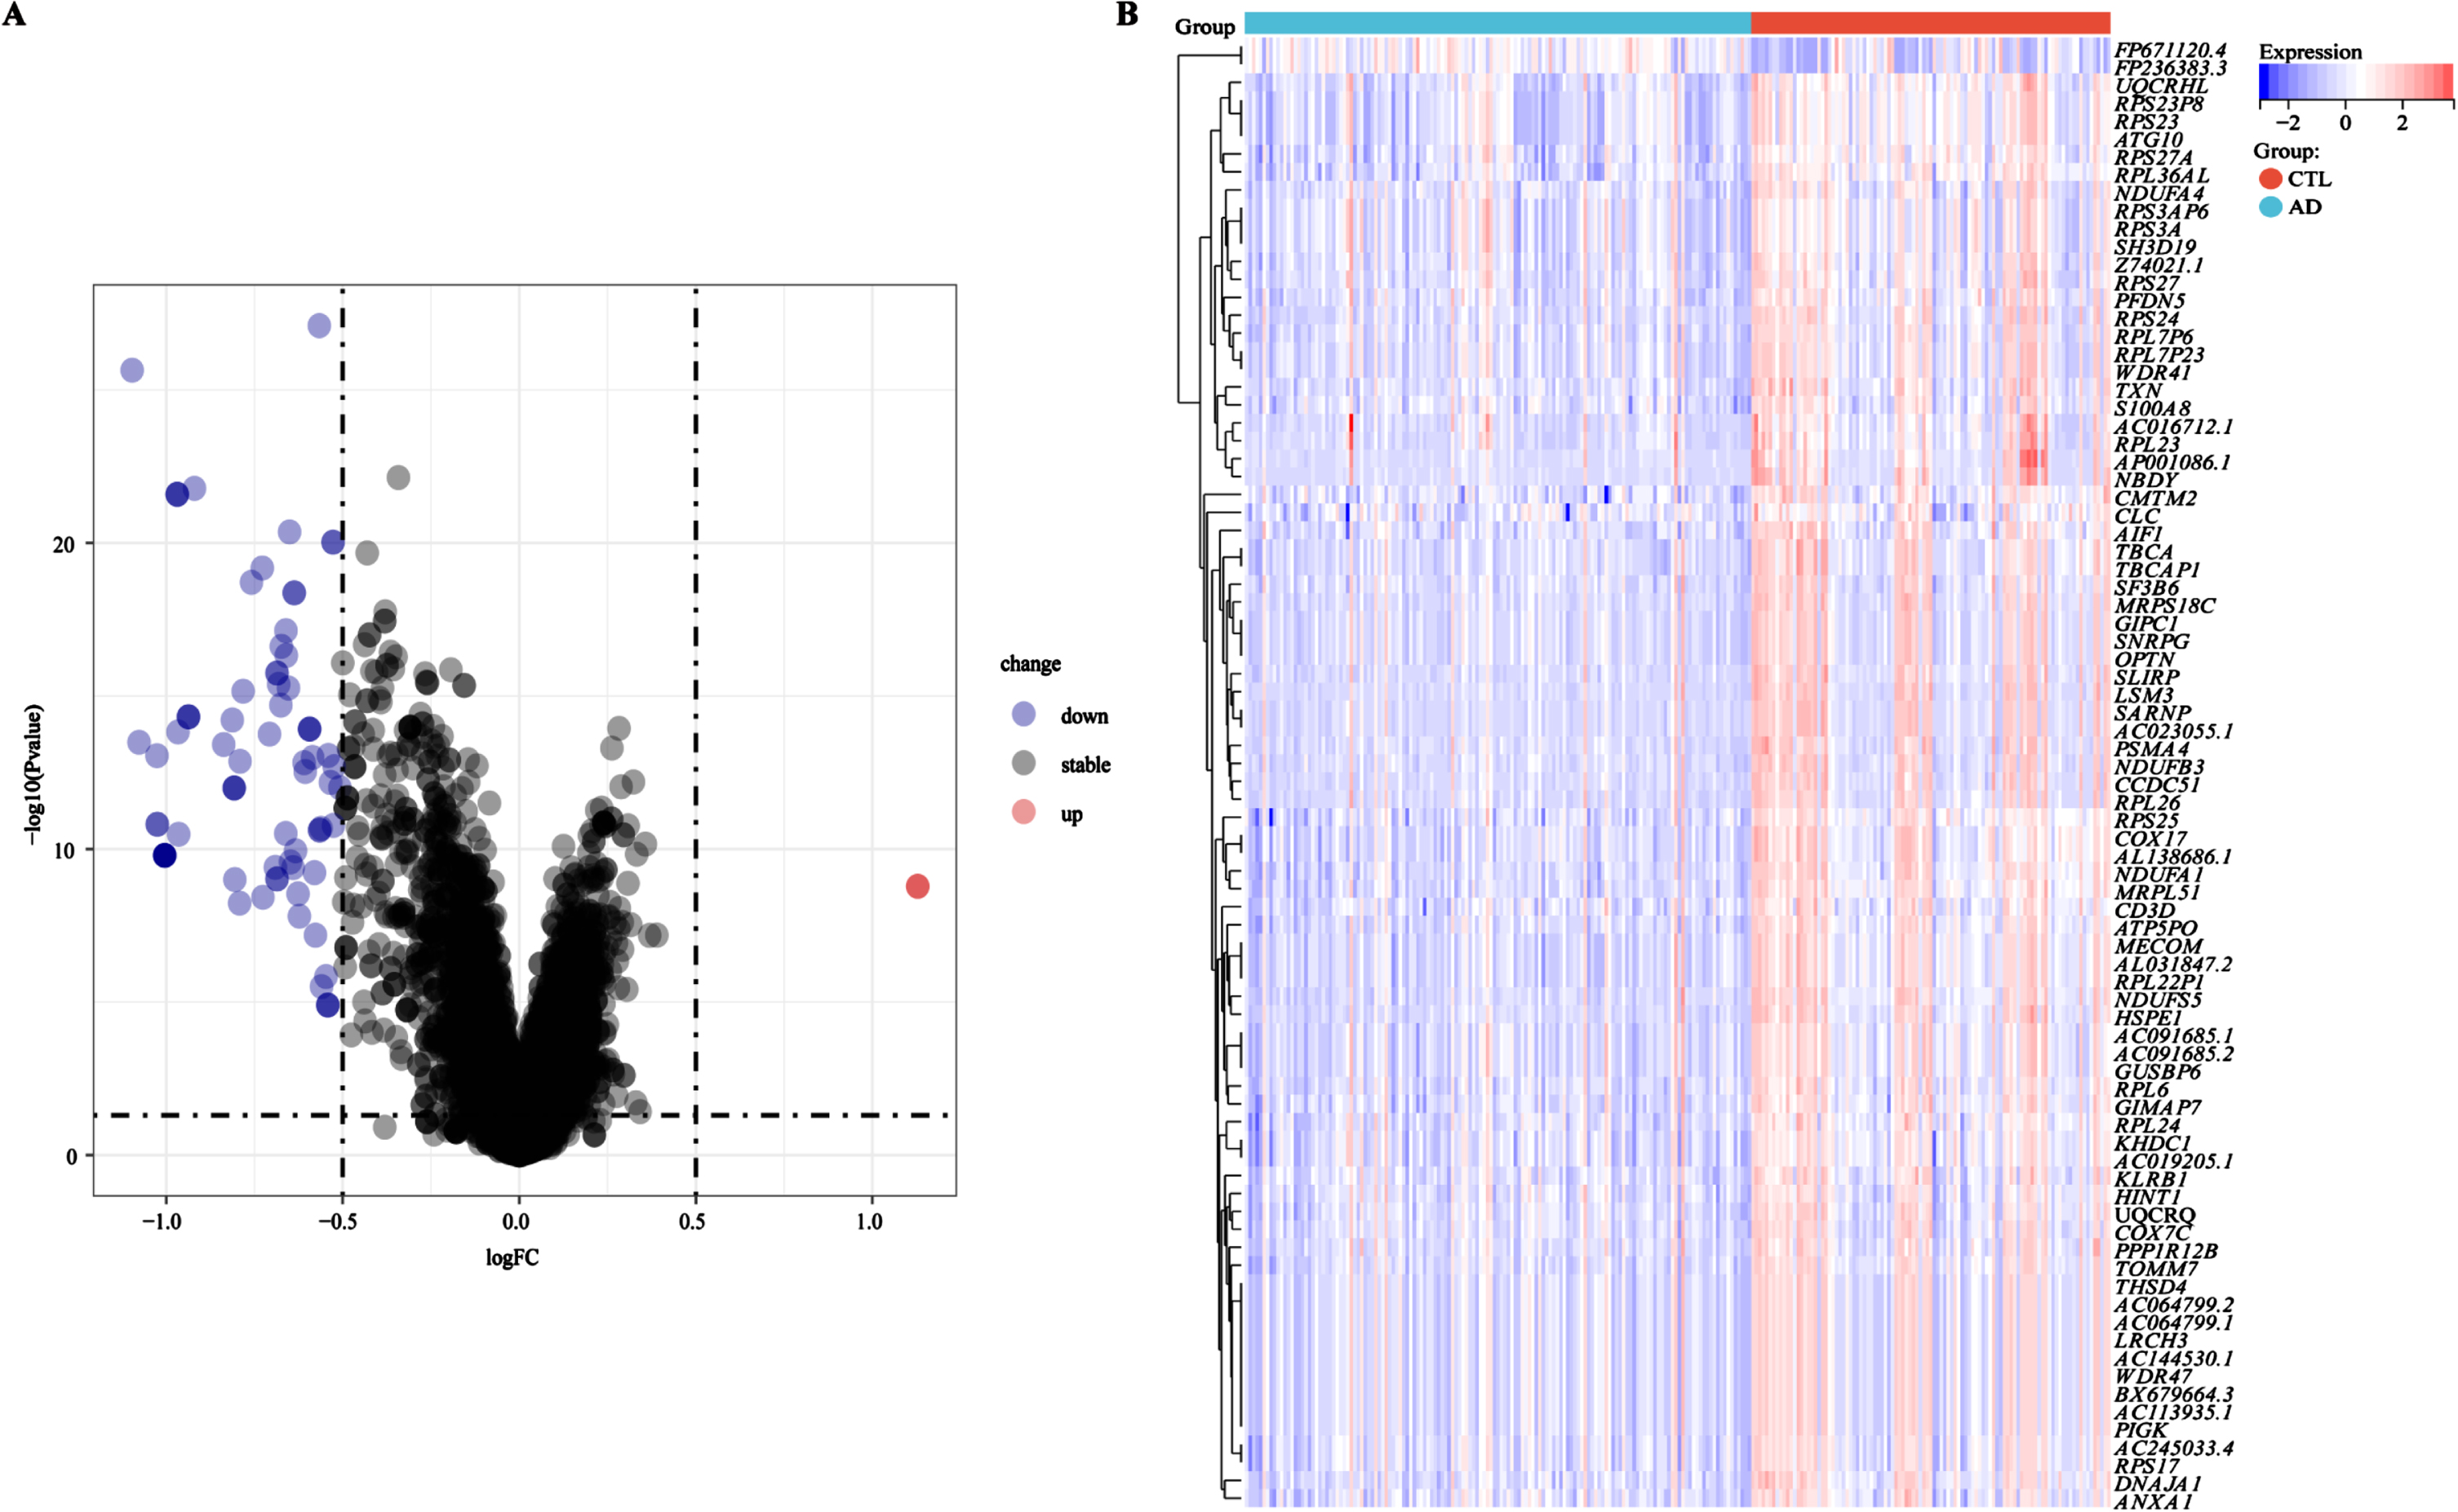
Fig. 3
Identifying and screening key genes using the WGCNA algorithm. A) The scale-free fitting index of the soft threshold in the weighted gene co-expression network. B) The mean connectivity of soft threshold power in the weighted gene co-expression network. C) Tree diagram of gene-model clustering with all samples in the training cohort GSE63060. D) Correlation heatmap between different modules in the control and AD. Red: positive correlation; light green: negative correlation. E) Clustered heatmap of different color modules. Red: further distance; blue: nearer distance. F) Scatter plot of characteristic genes in the red module. G) Identification of key genes in a Venn diagram, overlapping with DEGs, EMRGs, and genes in red model. Correlations were carried out with Spearman’s correlation method.
Screening of AD biomarkers using machine learning algorithms
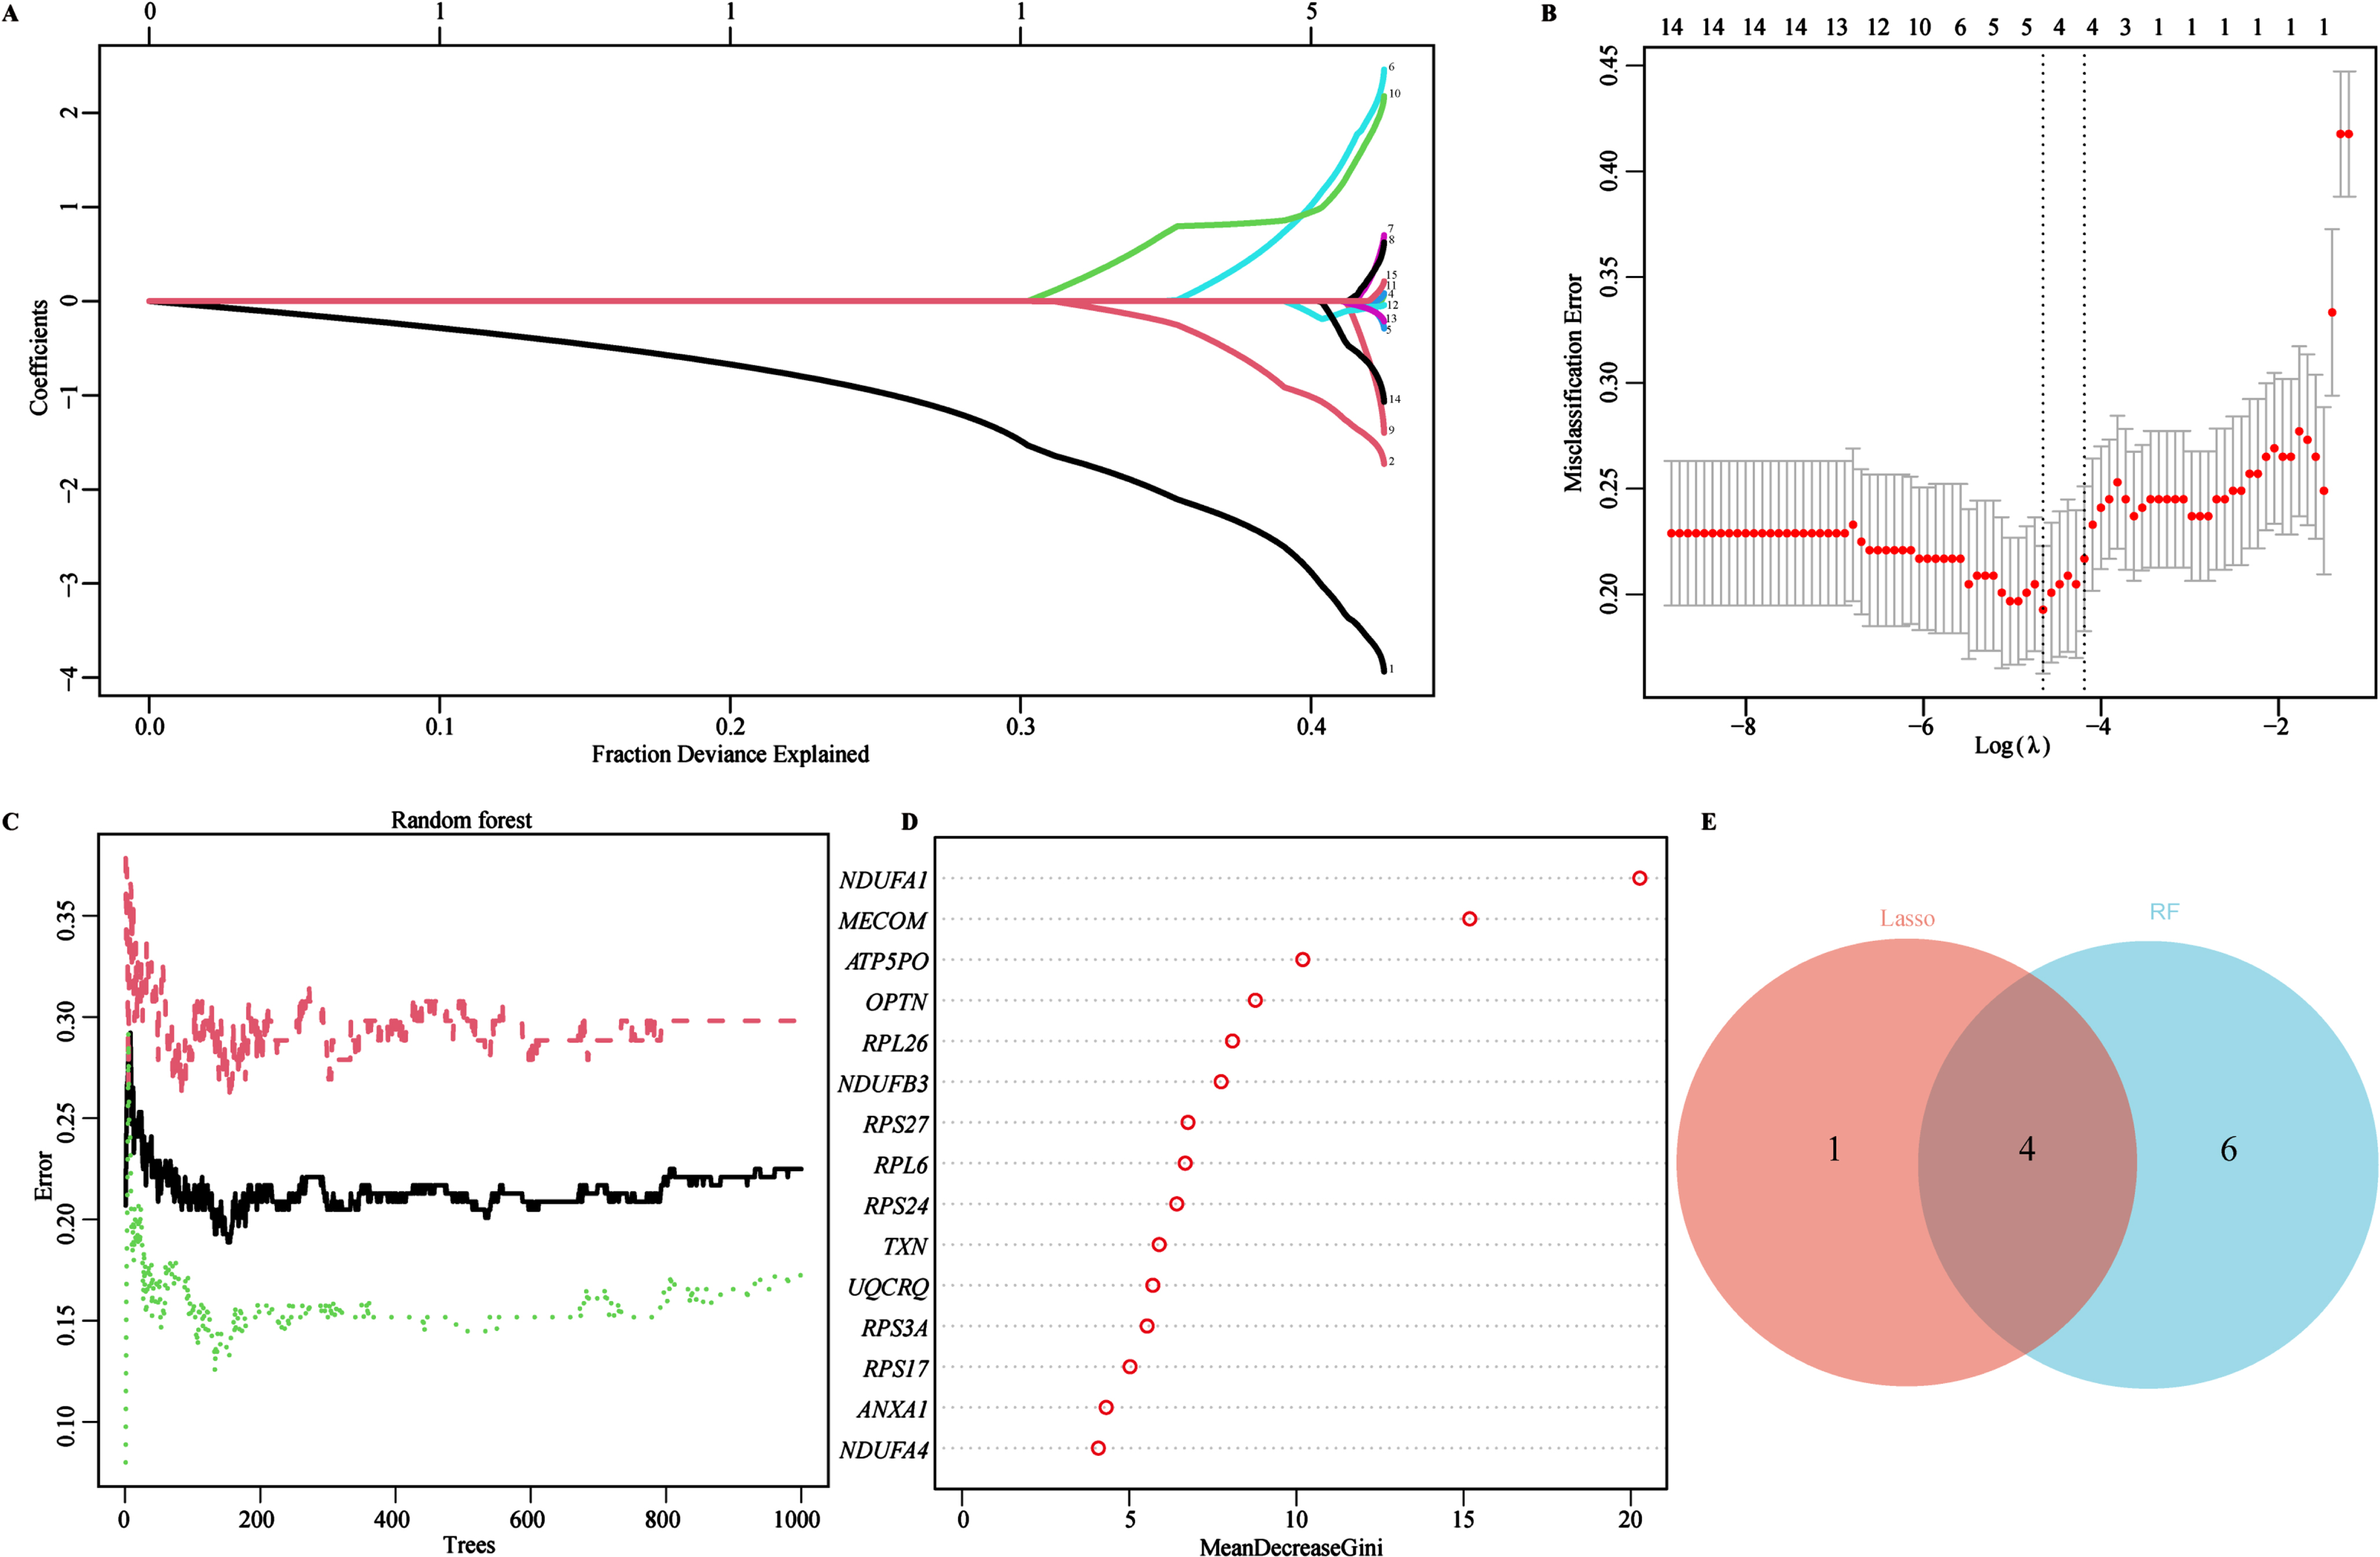
To identify characteristic biomarkers in 15 key genes mentioned above, we utilized two different machine learning algorithms to conduct feature screening in the training cohort (GSE63060). Firstly, we employed the LASSO regression algorithm to identify 5 potential biomarkers from the 15 key genes (Fig. 4A). Subsequently, 10-fold cross-validation logistic regression was further used to validate the objectivity and reliability of the biomarkers screened by the LASSO regression (Fig. 4B). Secondly, the RF algorithm was used to assess the importance and predictive performance of the top 10 key genes (Fig. 4C). The 15 key genes were ranked with the MeanDecreaseGini coefficients, and the top 10 out of the 15 key genes were eventually retained and extracted as another set of potential biomarkers (Fig. 4C, D). Finally, we identified 4 overlapped genes through Venn diagram analysis, NADH: ubiquinone oxidoreductase subunit A1(NDUFA1), MDS1 and EVI1 complex locus (MECOM), ribosomal protein L26 (RPL26), and ribosomal protein S27 (RPS27), which might be served as characteristic biomarkers for AD screening and therapeutic targets (Fig. 4E). In addition, a circus plot was also used to visualize the location of these characteristic biomarkers on the chromosomes, distribution on chromosome 1 (RPS27), 3 (MECOM), 17 (RPL26), and X (NDUFA1) (Supplementary Figure 2).
Fig. 4
Identifying AD Biomarkers using LASSO and RF. A) Screening for potential biomarkers using the LASSO regression algorithm. The 5 potential biomarkers were identified within the regression coefficient path map. B) The 10-cross validation curve of the LASSO logistic regression algorithm. All 5 potential biomarkers were validated as the lowest point of the regression curve. C) The error trees shown by the random survival forests algorithm for selecting the top 10 potential biomarkers in AD. D) The RF algorithm presenting the MeanDecreaseGini of the 15 key genes in AD. E) Venn diagram showing the diagnostic biomarkers intersected by LASSO and RF.
Exploring pathway enrichment of AD biomarkers related to energy metabolism function
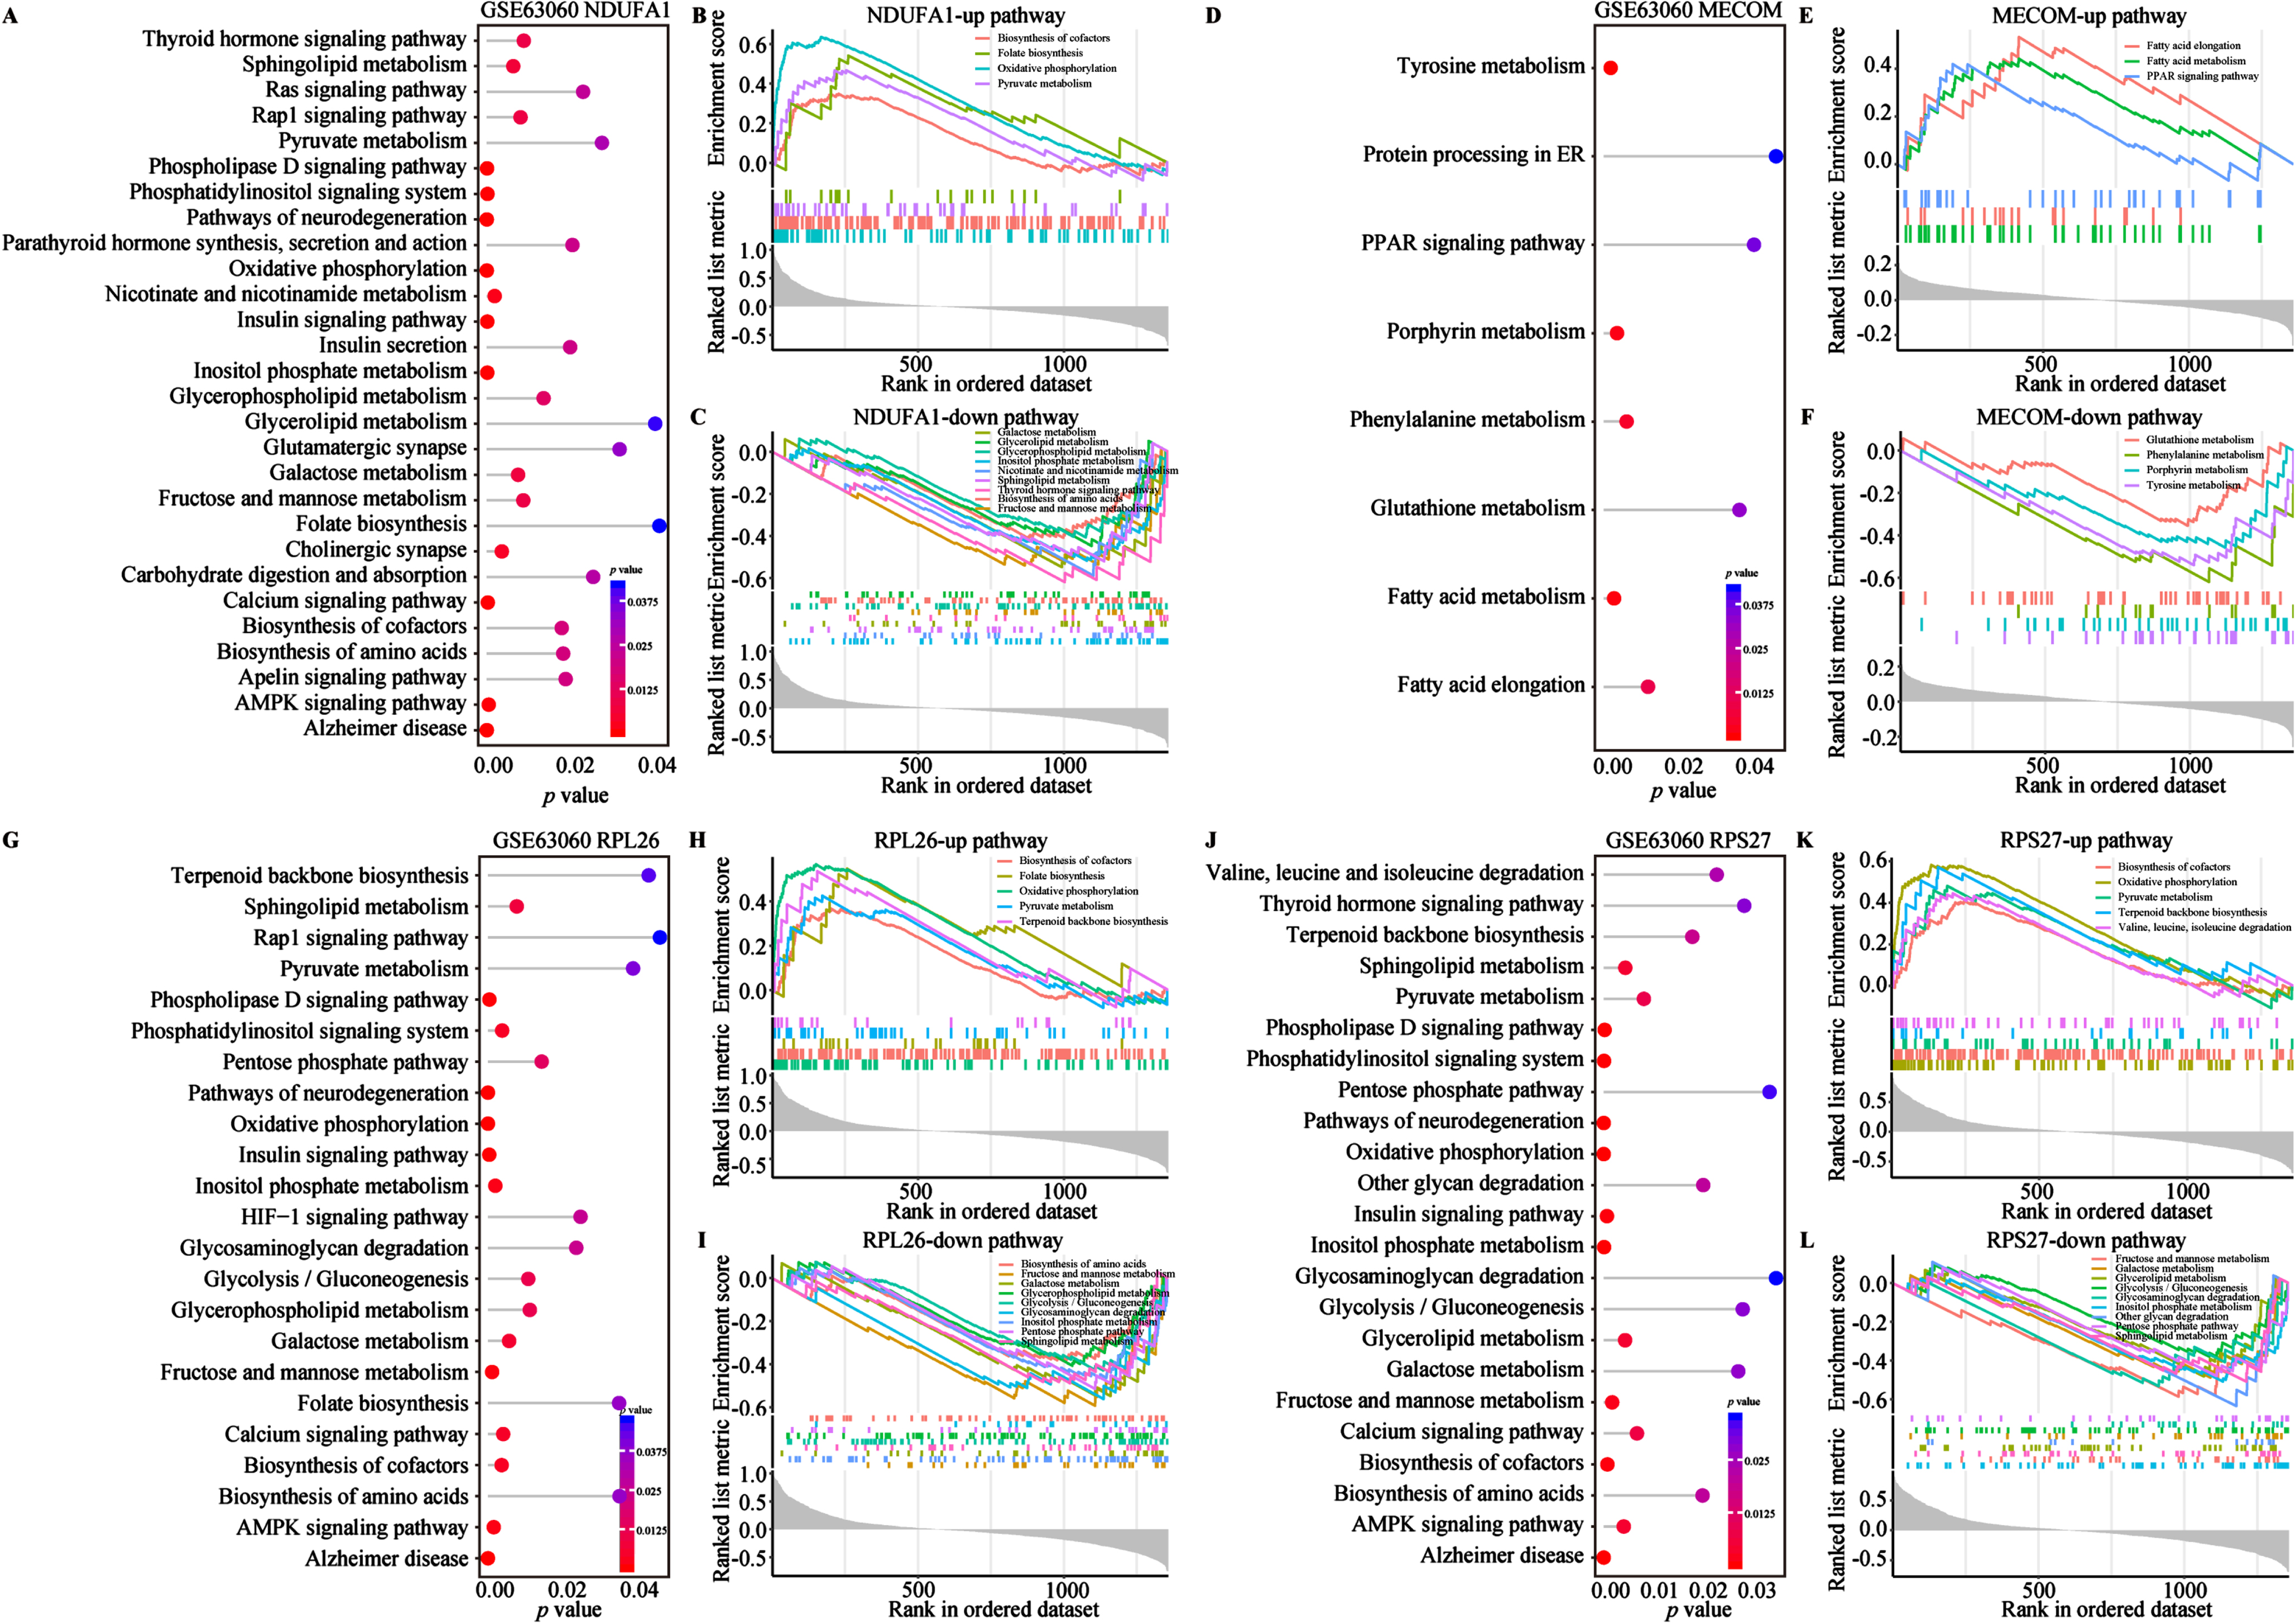
To investigate the biological functions and potential association with energy metabolism of the aforementioned biomarkers, we conducted GO and KEGG enrichment analysis (Fig. 5A-E). On the GO aspect, the Sankey bubble plot was used to present the GO enrichment results of individual biomarker separately (Fig. 5A). Subsequently, the enrichment of 4 biomarkers was presented in detail (Fig. 5B-D). The enrichment of biological processes (BP) of the 4 biomarkers mainly occurs in ribonucleoprotein complex biogenesis, ribosome biogenesis, ribosomal RNA (rRNA) metabolic process, non-coding RNA (ncRNA) processing, rRNA processing and cytoplasmic transcription (Fig. 5B). Cellular components (CC) are mainly distributed in different ribosomes and subunits, oxidoreductase complexes, mitochondrial respiratory bodies and respiratory chain complexes (Fig. 5C). Regarding molecular function (MF), the 4 biomarkers are centered on structural constituent of ribosome, primary active transmembrane transport activity, electron transfer activity, s-adenosylmethionine methyltransferase activity, oxidoreductase activity acting on NAD(P)H (Fig. 5D). KEGG analysis emphasized the close association of the 4 biomarkers with AD and other neurodegenerative diseases, oxidative phosphorylation, and ribosomal pathways (Fig. 5E). Several studies have shown that NDUFA1, MECOM, and ribosomal gene/protein homologs (e.g., RPL26 and RPS27) regulated multiple metabolic pathways in AD and other diseases (Supplementary Table 2).57–63 Therefore, to further explore their relationship with metabolic pathways, we conducted functional enrichment analysis of the 4 AD biomarkers in metabolism and energy metabolism-related pathways using the single-gene GSVA algorithm on the GSE63060 dataset (Fig. 6). The results from the single gene enrichment analysis revealed that NDUFA1 was significantly enriched in 28 pathways, with 4 upregulated and 9 downregulated pathways (Fig. 6A-C). MECOM showed significant enrichment in 8 pathways, with 3 upregulated and 4 downregulated (Fig. 6D-F). RPL26 was associated with 23 pathways, while RPS27 in 23 pathways, with each owning 5 upregulated and 9 downregulated pathways (Fig. 6G-L). Furthermore, fatty acid elongation, fatty acid metabolism, and the PPAR signaling pathway were enriched upregulated in MECOM alone, while downregulating pathways of MECOM included glutathione metabolism, phenylalanine metabolism, porphyrin metabolism and tyrosine metabolism (Fig. 6D-F). Among them, NDUFA1, RPL26, and RPS27 shared 4 upregulated pathways including biosynthesis of cofactor, folate biosynthesis, oxidative phosphorylation, pyruvate metabolism, and terpenoid backbone biosynthesis (Fig. 6B, H, K). RPL26 and RPS27 shared 7 downregulated pathways, which were glycolysis/gluconeogenesis, pentose phosphate pathway, glycosaminoglycan degradation, fructose and mannose metabolism, galactose metabolism, inositol phosphate metabolism, and sphingolipid metabolism (Fig. 6I, L). In addition, NDUFA1 shared the last 4 downregulated pathways as described above (Fig. 6C, I, L). These changes in similar pathways also observed in the validation cohort, although not entirely consistent with the results of the training cohort (Supplementary Figure 3). In conclusion, the results suggested that these 4 biomarkers were involved in multiple energy metabolic pathways in AD.
Fig. 5
Enrichment analysis of biomarkers. A) All GO enrichment of biomarkers. B) GO-BP enrichment analysis of biomarkers. C) GO-CC enrichment analysis of biomarkers. D) GO-MF enrichment analysis of biomarkers. The horizontal axis represents the rich factor; the circle size represents the gene counts in each GO term; the color indicates the p value. E) KEGG enrichment pathways of biomarkers via GSVA analysis. GSVA score was presented as t value in the horizontal axis. GO, gene ontology; KEGG, Kyoto Encyclopedia of Genes and Genomes; BP, biological processes; MF, molecular functions; CC, cellular components; GSVA, gene set variation analysis.
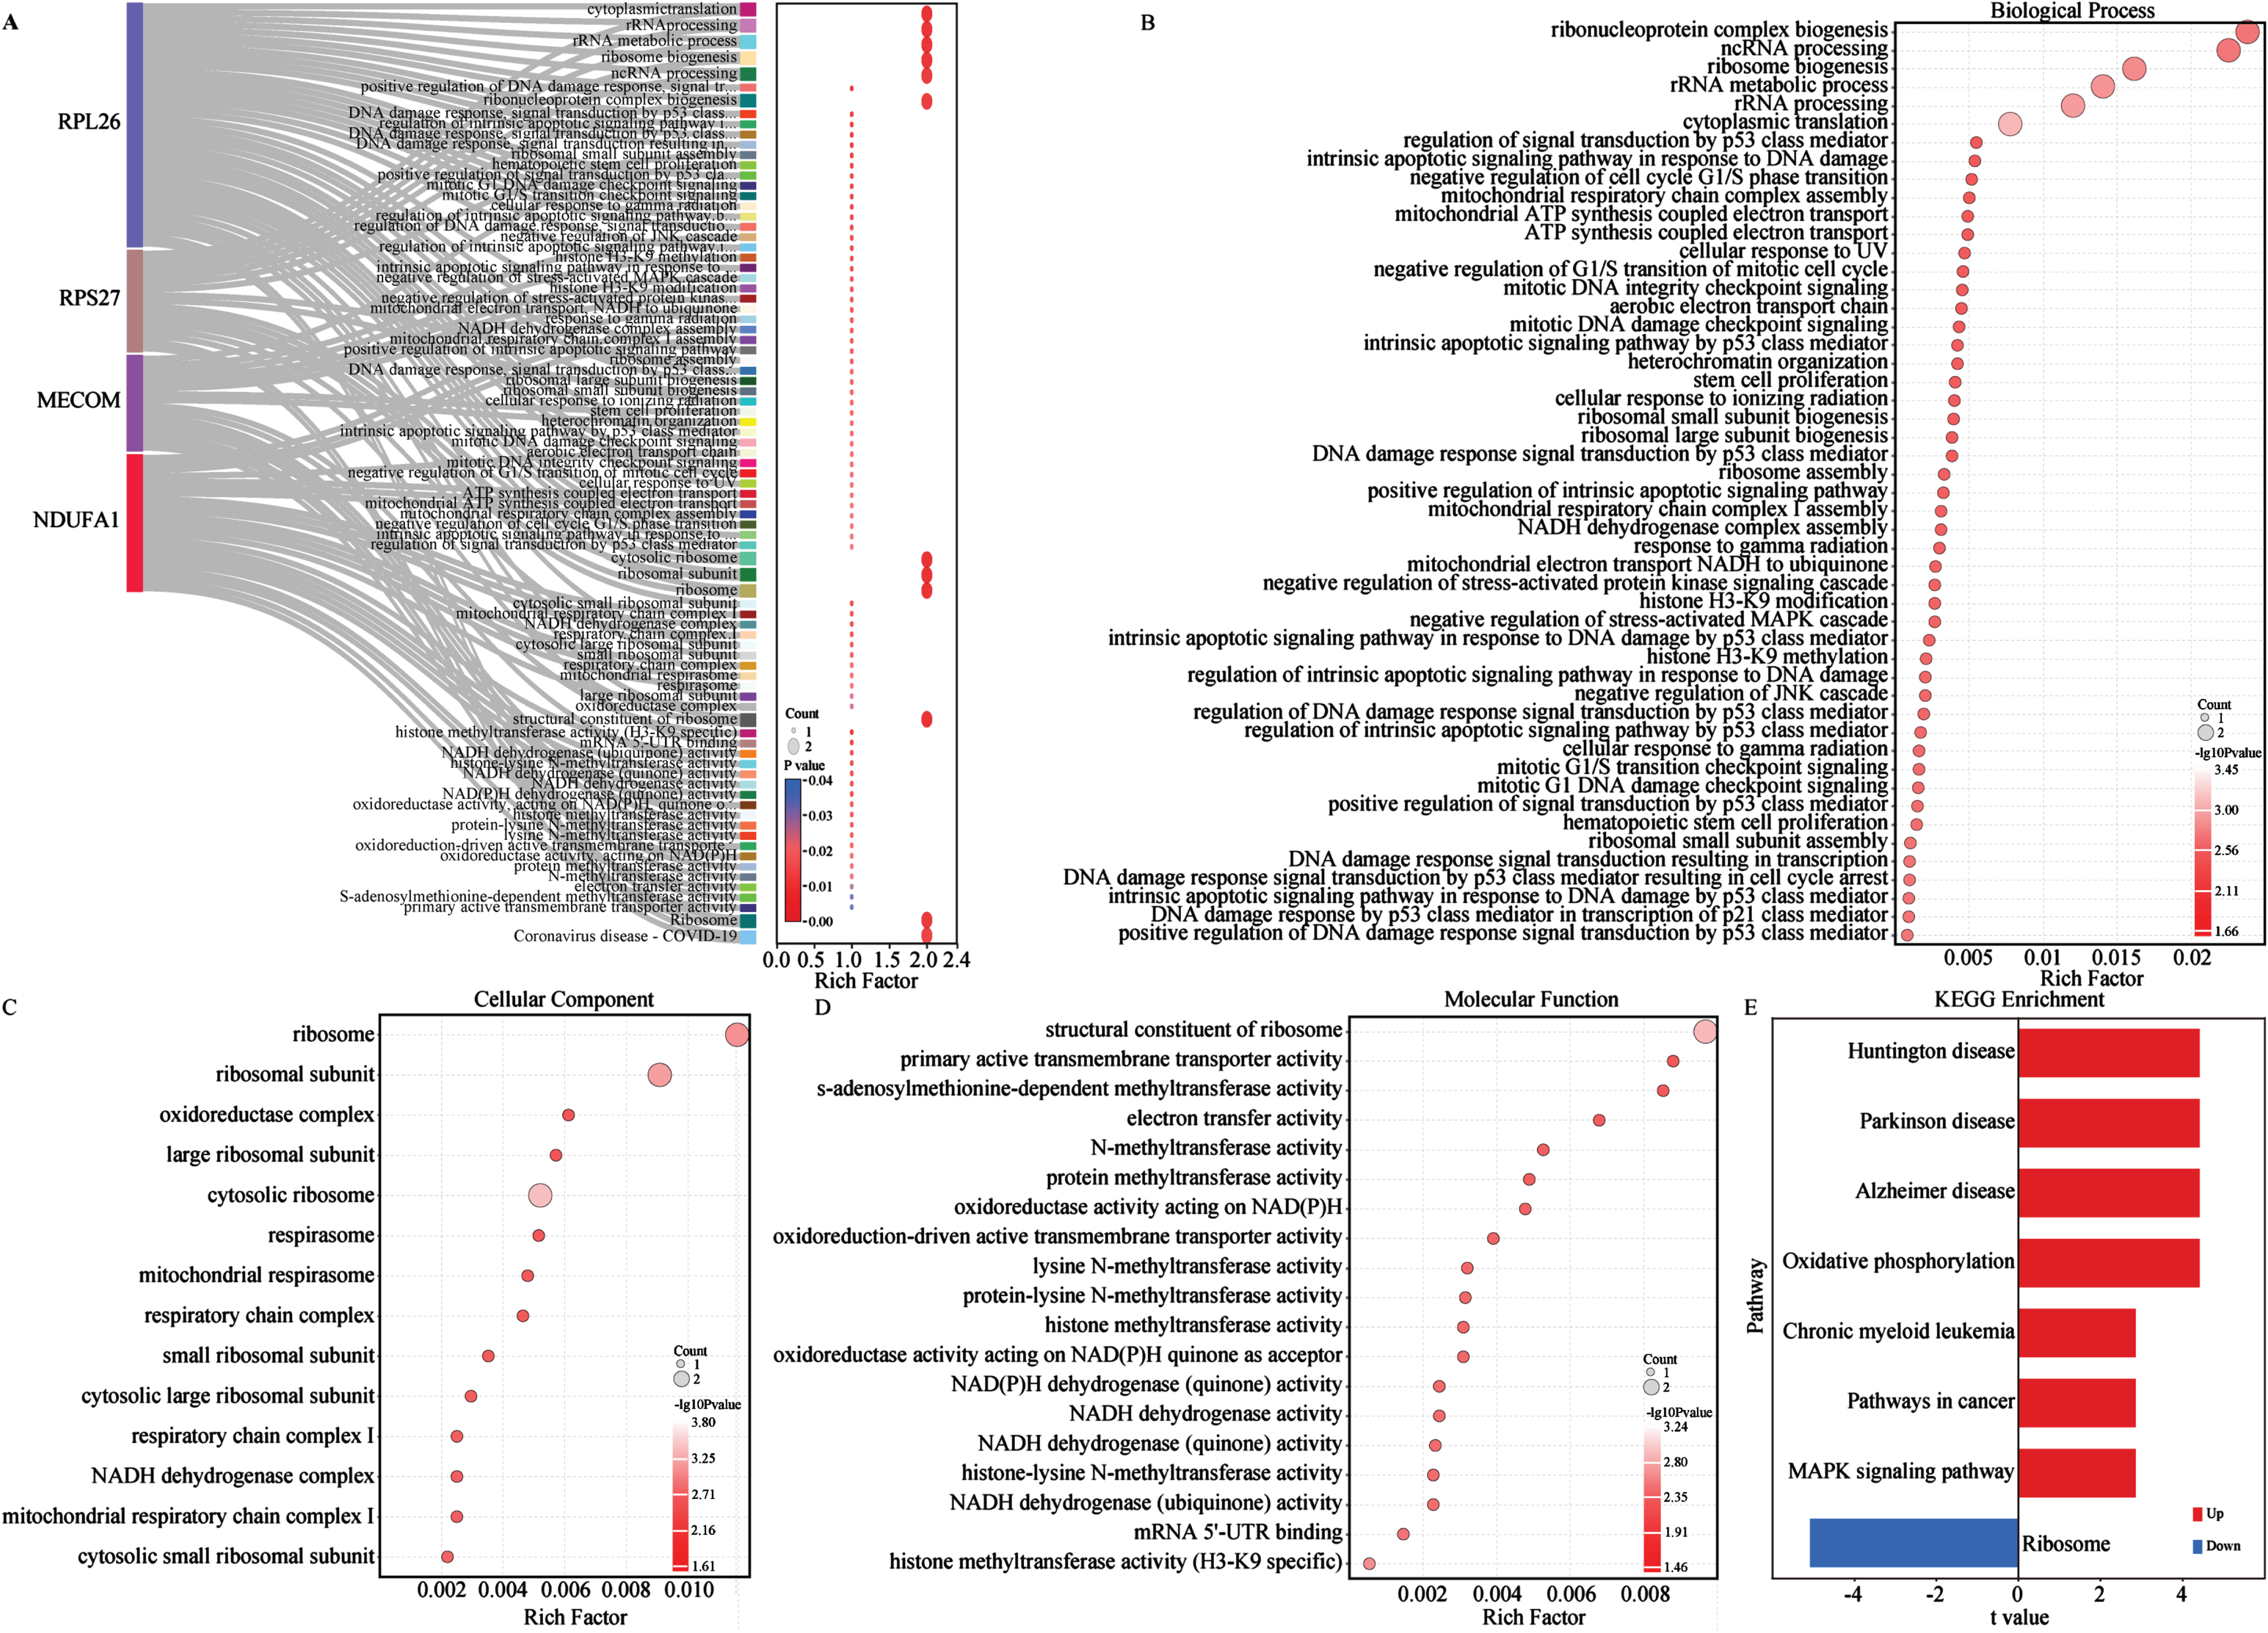
Fig. 6
Metabolism and energy metabolism pathways of 4 biomarkers in the GSE63060 cohort. A-L) Single gene GSVA analysis based on KEGG pathway enrichment of NDUFA1, MECOM, RPL26, and RPS27. Lollipop plots of 4 biomarkers KEGG pathway enrichment results in the left of each panel. The horizontal and the color indicate the p value. GSEA plots in the right of each panel show the metabolism and energy metabolism related pathways with different colors for 4 biomarkers. All presented pathways were significantly enriched. Statistical significance was p < 0.05.
Immune characteristics of AD biomarkers
Previous study has already demonstrated that metabolic dysfunction was also recognized as a cause of neuroinflammation.28 Glial reactivity and CD4/CD8 T cell infiltration were found to be associated with frontotemporal lobar degeneration with tau pathology.64 Therefore, we explored the immune microenvironment changes in AD and the relationship between biomarkers and immune regulation. Initially, the infiltration of immune cells was analyzed by the ssGSEA algorithm, and the scores for 28 different types of immune cells were obtained from both control and AD patients. Immune infiltration analysis demonstrated that a total of 10 types of immune cells (10/28) showed differences between groups. Compared with healthy controls, 6 immune cells (myeloid derived suppressor cell, natural killer T cell, central memory CD8 T cell, macrophage, T follicular helper cell, and regulatory T cell) showed high expression in AD group (p < 0.05), indicating signs of systemic immune activation in AD patients. On the contrary, 4 types of immune cells (activated CD4/CD8 T cell, effector memory CD4 T cell, and activated B cell) showed relatively lower expression in the AD group, indicating that these cells were systematically immune suppressed in AD patients (Supplementary Figure 4A). Additionally, we investigated the association between our aforementioned biomarkers and immune cells. The correlation heatmap showed that 4 biomarkers were significantly positively correlated with 5 types of immune cells (5/28), including activated CD8 T cell, activated CD4 T cell, effector memory CD4 T cell, gamma delta T cell, and activated B cell (Supplementary Figure 4B). In contrast, the 4 energy metabolism biomarkers showed a significantly negative correlation with the other 8 immune cells (8/28), including central memory CD8 T cell, myeloid derived suppressor cell, monocytes, T follicular helper cell, macrophages, regulatory T cell, natural killer T cell, and activated dendritic cell (Supplementary Figure 4B). In short, the expression of 4 energy metabolism biomarkers is significantly correlated with 8 types of T cell immune infiltration.
Identification of TF and ceRNA regulatory network of AD biomarkers
Furthermore, 131 TFs targeting AD biomarkers were extracted from the JASPAR database, analyzed by NetworkAnalyst, and further formed into a network diagram. Among these TFs, insulinoma-associated 2 (INSM2) was associated with all 4 AD biomarkers, while transcription factor Dp-1 (TFDP1) interacting with NDUFA1, RPL26, and RPS27 in the network (Supplementary Figure 5A). Among the AD biomarkers, RPS27 and RPL26 shared 23 TFs, followed closely by RPS27 and NDUFA1 sharing 11 TFs. Additionally, RPS27 was exclusively targeted by the highest numbers of TFs (n = 84), corresponding to RPL26 (n = 49), NDUFA1 (n = 22), and MECOM (n = 19) (Supplementary Figure 5A).
Due to the observation of different RNA types enrichment changes in functional enrichment analysis (Fig. 5), ceRNA network has gained significant attention due to its pivotal role in gene expression regulation in recent years.65 The ceRNA network could be established by utilizing miRNAs as bridges. Thus, we generated a lncRNA-miRNA-mRNA network to identify a potential ceRNA regulation network. The results showed that a total of 50 lncRNAs and 44 miRNAs regulating target biomarkers were identified (Supplementary Figure 5B). Intriguingly, our findings showed that lncRNAs, NEAT1, OIP5-AS1, MALAT1, and XIST, acted as mediators for crosstalk among multiple miRNAs, and revealed that these lncRNAs might play crucial roles in onset of AD by modulating the AD biomarkers expression (Supplementary Figure 5B).
Validation of AD biomarkers expression in European cohorts
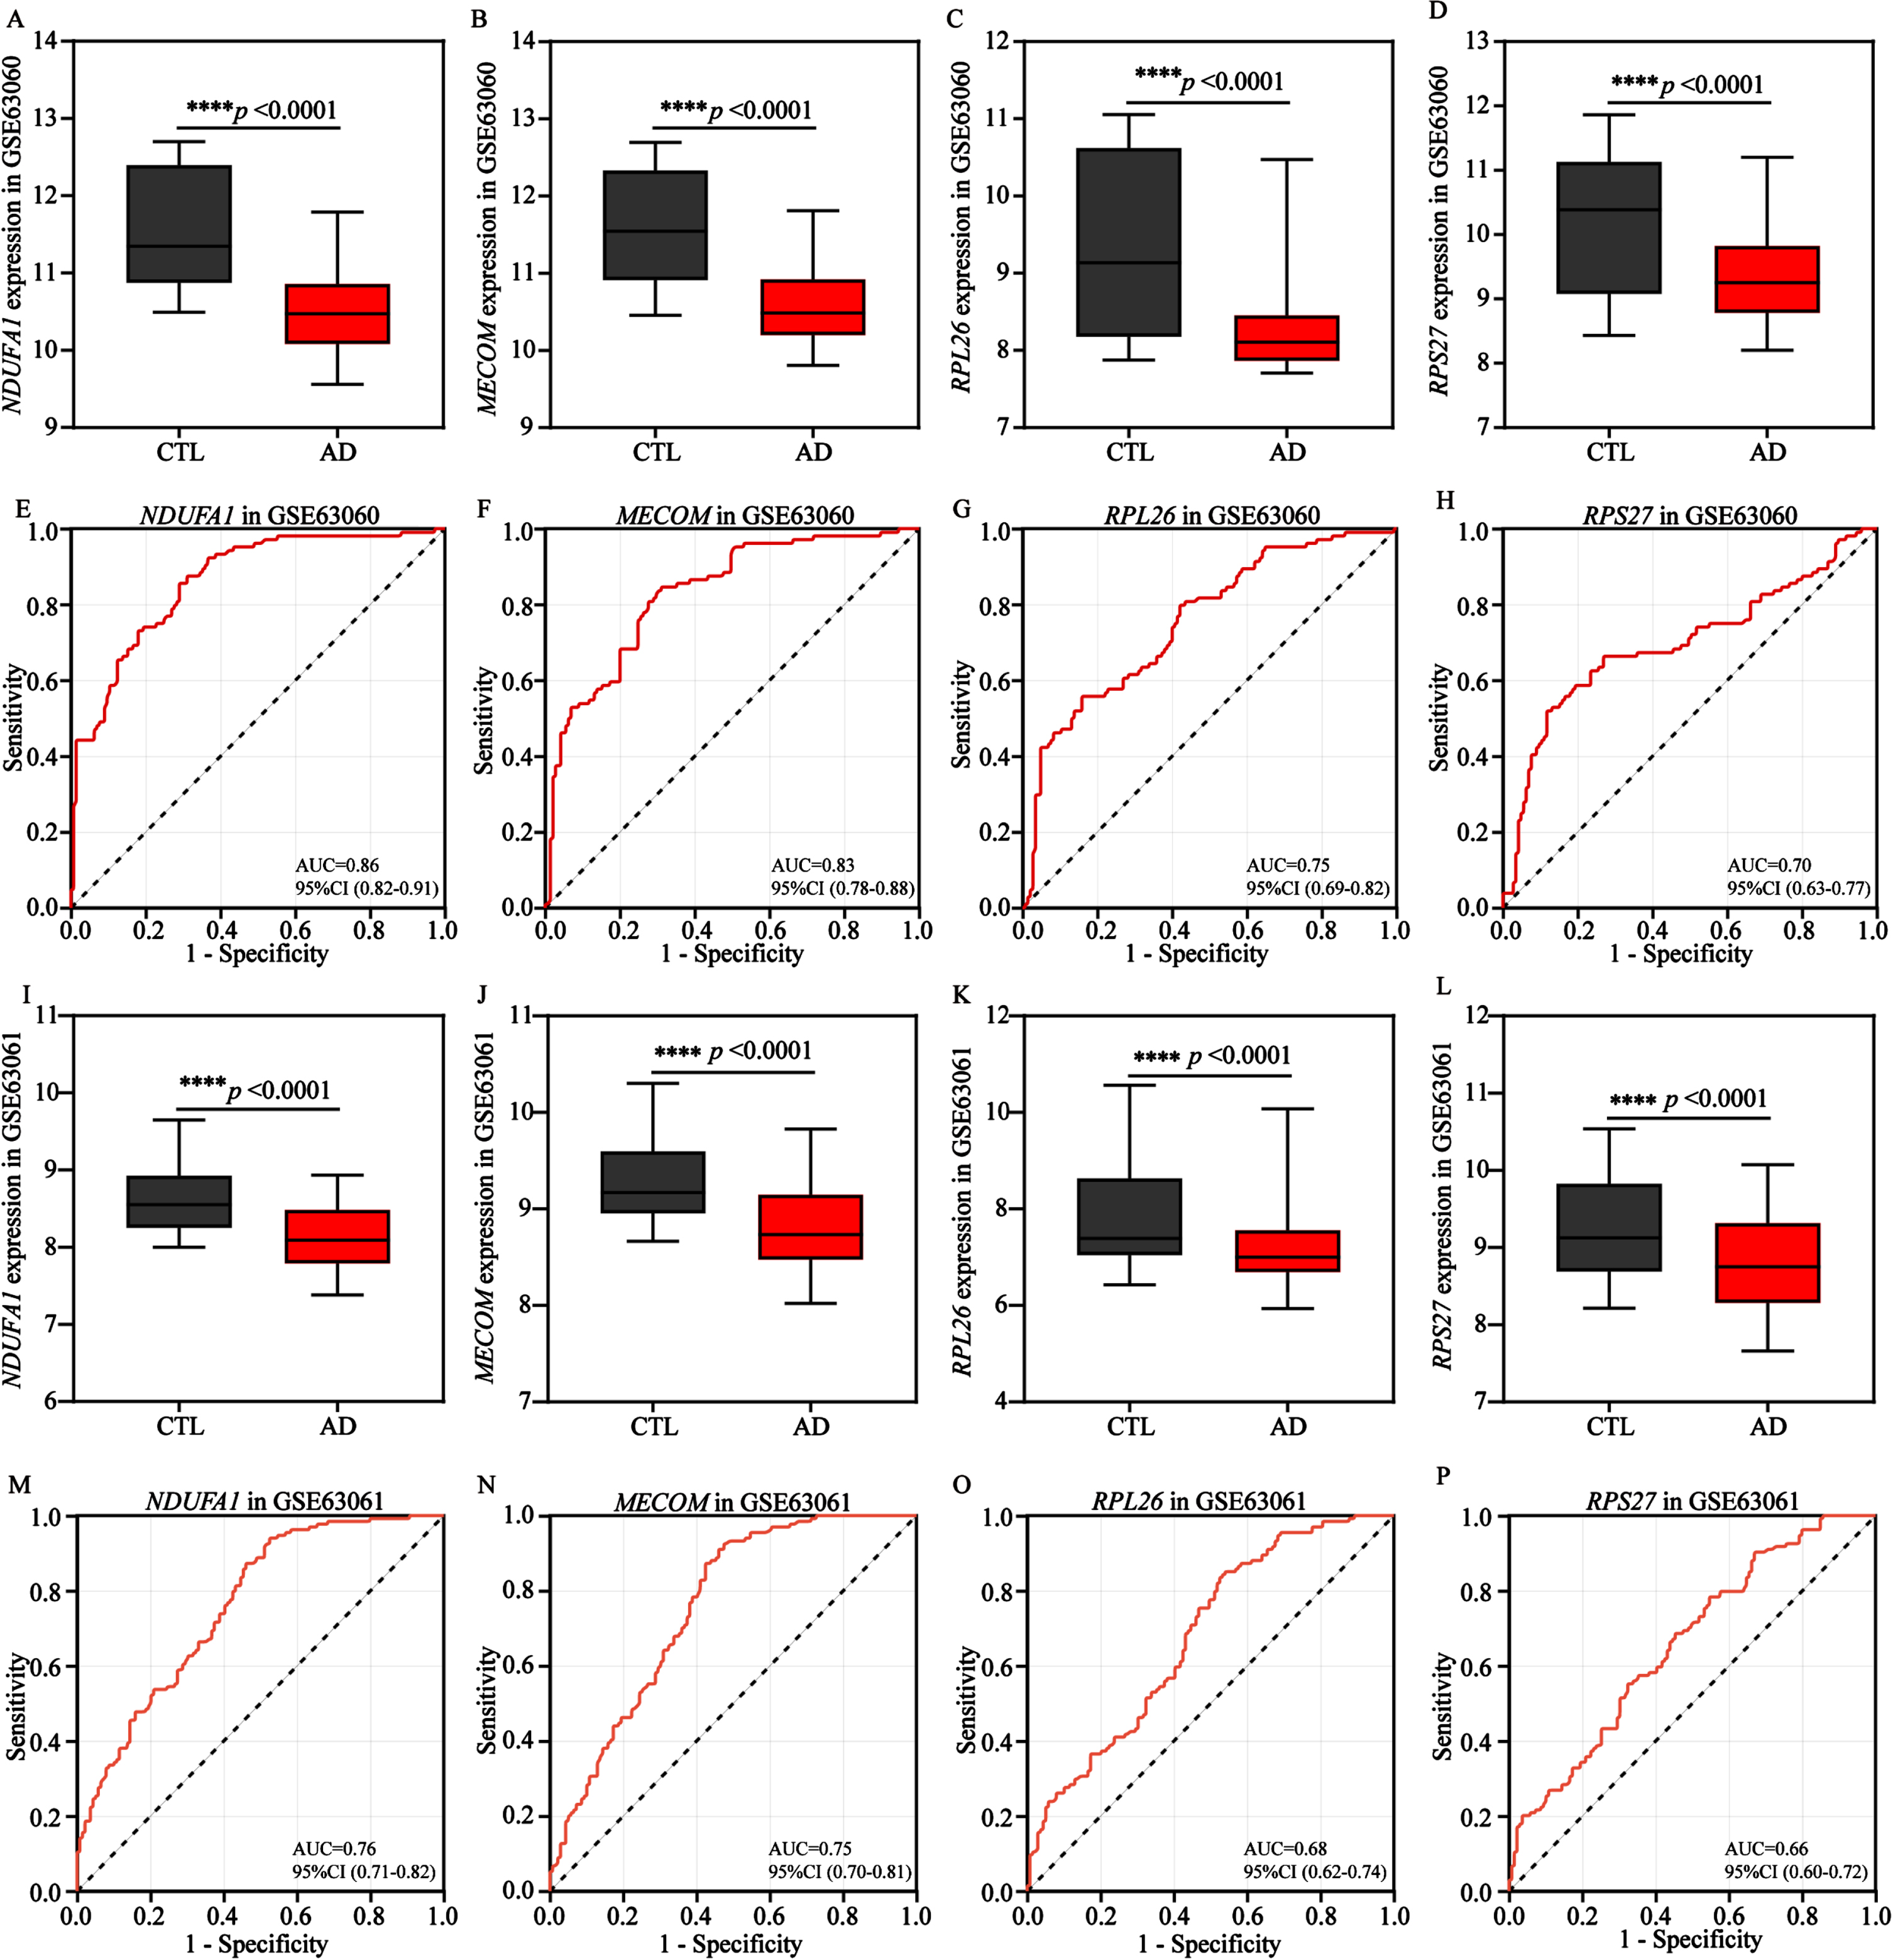
Subsequently, we attempted to explore the significance of identified 4 energy biomarkers in AD diagnosis. Therefore, the expression profiles of 4 biomarkers were comprehensively analyzed. Our results indicated the expression levels of the 4 AD biomarkers were significantly and similarly decreased in the training cohort (GSE63060, Fig. 7A-D) and the validation cohort (GSE63061, Fig. 7I-L), comparing to control groups. Subsequently, in order to evaluate the diagnostic performance of each AD biomarker in two cohorts, the ROC curve was applied to evaluate the AUC values of each AD biomarker and to determine their sensitivity and specificity for the diagnostic value for AD (Fig. 7E-H, M-P). As expected, all 4 AD biomarkers showed AUC values ≥0.7 in the training cohort, NDUFA1 (AUC = 0.86), MECOM (AUC = 0.83), RPL26 (AUC = 0.75) and RPS27 (AUC = 0.70), respectively (Fig. 7E-H). Meanwhile, in the validation cohort, the corresponding AUC values for NDUFA1, MECOM, RPS27, and RPL26 were 0.76, 0.75, 0.68, and 0.66, respectively (Fig. 7M-P). These findings also indicated that the 4 biomarkers had the potential to serve as AD characteristic diagnosis biomarkers.
Fig. 7
Validation and exploration the diagnostic value of AD biomarkers in European cohorts. A-D) Differential expression boxplots of NDUFA1, MECOM, RPL26, and RPS27 in the training cohort GSE63060. E-H) The ROC curves of NDUFA1, MECOM, RPL26, and RPS27 in the training cohort GSE63060 for diagnostic value exploration. I-L) Differential expression boxplots of NDUFA1, MECOM, RPL26, and RPS27 in the validation cohort GSE63061. M-P) The ROC curves of NDUFA1, MECOM, RPL26, and RPS27 in the validation cohort GSE63061 for diagnostic value exploration. Box plots represent the median, 25th and 75th percentiles and whiskers represent the 5th and 95th percentiles. Statistical comparisons were carried out with t test (A-D, n = 104 in the control group, n = 145 in the AD group; I-L, n = 134 in the control group, n = 139 in the AD group; ****p < 0.0001 vs. the control group). CTL, control; AD, Alzheimer’s disease.
Exploration of AD biomarkers association with risk factors in European cohorts
Considering that gender and age are important risk factors for AD, we are curious whether the 4 AD biomarkers are influenced by gender and age factors in European cohorts. So, we first compared baseline data for gender and age. The AD group exhibited a higher proportion of women and a higher average age compared to the control group (Supplementary Table 1). Further analysis showed no significant changes in the expression levels of the 4 biomarkers of different genders and ages in the AD group (Supplementary Figure 6–8). Besides age factor, the cellular senescence markers (TP53, CDKN1A and CDKN2A) are also used to evaluate potential aging effects. We further found the correlation between AD blood biomarkers and the cellular senescence markers. Notably, among them, CDKN1A (encoding p21) has a higher negative correlation with 4 AD biomarkers in AD group, comparing to control group (Supplementary Figure 9), which may suggest that the altered expression of the 4 biomarkers have a potential impact on the expression level of senescence biomarkers in AD. MCI patients who were over 65 years old exhibited a 14.9% incidence of dementia after a two-year monitoring period.66 In this study, we found that the expression levels of 4 biomarkers were also downregulated in MCI (pre-clinical stage of AD) group, which is consistent with AD (Supplementary Figure 10). In summary, these findings suggested the expression levels of 4 blood biomarkers are not affected by aging andgender factors.
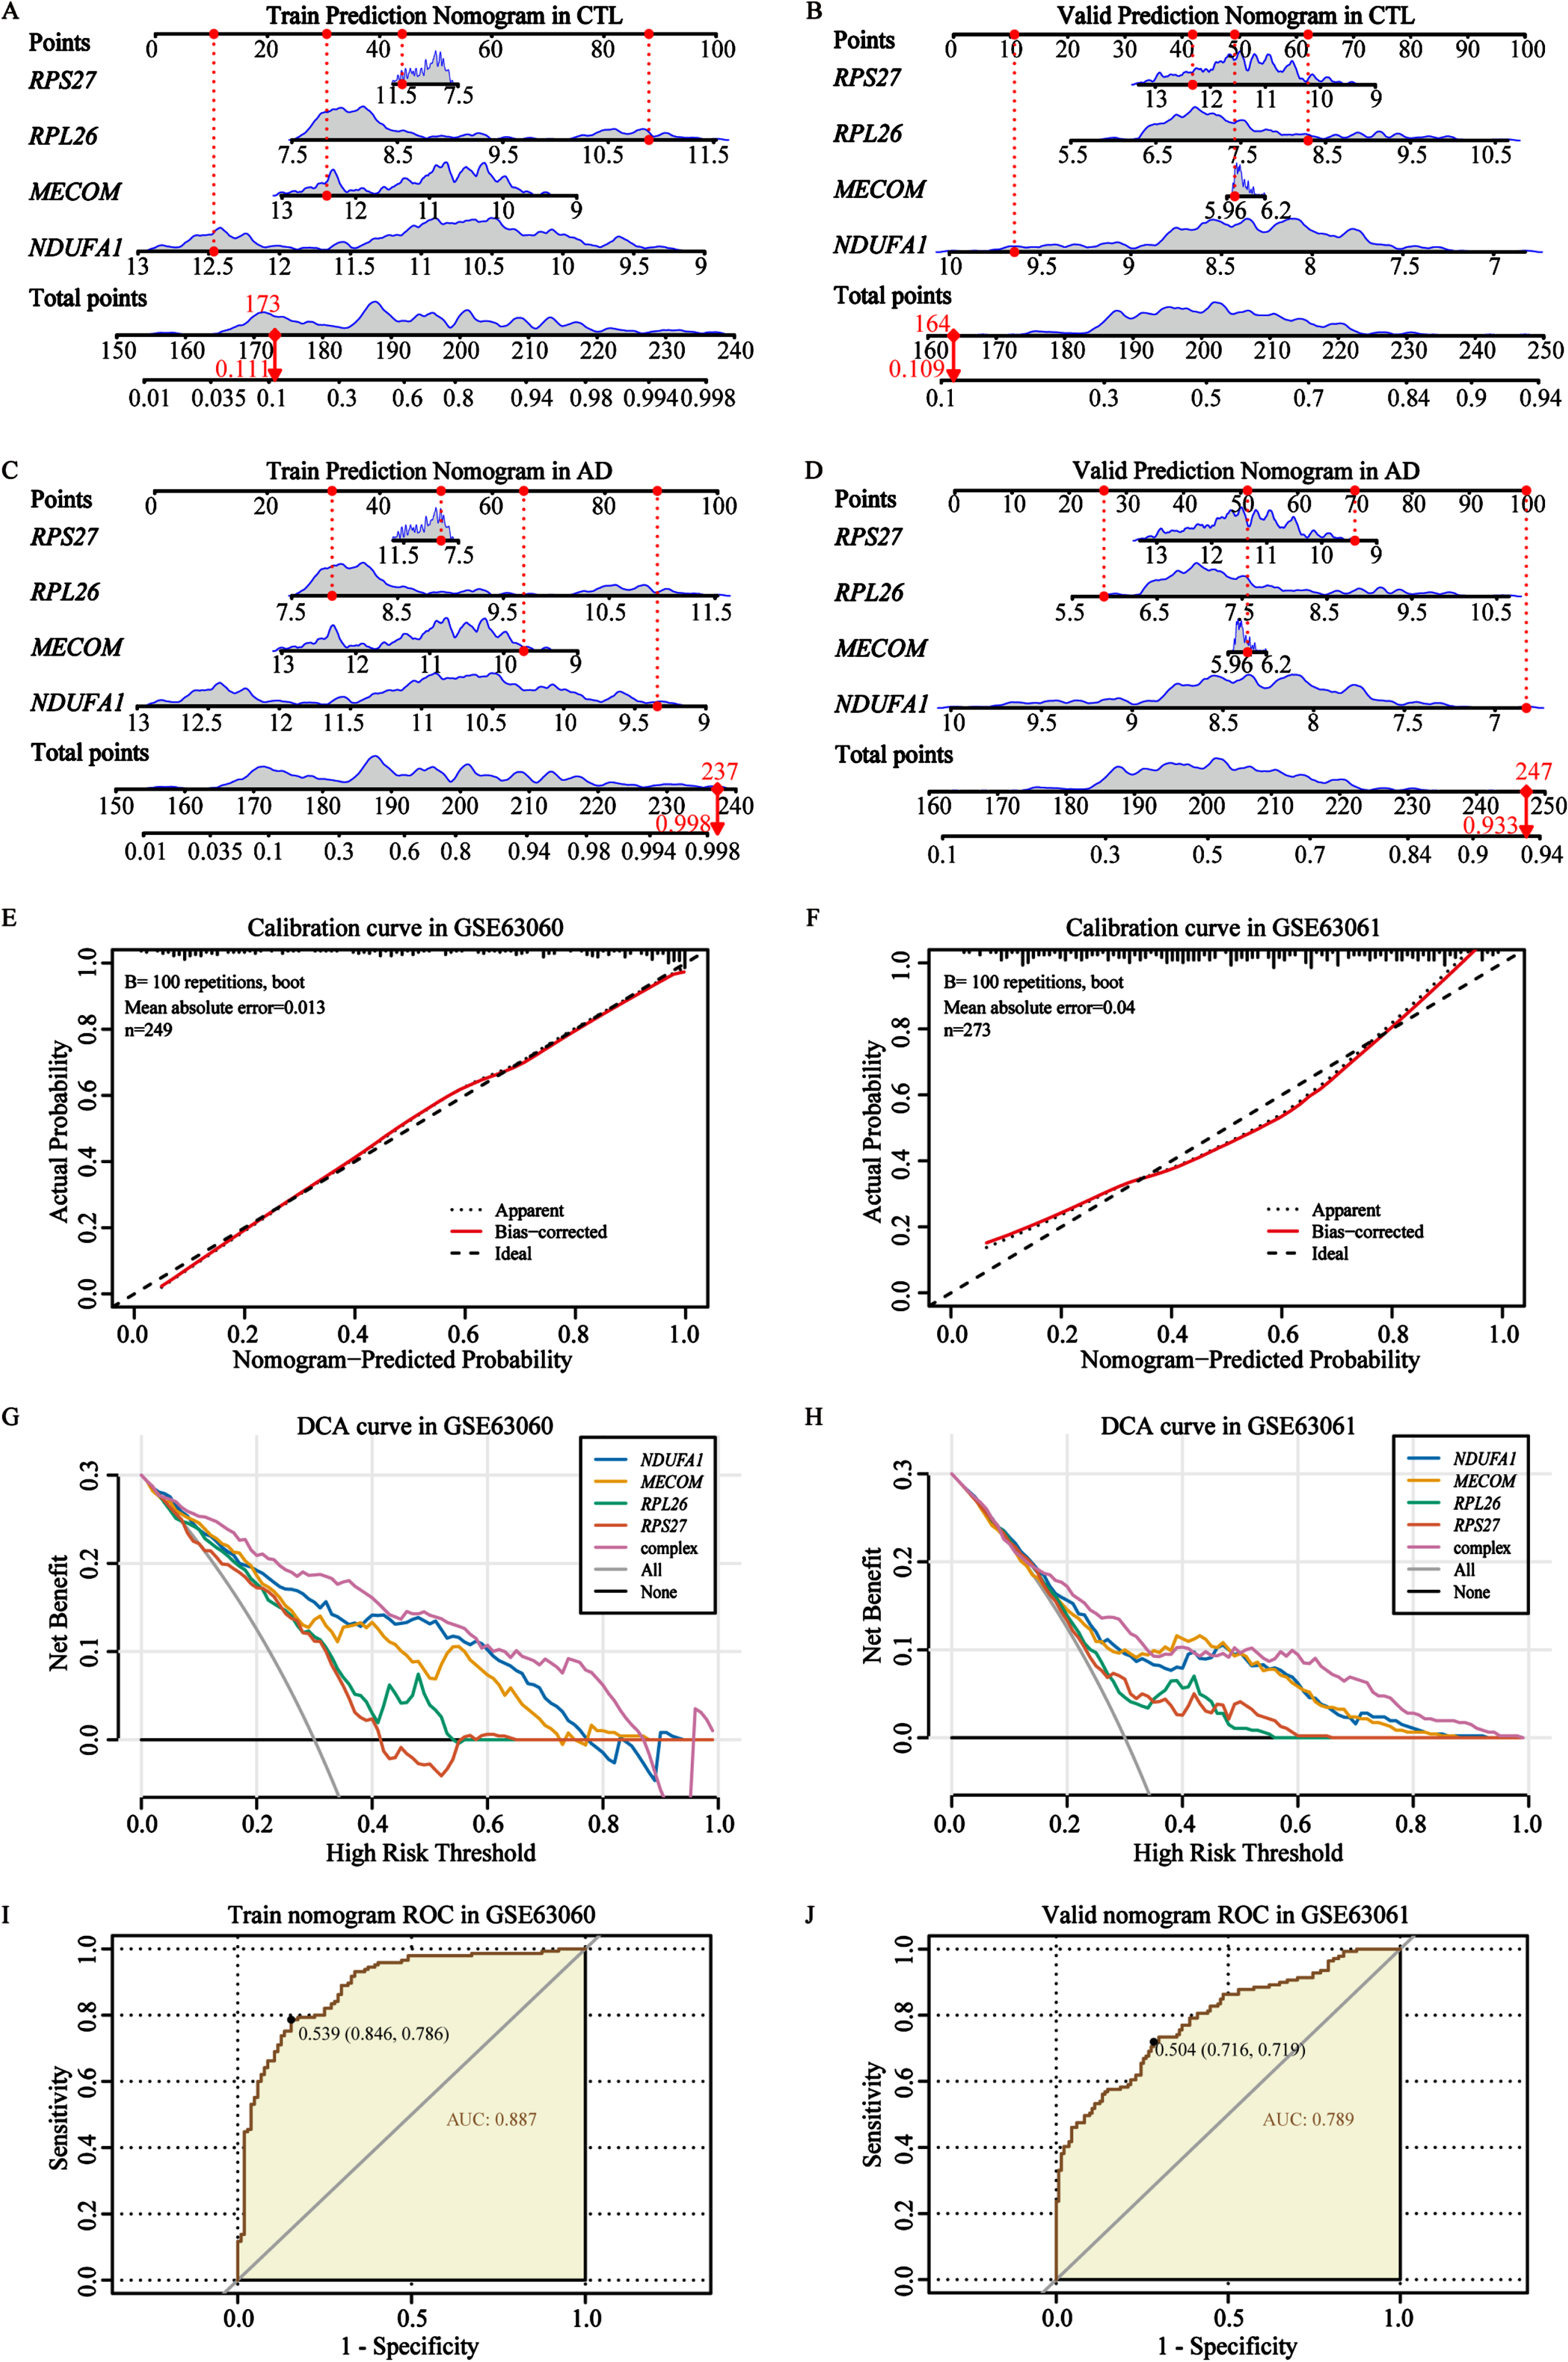
Construction and validation of AD diagnostic nomogram
After confirming the expression of these 4 biomarkers, we proceeded to incorporate them into a predictive and diagnostic model for AD. To further evaluate the diagnostic and discriminative capabilities of nomogram for 4 biomarkers, we validated it in 2 independent cohorts of the control and AD groups (Fig. 8A-D). These prediction levels of the nomogram for control individuals in the training cohort and validation cohort were 0.111 and 0.109, respectively (Fig. 8A, B). For AD patients, the prediction levels were 0.998 and 0.933, respectively (Fig. 8C, D). These findings indicated that our AD biomarkers demonstrated strong classification accuracy in distinguishing individuals with AD from controls (Fig. 8A-D). Thereafter, calibration cures were utilized to verify the diagnostic signature of the AD biomarker nomogram, and the results showed that the basic prediction probability was close to the ideal model (Fig. 8E, F). Usually, the wider threshold and the superior DCA results represent relatively better applicability of the nomogram model. In our study, different types of DCA curves were plotted in two cohorts, including single biomarker curve, complex curve of 4 biomarkers, none-intervention curve, and intervention curve. The results showed that compared to the other curves, the complex curve composed of the 4 biomarkers was higher and wider, further indicating that the nomogram model might provide potential benefits for AD diagnosis (Fig. 8G, H). In addition, the ROC curve results also confirmed that the complex nomogram composed of the 4 biomarkers showed a higher AUC value (AUC = 0.887 in GSE63060; AUC = 0.789 in the GSE63061, Fig. 8I, J), which has also been validated through six other machine learning algorithms (Supplementary Figure 11). In brief, our results confirmed that the complex nomogram constructed based on the 4 AD biomarkers had relatively good performance and diagnostic accuracy.
Fig. 8
Construction and verification of the AD biomarker nomogram. A, B) The nomogram was constructed based on the AD biomarkers to predict normal controls in the training cohort GSE63060 and validation cohort GSE63061. C, D) The nomogram was constructed based on the AD biomarkers to predict and diagnose AD in the training cohort GSE63060 and validation cohort GSE63061. E, F) The calibration curve of the nomogram prediction in AD patients in the training cohort GSE63060 and validation cohort GSE63061. G, H) DCA curves for the nomogram and 4 biomarkers in the training cohort GSE63060 and validation cohort GSE63061. I, J) The ROC curves for the predictive performance of the nomogram in the training cohort GSE63060 and validation cohort GSE63061.
Validation of AD biomarkers expression in a local Asian cohort
Previously, we observed that all 4 AD biomarkers showed significant differences in the samples of the European cohorts. To verify the reliability and wide applicability of 4 AD biomarkers, we tested small cohort samples from Asia. The RT-qPCR results of peripheral blood showed that the expression levels of NDUFA1, MECOM, RPL26, and RPS27 in AD group were lower than those in the control group (Fig. 9A-D), which were consistent with the results of the 2 European cohorts mentioned above (Fig. 7A-D, I-L), indicating that these 4 genes, as biomarkers for AD diagnosis and prediction, possessing better accuracy and wider applicability.
Fig. 9
Validation of potential AD biomarkers in a local Asian cohort. A-E) Relative mRNA expression of NDUFA1, MECOM, RPL26, RPS27, and PINK1 in AD patients and normal controls. F) Difference in the plasma GFAP expression in AD patients and normal controls. CTL, control; AD, Alzheimer’s disease. NS represents no statistical significance. Statistical comparisons were carried out with t-test (A-D, n = 8 per group; E, n = 9 per group; F, n = 5 per group, *p < 0.05, **p < 0.01 vs. the control group). The results are presented as the mean±standard error of the mean (SEM).
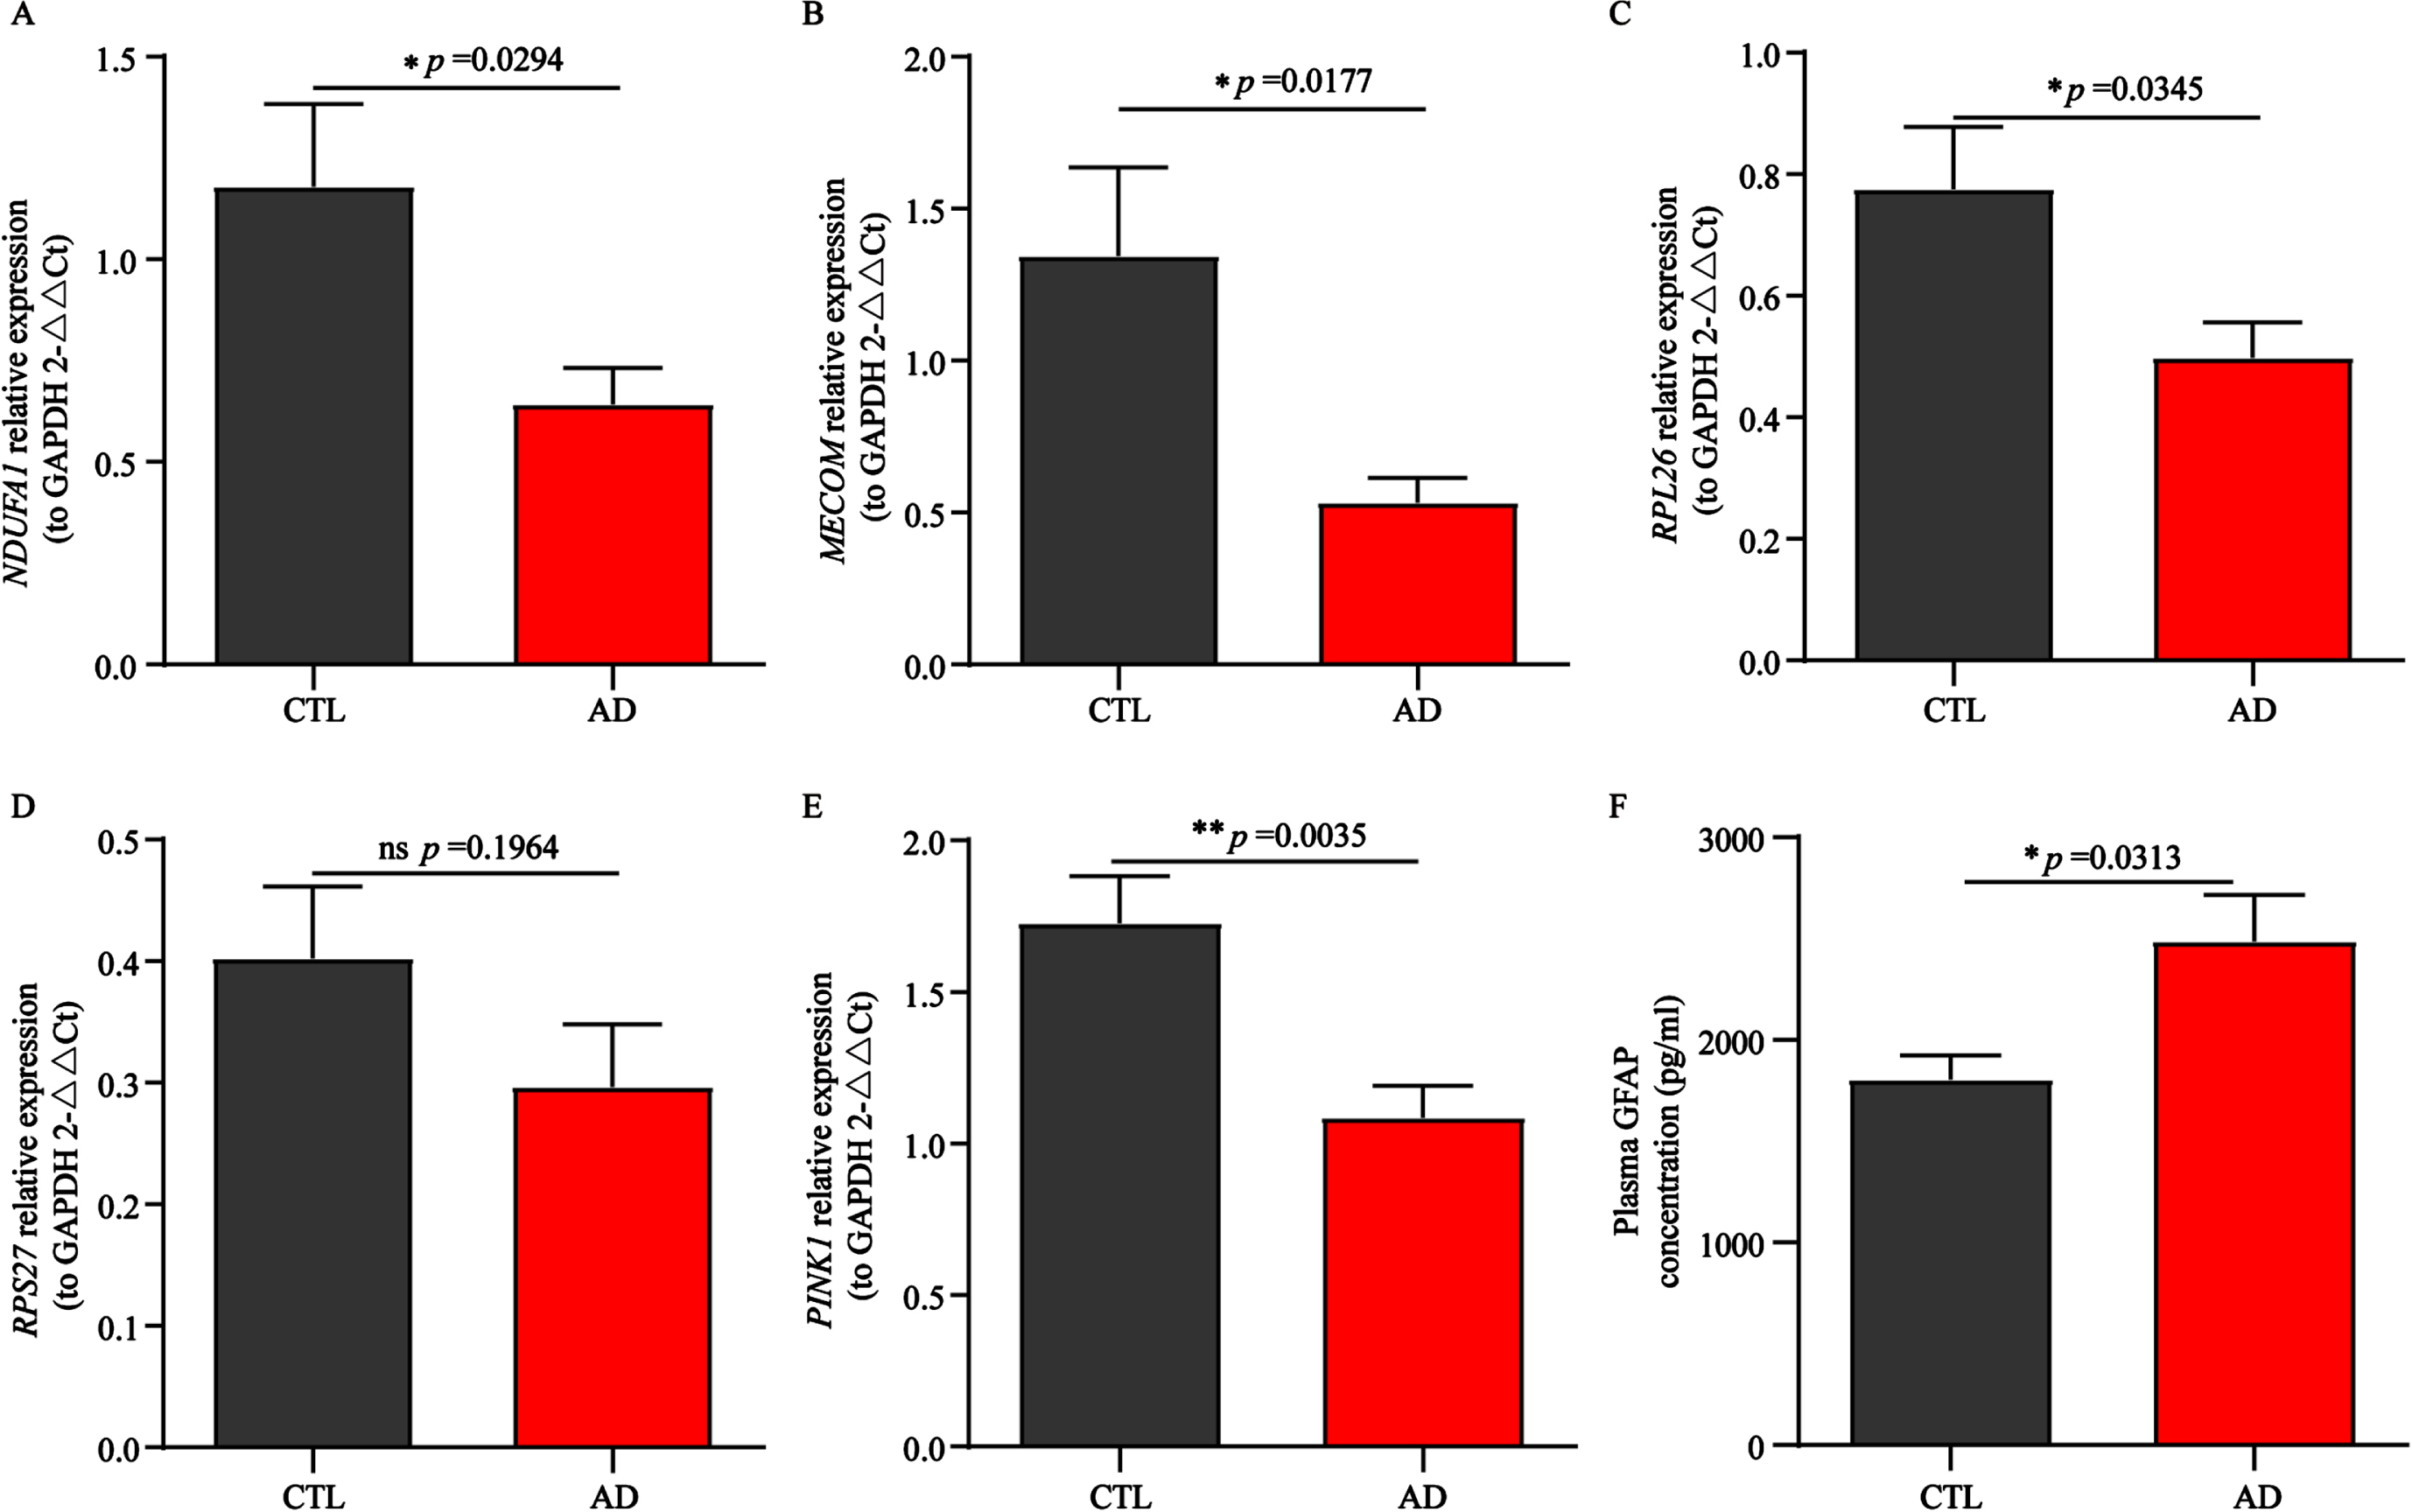
Exploration of PINK1 and GFAP expression in a local Asian cohort
In recent years, studies have reported that significant differences in PTEN induced kinase 1 (PINK1) expression between the AD group and the control group have been observed in both in vivo and in vitro models,67,68 and the expression level of PINK1 in the brain is somewhat consistent with its expression in peripheral blood. In addition, overwhelming evidence suggests that GFAP crosses the leaky blood brain barrier and also has been demonstrated its potential utility as a biomarker in AD and dementia progressing prediction.69 Therefore, we explored the mRNA expression of PINK1 in peripheral blood and plasma GFAP protein expression levels in a local Asian cohort (Fig. 9E, F). Low expression of PINK1 and high expression of GFAP were observed in AD patients, which is consistent with aforementioned literature results. In summary, these results once again indicated that the 4 biomarkers had potential diagnostic and predictive value, as other reported biomarkers, PINK1 and GFAP, had also been validated in this study.
Potential drug prediction of AD biomarkers
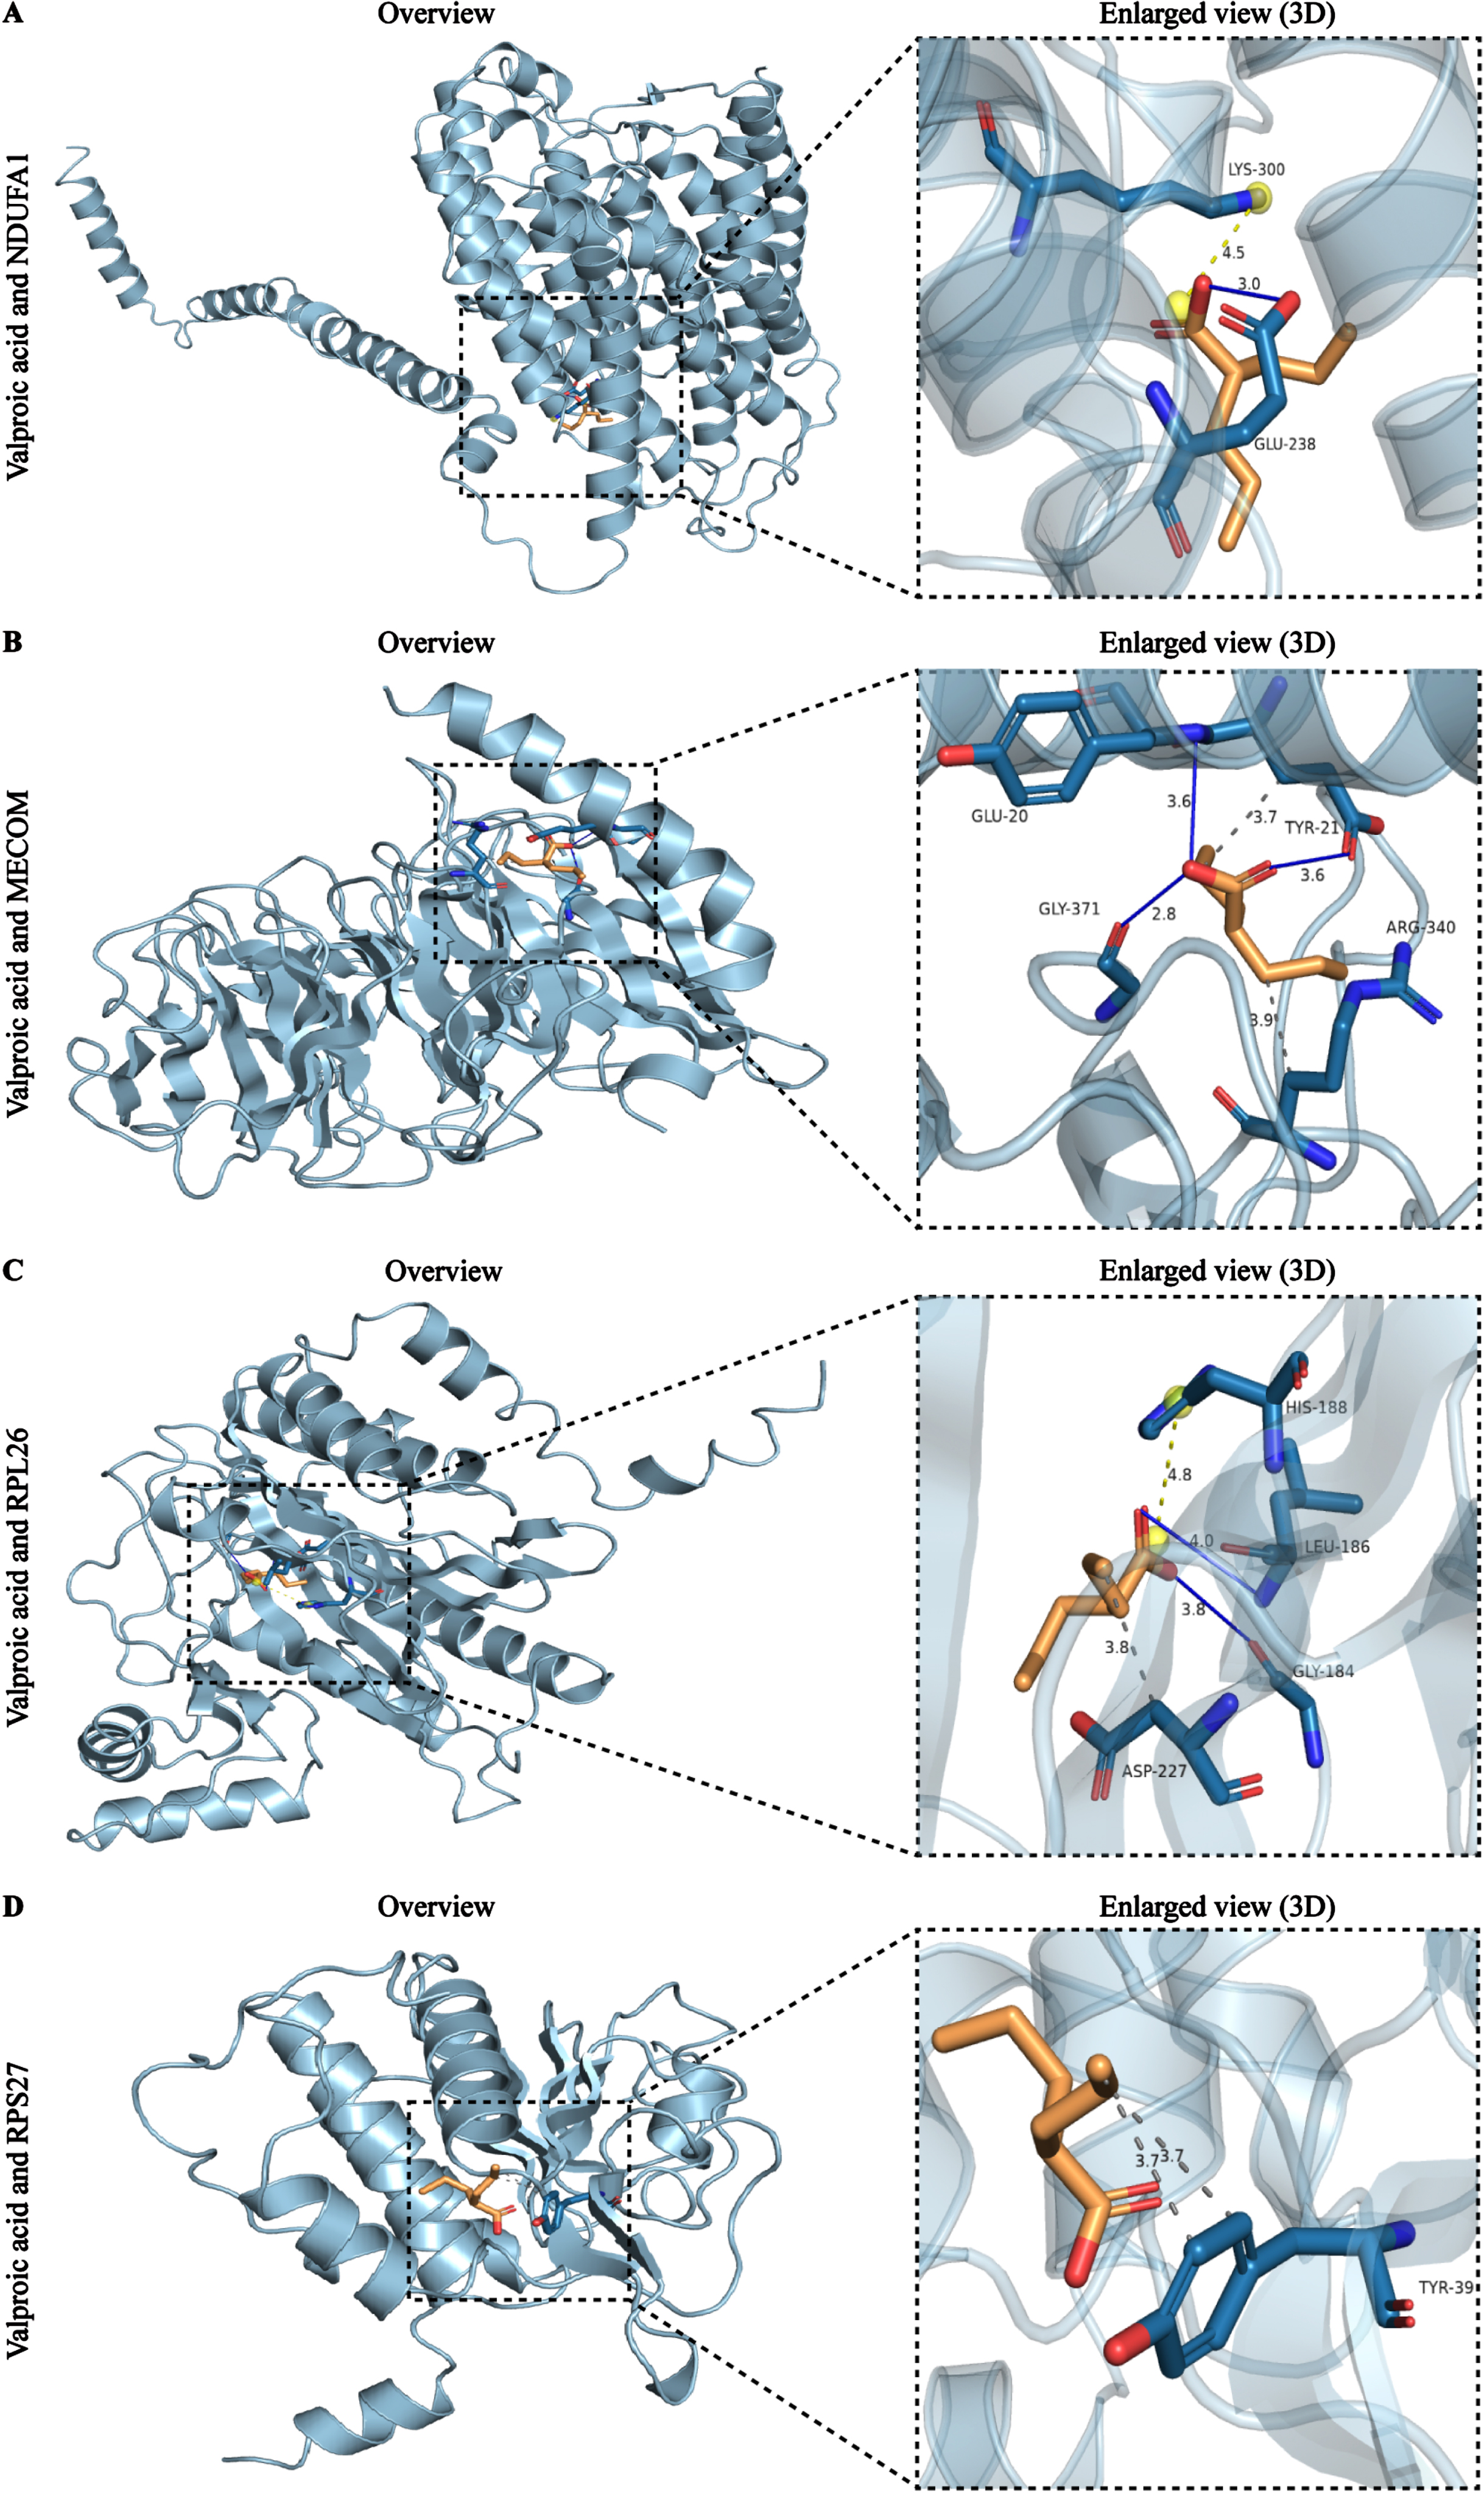
After observing the predictive power and testing efficiency of the nomogram, we attempted to explore potential drugs targeting these biomarkers in order to provide insights for the treatment of AD patients. The analysis results showed that a total of 71 drug-gene interaction pairs were identified from the DSigDB database, involving 59 drugs and 4 genes. Among them, MECOM exhibited the highest number of interacting drugs (n = 40), followed by NDUFA1 (n = 18), RPS27 (n = 9), and RPL26 (n = 4) (Supplementary Figure 12). Notably, further analysis results showed that only valproic acid interacted with all 4 biomarkers, and it distinguished itself from the other 9 drugs due to its highest combined score (164219.01) and the most significant p value (p = 2.98E-02) (Table 2).
Subsequently, we performed molecular docking analysis of valproic acid based on its extensive interaction ability and high binding score. The protein information used for docking can be obtained from PDB database with their ID (Table 3). The detailed molecular structure of 4 AD biomarkers and valproic acid were illustrated in stick form and cartoon 3D representations, respectively (Fig. 10A-D). Usually, docking binding energy (kcal/mol) represents docking ability, with lower energy values indicating the stronger affinities. The docking analysis showed that valproic acid displayed relatively stable combination with all biomarkers, NDUFA1 (–7.24), MECOM (–7.76), RPL26 (–7.56), and RPS27 (–7.02), respectively. The hydrogen-bond interactions were indicated by blue solid lines, while light yellow and grey dotted lines represented alkyl interactions and hydrophobic interactions, respectively. It is obvious that there is a hydrogen bond between valproic acid and the GLU238 site of NDUFA1, as well as a salt bridge at the LYS300 site (Fig. 10A). The interactions between valproic acid and MECOM contained two types, which were hydrogen bonds at GLU20, TYR21 and GLY371 site of MECOM, and hydrophobic interaction at GLU20 and ARG340 site of MECOM (Fig. 10B). The docking results of RPL26 showed the creation of hydrogen bonds between valproic acid and GLY184 and LEU186 of RPL26, the salt bridge between HIS188, and the hydrophobic interaction with ASP227 (Fig. 10C). In addition, the docking results of RPS27 showed that valproic acid can form hydrophobic interactions with the residue TYR39 of RPS27 (Fig. 10D). These results demonstrated that valproic acid, an FDA approved drug, exhibited low binding energy and high affinity for the 4 biomarkers, suggesting that valproic acid might be a candidate drug for AD.
Table 3
The PDB ID of the protein
| Number | Core target | PDB ID |
| protein | ||
| 1 | NDUFA1 | 5XTC (PMID:10.2210/pdb5XTC/pdb) |
| 2 | MECOM | 6BW3 (PMID:10.2210/pdb6BW3/pdb) |
| 3 | RPL26 | 6SXO (PMID:10.2210/pdb6SXO/pdb) |
| 4 | RPS27 | 6ZOK (PMID:10.2210/pdb6ZOK/pdb) |
Fig. 10
Molecular docking results of the valproic acid with each target biomarker proteins. A) Valproic acid and NDUFA1. B) Valproic acid and MECOM. C) Valproic acid and RPL26. D) Valproic acid and RPS27. All left panels are displaying the 3D structures of the combined valproic acid-biomarker complexes. Detailed and enlarged binding sites for the valproic acid-biomarker proteins are listed in the right panels, with interactions between amino acid residues and functional groups. Blue solid lines represent the hydrogen-bond interactions, while light yellow and grey dotted lines represent alkyl interactions and hydrophobic interactions, respectively.
DISCUSSION
Recent research suggests that impaired energy metabolism is linked to the onset of AD.70 Purposeful regulation of energy metabolism homeostasis in AD can help to reduce oxidative stress, attenuate inflammatory responses, and remove pathological protein deposition, ultimately ameliorating cognitive decline.71,72 Peripheral blood biomarkers have played an increasingly crucial role in the clinical diagnosis and prediction of AD due to good safety and low-cost advantages.42 Utilizing genomic data from AD samples and employing machine learning tools has helped to identify potential biomarkers for AD prediction and diagnosis.73,74
In this study, DEGs were identified from the GSE63060 initially. At the same time, the WGCNA algorithm was applied to analyze the co-expression of genes associated with AD in the GSE63060 training cohort. The EMRGs were collected from the GeneCards database, and as a result, 15 key genes were identified for subsequent biomarker screening. To identify biomarker genes with common features, we used 2 different machine learning algorithms, LASSO regression and RF, to further screen the key genes. Finally, we obtained 4 potential biomarkers by Venn diagram analysis. In conclusion, after applying bioinformatics methods to obtain preliminary genes, we bridged two different machine learning tools to further narrow down and extract the most objective and characterized energy metabolism-related biomarker genes, NDUFA1, MECOM, RPL26, and RPS27.
NDUFA1, a subunit of the mitochondrial respiratory chain belonging to the NADH dehydrogenase I alpha subcomplex (NDUFA) family, is located on chromosome X and encodes a highly conserved protein.75 In AD mouse models, Aβ plaque deposition has been found to lead to increased oxidative stress in neurons, accompanied by mitochondrial damage.76 The damaged mitochondria produce more ROS, exacerbating neuronal damage and impairing energy metabolism.77 Calvo-Rodriguez et al. discovered that NDUFA1 knockdown resulted in higher enzyme activity and ATP levels, leading to elevated ROS levels.76 The NDUFA1 p.Gly32Arg variant has been suggested to be associated with neurodegenerative dementia,78 highlighting its importance as a key gene in AD. NDUFA1 is involved in regulating oxidative phosphorylation, NADH homeostasis regulation, and mitochondrial dysfunction pathways, and is also considered a potential biomarker gene for AD.23,79 In this work, our research indicates that NDUFA1 is not only involved in the processes of mitochondrial respiratory bodies and respiratory chain complexes, as well as oxidoreductase complexes, but also regulates pathways of oxidative phosphorylation, pyruvate metabolism, cofactor biosynthesis, carbohydrate and lipid metabolism. However, current research on the role of NDUFA1 in AD is still limited. Therefore, future studies could focus on exploring the regulation of energy metabolism disorders and the inhibition of excessive oxidative stress in AD.
MECOM, also known as ecotropic virus integration site 1 protein homolog (PRDM3/Evi-1), belongs to the positive regulatory domain zinc finger protein (PRDM) protein family.80 It plays a crucial role in cell proliferation, differentiation, and development.81 Several studies have proposed that MECOM regulates cell fate determination in neurons and stem cells by interacting with C-terminal-binding protein (CtBP) and Nucleosome Remodeling Deacetylase (NuRD) complexes.82 Furthermore, investigations have demonstrated that MECOM-deficient mouse embryos displayed notable abnormalities in neurological development.83 The overexpression of MECOM perturbs cellular metabolism, while fostering the expression of CKMT1 (mitochondrial creatine kinase), thereby reconfiguring the arginine-creatine pathway.59 In our single gene KEGG enrichment analysis, MECOM was found to be intricately linked to multiple energy metabolism-related pathways, including oxidative phosphorylation, amino acid, fatty acid, cofactor, and xenobiotic metabolism in the peripheral blood transcriptome of AD patients. Interestingly, Gilbert et al. discovered that Aβ induced histone deacetylase 1 (HDAC1) to dissociate from the miR-124 transcription factor PRDM3, stimulated miR-124 expression and AMPAR biogenesis, and affected an exaggerated response to steady-state synaptic plasticity.84 Thus, the MECOM-HDAC1 complex may be part of a larger specific chromatin remodeling complex involved in fine-tuning synaptic plasticity. Our study not only identified multiple key miRNAs involved in regulating MECOM, but also discovered key lncRNAs that interacted with it. Therefore, these findings contribute to the existing research on the regulatory mechanisms of MECOM and offer insights for further exploration of MECOM’s role in ADpathophysiology.
In previous studies, 29 differentially expressed ribosomal proteins were identified through quantitative proteomics.85 Among them, RPL26 served as a valuable biomarker for the progression of AD, with value in distinguishing AD from MCI.57,58 RPS27 exhibited abundance and stability across different tissues and cell types.86 Besides, Feldheim et al. observed RPS27 was expressed in the AD neurons and affected by changes in macrophage morphology.87 It is worth noting that our studies not only found that key energy metabolism related biomarkers were associated with macrophages in AD, but also with various types of T cells. Increasing research has illustrated the close relationship between ribosomal proteins and metabolic process, either in AD or other diseases. Among them, RPL26 was significantly enriched in oxidative phosphorylation in AD.57 RPL26 and RPS27 were also enriched in oxidative phosphorylation in laryngeal squamous cell carcinoma cells.62 Moreover, RPL26 and RPS10 were found their correlation with mTORC1 signal regulating protein synthesis, mitochondrial function, and lipid metabolism in primary human trophoblast (PHT) cells.63 Other ribosomal proteins have also demonstrated the novel evidence of their role in regulating metabolism, like mRPL10 affecting glycolysis and mitochondrial function,60 RPL22 affecting on recruiting glucose uptake and lactate release via recruiting and regulating HIF1α in melanoma.61 In this study, RPL26 and RPS27 affect oxidative phosphorylation, various carbohydrate and lipid metabolism, and other metabolism pathways, which is consistent with previous studies. These results suggest that ribosome related genes play a crucial role in energy metabolism disorders in AD.
After narrowing key genes into 4 EMRG biomarkers (NDUFA1, MECOM, RPL26, and RPS27), we first developed diagnostic prediction model in the training cohort (GSE63060) and validation cohort (GSE63061) using multivariate Cox regression analysis. Subsequently, we used calibration curves, DCA, and ROC curves to objectively evaluate the clinical efficacy of the constructed model. Our research results indicated that the complexed prediction model based on 4 biomarkers exhibited high predictive power and clinical validity in both training and validation cohorts (AUC of 0.887 and 0.789, respectively), indicating potential diagnostic and predictive value of our constructed model in identifying individuals at risk of AD.
Blood biomarkers (e.g., Aβ40/42, p-tau 181, p-tau 217, p-tau 231) have emerged as critical tools for the diagnosis of AD.5–8 An increasing amount of clinical studies have found that GFAP was significantly elevated as early as the asymptomatic stage when Aβ pathology appeared, and gradually increased with disease progression, reaching its highest level in the dementia stage of AD.88,89 GFAP levels have the potential to serve as an important indicator for the early diagnosis and prediction of AD.88 Mitochondria are the central hub of energy metabolism in neurons. PINK1 plays an important role in mitochondrial quality control and prevention of dysfunction,67 and the mRNA and protein levels of PINK1 are significantly reduced in AD patients.67,68 In this study, the GSE63060 and GSE63061 datasets were from the European population, while the local dataset was from the Asian population. We investigated the expression levels of 4 energy metabolism related genes in peripheral blood from these three independent cohorts to evaluate their regional and population differences. The results showed that the expression levels of 4 energy metabolism genes were downregulated in AD patients and even preclinical patients. Intriguingly, further research has shown that the downregulation of the 4 energy-related metabolism genes is not affected by gender and age factors, although some studies have recognized that gender, age, and APOE ɛ4 allele are risk factors for AD.71,90 These results not only indicated that these genes had potential applicable value as clinical blood biomarkers, but also relatively wide applicability in certain regions and populations of different genders and ages. Moreover, we also detected and confirmed that GFAP and PINK1 were upregulated and downregulated in peripheral blood of AD, respectively, which is consistent with existing studies. These results assist in demonstrating that the energy metabolism related biomarkers we screened, like the reported GFAP, have good potential predictive value.
Considering the potential biomarkers as drug targets, we further explored the relationship between drugs or molecules and 4 energy metabolism related genes. Our research indicates that valproic acid interacts with 4 biomarkers related to energy metabolism with the highest binding score. Valproic acid plays a role in regulating oxidative processes, lipid metabolism, and mitochondrial function.91,92 These studies also support our findings to some extent. Valproic acid, a fatty acid derivative, is an FDA-approved therapeutic agent used for the treatment of epilepsy, migraine, and various neuropsychiatric disorders,93 whose neuropsychiatric signs and symptoms are also common in AD. Valproic acid exhibited a potential neuroprotective role in both in vitro and vivo models of AD by increasing mitochondrial membrane potential, inhibiting cytochrome C release, promoting mitochondrial ATP synthesis against Aβ toxicity,94 and restoring the physiological regulation of synapsin I.95 Unlike preclinical research results, valproic acid has shown contradictory effects in existing anti-AD clinical trials. An early clinical trial conducted in patients with dementia and behavioral agitation showed that valproate might be an effective, well tolerated, and safe treatment for agitation in patients with dementia.96 Conversely, another clinical trial conducted in AD patients who had not yet experienced agitation or psychosis (NCT00071721) found that chronic valproate treatment could not delay agitation or psychosis or cognitive decline in AD patients.97 A previous study reviewed that the differences in efficacy outcomes of valproic acid were likely affected by factors such as clinical study design type, subjects, primary outcome indicators observed, administration strategy (monotherapy or combination therapy), and dosage.98 Although our study suggests that valproic acid, which is associated with 4 biomarkers, may have potential therapeutic value for AD, further clinical trials are needed as these results combines public clinical cohorts and network pharmacology analysis.
However, our study has certain limitations. Firstly, the cohorts utilized in our study lacked genetic risk factor information for the APOE ɛ4 allele and more detailed baseline information related to metabolism, such as biochemical indicators. In order to enhance the comprehensiveness and predictive performance of the AD prediction model constructed with energy metabolism related biomarkers, it is necessary to include the APOE ɛ4 allele as well as plasma metabolites such as glucose, lipids, amino acids, and plasma proteins. Secondly, the cohorts used in our study were limited to European and Asian populations. To ensure the extrapolation of the model, further validation using external data from diverse regions and larger population samples is required. Therefore, future studies should focus on optimizing the interpretability and generalizability of the prediction model by incorporating more comprehensive clinical parameters, as well as increasing the sample size. This will realize accurate and dynamic prediction of AD patients.
Conclusion
In this study, we identified 4 energy metabolism related genes, NDUFA1, MECOM, RPL26, and RPS27, as blood biomarkers for AD through comprehensive bioinformatics analysis. Further research has shown that they are closely related to the ribosomal pathway, oxidative phosphorylation, multiple energy metabolic pathways and T cell immune infiltration in AD, and regulated by TFs and ceRNA. Then, we constructed an AD diagnostic model based on 4 biomarkers, which was proven to have good diagnostic performance by different machine learning algorithms. We further confirmed that the 4 biomarkers downregulated in expression were not affected by gender and age factors. In addition, valproic acid, as one of the candidate drugs associated with 4 biomarkers, may have potential therapeutic value for AD in this study. In summary, our study demonstrated the crucial role of 4 energy metabolism related genes in the diagnosis and therapy of AD, providing a predictive model for AD diagnosis and a potential candidate drug. However, combining genetic risk factors, clinical laboratory parameters and incorporating wider population into future research will further fill the limitations of this study.
AUTHOR CONTRIBUTIONS
Hongqi Wang (Data curation; Formal analysis; Investigation; Methodology; Software; Validation; Visualization; Writing – original draft; Writing – review & editing); Jilai Li (Resources; Validation); Wenjun Tu (Data curation; Methodology); Zhiqun Wang (Data curation; Funding acquisition; Methodology; Validation); Yiming Zhang (Visualization; Collecting clinical samples); Lirong Chang (Formal analysis; Investigation; Methodology; Project administration; Supervision; Validation; Writing – review & editing); Yan Wu (Investigation; Methodology; Project administration; Supervision; Validation; Writing – review & editing); Xia Zhang (Conceptualization; Formal analysis; Funding acquisition; Methodology; Project administration; Software; Supervision; Validation; Visualization; Writing – original draft; Writing – review & editing).
ACKNOWLEDGMENTS
We are grateful to the GEO database, GeneCards, MSigDB, NetworkAnalyst, PubChem, RCSB PDB, AutoDock Vina and PyMol that made the data available, and all data obtained from these datasets kept to the rules for their usage and publication.
FUNDING
This work was supported by the Scientific Research Fund of Aerospace Center Hospital (YN202419, YN202307) and the Natural Science Foundation of Beijing Municipality (7222320).
CONFLICT OF INTEREST
The authors have no conflict of interest to report.
DATA AVAILABILITY
All data can be obtained from GEO database (https://www.ncbi.nlm.nih.gov/geo/), GeneCards database (http://www.genecards.org/), MSigDB (https://www.gsea-msigdb.org/gsea/msigdb), NetworkAnalyst database (https://www.networkanalyst.ca/), (DSigDB, https://dsigdb.tanlab.org/DSigDBv1.0/), PubChem (https://pubchem.ncbi.nlm.nih.gov/), RCSB PDB (https://www.rcsb.org/pdb), AutoDock Vina (https://autodock.scripps.edu/), PyMol software (https://pymol.org/2/).
SUPPLEMENTARY MATERIAL
[1] The supplementary material is available in the electronic version of this article: https://dx.doi.org/10.3233/JAD-240301.
REFERENCES
1. | 2023 Alzheimer’s disease facts and figures. Alzheimers Dement (2023) ; 19: : 1598–1695. |
2. | Damsgaard L , Janbek J , Laursen TM , et al. Mapping morbidity 10 years prior to a diagnosis of young onset Alzheimer’s disease. Alzheimers Dement (2024) ; 20: : 2373–2383. |
3. | Rabinovici GD , Carrillo MC , Apgar C , et al. Amyloid positron emission tomography and subsequent health care use among Medicare beneficiaries with mild cognitive impairment or dementia. JAMA Neurol (2023) ; 80: : 1166–1173. |
4. | Algeciras-Schimnich A and Bornhorst JA . Importance of cerebrospinal fluid (CSF) collection protocol for the accurate diagnosis of Alzheimer’s disease when using CSF biomarkers. Alzheimers Dement (2024) ; 20: : 3657–3658. |
5. | Schindler SE , Bollinger JG , Ovod V , et al. High-precision plasma beta-amyloid 42/40 predicts current and future brain amyloidosis. Neurology (2019) ; 93: : e1647–e1659. |
6. | De Meyer S , Vanbrabant J , Schaeverbeke JM , et al. Phospho-specific plasma p-tau181 assay detects clinical as well as asymptomatic Alzheimer’s disease. Ann Clin Transl Neurol (2022) ; 9: : 734–746. |
7. | Ashton NJ , Brum WS , Di Molfetta G , et al. Diagnostic accuracy of a plasma phosphorylated Tau 217 immunoassay for Alzheimer disease pathology. JAMA Neurol (2024) ; 81: : 255–263. |
8. | Ashton NJ , Puig-Pijoan A , Mila-Aloma M , et al. Plasma and CSF biomarkers in a memory clinic: Head-to-head comparison of phosphorylated tau immunoassays. Alzheimers Dement (2023) ; 19: : 1913–1924. |
9. | Foley KE , Winder Z , Sudduth TL , et al. Alzheimer’s disease and inflammatory biomarkers positively correlate in plasma in the UK-ADRC cohort. Alzheimers Dement (2024) ; 20: : 1374–1386. |
10. | Huber H , Blennow K , Zetterberg H , et al. Biomarkers of Alzheimer’s disease and neurodegeneration in dried blood spots-A new collection method for remote settings. Alzheimers Dement (2024) ; 20: : 2340–2352. |
11. | Perovnik M , Tang CC , Namias M , et al. Longitudinal changes in metabolic network activity in early Alzheimer’s disease. Alzheimers Dement (2023) ; 19: : 4061–4072. |
12. | Qureshi D , Collister J , Allen NE , et al. Association between metabolic syndrome and risk of incident dementia in UK Biobank. Alzheimers Dement (2024) ; 20: : 447–458. |
13. | Panyard DJ , McKetney J , Deming YK , et al. Large-scale proteome and metabolome analysis of CSF implicates altered glucose and carbon metabolism and succinylcarnitine in Alzheimer’s disease. Alzheimers Dement (2023) ; 19: : 5447–5470. |
14. | Nam MH , Ko HY , Kim D , et al. Visualizing reactive astrocyte-neuron interaction in Alzheimer’s disease using 11C-acetate and 18F-FDG. Brain (2023) ; 146: : 2957–2974. |
15. | Winkler EA , Nishida Y , Sagare AP , et al. GLUT1 reductions exacerbate Alzheimer’s disease vasculo-neuronal dysfunction and degeneration. Nat Neurosci (2015) ; 18: : 521–530. |
16. | Chen Z and Zhong C . Decoding Alzheimer’s disease from perturbed cerebral glucose metabolism: implications for diagnostic and therapeutic strategies. Prog Neurobiol (2013) ; 108: : 21–43. |
17. | Livingston NR , Calsolaro V , Hinz R , et al. Relationship between astrocyte reactivity, using novel (11)C-BU8 PET, and glucose metabolism, grey matter volume and amyloid load in cognitively impaired individuals. Mol Psychiatry (2022) ; 27: : 2019–2029. |
18. | Joo IL , Lam WW , Oakden W , et al. Early alterations in brain glucose metabolism and vascular function in a transgenic rat model of Alzheimer’s disease. Prog Neurobiol (2022) ; 217: : 102327. |
19. | Le Douce J , Maugard M , Veran J , et al. Impairment of glycolysis-derived l-serine production in astrocytes contributes to cognitive deficits in Alzheimer’s disease. Cell Metab (2020) ; 31: : 503–517 e508. |
20. | Horgusluoglu E , Neff R , Song WM , et al. Integrative metabolomics-genomics approach reveals key metabolic pathways and regulators of Alzheimer’s disease. Alzheimers Dement (2022) ; 18: : 1260–1278. |
21. | Andreyev AY , Yang H , Doulias PT , et al. Metabolic bypass rescues aberrant s-nitrosylation-induced TCA cycle inhibition and synapse loss in Alzheimer’s disease human neurons. Adv Sci (Weinh) (2024) ;e2306469. |
22. | Qian F , Kong W and Wang S . Exploring autophagy-related prognostic genes of Alzheimer’s disease based on pathway crosstalk analysis. Bosn J Basic Med Sci (2022) ; 22: : 751–771. |
23. | Yan R , Wang W , Yang W , et al. Mitochondria-related candidate genes and diagnostic model to predict late-onset Alzheimer’s disease and mild cognitive impairment. J Alzheimers Dis (2024) ; 99: : S299–S315. |
24. | Pei Y , Chen S , Zhou F , et al. Construction and evaluation of Alzheimer’s disease diagnostic prediction model based on genes involved in mitophagy. Front Aging Neurosci (2023) ; 15: : 1146660. |
25. | Zhao H , Wang J , Li Z , et al. Identification ferroptosis-related hub genes and diagnostic model in Alzheimer’s disease. Front Mol Neurosci (2023) ; 16: : 1280639. |
26. | Hu D , Mo X , Jihang L , et al. Novel diagnostic biomarkers of oxidative stress, immunological characterization and experimental validation in Alzheimer’s disease. Aging (Albany NY) (2023) ; 15: : 10389–10406. |
27. | Wang Y , Sun Y , Wang Y , et al. Identification of novel diagnostic panel for mild cognitive impairment and Alzheimer’s disease: findings based on urine proteomics and machine learning. Alzheimers Res Ther (2023) ; 15: : 191. |
28. | Lian P , Cai X , Wang C , et al. Identification of metabolism-related subtypes and feature genes in Alzheimer’s disease. J Transl Med (2023) ; 21: : 628. |
29. | Qiang YX , You J , He XY , et al. Plasma metabolic profiles predict future dementia and dementia subtypes: a prospective analysis of 274,160 participants. Alzheimers Res Ther (2024) ; 16: : 16. |
30. | Tao QQ , Cai X , Xue YY , et al. Alzheimer’s disease early diagnostic and staging biomarkers revealed by large-scale cerebrospinal fluid and serum proteomic profiling. Innovation (Camb) (2024) ; 5: : 100544. |
31. | Ferreiro AL , Choi J , Ryou J , et al. Gut microbiome composition may be an indicator of preclinical Alzheimer’s disease. Sci Transl Med eabo (2023) ; 15: : 2984. |
32. | Sperling RA , Donohue MC , Raman R , et al. Trial of solanezumab in preclinical Alzheimer’s disease. N Engl J Med (2023) ; 389: : 1096–1107. |
33. | Bateman RJ , Smith J , Donohue MC , et al. Two phase 3 trials of gantenerumab in early Alzheimer’s disease. N Engl J Med (2023) ; 389: : 1862–1876. |
34. | Wang H , Yan X , Zhang Y , et al. Mitophagy in Alzheimer’s disease: a bibliometric analysis from 2007 to 2022. J Alzheimers Dis Rep (2024) ; 8: : 101–128. |
35. | Zhang W , Zhang Y , Hu N , et al. Alzheimer’s disease-associated inflammatory pathways might contribute to osteoporosis through the interaction between PROK2 and CSF3. Front Neurol (2022) ; 13: : 990779. |
36. | Paranjpe MD , Taubes A and Sirota M . Insights into computational drug repurposing for neurodegenerative disease. Trends Pharmacol Sci (2019) ; 40: : 565–576. |
37. | Nam Y , Lucas A , Yun JS , et al. Development of complemented comprehensive networks for rapid screening of repurposable drugs applicable to new emerging disease outbreaks. J Transl Med (2023) ; 21: : 415. |
38. | Zang C , Zhang H , Xu J , et al. High-throughput target trial emulation for Alzheimer’s disease drug repurposing with real-world data. Nat Commun (2023) ; 14: : 8180. |
39. | Oliveros G , Wallace CH , Chaudry O , et al. Repurposing ibudilast to mitigate Alzheimer’s disease by targeting inflammation. Brain (2023) ; 146: : 898–911. |
40. | Azmi MB , Ahmed A , Ahmed TF , et al. Transcript-level in silico analysis of Alzheimer’s disease-related gene biomarkers and their evaluation with bioactive flavonoids to explore therapeutic interactions. ACS Omega (2023) ; 8: : 40695–40712. |
41. | He X , Zhao L , Zhong W , et al. Insight into potent leads for alzheimer’s disease by using several artificial intelligence algorithms. Biomed Pharmacother (2020) ; 129: : 110360. |
42. | Ramanan VK , Gebre RK , Graff-Radford J , et al. Genetic risk scores enhance the diagnostic value of plasma biomarkers of brain amyloidosis. Brain (2023) ; 146: : 4508–4519. |
43. | Sood S , Gallagher IJ , Lunnon K , et al. A novel multi-tissue RNA diagnostic of healthy ageing relates to cognitive health status. Genome Biol (2015) ; 16: : 185. |
44. | Mu T , Li H and Li X . Prognostic implication of energy metabolism-related gene signatures in lung adenocarcinoma. Front Oncol (2022) ; 12: : 867470. |
45. | Langfelder P and Horvath S . WGCNA: an R package for weighted correlation network analysis. BMC Bioinformatics (2008) ; 9: : 559. |
46. | Liberzon A , Birger C , Thorvaldsdottir H , et al. The Molecular Signatures Database (MSigDB) hallmark gene set collection. Cell Syst (2015) ; 1: : 417–425. |
47. | Hanzelmann S , Castelo R and Guinney J . GSVA: gene set variation analysis for microarray and RNA-seq data. BMC Bioinformatics (2013) ; 14: : 7. |
48. | Zhou G , Soufan O , Ewald J , et al. NetworkAnalyst 3.0: a visual analytics platform for comprehensive gene expression profiling and meta-analysis. Nucleic Acids Res (2019) ; 47: : W234–w241. |
49. | Castro-Mondragon JA , Riudavets-Puig R , Rauluseviciute I , et al. JASPAR the 9th release of the open-access database of transcription factor binding profiles. Nucleic Acids Res (2022) ; 50: : D165–D173. |
50. | Otasek D , Morris JH , Boucas J , et al. Cytoscape Automation: empowering workflow-based network analysis. Genome Biol (2019) ; 20: : 185. |
51. | Li JH , Liu S , Zhou H , et al. starBase v2.0: decoding miRNA-ceRNA, miRNA-ncRNA and protein-RNA interaction networks from large-scale CLIP-Seq data. Nucleic Acids Res (2014) ; 42: : D92–D97. |
52. | Yoo M , Shin J , Kim J , et al. DSigDB: drug signatures database for gene set analysis. Bioinformatics (2015) ; 31: : 3069–3071. |
53. | Berman HM , Westbrook J , Feng Z , et al. The Protein Data Bank. Nucleic Acids Res (2000) ; 28: : 235–242. |
54. | Eberhardt J , Santos-Martins D , Tillack AF , et al. AutoDock Vina 1.2.0: New docking methods, expanded force field, and Python bindings. J Chem Inf Model (2021) ; 61: : 3891–3898. |
55. | Bender BJ , Gahbauer S , Luttens A , et al. A practical guide to large-scale docking. Nat Protoc (2021) ; 16: : 4799–4832. |
56. | Holland PW , Booth HA and Bruford EA . Classification and nomenclature of all human homeobox genes. BMC Biol (2007) ; 5: : 47. |
57. | Wang H , Han X and Gao S . Identification of potential biomarkers for pathogenesis of Alzheimer’s disease. Hereditas (2021) ; 158: : 23. |
58. | Zhuang X , Zhang G , Bao M , et al. Development of a novel immune infiltration-related diagnostic model for Alzheimer’s disease using bioinformatic strategies. Front Immunol (2023) ; 14: : 1147501. |
59. | Fenouille N , Bassil CF , Ben-Sahra I , et al. The creatine kinase pathway is a metabolic vulnerability in EVI1-positive acute myeloid leukemia. Nat Med (2017) ; 23: : 301–313. |
60. | Li HB , Wang RX , Jiang HB , et al. Mitochondrial ribosomal protein L10 associates with cyclin B1/Cdk1 activity and mitochondrial function. DNA Cell Biol (2016) ; 35: : 680–690. |
61. | Rapino F , Delaunay S , Rambow F , et al. Codon-specific translation reprogramming promotes resistance to targeted therapy. Nature (2018) ; 558: : 605–609. |
62. | Liu J , Ma T , Gao M , et al. Proteomic characterization of proliferation inhibition of well-differentiated laryngeal squamous cell carcinoma cells under below-background radiation in a deep underground environment. Front Public Health (2020) ; 8: : 584964. |
63. | Rosario FJ , Powell TL , Gupta MB , et al. mTORC1 transcriptional regulation of ribosome subunits, protein synthesis, and molecular transport in primary human trophoblast cells. Front Cell Dev Biol (2020) ; 8: : 583801. |
64. | Hartnell IJ , Woodhouse D , Jasper W , et al. Glial reactivity and T cell infiltration in frontotemporal lobar degeneration with tau pathology. Brain (2024) ; 147: : 590–606. |
65. | Su L , Li R , Zhang Z , et al. Identification of altered exosomal microRNAs and mRNAs in Alzheimer’s disease. Ageing Res Rev (2022) ; 73: : 101497. |
66. | Petersen RC , Lopez O , Armstrong MJ , et al. Practice guideline update summary: Mild cognitive impairment: Report of the Guideline Development, Dissemination, and Implementation Subcommittee of the American Academy of Neurology. Neurology (2018) ; 90: : 126–135. |
67. | Du F , Yu Q , Yan S , et al. PINK1 signalling rescues amyloid pathology and mitochondrial dysfunction in Alzheimer’s disease. Brain (2017) ; 140: : 3233–3251. |
68. | Fang EF , Hou Y , Palikaras K , et al. Mitophagy inhibits amyloid-beta and tau pathology and reverses cognitive deficits in models of Alzheimer’s disease. Nat Neurosci (2019) ; 22: : 401–412. |
69. | Abdelhak A , Foschi M , Abu-Rumeileh S , et al. Blood GFAP as an emerging biomarker in brain and spinal cord disorders. Nat Rev Neurol (2022) ; 18: : 158–172. |
70. | Covarrubias AJ , Perrone R , Grozio A , et al. NAD(+) metabolism and its roles in cellular processes during ageing. Nat Rev Mol Cell Biol (2021) ; 22: : 119–141. |
71. | Johnson ECB , Dammer EB , Duong DM , et al. Large-scale proteomic analysis of Alzheimer’s disease brain and cerebrospinal fluid reveals early changes in energy metabolism associated with microglia and astrocyte activation. Nat Med (2020) ; 26: : 769–780. |
72. | Yang S , Niou ZX , Enriquez A , et al. NMNAT2 supports vesicular glycolysis via NAD homeostasis to fuel fast axonal transport. Mol Neurodegener (2024) ; 19: : 13. |
73. | Liu S , Zhong H , Zhu J , et al. Identification of blood metabolites associated with risk of Alzheimer’s disease by integrating genomics and metabolomics data. Mol Psychiatry 2024. |
74. | Cao W , Ji Z , Zhu S , et al. Bioinformatic identification and experiment validation reveal 6 hub genes, promising diagnostic and therapeutic targets for Alzheimer’s disease. BMC Med Genomics (2024) ; 17: : 6. |
75. | Stroud DA , Surgenor EE , Formosa LE , et al. Accessory subunits are integral for assembly and function of human mitochondrial complex I. Nature (2016) ; 538: : 123–126. |
76. | Calvo-Rodriguez M , Kharitonova EK , Snyder AC , et al. Real-time imaging of mitochondrial redox reveals increased mitochondrial oxidative stress associated with amyloid beta aggregates in vivo in a mouse model of Alzheimer’s disease. Mol Neurodegener (2024) ; 19: : 6. |
77. | Swerdlow RH . Mitochondria and mitochondrial cascades in Alzheimer’s disease. J Alzheimers Dis (2018) ; 62: : 1403–1416. |
78. | Huttula S , Vayrynen H , Helisalmi S , et al. NDUFA1 Gly32Arg variant in early-onset dementia. Neurobiol Aging (2022) ; 114: : 113–116. |
79. | Li X , Wang H , Long J , et al. Systematic analysis and biomarker study for Alzheimer’s disease. Sci Rep (2018) ; 8: : 17394. |
80. | Fumasoni I , Meani N , Rambaldi D , et al. Family expansion and gene rearrangements contributed to the functional specialization of PRDM genes in vertebrates. BMC Evol Biol (2007) ; 7: : 187. |
81. | Di Zazzo E , De Rosa C , Abbondanza C , et al. PRDM proteins: molecular mechanisms in signal transduction and transcriptional regulation. Biology (Basel) (2013) ; 2: : 107–141. |
82. | Ivanochko D , Halabelian L , Henderson E , et al. Direct interaction between the PRDM3 and PRDM16 tumor suppressors and the NuRD chromatin remodeling complex. Nucleic Acids Res (2019) ; 47: : 1225–1238. |
83. | Hoyt PR , Bartholomew C , Davis AJ , et al. The Evi1 proto-oncogene is required at midgestation for neural, heart, and paraxial mesenchyme development. Mech Dev (1997) ; 65: : 55–70. |
84. | Gilbert J , Shu S , Yang X , et al. beta-Amyloid triggers aberrant over-scaling of homeostatic synaptic plasticity. Acta Neuropathol Commun (2016) ; 4: : 131. |
85. | Suzuki M , Tezuka K , Handa T , et al. Upregulation of ribosome complexes at the blood-brain barrier in Alzheimer’s disease patients. J Cereb Blood Flow Metab (2022) ; 42: : 2134–2150. |
86. | Caracausi M , Piovesan A , Antonaros F , et al. Systematic identification of human housekeeping genes possibly useful as references in gene expression studies. Mol Med Rep (2017) ; 16: : 2397–2410. |
87. | Feldheim J , Kessler AF , Schmitt D , et al. Ribosomal protein S27/metallopanstimulin-1 (RPS27) in glioma-a new disease biomarker? Cancers (Basel) (2020) ;12. |
88. | De Meyer S , Blujdea ER , Schaeverbeke J , et al. Longitudinal associations of serum biomarkers with early cognitive, amyloid and grey matter changes. Brain (2024) ; 147: : 936–948. |
89. | Shen XN , Huang SY , Cui M , et al. Plasma glial fibrillary acidic protein in the Alzheimer disease continuum: relationship to other biomarkers, differential diagnosis, and prediction of clinical progression. Clin Chem (2023) ; 69: : 411–421. |
90. | Serrano-Pozo A , Das S and Hyman BT . APOE and Alzheimer’s disease: advances in genetics, pathophysiology, and therapeutic approaches. Lancet Neurol (2021) ; 20: : 68–80. |
91. | Caiment F , Wolters J , Smit E , et al. Valproic acid promotes mitochondrial dysfunction in primary human hepatocytes in vitro; impact of C/EBPalpha-controlled gene expression. Arch Toxicol (2020) ; 94: : 3463–3473. |
92. | Grunig D , Szabo L , Marbet M , et al. Valproic acid affects fatty acid and triglyceride metabolism in HepaRG cells exposed to fatty acids by different mechanisms. Biochem Pharmacol (2020) ; 177: : 113860. |
93. | Diniz BS , Teixeira AL , Cao F , et al. History of bipolar disorder and the risk of dementia: a systematic review and meta-analysis. Am J Geriatr Psychiatry (2017) ; 25: : 357–362. |
94. | Zhao L , Zhu L and Guo X . Valproic acid attenuates Abeta(25-35)-induced neurotoxicity in PC12 cells through suppression of mitochondria-mediated apoptotic pathway. Biomed Pharmacother (2018) ; 106: : 77–82. |
95. | Marsh J , Bagol SH , Williams RSB , et al. Synapsin I phosphorylation is dysregulated by beta-amyloid oligomers and restored by valproic acid. Neurobiol Dis (2017) ; 106: : 63–75. |
96. | Lott AD , McElroy SL and Keys MA . Valproate in the treatment of behavioral agitation in elderly patients with dementia. J Neuropsychiatry Clin Neurosci (1995) ; 7: : 314–319. |
97. | Tariot PN , Schneider LS , Cummings J , et al. Chronic divalproex sodium to attenuate agitation and clinical progression of Alzheimer disease. Arch Gen Psychiatry (2011) ; 68: : 853–861. |
98. | Dolder CR , Nealy KL and McKinsey J . Valproic acid in dementia: does an optimal dose exist? J Pharm Pract (2012) ; 25: : 142–150. |


