
Classifying Alzheimer’s Disease Neuropathology Using Clinical and MRI Measurements
Abstract
Background:
Computer-aided machine learning models are being actively developed with clinically available biomarkers to diagnose Alzheimer’s disease (AD) in living persons. Despite considerable work with cross-sectional in vivo data, many models lack validation against postmortem AD neuropathological data.
Objective:
Train machine learning models to classify the presence or absence of autopsy-confirmed severe AD neuropathology using clinically available features.
Methods:
AD neuropathological status are assessed at postmortem for participants from the National Alzheimer’s Coordinating Center (NACC). Clinically available features are utilized, including demographics, Apolipoprotein E(APOE) genotype, and cortical thicknesses derived from ante-mortem MRI scans encompassing AD meta regions of interest (meta-ROI). Both logistic regression and random forest models are trained to identify linearly and nonlinearly separable features between participants with the presence (N = 91, age-at-MRI = 73.6±9.24, 38 women) or absence (N = 53, age-at-MRI = 68.93±19.69, 24 women) of severe AD neuropathology. The trained models are further validated in an external data set against in vivo amyloid biomarkers derived from PET imaging (amyloid-positive: N = 71, age-at-MRI = 74.17±6.37, 26 women; amyloid-negative: N = 73, age-at-MRI = 71.59±6.80, 41 women).
Results:
Our models achieve a cross-validation accuracy of 84.03% in classifying the presence or absence of severe AD neuropathology, and an external-validation accuracy of 70.14% in classifying in vivo amyloid positivity status.
Conclusions:
Our models show that clinically accessible features, including APOE genotype and cortical thinning encompassing AD meta-ROIs, are able to classify both postmortem confirmed AD neuropathological status and in vivo amyloid status with reasonable accuracies. These results suggest the potential utility of AD meta-ROIs in determining AD neuropathological status in living persons.
INTRODUCTION
Alzheimer’s disease (AD) is the most common form of age-related dementia. According to the Alzheimer’s Association report, an estimated 6.5 million Americans are living with AD dementia today, and this number is projected to increase to 13.8 million by 2060 [1]. Without effective treatment, AD will bring tremendous healthcare, economic, social, and emotional burdens to patients, families, communities, and society globally [2]. The recent approvals of two disease modifying therapies are particularly promising in early AD [3, 4], making accurate and early diagnosis of AD a critical step for potential treatment and to promote public health.
Historically, the diagnosis of AD is made based on observable clinical symptoms and the systematic exclusion of other potential dementia etiologies, and with confirmation through postmortem brain autopsy [5]. There exists a discrepancy between the clinical and pathological AD diagnoses, as approximately 10% to 30% clinical AD cases do not exhibit typical AD neuropathological changes at autopsy [6, 7]. As a result, inclusion of AD-specific biomarkers to inform and refine clinical diagnosis has been sought. In the National Institute on Aging and Alzheimer’s Association (NIA-AA) Research Framework, the diagnosis of AD has shifted from syndromal towards biological constructs that are reflective of AD hallmark pathologies [6]. With development and validation of in vivo biomarkers, quantifying the extracellular amyloid-β protein deposition (A), the intraneuronal pathological tau protein accumulation (T), and neurodegeneration (N) has led to formulation of the ATN framework for the biological characterization of AD along a disease continuum.
To date, studies have developed computer aided machine learning models to predict AD diagnoses and to identify AD-specific biomarkers [8–10]. However, relatively fewer efforts have been made to validate these trained models against data from neuropathologically confirmed AD cases. Instead, the neuropathological components used in these models were primarily represented by the qualification of amyloid and tau status using positron emission imaging (PET) with radiolabeled tracers [11, 12], or more recently, using ultra-sensitive measurements of molecules from central nervous (cerebrospinal, CSF) or peripheral (blood) fluids [11]. The invasive nature of both PET and CSF technologies, the high cost of PET imaging, and the evolving understanding of measurement properties of fluid-based measures, all have motivated the current research to seek non-invasive and clinically available features to facilitate the determination of AD neuropathological status in living persons.
Structural magnetic resonance imaging (MRI) is the most common technique for assessing neurodegeneration in AD within the ATN framework, as structural MRI can characterize the severity and progression of brain atrophy throughout the AD continuum [13]. Moreover, MRI is non-invasive, generally well-tolerated, replicable, and widely accessible in many clinical settings and large-scale legacy databases [14, 15]. In contrast to fluid-based biomarkers, MRI provides additional information about affected brain regions and holds the promise of being more AD-specific than some of the emerging fluid biomarkers [16]. Therefore, the primary objectives of this paper are 1) to develop a methodology that could facilitate the classification of the presence or absence of severe AD neuropathology based on autopsy confirmed cases with clinically available MRI features, and 2) to identify clinical features and neurodegeneration patterns that are both sensitive and specific to AD neuropathology.
Structural MRI-based estimates of hippocampal and entorhinal cortical volumes were among the first measures of neurodegeneration proposed in AD and have frequently been used in both clinical and research settings [11, 17, 18]. More specifically, structural MRI estimates of hippocampal atrophy are correlated with memory decline in living subjects, and with pathological tau accumulation in postmortem AD subjects [19–21]. However, hippocampal atrophy is also commonly observed in subjects with other neurodegenerative pathologies, and is not specific to AD [5, 22]. From a technical perspective, volumetric measurements are also biased by the total intracranial volume, and there are multiple quantitative approaches to adjust volumetric estimates for differences in head-size. Thus, despite the ease of use, these limitations undermine the clinical utility of volumetric measurements in quantifying neurodegeneration along the broad AD continuum.
Cortical thickness is another biologically meaningful and reliable measure computed from structural MRI. Thickness measurements are less biased by on head size than volume [23]. Cortical thinning in multiple regions of interest (ROI) has been reported across the entire AD continuum, even during the preclinical AD stage [11]; thus, cortical thinning in these ROIs appears particularly useful in identifying early neurodegenerative changes. In addition, spatial patterns of regional atrophy might also be sensitive to the typical localization of different types of neurodegenerative disorders, providing increased specificity [22, 24].
When methods for automatically quantifying in vivo thickness were introduced (e.g., FreeSurfer; https://surfer.nmr.mgh.harvard.edu/), regional thickness values of the entorhinal cortex, medial and inferior temporal gyrus attracted significant attention as measurements of disease severity and progression [25–27]. Cortical signature regions of AD, encompassing above-mentioned regions in addition to the fusiform gyrus, para-hippocampal gyrus, inferior parietal cortex and precuneus, have been further identified to predict pathological changes, clinical impairment, cognitive declines, and cerebral blood flow variations in subjects along the AD continuum [13, 22, 23, 27, 28]. FreeSurfer derived thicknesses of these regions, which constitute AD meta-ROIs, convey 1) top diagnostic separability between AD and CN subjects, and 2) clinical impairment associations in subjects along the AD continuum [23, 29, 30]. Taken together, cortical thickness measurements of AD-signature meta-ROIs are promising candidates to quantify AD-specific neurodegeneration within the ATN framework, and their predictive ability warrants further exploration.
In this study, we aimed to classify AD neuropathological status using clinically accessible features. We hypothesized that structural MRI-derived cortical thickness measurements from AD meta-ROIs, together with the apolipoprotein E (APOE) genotype and demographic variables, would accurately classify the presence or absence of severe AD neuropathology, and thus could assist in determining AD neuropathological status in living persons. Using subjects with both postmortem neuropathological data and an antemortem MRI scan, we trained machine learning models to classify the presence or absence of severe AD neuropathology with clinically accessible features. We expected that development of these machine learning models would facilitate the identification of neurodegenerative changes specific to AD neuropathology and could assist in determining AD pathological status in living persons when the clinical etiology is uncertain and other AD biomarkers are unavailable.
MATERIALS AND METHODS
Primary data set: NACC participants
NACC participants. Data from the National Alzheimer’s Coordinating Center (NACC, https://naccdata.org/) database were obtained, including the NACC Uniform Data Set (UDS), MRI Data Set and Neuropathology Data Set [31–33]. The NACC was established in collaboration with more than 42 previous and current Alzheimer’s Disease Research Centers (ADRCs) throughout the U.S. over more than 20 years [14]. Data were collected by each ADRC and the study was approved by each ADRC site’s local Institutional Review Boards.
Figure 1 details our NACC sample inclusion/exclusion process. We started with NACC participants that had both postmortem neuropathological data in NACC-neuropathology files and at least one antemortem T1-weighted MRI scan listed under NACC-imaging files. This inclusion criteria led to a sample of 560 participants (Fig. 1).
Fig. 1
Inclusion/exclusion flow chart. NACC Neuropathology Data Set variables NPADNC, NPLBOD, NPFTDTDP, and NPFTDTAU were utilized to evaluate AD, Lewy body, Frontotemporal lobar degeneration with TPD-43-immunoreactive pathology (FTLD-TDP), and FTLD-tau pathologies, respectively.
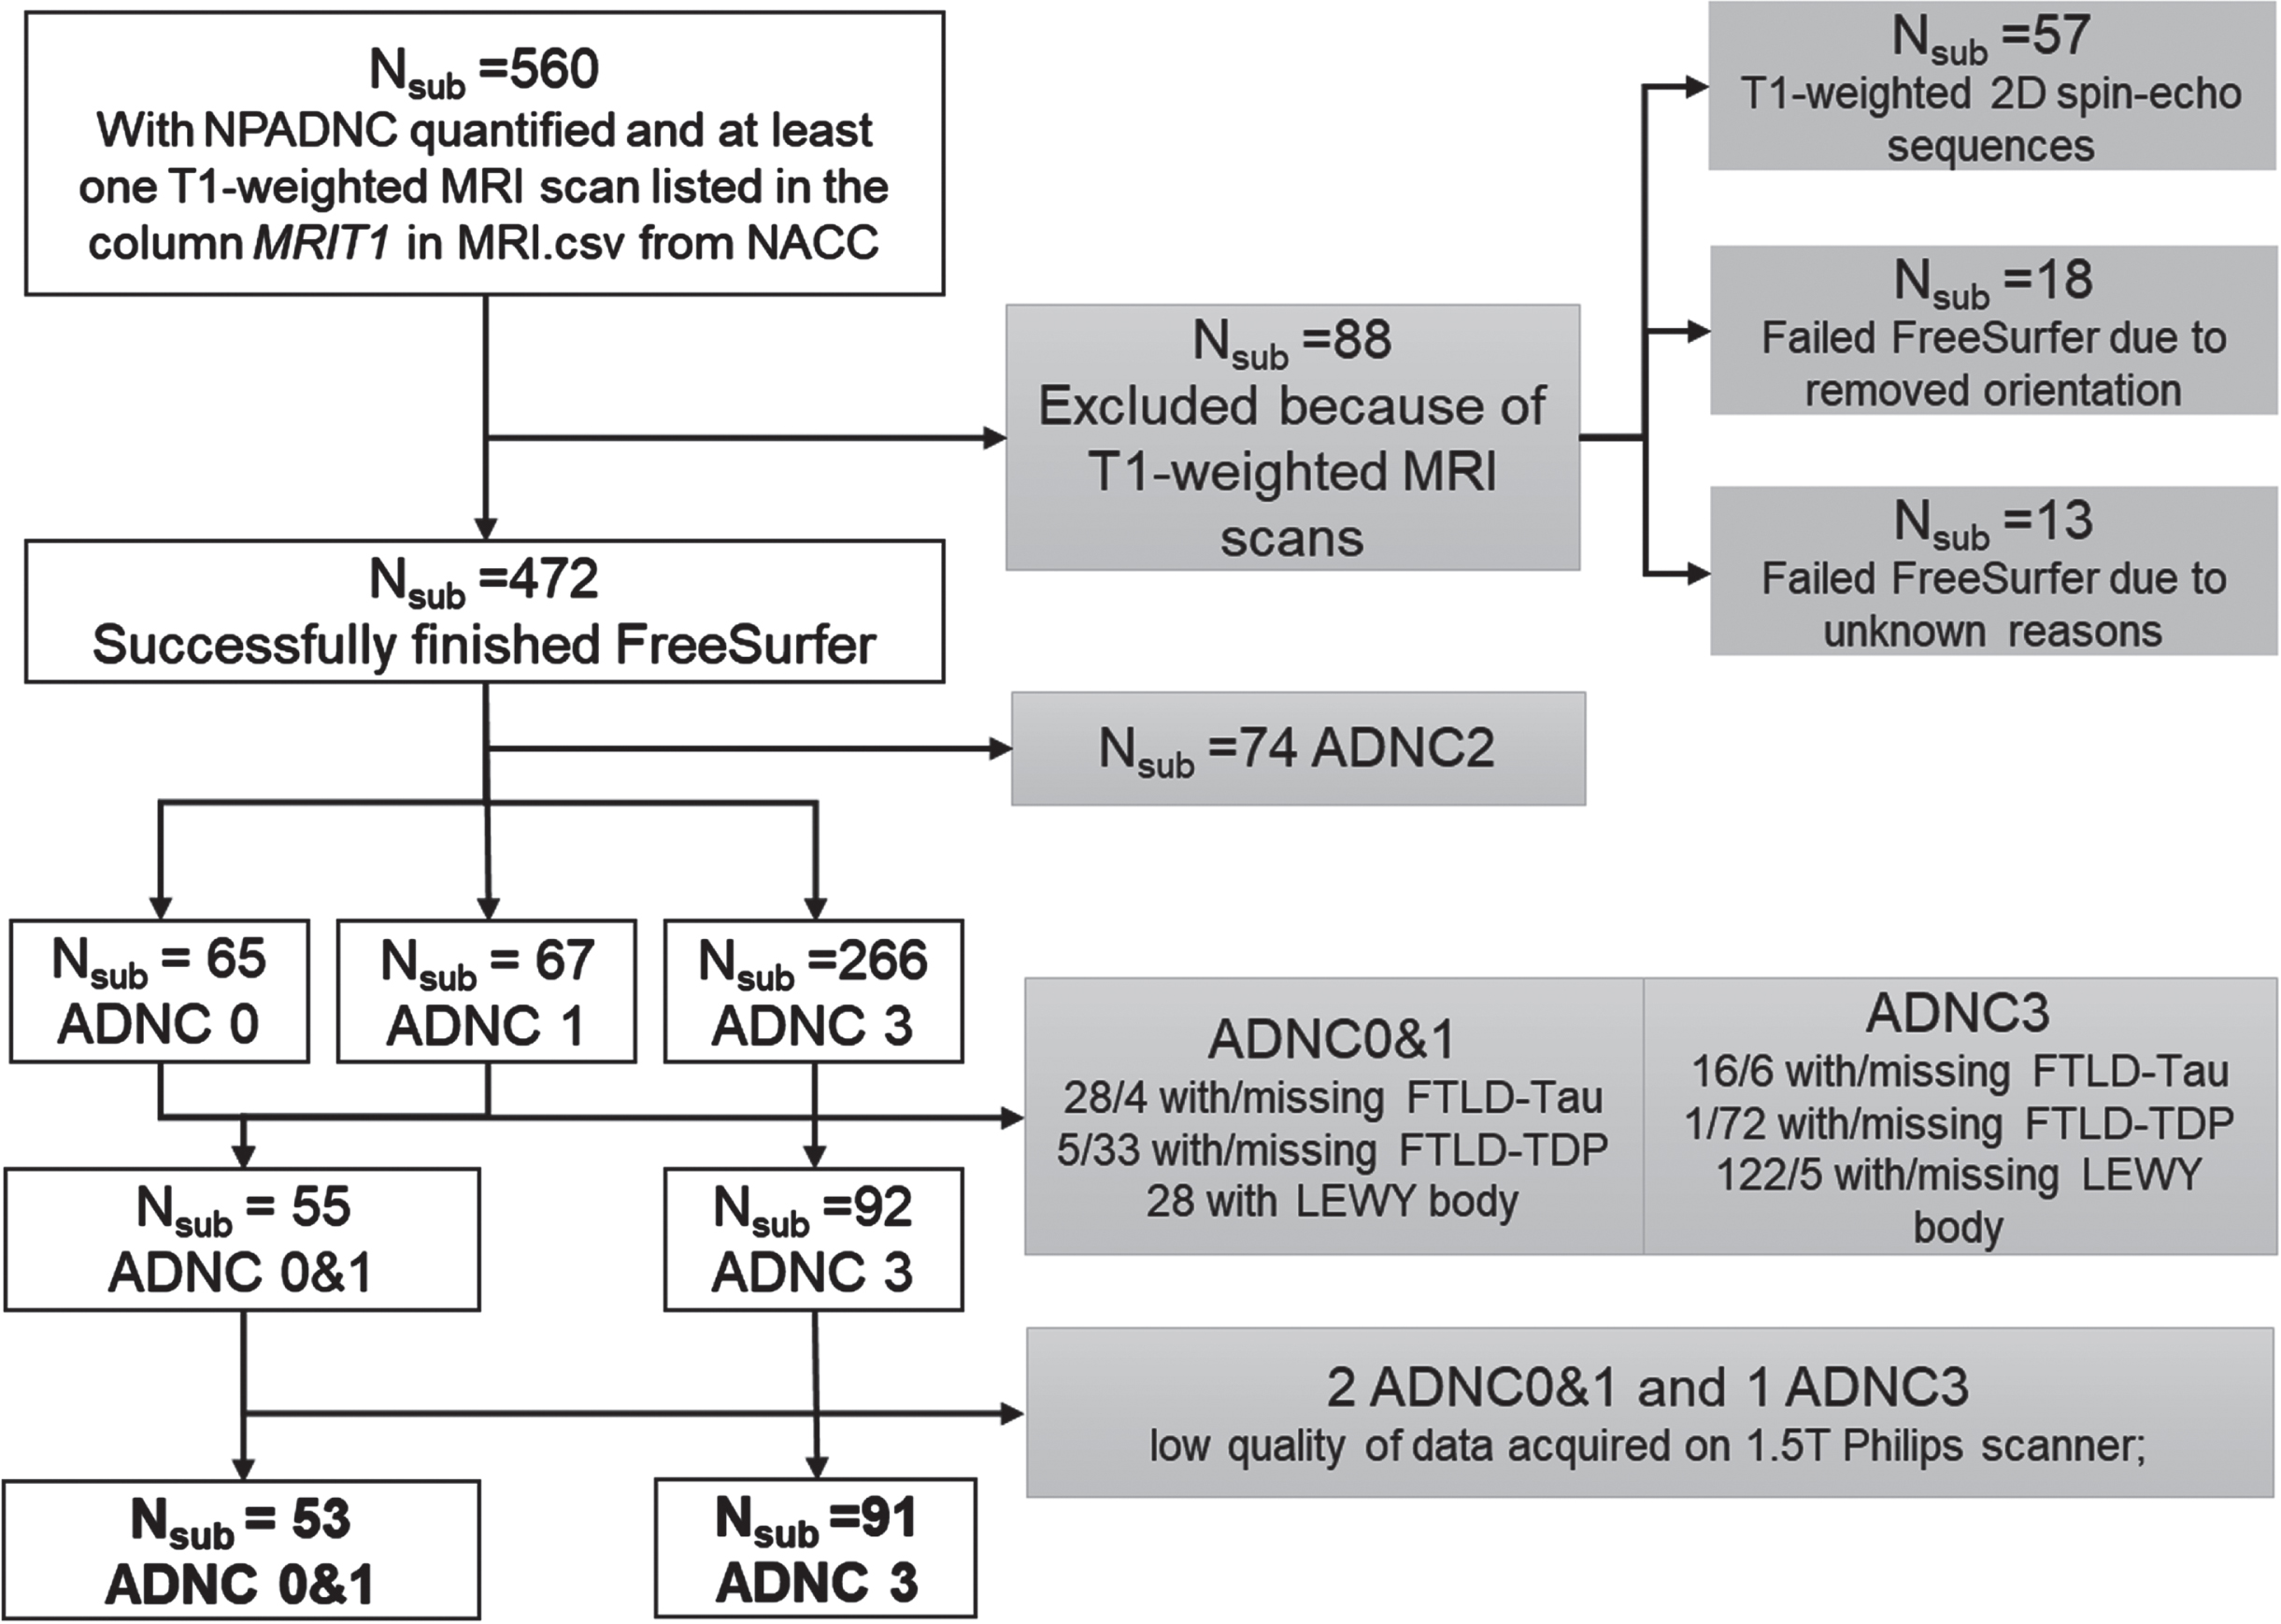
AD neuropathological staging in NACC is based on NIA-AA guidelines [6]. From the NACC neuropathological data set, we utilized the NIA-AA Alzheimer’s Disease Neuropathologic Change (ADNC) score to represent the severity/status of participants’ AD neuropathology [32, 34]. Based on ADNC scores (i.e., NPADNC variable in NACC neuropathology data set), participants were staged into 4 groups: no AD neuropathology (ADNC0), low AD neuropathology (ADNC1), intermediate AD neuropathology (ADNC2), and severe AD neuropathology (ADNC3).
We focused on participants in the ADNC0, ADNC1, and ADNC3 groups, and excluded participants with Lewy body, frontotemporal lobar degeneration with TPD-43-immunoreactive pathology (FTLD-TDP), and FTLD-tau pathologies to create homogeneous groups to test our hypothesis of identifying the presence or absence of severe AD neuropathology (Fig. 1). We did not exclude participants based on vascular changes due to the high prevalence in all ADNC groups (>90%). In addition, because TDP43 pathology was assessed only more recently on a limited number of participants in NACC, we did not exclude any participants based on co-occurrence with TDP-43 pathology.
We utilized participants with ADNC3 to represent a group with severe AD neuropathology (ADNC3). We combined ADNC0 and ADNC1 groups (ADNC0&1) to 1) represent a real-world group with no or low AD neuropathology, as both amyloid and tau proteins would accumulate during aging; and 2) to increase our sample-size and boost the statistical power.
NACC MRI data collection and process. DICOM images of T1-weighted MRI scans for 560 participants were obtained from the NACC MRI data set [14]. As these T1-weighted MRI scans were collected on a variety of scanners at each ADRC, we obtained scanner field strength, scanner manufacturer, and scanner protocols from the DICOM header of each scan. Information on the implementation inversion recovery (IR) was specifically obtained as it could be the major difference among scans to have an effect on grey (GM) and white matter (WM) contrast [35] that subsequently affects thickness estimations. Scans from 57 participants were T1-weighted 2D spin-echo sequences and therefore were excluded from the following analyses (Fig. 1), and the maximum acceptable slice thickness and in-plane resolution for T1-weighted MRI were 1.5 mm and 1.5 mm×1.5 mm, respectively.
After preprocessing, T1-weighted MRI images for each participant were analyzed using the FreeSurfer 6.0 processing pipeline [25]. A subject-specific anatomical labeling from the Desikan-Killiany atlas [26] was generated, yielding 68 cortical regions and 12 sub-cortical ROIs for every participant. Thickness measures of 68 cortical regions were calculated for each participant.
MRI data quality control. We excluded 31 participants from the study due to failed FreeSurfer processes. Specifically, 18 participants were excluded because their scans lacked orientation information leading to failed Talairach registrations, while 13 participants were excluded since their scan failed FreeSurfer for unknown reasons (Fig. 1).
For scans that successfully finished the FreeSurfer 6.0 pipeline, we utilized the fsqc toolbox in Python [36] to perform the quality control (QC) step. We focused on fsqc generated 1) signal-to-noise ratio (SNR) for WM and GM on FreeSurfer normalized norm.mgz file (wm_snr_norm and gm_snr_norm), and 2) WM-to-GM contrast SNR ratio in the left and right hemisphere (con_lh_snr and con_rh_snr), as our main FreeSurfer QC matrices.
We utilized a data-driven approach to assess the data quality using QC matrices. First, we conducted a repeated measures analysis of variance (rmANOVA) to determine if QC values were significantly different among scanner types and protocols (Supplementary Material A). In addition, to further evaluate if different scanner types and protocols could introduce significant changes to FreeSurfer outputs, we performed the same rmANOVA on cortical thickness measures across different scanner types and protocols in the ADNC0 group alone (i.e., those whose structure was least affected by disease pathology; Supplementary Material A). We removed any scans that produced extreme QC values and cortical thickness measures from our analyses.
We observed that scanner type or protocol does not significantly affect the WM or GM signal-to-noise ratio (SNR), but significantly affect the WM-to-GM contrast SNR (Supplementary Material A). Therefore, scanner type and scanning protocols were used as covariate features in our following analyses. For the thickness measures, we observed that scans collected on 1.5T Philips scanner generated significantly lower values than other scanners. Therefore, we removed participants with MRI data collected on 1.5T Philips scanner from both groups and included scanner type and scanning protocols as covariates in our analyses.
Final samples. Collectively, our final sample included 53 participants with ADNC0&1 and 91 participants with ADNC3 (Fig. 1). Their demographics and genetic information including sex, years of education, race APOE genotype, age, and diagnoses at the time of MRI scan, and time differences from MRI scan to postmortem neuropathology were obtained from the NACC and reported in Table 1A. Sample characteristics regarding comorbidities are reported in Table 1C.
Table 1
Demographic comparisons between the no or low AD pathology group (ADNC0&1) and severe AD pathology group (ADNC3) in NACC participants (A) and between amyloid positive and negative groups in CNTN participants (B). Comorbidities of NACC participants are listed in (C). Variables from NACC Neuropathology Data Set used to evaluate the presence or absence of each pathology are listed in thebracket
| A. NACC data | No or low AD pathology (ADNC0&1) | Severe AD pathology (ADNC3) | Differences (p-values) |
| Number of participants | 53 | 91 | |
| Sex | 29 men | 53 men | 0.68 |
| 24 women | 38 women | ||
| Years of education | 14.60±3.84 | 16.04±9.21 | 0.28 |
| Race | 49 White | 90 White | 0.04 |
| 4 African American | 1 African American | ||
| APOE genotype | 11 e2e3 | 2 e2e3 | <0.001 |
| 1 e2e4 | 3 e2e4 | ||
| 32 e3e3 | 25 e3e3 | ||
| 4 e3e4 | 45 e3e4 | ||
| 1 e4e4 | 11 e4e4 | ||
| 4 unknown | 5 unknown | ||
| Age at first MRI | 68.93±19.69 | 73.60±9.24 | 0.06 |
| Diagnosis at first MRI | 25 CN | 3 CN | <0.001 |
| 5 MC | 1 MC | ||
| 13 MCI | 23 MCI | ||
| 10 Dementia | 64 Dementia | ||
| Time from first MRI to pathology | 6.23±3.81 | 6.82±2.83 | 0.29 |
| First MRI field strength | 27 1.5T | 27 1.5T | 0.01 |
| 26 3.0T | 64 3.0T | ||
| First MRI scanner | 33 GE | 64 GE | 0.02 |
| 5 Philips | 0 Philips | ||
| 13 Siemens | 27 Siemens | ||
| First MRI Implementation of IR | 25 without | 15 without | <0.001 |
| 28 with | 76 with | ||
| con_snr_lh | 2.81±0.43 | 2.73±0.32 | 0.22 |
| con_snr_rh | 2.81±0.42 | 2.75±0.32 | 0.35 |
| B. CNTN data | Amyloid negative | Amyloid positive | Differences (p-values) |
| Number of subjects | 73 | 71 | |
| Composite SUVR (normalized to whole-cerebellum) | 0.99±0.05 | 1.44±0.15 | <0.001 |
| Sex | 32 Men | 45 Men | 0.02 |
| 41 Women | 26 Women | ||
| Years of education | 15.90±2.68 | 15.51±2.69 | 0.38 |
| Race | 65 White | 67 White | 0.13 |
| 4 African American | 1 African American | ||
| 4 Asian | 1 Asian | ||
| 2 American Indian/Alaska Native | |||
| APOE genotype | 1 e2e2 | 1 e2e4 | <0.001 |
| 7 e2e3 | 1 e2e3 | ||
| 1 e2e4 | 15 e3e3 | ||
| 42 e3e3 | 37 e3e4 | ||
| 10 e3e4 | 10 e4e4 | ||
| 2 e4e4 | 7 unknown | ||
| 10 unknown | |||
| Age at first MRI | 71.59±6.80 | 74.17±6.37 | 0.02 |
| Diagnosis at first MRI | 43 CN | 11 CN | <0.001 |
| 24 MCI | 43 MCI | ||
| 6 AD | 17 AD | ||
| All 3T MRI; imaging protocol with inversion recovery pulse sequence; concurrent MRI and PET | |||
| C. NACC Neuropathology (Variables in neuropathology data set) | No or low AD pathology (ADNC0&1) | Severe AD pathology (ADNC3) | |
| Vascular changes (NACCVASC) | 6 without | 0 without | |
| 47 with | 91 with | ||
| Lewy body (NPLBOD) | 53 without | 91 without | |
| FTLD-TDP (NPFTDTDP) | 53 without | 91 without | |
| FTLD-tau (NPFTDTAU) | 53 without | 91 without | |
| TDP43-spinal cord (NPTDPA) | 23 without | 11 without | |
| 1 with | 0 with | ||
| 29 not assessed | 80 not assessed | ||
| TDP43-amygdala (NPTDPB) | 44 without | 45 without | |
| 3 with | 21 with | ||
| 6 not assessed | 25 not assessed | ||
| TDP43-hippocampus (NPTDPC) | 48 without | 52 without | |
| 3 with | 22 with | ||
| 2 not assessed | 17 not assessed | ||
| TDP43-temporal cortex (NPTDPD) | 47 without | 48 without | |
| 3 with | 20 with | ||
| 3 not assessed | 23 not assessed | ||
| TDP43-neocortex (NPTDPE) | 49 without | 59 without | |
| 1 with | 6 with | ||
| 3 not assessed | 26 not assessed | ||
con_snr_lh, white-matter to grey-matter contrast signal-to-noise ratio in the left hemisphere; con_snr_rh, white-matter to grey-matter contrast signal-to-noise ratio in the right hemisphere; IR, inversion recovery.
Replication data set: CNTN participants
We utilized an independent, locally collected, convenience sample from the Center for Neurodegeneration and Translational Neuroscience (CNTN, https://nevadacntn.org/) as a validation data set. All CNTN participants were recruited at Cleveland Clinic Lou Ruvo Center for Brain Health Las Vegas, Nevada. The CNTN study was approved by Cleveland Clinic Institutional Review Board and all participants gave written, informed consent. Details of the CNTN cohort has been previously reported [37].
Dring CNTN-COBRE phase I, there were 190 participants enrolled and with MRI data collected (January 2017 to October 2020). Our convenience sample included 144 CNTN participants with a T1-weighted structural MRI scan (FreeSurfer 6.0 successfully and reliably finished), an amyloid PET scan (18F-AV45 scan, standard uptake value ratio (SUVR) computed), and available APOE genotyping. To increase real-world clinical utility and application in vivo, we utilized amyloid positivity status determined from the PET-SUVR as the outcome in this validation data set, which is assumed to reflect underlying AD-pathology.
Following the previously published AV45-PET processing pipeline and amyloid positivity criteria on the composite SUVR [38], 144 CNTN participants were divided into an amyloid positive group (SUVR > 1.11, N = 73) and an amyloid negative group (SUVR≤1.11, N = 71). Participant demographics for both groups are reported in Table 1B. Details on MRI and PET image processing steps are included in Supplementary Material B.
Demographic comparisons
All statistical and classification analyses were conducted in MATLAB 2018b (https://www.mathworks.com/). Differences between the ADNC0&1 and ADNC3 groups for NACC participants, and differences between amyloid positive and amyloid negative groups for CNTN participants were assessed for demographic and clinical variables including sex, years of education, APOE genotype, race, age at MRI, and diagnosis at MRI. Differences in time intervals between MRI scan and neuropathological data, scanner field strengths, scanner manufacturer, scanning protocol (implementation of IR), and GM-to-WM contrast SNR were further assessed between ADNC0&1 and ADNC3 groups for NACC participants. We performed chi-square tests to examine differences for categorical variables (sex, race, APOE genotype, diagnosis at MRI, scanner field strength, scanner manufacturer and implementation of IR), and used Student’s t-tests to estimate differences among continuous variables (age at MRI, years of education, time intervals between first MRI and neuropathological data, and GM-to-WM contrast SNR).
Classify the presence or absence of severe AD neuropathology using clinically available features
Using NACC participants with both postmortem neuropathological data and an antemortem MRI scan, we trained both model-based and data-driven machine learning models to classify the presence or absence of severe AD neuropathology using clinically accessible features. Figure 2 shows a schematic representation of our classification analyses.
Fig. 2
Classification schema. Black box (on the left): Clinically accessible features included in this study; Blue boxes (top part on the right): training and validating machine learning models in classifying the presence or absence of severe AD neuropathological status in NACC participants; Orange boxes (bottom part): External validation of trained models in classifying in vivo amyloid positivity status determined by PET imaging using CNTN subjects.
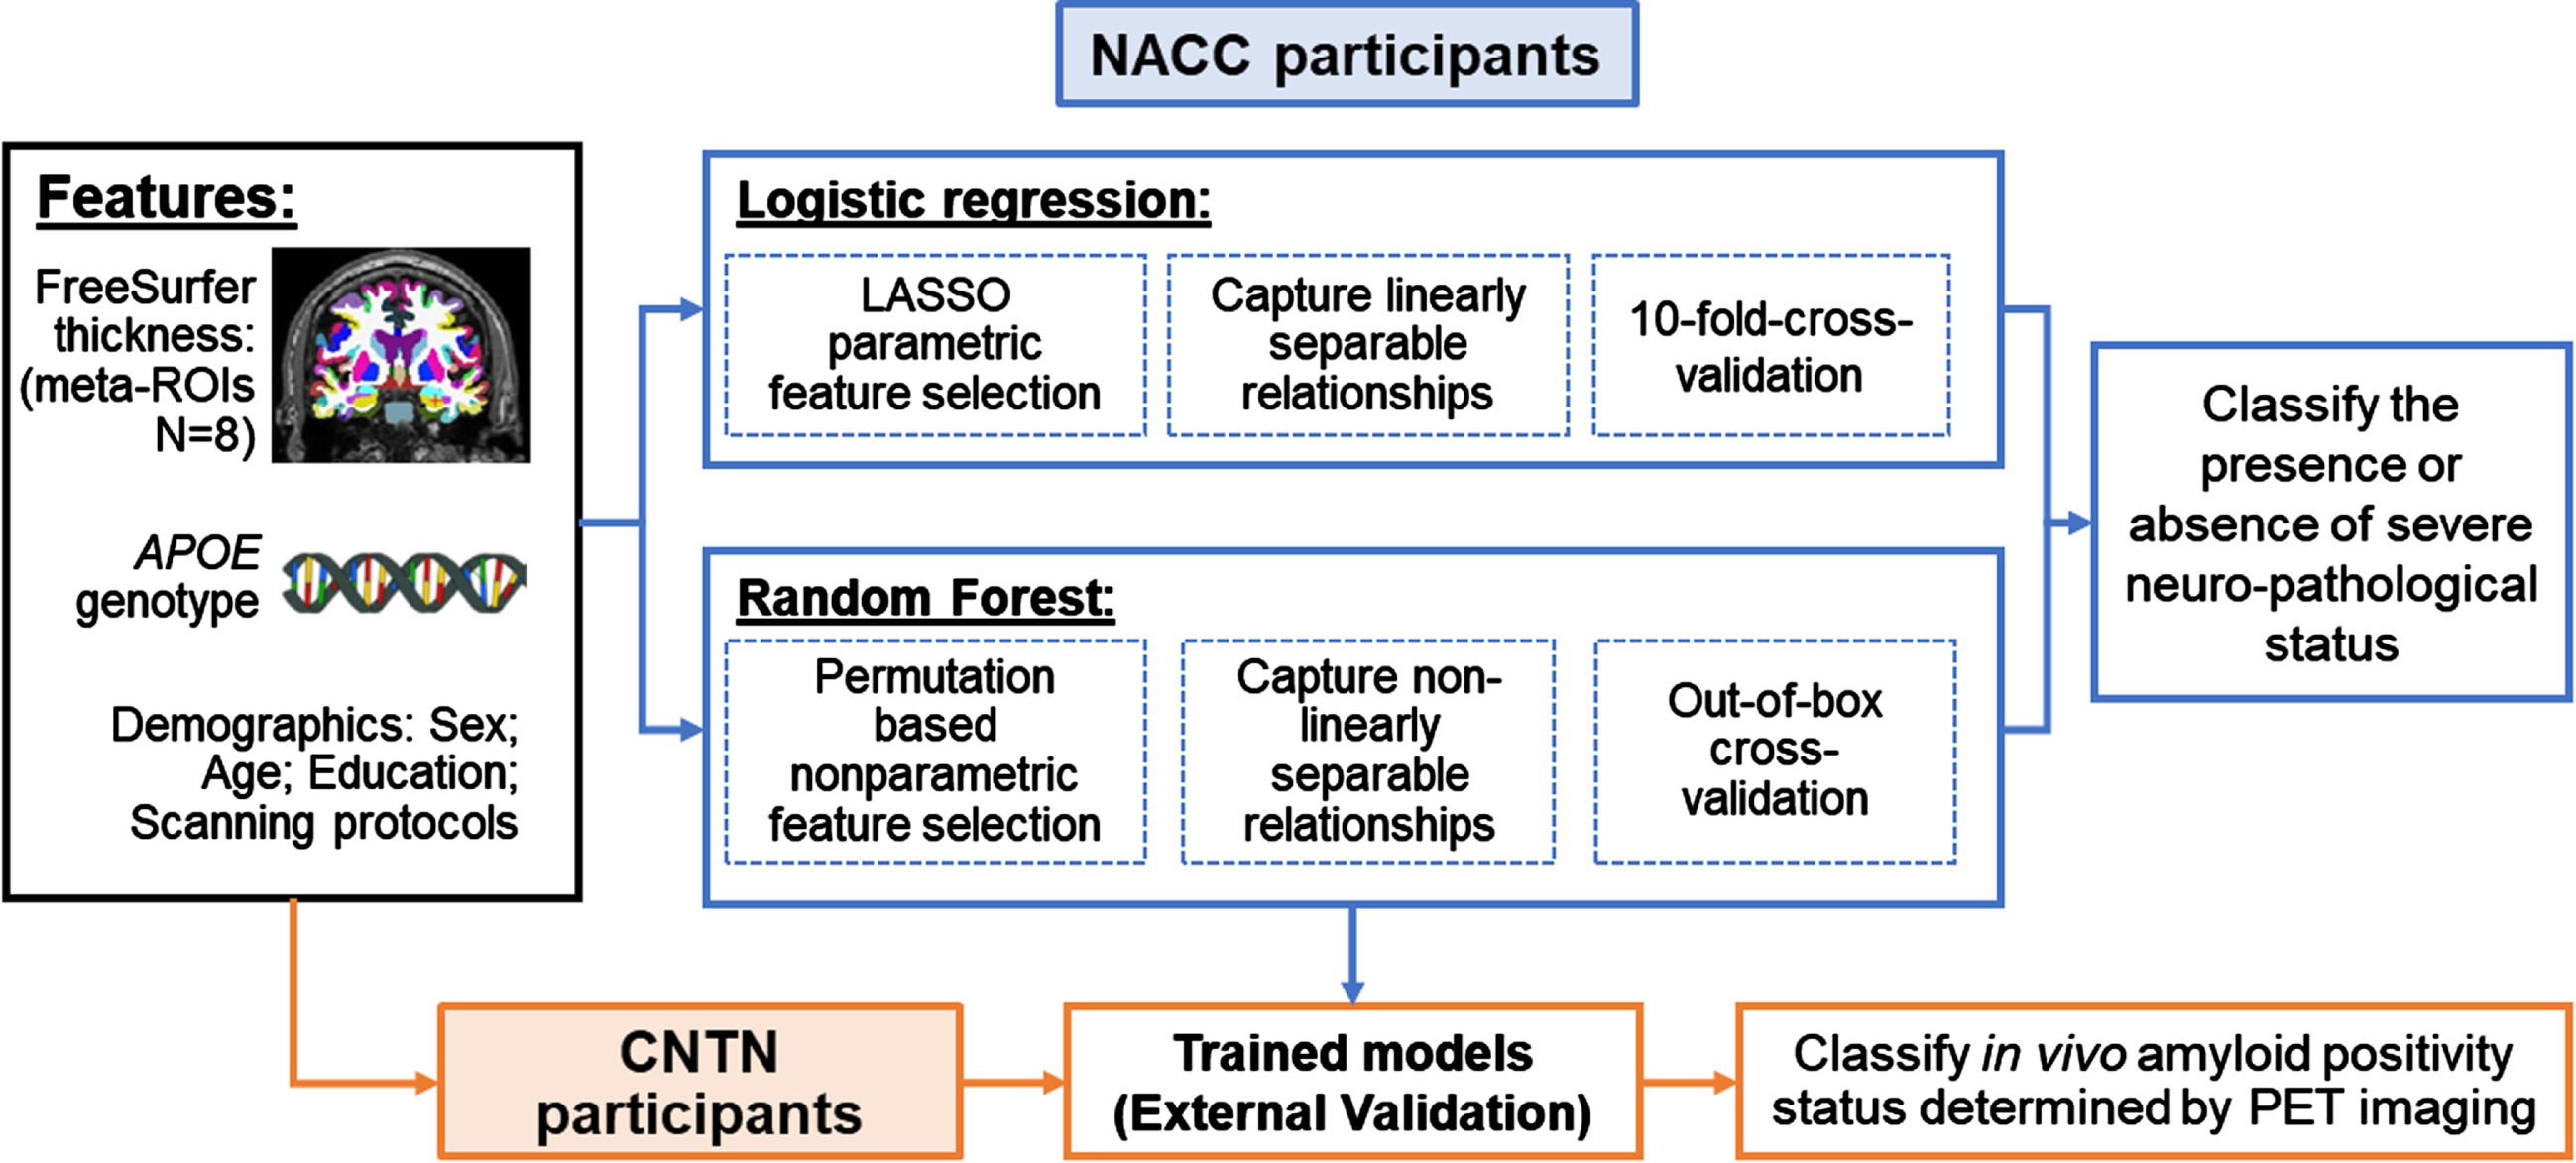
Clinically available features. Four demographic and genetic features (age at MRI, sex, years of education and APOE genotype) and eight structural brain measures from T1-weighted MRI were included as features to classify ADNC group assignments. Race was not included in the feature set because more than 95% NACC participants in this study were White. For the APOE genotype, a categorical variable was created to code APOE4 allele counts (range: 0, 1, and 2).
For the T1-weighted MRI measures, we focused on cortical thickness from the FreeSurfer-derived AD-signature meta-ROIs encompassing the bilateral entorhinal, inferior temporal, middle temporal and fusiform [29]. To account for potential variation by MRI scanners, we included 1) a binary vector representing MRI field strengths; 2) a categorical vector representing MRI manufacturer; and 3) a binary vector representing the implementation of IR, as additional features in the classification model, leading to a total of 15 features. Data from all NACC participants were utilized to train the model with a cross-validation schema. Due to the high collinearity among features, especially among cortical thickness features from the eight meta-ROIs, we further incorporated a feature selection step into each classification method (detailed below).
Model based method: LASSO logistic regression. A logistic regression classifier with a Least Absolute Shrinkage and Selection Operator (LASSO) was used to evaluate the importance and performance of clinically available features in predicting AD pathology (ADNC0&1 (0) versus ADNC3 (1) groups). Briefly, LASSO parametrically shrinks the logistic regression coefficient of each feature by imposing a penalty term on its absolute value in the objective function [39]. In this case, LASSO ensures that the retained features are the best features that explain the group differences while maintaining a low variance by shrinking the coefficients of all other unexplained features to zero [40]. Since logistic regression assumes sigmoidal relationships between dependent and independent variables, two binary variables were created to separately code subjects with one and two copies of APOE4 alleles, and two binary variables were created to separately code subjects with MRI collected on Siemens and Philips scanners (i.e., GE scanner coded as baseline), resulting in a total of 17 features.
Using a 10-fold cross-validation strategy, the feature set that produced the minimum cross-validation error in LASSO-logistic-regression was retained and further utilized in a reduced logistic regression model to classify the probability of assigning a participant to the severe AD neuropathology group (ADNC3). The resulting probability was then compared with the true group assignment using the receiver operating characteristic (ROC) curve method. To offset the population imbalance among two groups (53 versus 91), the threshold used to binarize the probability for final group assignments (s) was set as the point on the ROC curve that gives the minimum total false discovery rate (false positive rate (FPR) plus false negative rate (FNR)), instead of the commonly used value of 0.5. Sensitivity, precision, specificity, accuracy, F1-score were reported at this threshold, and area under the ROC curves (AUC) was further used to evaluate the overall classifier performance.
The final trained reduced logistic regression model was then tested on the independent CNTN data set to classify amyloid positivity status. The same threshold (s) was utilized to binarize the obtained probability of assigning participants to the amyloid positive group, and the same matrices were used to evaluate the classifier performance.
Data-driven method: Random Forest. We also utilized the data-driven random forest method for the same classification to take advantage of both linear and nonlinear relationships between the clinically available features and AD neuropathology.
The random forest classifier is an ensemble learning method that operates by constructing a large number of decision trees. Each decision tree is constructed using a bootstrapping sample from the original data, and splits participants based on minimum total impurity score criteria computed at each partition [40]. The concluding result of the random forest analysis is determined by counting the majority determination from all decision trees for each sample. In general, approximately 1/3 of participants are left out-of-box (OOB) for each decision tree during bootstrapping. Therefore, the classification of OOB samples were utilized as cross-validation results to evaluate the model performances.
We first trained a random forest model with 1000 decision trees using all NACC participants with 15 clinically available features (detailed above). These 15 features were ordered based on the OOB permutation-based feature importance scores. Briefly, this score for a specific feature measures the decrease in mean accuracy when permuting that specific feature in the OOB samples, non-parametrically. We also computed a Gini importance score for each feature. The detailed explanations of both feature importance measures are included in Supplementary Material C.
Next, we performed a recursive feature elimination (RFE), during which we trained 15 individual random forest models, each with 1000 decision trees, by dropping the least important feature in each iteration, respectively. To evaluate each model performance, the predicted probabilities of OOB validation samples were obtained and compared with the true group assignment using the same ROC curve-based method. The model that gave the maximum OOB validation AUCs among all 15 random forest models was selected as the most accurate model, and the features included were considered as the selected features. This most accurate model was further evaluated using the independent CNTN participants.
Test the model performance when including participants with ADNC3 and low-level Lewy bodies comorbidities
Up to 50% of participants with severe AD neuropathology (i.e., the ADNC3 group) could have some degree of Lewy bodies [41]. Many participants with both severe ADNC and low-level Lewy bodies in the brain stem, amygdala or olfactory bulb, present with AD clinically. Thus, to test the utility of our models with a more comprehensive real-world severe AD group, we further trained and tested our models by including participants with Lewy bodies in brain stem (NPLBOD = 1, Nsub = 5), amygdala, (NPLBOD = 4, Nsub = 32) and olfactory bulb (NPLBOD = 5, Nsub = 4) in the severe ADNC group.
RESULTS
Demographic comparison
ADNC0&1 and ADNC3 groups in NACC did not significantly differ with regard to sex and years of education, and both groups were more than 90% White (Table 1A). There were significantly more APOE4 carriers in the ADNC3 group (p < 0.001), consistent with the AD neuropathology represented in the ADNC3 group. At their first MRI visit, participants with ADNC0&1 were slightly younger (p = 0.06) and had a larger age variation, i.e., 68.93±19.69 for ADNC0&1 versus 73.60±9.24 for ADNC3. Participants with ADNC3 had significantly more advanced disease (p < 0.001). There were no differences in the time intervals between the first MRI visit and the neuropathological data between ADNC3 and ADNC0&1 groups. In addition, a significantly larger number of participants with ADNC3 had their MRI scans collected on 3T scanners (p = 0.01) and with the implementation of IR (p < 0.001), as compared to the ADNC0&1 group. Interestingly, WM-to-GM SNRs for these scans did not differ between the two groups.
For comorbidities (Table 1C), both groups had a high prevalence of vascular changes (>90%). Around 80% of participants had TDP43 pathologies assessed in the brain, among which, participants with ADNC3 had a relatively higher prevalence of comorbidities with TDP43 neuropathology.
Among CNTN participants (Table 1B), when compared to the amyloid negative group, the amyloid positive group had a significantly higher composite SUVR (1.44±0.15 versus 0.99±0.05), a lower proportion of women (p = 0.02), and more APOE4 carriers (p < 0.001). Education level did not differ between the two groups. At their first MRI scan, amyloid positive participants were also older (p = 0.02) and more advanced into disease (p < 0.001) than amyloid negative participants.
Classification performance: LASSO logistic regression model
Feature selection. Figure 3A plots the 10-fold cross-validation error as a function of strengths of the regularization term in the LASSO-logistic-regression model trained to classify AD neuropathological status, i.e., ADNC3 versus ADNC0&1, among NACC participants. As listed in the intersect table in Fig. 3A, six features were selected with the minimum cross-validation error. More specifically, having one copy or two copies of APOE4 alleles were positively associated with severe AD neuropathology, whereas having greater cortical thickness in fusiform and entorhinal ROIs were negatively associated with severe AD neuropathology. Scanner field strength was also selected as an important feature in this model.
Fig. 3
LASSO-logistic regression results. A) Feature selection results. Cross-validated (CV) deviance of LASSO-logistic-regression models, trained with NACC participants to classify the presence or absence of severe AD neuropathological status (ADNC3 versus ADNC0&1), as a function of regularization strength in LASSO (lambda). The green circle corresponds to the selected model with a minimum CV deviance. The intersect table lists the beta coefficient in the logistic regression model of each selected feature. B) Model performance with selected features. ROC curve for CV performance of the reduced logistic regression model trained with 6 selected features to classify ADNC3 versus ADNC0&1. The red filled dot indicates the point with the lowest total false rate (false positive rate (FPR) + false negative rate (FNR)). The corresponding threshold s = 0.55 is used to binarize the predicted probability in assigning participants to the ADNC3 group. Using this model with this threshold, the intersect table shows the CV-performance with NACC participants to classify AD neuropathological status (ADNC3 versus ADNC0&1) and external testing results with CNTN participants to classify amyloid positivity status (amyloid positive versus amyloid negative).
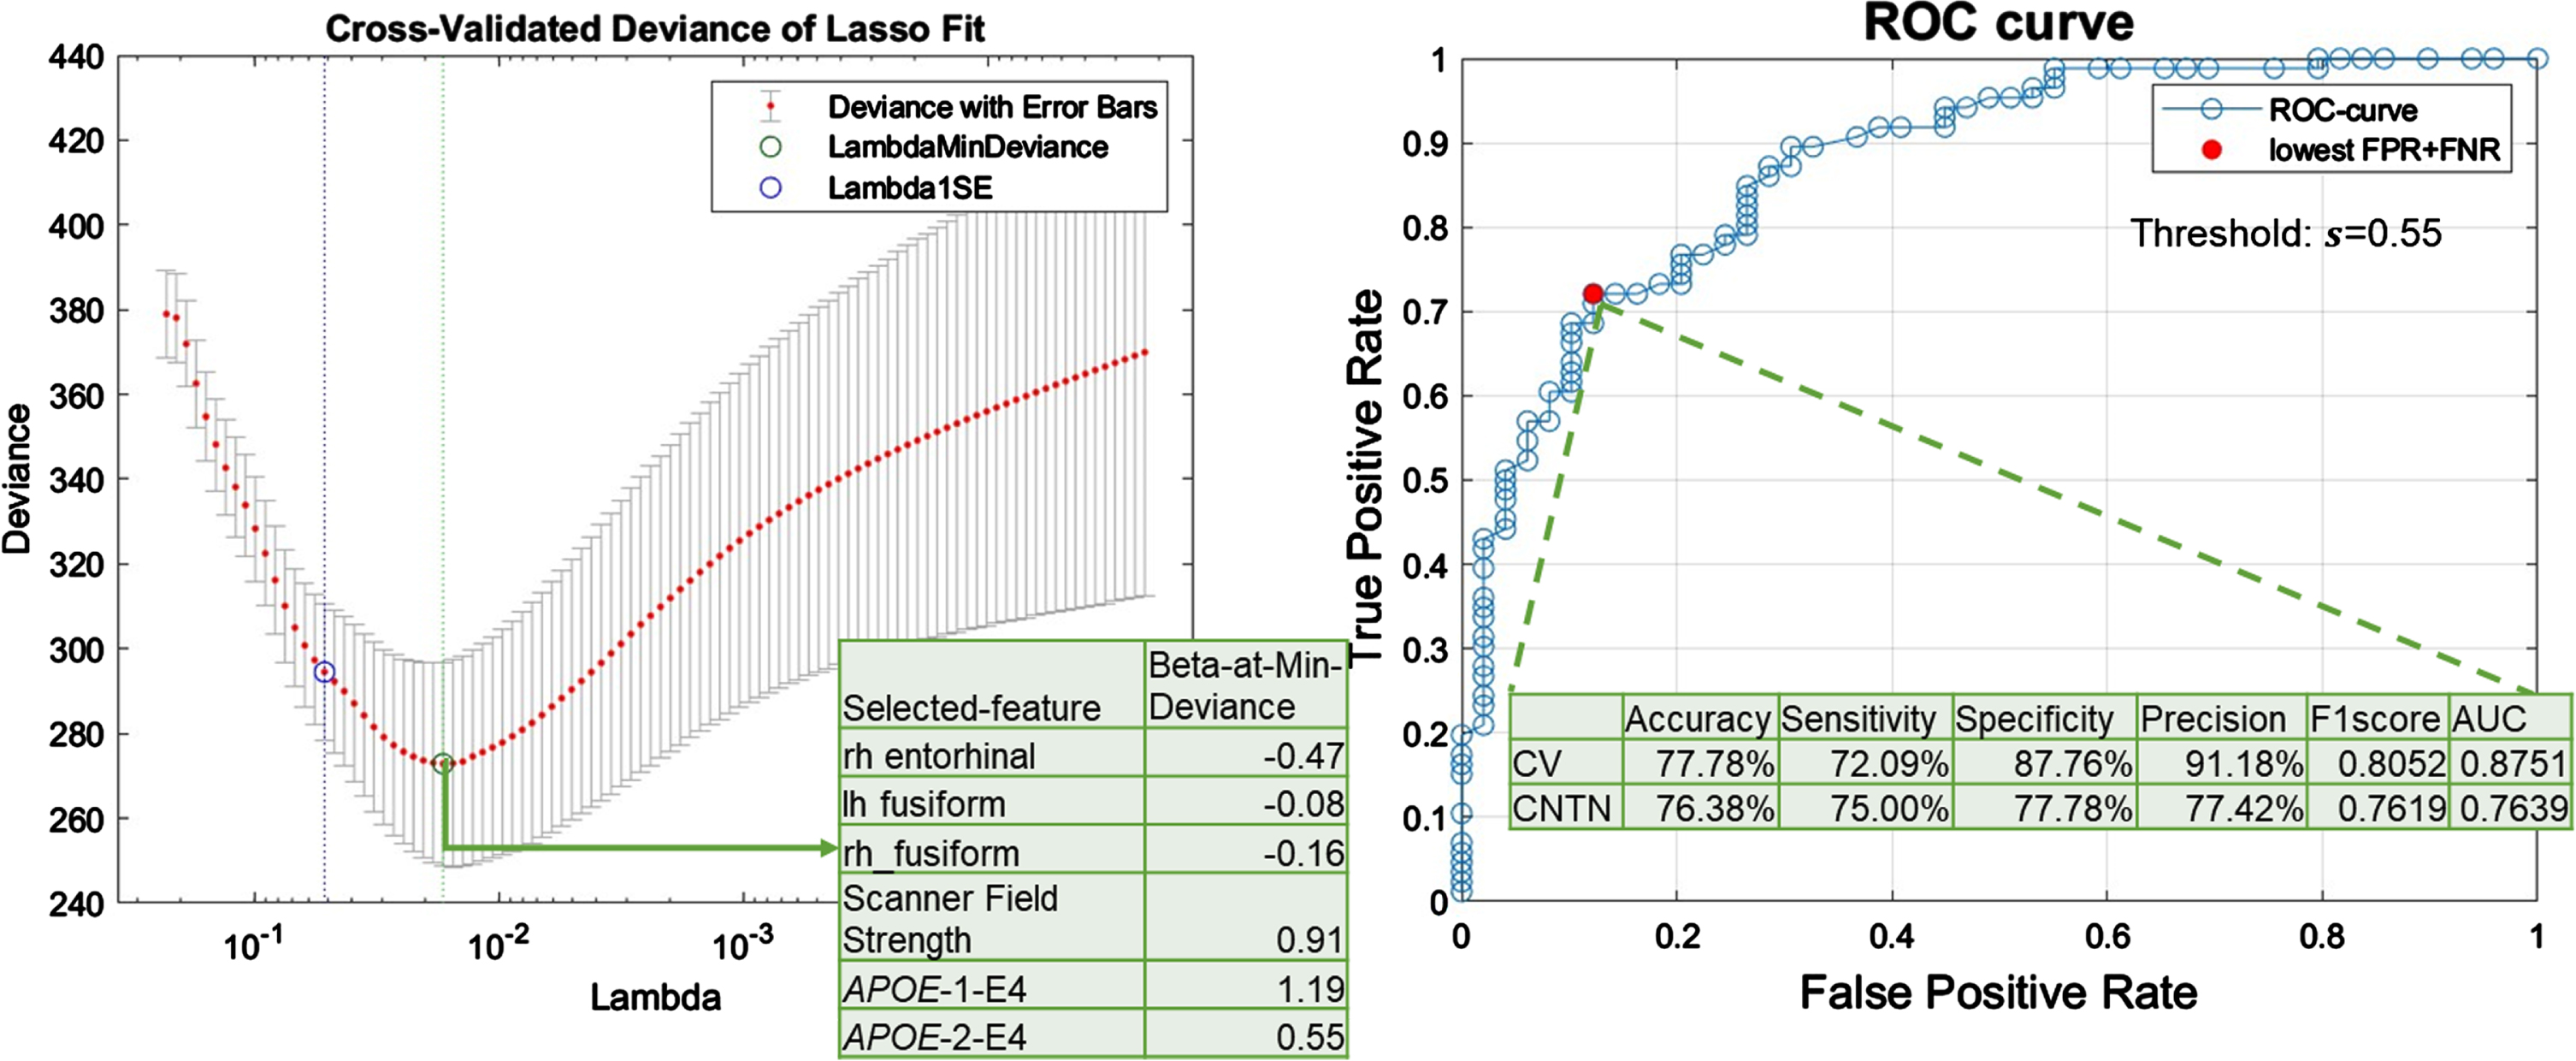
Model performance with selected features. Figure 3B shows the cross-validation ROC curve of the reduced logistic regression model trained with six selected features. The cross-validation AUC was 0.88 (Fig. 3B, intersect table). A threshold of 0.55 was used to binarize the probability for final group assignments, corresponding to the point on the ROC curve with minimum total false rate (Fig. 3B). Using this threshold to binarize the predicted probability in assigning participants to the ADNC3 group, the cross-validation accuracy, sensitivity, specificity, precision, and F1-score were 77.78%, 72.09%, 87.76%, 91.18%, and 0.81, respectively (Fig. 3B, intersect table).
Independent testing performance. The bottom row in Fig. 3B intersect table lists the performance in applying this reduced logistic regression model to classify amyloid positivity status in the independent CNTN data set (i.e., classifying amyloid positive versus amyloid negative status). Using the same threshold (0.55) to binarize the predicted probability, the independent testing accuracy, sensitivity, specificity, precision, and F1-score were 76.38%, 75.00%, 77.78%, 77.42%, and 0.76.
Classification performances: data-driven Random Forest model
Feature selection. Figure 4A plots the feature importance score in the trained random forest model to classify severe AD neuropathology, i.e., ADNC3 versus ADNC0&1, using 15 clinically available features of NACC participants. As shown in Fig. 4A, the OOB permutation-based feature importance score and the Gini impurity index were highly correlated, with a Pearson’s correlation value of 0.86. We next ranked these 15 features based on the OOB permutation-based feature importance score and performed the RFE. Table 2 lists features included in each model (right), and the corresponding model performances on OOB samples (left).
Fig. 4
Random forest results. A) Feature selection results. Out-of-box (OOB) permutation based (blue bars) and Gini impurity index (orange curve) based feature importance scores in the random forest model trained using all features from NACC participants to classify the presence or absence of severe AD neuropathological status (ADNC3 versus ADNC0&1). Stars (*) indicate features retained in the final model. B) Model performance with selected features. ROC curve of the random forest model with the 6 selected features (detailed in Table 2). The red filled dot indicates the point with the lowest total false rate (false positive rate + false negative rate). The corresponding threshold s = 0.5863 is used to binarize the predicted probability in assigning participants to the ADNC3 group. Using this model with this threshold, the intersect table shows the OOB-validation-performance with NACC participants to classify AD neuropathological status (ADNC3 versus ADNC0&1) and external testing results with CNTN participants to classify amyloid positivity status (amyloid positive versus amyloid negative).
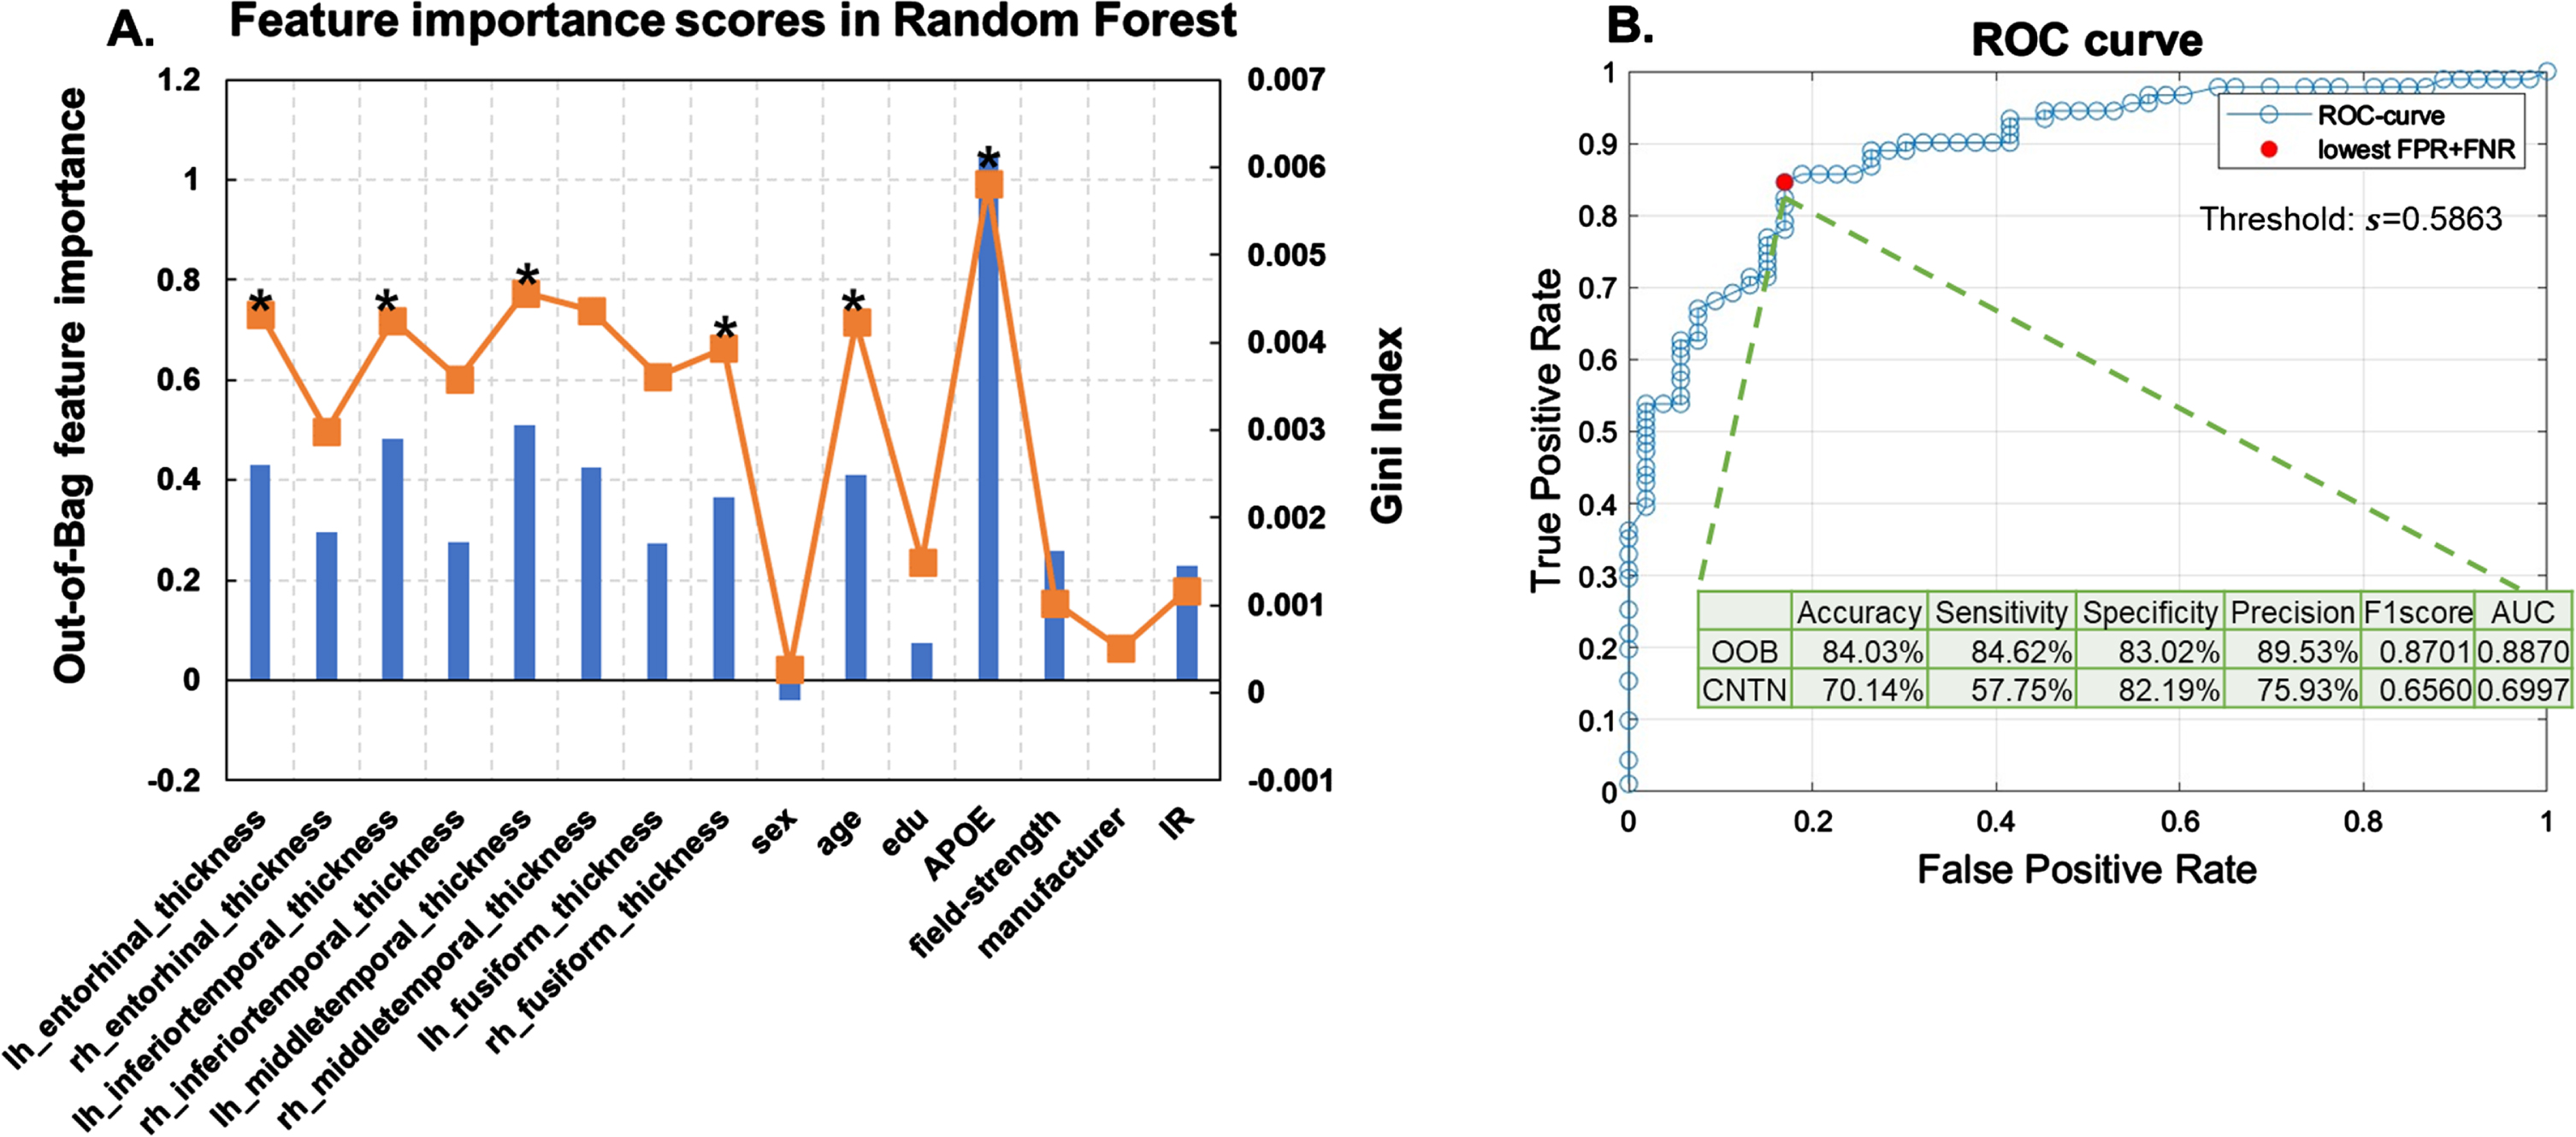
Table 2
Feature selection results in random forest models. Left. Out-of-box (OOB) validation performances of each random forest model trained with Top-15 to Top-1 important features, respectively. In each iteration, we recursively drop the feature with the lowest feature importance score. AUC is computed using the ROC curve method (column AUC). The threshold corresponding to the point on the ROC that gives the minimum total false rate (i.e., false positive rate + false negative rate) is used to binarize the probability of assigning participants to the ADNC3 group (column Threshold), and to further compute the accuracy, sensitivity, specificity, precision and F1score. Right. The corresponding features included in each model. The model with the highest OOB AUC is selected as the best model (highlighted in bold). APOE genotype, age, thicknesses of right fusiform gyrus, left middle temporal gyrus, left inferior temporal gyrus, and left entorhinal cortex are retained in this model
| ACC | Sensitivity | Specificity | Precision | F1score | AUC | Selected features | ||||||||||||||
| 81.25% | 79.12% | 84.91% | 90.00% | 0.8421 | 0.8831 | lh_ERC | rh_ERC | lh_ITG | rh_ITG | lh_MTG | rh_MTG | lh_FUS | rh_FUS | sex | age | edu | APOE | field-strength | manu-facturer | IR |
| 82.64% | 84.62% | 79.25% | 87.50% | 0.8603 | 0.8780 | lh_ERC | rh_ERC | lh_ITG | rh_ITG | lh_MTG | rh_MTG | lh_FUS | rh_FUS | age | edu | APOE | field-strength | manu-facturer | IR | |
| 84.03% | 85.71% | 81.13% | 88.64% | 0.8715 | 0.8842 | lh_ERC | rh_ERC | lh_ITG | rh_ITG | lh_MTG | rh_MTG | lh_FUS | rh_FUS | age | edu | APOE | field-strength | IR | ||
| 84.03% | 91.21% | 71.70% | 84.69% | 0.8783 | 0.8810 | lh_ERC | rh_ERC | lh_ITG | rh_ITG | lh_MTG | rh_MTG | lh_FUS | rh_FUS | age | APOE | field-strength | IR | |||
| 81.94% | 83.52% | 79.25% | 87.36% | 0.8539 | 0.8763 | lh_ERC | rh_ERC | lh_ITG | rh_ITG | lh_MTG | rh_MTG | lh_FUS | rh_FUS | age | APOE | field-strength | ||||
| 81.25% | 78.02% | 86.79% | 91.03% | 0.8402 | 0.8819 | lh_ERC | lh_ITG | rh_ITG | lh_MTG | rh_MTG | lh_FUS | rh_FUS | age | APOE | field-strength | |||||
| 79.86% | 74.73% | 88.68% | 91.89% | 0.8242 | 0.8755 | lh_ERC | lh_ITG | lh_MTG | rh_MTG | lh_FUS | rh_FUS | age | APOE | field-strength | ||||||
| 82.64% | 85.71% | 77.36% | 86.67% | 0.8619 | 0.8758 | lh_ERC | lh_ITG | lh_MTG | rh_MTG | lh_FUS | rh_FUS | age | APOE | |||||||
| 84.03% | 86.81% | 79.25% | 87.78% | 0.8729 | 0.8761 | lh_ERC | lh_ITG | lh_MTG | rh_MTG | rh_FUS | age | APOE | ||||||||
| 84.03% | 84.62% | 83.02% | 89.53% | 0.8701 | 0.8870 | lh_ERC | lh_ITG | lh_MTG | rh_FUS | age | APOE | |||||||||
| 82.64% | 83.52% | 81.13% | 88.37% | 0.8588 | 0.8822 | lh_ERC | lh_ITG | lh_MTG | rh_FUS | APOE | ||||||||||
| 83.33% | 83.52% | 83.02% | 89.41% | 0.8636 | 0.8745 | lh_ITG | lh_MTG | rh_FUS | APOE | |||||||||||
| 82.64% | 80.22% | 86.79% | 91.25% | 0.8538 | 0.8611 | lh_ITG | lh_MTG | APOE | ||||||||||||
| 81.94% | 79.12% | 86.79% | 91.14% | 0.8471 | 0.8313 | lh_MTG | APOE | |||||||||||||
| 75.56% | 68.60% | 87.76% | 90.77% | 0.7815 | 0.6327 | APOE | ||||||||||||||
lh, left-hemisphere; rh, right-hemisphere; ERC, entorhinal cortex; ITG, inferior temporal gyrus; MTG, middle temporal gyrus; FUS, fusiform gyrus; IR, inversion recovery; AUC, area under the ROC curve; ACC, accuracy.
As shown in Fig. 4A, APOE genotype showed the highest feature importance score. Random forest model trained using APOE alone achieved an AUC of 0.63 in classifying ADNC groups on OOB samples (Table 2, last row). The final selected random forest model was trained using APOE genotype, age, and thicknesses of left middle temporal gyrus, left inferior temporal gyrus, left entorhinal cortex, and right fusiform gyrus as features (N-features = 6), which gave the highest AUC of 0.89 on OOB samples (Table 2, 10th row).
Model performance with selected features. Figure 4B plots the ROC curve of the retained random forest model trained with the six selected features. A threshold of 0.59, corresponding to the lowest total false rate on the ROC curve, was used to binarize the predicted probability in assigning participants to the ADNC3 group. As listed in the intersect table in Fig. 4B, the OOB-validation accuracy, sensitivity, specificity, precision, and F1-score were 84.03%, 84.62%, 83.02%, 89.53%, and 0.87, respectively.
Independent testing performance. The bottom row in Fig. 4B intersect table shows the performance in applying this model to classify amyloid positivity status in the independent CNTN data set (amyloid positive versus amyloid negative). Using the same threshold (0.59) to binarize the predicted probability, the independent testing accuracy, sensitivity, specificity, precision, and F1-score were 70.14%, 57.75%, 82.19%, 75.93%, and 0.66.
Model performances with various starting feature sets. To comprehensively evaluate our model performances, we re-trained our random forest model by 1) removing APOE genotype from the starting feature set; 2) removing both APOE genotype and age from the starting feature set; 3) adding clinical diagnoses to the starting feature set; and 4) adding clinical diagnoses and removing APOE genotype from the starting feature set. Table 3 lists AUCs on the OOB and independent testing sets in these models trained with different starting feature sets.
Table 3
Random forest performance with different sets of starting features. Main model refers to the model in Table 2, starting with 15 features (Age, sex, education, APOE status, scanner field strength, scanner manufacturer, scanner protocol and 8 meta-ROI thicknesses). Selected features were ordered based on out-of-box (OOB) permutation-based feature importance score in each model
| Main model | No APOE | No APOE &no age | Main model &with DX | No APOE &with DX | |
| Cross-validation AUC | 0.8870 | 0.8189 | 0.7960 | 0.9328 | 0.9165 |
| Test AUC | 0.6997 | 0.6234 | 0.5790 | 0.7695 | 0.7145 |
| Selected features | APOE | lh_MTG | lh_MTG | DX | DX |
| lh_MTG | rh_FUS | rh_FUS | age | age | |
| lh_ITG | lh_ITG | lh_ITG | APOE | lh_ERC | |
| rh_FUS | age | rh_MTG | lh_MTG | rh_MTG | |
| lh_ERC | lh_ERC | lh_ITG | rh_ITG | ||
| age | rh_ITG | lh_ERC | lh_ITG | ||
| rh_ERC | lh_MTG | ||||
| rh_FUS | |||||
| edu |
DX, diagnoses; lh, left-hemisphere; rh, right-hemisphere; ERC, entorhinal cortex; ITG, inferior temporal gyrus; MTG, middle temporal gyrus; FUS, fusiform gyrus; AUC, area under the ROC curve; edu: years of education.
Without APOE genotype, our model achieved an AUC of 0.82 in classifying the presence or absence of severe AD neuropathology in OOB samples and an AUC of 0.62 in classifying amyloid positivity status in the external validation data set (3rd column Table 3). These AUCs further dropped to 0.80 and 0.59 on the OOB and external validation samples, respectively after removing age from the starting feature set. Without APOE and age, our model selected seven thickness measures from eight meta-ROIs as predictive features (4th column Table 3). On the other hand, adding clinical diagnoses to the model boosted AUCs to 0.93 and 0.77 on the OOB and external validation samples, respectively (5th column in Table 3). Removing APOE4 genotype on top of this model still guaranteed AUCs of 0.92 and 0.71 on the OOB and external validation samples, respectively (6th column in Table 3).
Model utilities when including participants with ADNC3 and low-level Lewy body co-pathologies
An additional 41 participants with ADNC3 and Lewy bodies in the brain stem, amygdala, or olfactory bulb were included in the analyses.
Our lasso logistic regression model selected a similar set of six features as the main analyses with the minimum cross-validation error (having one or two copies of APOE E4 allele, cortical thicknesses encompassing fusiform and entorhinal ROIs, and scanner field strength, Supplementary Material D). With these features, the cross-validation accuracy, sensitivity, specificity, precision, F1-score, and AUC were 75.57%, 70.08%, 89.80%, 94.68%, 0.81, and 0.88; and the independent testing accuracy, sensitivity, specificity, precision, F1-score, and AUC were 76.38%, 75.00%, 77.78%, 77.41%, 0.76, and 0.76 (Supplementary Material D).
Random Forest model also gave comparable results as our main analyses, with the OOB-validation accuracy, sensitivity, specificity, precision, F1-score, and AUC being 87.70%, 88.63%, 83.02%, 92.86%, 0.91, and 0.90, respectively. The independent testing accuracy, sensitivity, specificity, precision, F1-score, and AUC were 70.83%, 63.38%, 78.08%, 73.77%, 0.69, and 0.71 (Supplementary Material D).
DISCUSSION
In this study, we have developed machine learning models that can classify the presence or absence of severe AD neuropathology using available clinical and MRI features with an accuracy of 84.03%. We further validated these models in an independent data set to classify in vivo amyloid status derived from PET imaging, where we achieved an accuracy of 70.14%. Consistent with our hypothesis, cortical thinning encompassing AD-signature meta-ROIs, together with APOE genotype, are jointly important for identifying severe AD neuropathology. We specifically excluded participants with Lewy body, FTLD-TDP, and FTLD-tau pathologies from our analyses in an effort to ensure the dominance of AD-related neuropathology in our data. Therefore, the retained MRI features might potentially represent an AD-specific neurodegeneration pattern.
Major strength
Currently, there is a lack of well-established models that could classify postmortem confirmed AD neuropathological status using clinically available and noninvasive features in living persons. Accordingly, there are limited in vivo biomarkers that could directly link neurodegeneration features to AD neuropathology within the ATN framework. Several studies have utilized MRI-derived measures including hippocampal volume, thickness of AD-signature ROIs, and composite atrophy scores as potential candidate markers of neurodegeneration for use in classifying AD-related outcomes. These studies have usually focused on clinically diagnosed subjects along the AD continuum [13, 17, 22, 23], and only a few reports have confirmed subjects’ neuropathological status with postmortem autopsy data [19, 24, 42]. Without pathological confirmation, the identified neurodegeneration markers in clinically diagnosed AD subjects might not be linked to AD neuropathology, due to the syndromal overlap across various dementias. For example, hippocampal atrophy, which has often been studied in AD [11], has also been widely reported in various conditions including normal aging, several other neurodegenerative disorders and non-neurodegenerative disorders such as diabetes, sleep apnea, and bipolar disorder [5].
In this regard, the major strength of our study is the inclusion of NACC participants with confirmed no/low (ADNC0&1) or severe (ADNC3) AD neuropathology at autopsy. The ADNC score integrates postmortem assessments of Thal phase for amyloid plaques, Braak stage for neurofibrillary degeneration, and density of neocortical neuritic plaques, and therefore represents a comprehensive evaluation of AD-dominant neuropathology [34]. We excluded participants with confirmed Lewy body, FTLD-TDP, and FTLD-tau pathologies to further establish the dominance of AD-related neuropathology in our ADNC0&1 and ADNC3 groups. Consequently, our ADNC0&1 and ADNC3 groups were dominated by lower and higher stages of A, B, and C scores respectively with minimal overlap (Supplementary Material E), leading to a specific representation of the presence or absence of severe AD neuropathology. We obtained high accuracies on both cross-validation sets with postmortem confirmed AD pathological status and external validation sets with in vivo determined amyloid status (Figs. 3 and 4). These results demonstrate that our models can reliably classify AD neuropathology both postmortem and in vivo. Confirmed with neuropathological data, the retained clinical features may be AD-specific and could assist in determining AD neuropathological status in living persons, especially when the etiology is uncertain and other AD biomarkers are unavailable clinically. The inclusion of ADNC stage 1 participants increased our sample size and facilitated the “real world” application of our approach. The external validation against in vivo biomarkers additionally facilitates translation to clinical applications.
Classification models
For this classification, we trained both a logistic regression model and a data-driven random forest model with features including thicknesses from AD signature meta-ROIs, APOE genotype, age, sex, and years of education (Fig. 2). Most previous studies focused on between-group differences of each potential biomarker to define neurodegeneration in AD [17, 27]. The logistic regression model similarly evaluates the predictive ability of individual features and would work well when groups are linearly separable [7]. Random forest, on the other hand, is a data-driven machine learning method that evaluates multivariate predictive abilities among input features towards output variables in a nonlinear manner [40]. Therefore, these two methods complement each other and comprehensively evaluate both linear and nonlinear multivariate relationships among potential neurodegeneration biomarkers and AD neuropathological status. The high classification accuracies obtained with both models additionally support our hypothesis that these included features for classifying confirmatory AD neuropathology, and thus the retained MRI features can be utilized to quantify AD-specific neurodegeneration.
Clinically available features
Features included and retained in our models are clinically accessible and have already been included in AD legacy databases, which improves the potential clinical utility. Due to high collinearities among meta-ROI thickness measures, feature selection steps are applied in both models. Logistic regression is parsimonious (i.e., fewer but independent predictors could explain the model better than more but collinear predictors). LASSO in logistic regression sets coefficients for non-interesting features to zero automatically by posting a penalty term on the coefficient in the objective function [39]. This parametric feature selection step copes with the collinearity among features by only retaining features that explain the most group differences [39, 40]. Meanwhile, the permutation index in random forest evaluates the decrease in model performances (i.e., classification accuracies) when a given feature is randomly permuted.
In our analysis, both parametric (LASSO in logistic regression) and nonparametric (permutation index in random forest) feature selection results indicate that APOE4 allele counts contribute most significantly to classifying the presence or absence of severe AD neuropathology (Figs. 3A and 4A). This result may be partially explained by the large overlap between APOE4 carriers and amyloid positive subjects along the AD continuum [30]. After removing the APOE4 allele counts from the starting feature set, our random forest model still achieved reasonable performance on both cross-validation dataset (AUC = 0.82 in classifying ADNC groups) and external validation dataset (AUC = 0.62 in classifying amyloid positivity status, Table 3).
Besides APOE4 carrier status, our results consistently show that cortical thinning encompassing AD-signature meta-ROIs contribute to the classification of the presence or absences of severe AD neuropathology. The inclusion of the first cortical thickness measure to the random forest model significantly boosted the AUC from 0.63 to 0.83 (bottom two rows in Table 2). Incorporating additional thickness measures led to an incremental effect on model performances (Table 2), indicating that cortical thickness measures of meta-ROIs might have comparable impact in classifying confirmatory AD neuropathology. We observed a left-right difference in cortical thickness measures of all four meta-ROIs in the paired t-test (Supplementary Material F). In random forest, thicknesses on the left hemisphere were more frequently selected (Table 2 and Fig. 4), whereas in LASSO logistic regression, two right hemisphere and one left hemisphere features were retained (Fig. 3). These observations further suggest that all meta-ROI thicknesses could be important to our models. Nevertheless, our random forest model trained with meta-ROI thicknesses in addition to APOE4 and age could boost the AUC on OOB samples from 0.79 to 0.89, and on external validation samples from 0.58 to 0.70 (Table 3). These findings demonstrate the additive contribution of MRI-derived thickness measurements to APOE4 and age in classifying AD neuropathological status in living persons, and further validate the predictive ability and potential clinical utility of AD meta-ROIs.
In addition to individual thickness measures, we also trained a logistic regression model using average thickness estimated across eight meta-ROIs as the only thickness feature. We obtained AUCs of 0.8723 and 0.7473 on the cross-validation and independent testing samples that were comparable to our main model (0.8751 and 0.7639 in Fig. 3). These comparable results suggest subtle benefits of using individual regions versus the average measure. One possibility is that our limited and unbalanced sample sizes may hinder significant performance improvement through data-driven feature selections. Thus, future studies with larger samples and more balanced groups may more effectively demonstrate the advantages of integrating measures from individual regions with data-driven methods, compared to relying on composite averages. Nevertheless, our major goal is to train a model that could classify the presence or absence of severe AD neuropathology with clinically available features. To this end, results from models using on average meta-ROI measure further confirm the classification ability and potential clinical utility of AD meta-ROIs.
Clinical diagnoses might also be considered as a feature that could assist in the classification of AD neuropathology. Our random forest model with additional clinical diagnoses as features did further increase AUCs to 0.93 and 0.77 on the OOB and external validation samples, respectively (Table 4). Nonetheless, we did not include the clinical diagnoses in our model mainly due to the potential discrepancies between clinical and pathological AD diagnoses. In general, about 10% to 30% clinical AD cases do not display typical AD neuropathological changes at autopsy [6, 43]. Many clinical centers, including our CNTN, are now requiring a positive amyloid status to diagnose AD, which could introduce potential circularities between AD diagnoses and amyloid neuropathology. In addition, despite being a reliable measure in classifying AD neuropathological status, efforts and expertise are required for clinical diagnoses, whereas objective measures combined could possibly achieve a similar performance. To this end, our machine learning model would be helpful in aiding the pathological AD diagnoses in living persons with clinically available features, particularly when handling those 10%–30% cases where an AD diagnosis is not straightforward with overlapping symptoms.
Last, to increase the sample size, we included NACC participants with both 1.5T and 3.0T structural MRI scans in training our machine learning models. Previous studies with the same subjects scanned on both 1.5T and 3.0T scanners have shown fair to good between-scanner consistencies for 68 FreeSurfer cortical regions and derived measures [44, 45]. In training our models, we included scanner field strength, scanner manufacturer, and scanning protocols (i.e., implementation of IR) as features. As compared to MRI features, relatively smaller feature importance scores were obtained in our random forest model for these scanner related features (Fig. 4A). This observation, together with previous reports, demonstrates that structural MRI-derived features could be robust and reliable, and therefore further supports the potential clinical utility of AD meta-ROI thickness measures.
Detailed examination of the large age-variance in ADNC0&1 group
As shown in Table 1A, our ADNC0&1 group had large age variance (68.93±19.69). A detailed examination revealed that this was driven by inclusion of seven participants under the age of 40 at time of the MRI scan and 45 at death, respectively (Supplementary Material G). All seven participants were characterized as ADNC = 0 and without any FTLD-tau, FTLD-TDP, Lewy body, TDP-43, ALS-MND, or trinucleotide diseases pathologies. Five out of seven participants exhibited vascular changes. Clinically, all seven participants were diagnosed with MCI or dementia. We chose to retain these seven participants in our analyses because 1) they met our inclusion/exclusion criteria; 2) our major goal is to train a model that could classify the presence or absence of severe AD neuropathology; and 3) the ADNC3 group included more participants and we sought to avoid introducing further additional sources of bias via more unbalanced group sizes.
As a result, in our main random forest model, six out of these seven participants were classified as no or low AD neuropathology group during cross-validation, which further suggest the potential utilities of our model to determine AD neuropathological status in living persons. In addition, we further tested whether model performance was driven by these seven ADNC0 participants by repeating our analyses after excluding them from the ADNC0&1 group (Supplementary Material G). As compared to our main LASSO-logistic regression model (Fig. 3), comparable AUCs were obtained on both cross-validation (0.8751 versus 0.8714) and independent testing data sets (0.7639 versus 0.7711). These results confirm that our model results did not appear to be driven by these seven participants.
Limitations
The utilization of the NACC participants with neuropathology data is a notable strength of our study, but it also introduces limitations that may impact generalizability. The most significant is that our analyses had a relatively small number of participants with no AD neuropathology, as compared to the number of participants with severe AD neuropathology. This group imbalance stems from the fact that the NACC database is heavily enriched for AD neuropathology. This bias could also limit us to comprehensively and impartially evaluate feature importance. To reconcile this bias, we have 1) combined ADNC1 with ADNC0 participants to increase the sample size and represent a “real-world” group of no or low levels of ADNC; 2) utilized thresholds that give minimum total false rates to binarize the probability for group assignments in training our classification models; and 3) validated the trained models using an external dataset with balanced sample sizes. Future replication with a balanced group design would lend additional support to our results.
Although we tried to eliminate comorbidities by removing participants with confirmed Lewy body, FTLD-TDP and FTLD-tau pathologies using NPLBOD, NPFTDTDP, and NPFTDTAU variables in NACC Neuropathology Data Set. We were not able to fully exclude vascular changes and TDP43 pathology due to the high prevalence and limited assessments, respectively. Because AD neuropathological levels were low in ADNC0&1 group, it may be possible that these comorbidities could contribute to the clinical symptoms in this group [46, 47]. Our current analyses were limited by sample-size in ADNC0&1 group to further exclude participants based on any clinical or neuropathological criteria related to vascular changes and TDP43 pathology (Table 1). With an increased sample size, future analyses could benefit from removing participants with a non-normal clinical diagnosis in this group to further refine the classification and prediction of AD neuropathology. Methodologically, we considered it less problematic to include participants with TDP43 pathology and vascular changes in the ADNC3 group, because AD-neuropathology was severe, and was likely to be the strongest pathological contributor to clinical symptoms and patterns of neurodegeneration. In addition, our model was tested by including participants with ADNC3 and low-level Lewy body neuropathology. Given the prevalence of comorbidities between severe AD and Lewy bodies in real-world subjects, the comparable performances (Supplementary Material D) further demonstrated our models’ utilities with a more comprehensive representation of real-world severe AD cases. The relatively limited number of participants in the ADNC0&1 group might restrict us from observing any significant differences by including more participants with ADNC3 and Lewy bodies.
Additional limitations arise in our use of data from the NACC database, as there is relatively limited representation of racial and ethnic minorities with an overrepresentation of a highly educated and non-Hispanic White population in NACC. It remains unclear whether our results would generalize well to more diverse samples. Future efforts focusing on replicating and validating our models in novel diverse cohorts would be necessary before potential utilities.
It is also important to highlight that even though all features included and retained in our machine learning models are clinically accessible, they may not be widely available, especially outside of specialty clinics. For instance, to achieve the best performance of our model, either genotyping or sequencing analyses are required to obtain the APOE genotype. Thickness measurements for meta-ROIs also require detailed processing of structural MRI scans. Therefore, while our models are still optimized for research settings and have the potential for clinical applications, they cannot be deployed currently in non-specialized clinical settings (e.g., primary care).
Furthermore, although we demonstrated that thickness measures did not significantly differ among scanner types, we observed a trend of scanner effect on thickness measures in our relatively small samples (Supplementary Material A). For future studies with larger samples, harmonization of thickness measures across scanners might be preferrable, such as those produced by the ComBAT tool [48]. In addition, the current study did not assess the model performance with other features that might be available in specialized clinics, such as neuropsychological measures or blood-based biomarkers. We did not seek access to these features from NACC to train our model, as 1) our validation cohort (CNTN) had limited information on these features, and 2) these features might be invasive, subjective and more variable. Nevertheless, if these features are easily available, future initiatives should be undertaken to develop similar approaches to those presented here.
Conclusion
We have developed machine learning models to classify the presence or absence of severe AD neuropathology using clinically accessible features. Satisfactory accuracies are obtained in classifying both postmortem confirmed AD neuropathological status on the cross-validation data set and in vivo amyloid status on the external validation data set. Our models further indicate that APOE genotype and cortical thinning encompassing AD meta-ROIs are the most important biological features for classifying AD neuropathological status. Therefore, the retained MRI features may represent an AD-specific neurodegeneration pattern within the ATN framework. Future replications and validations on ethnically and racially diverse samples with balanced pathology groups are necessary before potential clinical utilities.
AUTHOR CONTRIBUTIONS
Xiaowei Zhuang (Conceptualization; Data curation; Formal analysis; Investigation; Methodology; Validation; Visualization; Writing – original draft; Writing – review & editing); Dietmar Cordes (Conceptualization; Formal analysis; Funding acquisition; Investigation; Resources; Supervision; Visualization; Writing – review & editing); Andrew R. Bender (Conceptualization; Investigation; Validation; Visualization; Writing – review & editing); Rajesh Nandy (Methodology; Visualization; Writing – review & editing); Edwin C. Oh (Resources; Supervision; Visualization; Writing – review & editing); Jefferson Kinney (Data curation; Funding acquisition; Resources; Writing – review & editing); Jessica Z.K. Caldwell (Data curation; Funding acquisition; Resources; Writing – review & editing); Jeffrey Cummings (Conceptualization; Data curation; Funding acquisition; Resources; Supervision; Visualization; Writing – review & editing); Justin Miller (Conceptualization; Data curation; Formal analysis; Funding acquisition; Investigation; Methodology; Resources; Supervision; Validation; Visualization; Writing – review & editing).
ACKNOWLEDGMENTS
The NACC database is funded by NIA/NIH Grant U24 AG072122. NACC data are contributed by the NIA-funded ADRCs: P30 AG062429 (PI James Brewer, MD, PhD), P30 AG066468 (PI Oscar Lopez, MD), P30 AG062421 (PI Bradley Hyman, MD, PhD), P30 AG066509 (PI Thomas Grabowski, MD), P30 AG066514 (PI Mary Sano, PhD), P30 AG066530 (PI Helena Chui, MD), P30 AG066507 (PI Marilyn Albert, PhD), P30 AG066444 (PI John Morris, MD), P30 AG066518 (PI Jeffrey Kaye, MD), P30 AG066512 (PI Thomas Wisniewski, MD), P30 AG066462 (PI Scott Small, MD), P30 AG072979 (PI David Wolk, MD), P30 AG072972 (PI Charles DeCarli, MD), P30 AG072976 (PI Andrew Saykin, PsyD), P30 AG072975 (PI David Bennett, MD), P30 AG072978 (PI Neil Kowall, MD), P30 AG072977 (PI Robert Vassar, PhD), P30 AG066519 (PI Frank LaFerla, PhD), P30 AG062677 (PI Ronald Petersen, MD, PhD), P30 AG079280 (PI Eric Reiman, MD), P30 AG062422 (PI Gil Rabinovici, MD), P30 AG066511 (PI Allan Levey, MD, PhD), P30 AG072946 (PI Linda Van Eldik, PhD), P30 AG062715 (PI Sanjay Asthana, MD, FRCP), P30 AG072973 (PI Russell Swerdlow, MD), P30 AG066506 (PI Todd Golde, MD, PhD), P30 AG066508 (PI Stephen Strittmatter, MD, PhD), P30 AG066515 (PI Victor Henderson, MD, MS), P30 AG072947 (PI Suzanne Craft, PhD), P30 AG072931 (PI Henry Paulson, MD, PhD), P30 AG066546 (PI Sudha Seshadri, MD), P20 AG068024 (PI Erik Roberson, MD, PhD), P20 AG068053 (PI Justin Miller, PhD), P20 AG068077 (PI Gary Rosenberg, MD), P20 AG068082 (PI Angela Jefferson, PhD), P30 AG072958 (PI Heather Whitson, MD), P30 AG072959 (PI James Leverenz, MD).
The authors additionally thank all NACC and CNTN participants and their families for their support in AD research.
FUNDING
Research reported in this study was supported by an Institutional Development Award (IDeA) from the National Institute of General Medical Sciences of the National Institutes on Aging under grant number 5P20GM109025, and the Nevada Exploratory Alzheimer’s Disease Research Center (NVeADRC; P20-AG068053).
Ms. Zhuang, Dr. Cordes and Dr. Nandy are additionally supported by NIH grant RF1-AG071566. Ms. Zhuang is additionally supported by the young scientist award at Cleveland Clinic Lou Ruvo Center for Brain Health (Keep Memory Alive Foundation). Dr. Cordes is additionally supported by private grants from the Peter and Angela Dal Pezzo funds, from Lynn and William Weidner, and from Stacie and Chuck Matthewson. Dr. Cummings is additionally supported by NINDS grant U01NS093334; NIA grant R01AG053798; NIA grant P30AG072959; NIA grant R35AG71476; Alzheimer’s Disease Drug Discovery Foundation (ADDF); Ted and Maria Quirk Endowment; and the Joy Chambers-Grundy Endowment. Dr. Caldwell is additionally supported by NIA grants R01-AG074392, Cleveland Clinic Catalyst grant CCG0202; and The Women’s Alzheimer’s Movement at Cleveland Clinic.
CONFLICT OF INTEREST
Dr. Cummings has provided consultation to Acadia, Actinogen, Acumen, AlphaCognition, Aprinoia, AriBio, Artery, Biogen, BioVie, Cassava, Cerecin, Diadem, EIP Pharma, Eisai, GemVax, Genentech, GAP Innovations, Janssen, Jocasta, Karuna, Lilly, Lundbeck, LSP, Merck, NervGen, Novo Nordisk, Oligomerix, Optoceutics, Ono, Otsuka, PRODEO, Prothena, ReMYND, Roche, Sage Therapeutics, Signant Health, Simcere, Sunbird Bio, Suven, SynapseBio, TrueBinding, Vaxxinity, and Wren pharmaceutical, assessment, and investment companies.
All other authors have no conflict of interest to report.
DATA AVAILABILITY
De-identified data from NACC participants used in this study are available through NACC data request process (https://naccdata.org/requesting-data/data-request-process) for qualified researchers. For the CNTN data set, qualified researchers may obtain access to all de-identified data used in this study by submitting a request to https://nevadacntn.org/.
SUPPLEMENTARY MATERIAL
[1] The supplementary material is available in the electronic version of this article: https://dx.doi.org/10.3233/JAD231321.
REFERENCES
[1] | 2022 Alzheimer’s disease facts and figures. Alzheimers Dement 18: , 700–789. |
[2] | Gauthier S , Rosa-Neto P , Morais JA , Webster C ((2021) ) World Alzheimer Report 2021. Journey through the diagnosis of dementia. Alzheimer’s Disease International, London, UK. |
[3] | van Dyck CH , Swanson CJ , Aisen P , Bateman RJ , Chen C , Gee M , Kanekiyo M , Li D , Reyderman L , Cohen S , Froelich L , Katayama S , Sabbagh M , Vellas B , Watson D , Dhadda S , Irizarry M , Kramer LD , Iwatsubo T ((2023) ) Lecanemab in early Alzheimer’s disease. N Engl J Med 388: , 9–21. |
[4] | Budd Haeberlein S , Aisen PS , Barkhof F , Chalkias S , Chen T , Cohen S , Dent G , Hansson O , Harrison K , von Hehn C , Iwatsubo T , Mallinckrodt C , Mummery CJ , Muralidharan KK , Nestorov I , Nisenbaum L , Rajagovindan R , Skordos L , Tian Y , van Dyck CH , Vellas B , Wu S , Zhu Y , Sandrock A ((2022) ) Two randomized phase 3 studies of aducanumab in early Alzheimer’s disease. J Prev Alzheimers Dis 9: , 197–210. |
[5] | Aisen PS , Cummings J , Jack CR , Morris JC , Sperling R , Frölich L , Jones RW , Dowsett SA , Matthews BR , Raskin J , Scheltens P , Dubois B ((2017) ) On the path to 2025: Understanding the Alzheimer’s disease continuum. Alzheimers Res Ther 9: , 60. |
[6] | Jack CR , Bennett DA , Blennow K , Carrillo MC , Dunn B , Haeberlein SB , Holtzman DM , Jagust W , Jessen F , Karlawish J , Liu E , Molinuevo JL , Montine T , Phelps C , Rankin KP , Rowe CC , Scheltens P , Siemers E , Snyder HM , Sperling R , Elliott C , Masliah E , Ryan L , Silverberg N ((2018) ) NIA-AA Research Framework: Toward a biological definition of Alzheimer’s disease. Alzheimers Dement 14: , 535–562. |
[7] | Liu Z , Maiti T , Bender AR , Ezzati A ((2021) ) A role for prior knowledge in statistical classification of the transition from mild cognitive impairment to Alzheimer’s disease. J Alzheimers Dis 83: , 1859–1875. |
[8] | Pelka O , Friedrich CM , Nensa F , Mönninghoff C , Bloch L , Jöckel K-H , Schramm S , Sanchez Hoffmann S , Winkler A , Weimar C , Jokisch M ((2020) ) Sociodemographic data and APOE-ɛ4 augmentation for MRI-based detection of amnestic mild cognitive impairment using deep learning systems. PLoS One 15: , e0236868. |
[9] | Wang JX , Li Y , Li X , Lu ZH ((2022) ) Alzheimer’s disease classification through imaging genetic data with IGnet. Front Neurosci 16: , 846638. |
[10] | ten Kate M , Redolfi A , Peira E , Bos I , Vos SJ , Vandenberghe R , Gabel S , Schaeverbeke J , Scheltens P , Blin O , Richardson JC , Bordet R , Wallin A , Eckerstrom C , Molinuevo JL , Engelborghs S , van Broeckhoven C , Martinez-Lage P , Popp J , Tsolaki M , Verhey FRJ , Baird AL , Legido-Quigley C , Bertram L , Dobricic V , Zetterberg H , Lovestone S , Streffer J , Bianchetti S , Novak GP , Revillard J , Gordon MF , Xie Z , Wottschel V , Frisoni G , Visser PJ , Barkhof F ((2018) ) MRI predictors of amyloid pathology: Results from the EMIF-AD Multimodal Biomarker Discovery study. Alzheimers Res Ther 10: , 100. |
[11] | Márquez F , Yassa MA ((2019) ) Neuroimaging biomarkers for Alzheimer’s disease. Mol Neurodegener 14: , 21. |
[12] | Anand K , Sabbagh M ((2017) ) Amyloid imaging: Poised for integration into medical practice. Neurotherapeutics 14: , 54–61. |
[13] | Casanova R , Hsu FC , Barnard RT , Anderson AM , Talluri R , Whitlow CT , Hughes TM , Griswold M , Hayden KM , Gottesman RF , Wagenknecht LE ((2022) ) Comparing data-driven and hypothesis-driven MRI-based predictors of cognitive impairment in individuals from the Atherosclerosis Risk in Communities (ARIC) study. Alzheimers Dement 18: , 561–571. |
[14] | Beekly D , Schwabe-Fry K , Bollenbeck M , Thomas G , DeCarli CS , Carmichael OT , Kukull WA ((2017) ) [P1-405]: The National Alzheimer’s Coordinating Center: Development of the MRI, PET and CSF biomarker databases. Alzheimers Dement 13: , P429–P429. |
[15] | Petersen RC , Aisen PS , Beckett LA , Donohue MC , Gamst AC , Harvey DJ , Jack CR , Jagust WJ , Shaw LM , Toga AW , Trojanowski JQ , Weiner MW ((2010) ) Alzheimer’s Disease Neuroimaging Initiative (ADNI): Clinical characterization. Neurology 74: , 201. |
[16] | Baiardi S , Quadalti C , Mammana A , Dellavalle S , Zenesini C , Sambati L , Pantieri R , Polischi B , Romano L , Suffritti M , Bentivenga GM , Randi V , Stanzani-Maserati M , Capellari S , Parchi P ((2022) ) Diagnostic value of plasma p-tau181, NfL, and GFAP in a clinical setting cohort of prevalent neurodegenerative dementias. Alzheimers Res Ther 14: , 153. |
[17] | Allison SL , Koscik RL , Cary RP , Jonaitis EM , Rowley HA , Chin NA , Zetterberg H , Blennow K , Carlsson CM , Asthana S , Bendlin BB , Johnson SC ((2019) ) Comparison of different MRI-based morphometric estimates for defining neurodegeneration across the Alzheimer’s disease continuum. Neuroimage Clin 23: , 101895. |
[18] | Dickerson BC , Goncharova I , Sullivan MP , Forchetti C , Wilson RS , Bennett DA , Beckett LA , Detoledo-Morrell L ((2001) ) MRI-derived entorhinal and hippocampal atrophy in incipient and very mild Alzheimer’s disease. Neurobiol Aging 22: , 747–754. |
[19] | Jack CR Jr , Dickson DW , Parisi JE , Xu YC , Cha RH , O’Brien PC , Edland SD , Smith GE , Boeve BF , Tangalos EG , Kokmen E , Petersen RC ((2002) ) Antemortem MRI findings correlate with hippocampal neuropathology in typical aging and dementia. Neurology 58: , 750–757. |
[20] | Gorbach T , Pudas S , Lundquist A , Orädd G , Josefsson M , Salami A , de Luna X , Nyberg L ((2017) ) Longitudinal association between hippocampus atrophy and episodic-memory decline. Neurobiol Aging 51: , 167–176. |
[21] | Yavuz BB , Ariogul S , Cankurtaran M , Oguz KK , Halil M , Dagli N , Cankurtaran ES ((2007) ) Hippocampal atrophy correlates with the severity of cognitive decline. Int Psychogeriatr Assoc 19: , 767–777. |
[22] | Racine AM , Brickhouse M , Wolk DA , Dickerson BC ((2018) ) The personalized Alzheimer’s disease cortical thickness index predicts likely pathology and clinical progression in mild cognitive impairment. Alzheimers Dement (Amst) 10: , 301–310. |
[23] | Schwarz CG , Gunter JL , Wiste HJ , Przybelski SA , Weigand SD , Ward CP , Senjem ML , Vemuri P , Murray ME , Dickson DW , Parisi JE , Kantarci K , Weiner MW , Petersen RC , Jack CR ((2016) ) A large-scale comparison of cortical thickness and volume methods for measuring Alzheimer’s disease severity. Neuroimage Clin 11: , 802–812. |
[24] | Harper L , Bouwman F , Burton EJ , Barkhof F , Scheltens P , O’Brien JT , Fox NC , Ridgway GR , Schott JM ((2017) ) Patterns of atrophy in pathologically confirmed dementias: A voxelwise analysis. J Neurol Neurosurg Psychiatry 88: , 908–916. |
[25] | Fischl B ((2012) ) FreeSurfer. Neuroimage 62: , 774–781. |
[26] | Desikan RS , Ségonne F , Fischl B , Quinn BT , Dickerson BC , Blacker D , Buckner RL , Dale AM , Maguire RP , Hyman BT , Albert MS , Killiany RJ , Se F , Fischl B , Quinn BT , Dickerson BC , Blacker D , Buckner RL , Dale AM , Maguire RP , Hyman BT , Albert MS , Killiany RJ , Ségonne F , Fischl B , Quinn BT , Dickerson BC , Blacker D , Buckner RL , Dale AM , Maguire RP , Hyman BT , Albert MS , Killiany RJ , Se F , Fischl B , Quinn BT , Dickerson BC , Blacker D , Buckner RL , Dale AM , Maguire RP , Hyman BT , Albert MS , Killiany RJ ((2006) ) An automated labeling system for subdividing the human cerebral cortex on MRI scans into gyral based regions of interest. Neuroimage 31: , 968–980. |
[27] | Dickerson BC , Bakkour A , Salat DH , Feczko E , Pacheco J , Greve DN , Grodstein F , Wright CI , Blacker D , Rosas HD , Sperling RA , Atri A , Growdon JH , Hyman BT , Morris JC , Fischl B , Buckner RL ((2009) ) The cortical signature of Alzheimer’s disease: Regionally specific cortical thinning relates to symptom severity in very mild to mild AD dementia and is detectable in asymptomatic amyloid-positive individuals. Cereb Cortex 19: , 497–510. |
[28] | Leuzy A , Pascoal TA , Strandberg O , Insel P , Smith R , Mattsson-Carlgren N , Benedet AL , Cho H , Lyoo CH , Renaud , Joie L , Rabinovici GD , Ossenkoppele R , Rosa-Neto P , Hansson O ((2021) ) A multicenter comparison of [18 F]flortaucipir, [18 F]RO948, and [18 F] MK6240 tau PET tracers to detect a common target ROI for differential diagnosis. Eur J Nucl Med Mol Imaging 48: , 2295–2305. |
[29] | Jack CR , Wiste HJ , Weigand SD , Therneau TM , Lowe VJ , Knopman DS , Gunter JL , Senjem ML , Jones DT , Kantarci K , Machulda MM , Mielke MM , Roberts RO , Vemuri P , Reyes DA , Petersen RC ((2017) ) Defining imaging biomarker cut points for brain aging and Alzheimer’s disease. Alzheimers Dement 13: , 205–216. |
[30] | Therriault J , Pascoal TA , Benedet AL , Tissot C , Savard M , Chamoun M , Lussier F , Kang MS , Berzgin G , Wang T , Fernandes-Arias J , Massarweh G , Soucy JP , Vitali P , Saha-Chaudhuri P , Gauthier S , Rosa-Neto P ((2021) ) Frequency of biologically defined Alzheimer disease in relation to age, sex, APOE ɛ4, and cognitive impairment. Neurology 96: , e975–e985. |
[31] | Beekly DL , Ramos EM , Van Belle G , Deitrich W , Clark AD , Jacka ME , Kukull WA , -Alzheimer’s Disease Centers N ((2004) ) The National Alzheimer’s Coordinating Center (NACC) Database: An Alzheimer disease database purpose of the database. Alzheimer Dis Assoc Disord 18: , 270. |
[32] | Besser LM , Kukull WA , Teylan MA , Bigio EH , Cairns NJ , Kofler JK , Montine TJ , Schneider JA , Nelson PT ((2018) ) The Revised National Alzheimer’s Coordinating Center’s Neuropathology Form-available data and new analyses. J Neuropathol Exp Neurol 77: , 717–726. |
[33] | Besser L , Kukull W , Knopman DS , Chui H , Galasko D , Weintraub S , Jicha G , Carlsson C , Burns J , Quinn J , Sweet RA , Rascovsky K , Teylan M , Beekly D , Thomas G , Bollenbeck M , Monsell S , Mock C , Zhou XH , Thomas N , Robichaud E , Dean M , Hubbard J , Jacka M , Schwabe-Fry K , Wu J , Phelps C , Morris JC ((2018) ) Version 3 of the National Alzheimer’s Coordinating Center’s Uniform Data Set. Alzheimer Dis Assoc Disord 32: , 351–358. |
[34] | Hyman BT , Phelps CH , Beach TG , Bigio EH , Cairns NJ , Carrillo MC , Dickson DW , Duyckaerts C , Frosch MP , Masliah E , Mirra SS , Nelson PT , Schneider JA , Thal DR , Thies B , Trojanowski JQ , Vinters H V. , Montine TJ ((2012) ) National Institute on Aging-Alzheimer’s Association guidelines for the neuropathologic assessment of Alzheimer’s disease. Alzheimers Dement 8: , 1. |
[35] | Liang Zhi-Pei , Lauterbur Paul C. ((1999) ) Principles of Magnetic Resonance Imaging: A Signal Processing Perspective, Wiley-IEEE Press. |
[36] | Esteban O , Birman D , Schaer M , Koyejo OO , Poldrack RA , Gorgolewski KJ ((2017) ) MRIQC: Advancing the automatic prediction of image quality in MRI from unseen sites. PLoS One 12: , e0184661. |
[37] | Ritter A , Cummings J , Nance C , Miller JB ((2018) ) Neuroscience learning from longitudinal cohort studies of Alzheimer’s disease: Lessons for disease-modifying drug programs and an introduction to the Center for Neurodegeneration and Translational Neuroscience. Alzheimers Dement (N Y) 4: , 350–356. |
[38] | Landau SM , Mintun MA , Joshi AD , Koeppe RA , Petersen RC , Aisen PS , Weiner MW , Jagust WJ ((2012) ) Amyloid deposition, hypometabolism, and longitudinal cognitive decline. Ann Neurol 72: , 578–586. |
[39] | Tibshirani R ((1996) ) Regression shrinkage and selection via the Lasso. J R Stat Soc B Methodol 58: , 267–288. |
[40] | Hastie T , Tibshirani R , Friedman J ((2009) ) The Elements of Statistical Learning, Springer New York, New York, NY. |
[41] | Hamilton RL ((2000) ) Lewy bodies in Alzheimer’s disease: A neuropathological review of 145 cases using α-synuclein immunohistochemistry. Brain Pathol 10: , 378–384. |
[42] | Whitwell JL , Dickson DW , Murray ME , Weigand SD , Tosakulwong N , Senjem ML , Knopman DS , Boeve BF , Parisi JE , Petersen RC , Jack CR , Josephs KA ((2012) ) Neuroimaging correlates of pathologically defined subtypes of Alzheimer’s disease: A case-control study. Lancet Neurol 11: , 868–877. |
[43] | Nelson PT , Head E , Schmitt FA , Davis PR , Neltner JH , Jicha GA , Abner EL , Smith CD , Van Eldik LJ , Kryscio RJ , Scheff SW ((2011) ) Alzheimer’s disease is not “brain aging”: Neuropathological, genetic, and epidemiological human studies. Acta Neuropathol 121: , 571–587. |
[44] | Buchanan CR , Muñoz Maniega S , Valdés Hernández MC , Ballerini L , Barclay G , Taylor AM , Russ TC , Tucker-Drob EM , Wardlaw JM , Deary IJ , Bastin ME , Cox SR ((2021) ) Comparison of structural MRI brain measures between 1.5 and 3 T: Data from the Lothian Birth Cohort 1936. Hum Brain Mapp 42: , 3905. |
[45] | Heinen R , Bouvy WH , Mendrik AM , Viergever MA , Biessels GJ , de Bresser J ((2016) ) Robustness of automated methods for brain volume measurements across different MRI field strengths. PLoS One 11: , e0165719. |
[46] | Llamas-Rodríguez J , Oltmer J , Marshall M , Champion S , Frosch MP , Augustinack JC ((2023) ) TDP-43 and tau concurrence in the entorhinal subfields in primary age-related tauopathy and preclinical Alzheimer’s disease. Brain Pathol 33: , e13159. |
[47] | Wisse LEM , Ravikumar S , Ittyerah R , Lim S , Lane J , Bedard ML , Xie L , Das SR , Schuck T , Grossman M , Lee EB , Tisdall MD , Prabhakaran K , Detre JA , Mizsei G , Trojanowski JQ , Artacho-Pérula E , de Iñiguez de Onzono Martin MM , M. Arroyo-Jiménez M , Muñoz Lopez M , Molina Romero FJ , P. Marcos Rabal M , Cebada Sánchez S , Delgado González JC , de la Rosa Prieto C , Córcoles Parada M , Wolk DA , Irwin DJ , Insausti R , Yushkevich PA ((2021) ) Downstream effects of polypathology on neurodegeneration of medial temporal lobe subregions. Acta Neuropathol Commun 9: , 128. |
[48] | Bell TK , Godfrey KJ , Ware AL , Yeates KO , Harris AD ((2022) ) Harmonization of multi-site MRS data with ComBat. Neuroimage 257: , 119330. |


