
Characteristics of Drawing Process Differentiate Alzheimer’s Disease and Dementia with Lewy Bodies
Abstract
Background:
Early differential diagnosis of Alzheimer’s disease (AD) and dementia with Lewy bodies (DLB) is important for treatment and disease management, but it remains challenging. Although computer-based drawing analysis may help differentiate AD and DLB, it has not been studied.
Objective:
We aimed to identify the differences in features characterizing the drawing process between AD, DLB, and cognitively normal (CN) individuals, and to evaluate the validity of using these features to identify and differentiate AD and DLB.
Methods:
We collected drawing data with a digitizing tablet and pen from 123 community-dwelling older adults in three clinical diagnostic groups of mild cognitive impairment or dementia due to AD (n = 47) or Lewy body disease (LBD; n = 27), and CN (n = 49), matched for their age, sex, and years of education. We then investigated drawing features in terms of the drawing speed, pressure, and pauses.
Results:
Reduced speed and reduced smoothness in speed and pressure were observed particularly in the LBD group, while increased pauses and total durations were observed in both the AD and LBD groups. Machine-learning models using these features achieved an area under the receiver operating characteristic curve (AUC) of 0.80 for AD versus CN, 0.88 for LBD versus CN, and 0.77 for AD versus LBD.
Conclusion:
Our results indicate how different types of drawing features were particularly discriminative between the diagnostic groups, and how the combination of these features can facilitate the identification and differentiation of AD and DLB.
INTRODUCTION
Alzheimer’s disease (AD) and dementia with Lewy bodies (DLB) are the two most common types of late-onset neurodegenerative dementias [1, 2]. Early and accurate differentiation of AD and DLB is important to ensure appropriate management and treatment of the disease [3, 4], but similarities in clinical manifestations often result in difficulties with clinical diagnosis [2, 3]. Although biomarkers in cerebrospinal fluid and neuroimaging are the most well-validated diagnostic biomarkers [3, 5, 6], they can be invasive, time-consuming, and expensive. Therefore, the development of easy-to-use tools for identifying and differentiating AD and DLB could help screen candidates who should be examined with the biomarkers and comprehensive neuropsychological testing for diagnostic decision-making.
Drawing behaviors may be a promising data source for the development of screening tools for AD and DLB, as drawing is a complex activity involving multiple cognitive and motor functions related to AD and DLB [7, 8]. Drawing tests, such as pentagon-copying and clock-drawing tests, have been widely used for screening cognitive impairment and dementia [9]. For differentiation of AD and DLB, although a meta-analysis showed mixed results for the statistical significance of individual tests between AD and DLB [10], studies have reported more severe deficits in DLB than in AD in terms of the visuospatial/constructional abilities assessed by drawing tests [11–13]. This tendency has been confirmed in different populations with varying levels of education [14]. Also, for DLB, drawing test scores have been associated with the severity of its motor symptoms [15].
In addition to conventional scoring methods based on the drawing outcome, digital technologies such as a digitizing tablet and pen enable detailed analysis of the drawing process by recording a multitude of drawing behaviors such as the pen trajectory, pressure, and pauses between strokes [16, 17]. For example, reduced drawing speed as well as increased pauses have been reported as statistically significant features for detecting AD and mild cognitive impairment (MCI) [18–21]. However, no such investigation has taken place for the identification of DLB nor the differentiation between AD and DLB. Of note, an analysis of the drawing process has been reported to be useful in differentiating Parkinson’s disease (PD), another form of Lewy body spectrum disorders, from other diseases with overlapping clinical manifestations [16, 22]. Together, such detailed analysis of the drawing process may help explore sensitive markers for identifying and differentiating AD and DLB.
In this study, we aimed to examine the feasibility of computer-based analysis of features characterizing the drawing process to identify and differentiate AD and DLB. On the basis of previous studies, we hypothesized that both AD and DLB patients would demonstrate significant differences in drawing features, and that these differences would be larger in DLB patients. We also hypothesized that these drawing features would be useful for reliably identifying patients as distinguished from cognitively normal (CN) individuals, as well as for differentiating AD and DLB patients. We collected drawing data with a digitizing tablet and pen from participants in clinical diagnostic groups of MCI/dementia due to AD or Lewy body disease (LBD), and CN. We then extracted drawing features that characterized the drawing process in terms of the drawing speed, pressure, and pauses. Finally, we tested the first hypothesis by statistically comparing the drawing features between the diagnostic groups, and we tested the second hypothesis by assessing the performance of machine-learning models using these features to identify and differentiate AD and DLB. In addition, we aimed to explore what kinds of drawing features and tasks would be useful for identifying and differentiating AD and DLB in both statistical and machine-learning analyses.
MATERIALS AND METHODS
Participants
We recruited outpatients from the Department of Psychiatry, University of Tsukuba Hospital, the spouses of the patients, and other participants either through local recruiting agencies or community advertisements in Ibaraki, Japan. The patients met the standard research diagnostic criteria for MCI/dementia due to AD or LBD. Specifically, the patients in the AD group fulfilled the National Institute on Aging and Alzheimer’s Association core clinical criteria for probable AD dementia [5] or MCI [23], as well as the AD Neuroimaging Initiative criteria for AD or MCI [24]. The patients in the LBD group fulfilled McKeith et al.’s clinical diagnosis criteria for probable/possible DLB [3] or MCI with Lewy bodies (MCI-LB) [25]. Participants were excluded if they had diagnoses of other types of dementia or MCI (e.g., vascular dementia [26]), or other serious diseases or disabilities that would interfere with the collection of drawing data. The CN participants were age-matched to the patients and did not meet any of the above criteria. Three psychiatrists (authors T.A., K.N., and M.O.), who are experts in dementia and were blind to the results of the drawing data analysis, examined each case in terms of the clinical record, as well as the cognitive and clinical measures, and they confirmed the diagnoses.
The participants were administered cognitive and clinical examinations, which comprised 12 variables. The cognitive measures comprised the Mini-Mental State Examination (MMSE), the Frontal Assessment Battery, immediate and delayed recall of Logical Memory Story A from the Wechsler Memory Scale-Revised, the Trail Making Test parts A and B (TMT-A and TMT-B), and the Clock Drawing Test (CDT). All cognitive measures were assessed by trained neuropsychologists. For the TMT-A and TMT-B scores, we used a standard limit of 300 seconds [27]. For the CDT score, we used Solomon et al.’s 7-point scale [28]. As for the clinical measures, we used the Clinical Dementia Rating, the Geriatric Depression Scale, the Barthel Index of Activities of Daily Living, the Lawton Instrumental Activities of Daily Living, and the severity of medial temporal lobe atrophy according to structural magnetic resonance imaging (see Supplementary Method 1 for the imaging details).
The study was conducted under the approval of the Ethics Committee, University of Tsukuba Hospital (H29-065), and it followed the ethical code for research with humans as stated in the Declaration of Helsinki. All participants provided written informed consent to participate in the study. All examinations were conducted in Japanese.
Drawing data collection and feature extraction
During the cognitive assessments, the participants performed five tasks by using a digitizing tablet and pen (Wacom Cintiq Pro 16; sampling rate: 180 Hz; pen pressure levels: 8,192; pen inclination resolution: 1 degree; screen size: 345 × 194 mm (2560 × 1440 pixels)). Specifically, the following tasks were administered: the sentence-writing and pentagon-copying items of the MMSE [29], the TMT-A and TMT-B [27], and the CDT [28]. Regarding the specifics of the tasks, the sentence-writing task required writing a spontaneous sentence. The pentagon-copying task required copying a figure of intersecting pentagons. The TMT-A task required drawing lines to connect circles that represent consecutive numbers distributed in space (i.e., 1-2-3 \dots). The TMT-B task required drawing lines to connect numbers and letters alternately in their respective sequences (i.e., 1-A-2-B-3-C \dots). Finally, the CDT task required following a verbal instruction to draw an analog clock face (outer circle, numbers, and hands) to show 10 minutes after 10 o’clock.
We extracted eight types of drawing features from each task (8 types×5 tasks = 40 features in total), following previous studies on the use of drawing analysis with AD and PD [16, 21, 30, 31]. Specifically, the drawing features comprised three types of speed-related features, including the drawing speed and its variability and non-smoothness; two types of pressure-related features, including the pressure variability and non-smoothness; and three types of pause-related features, including the mean pause duration between drawing motions (i.e., between strokes and within a stroke), the pause/drawing duration ratio (i.e., the ratio of the pause and drawing durations), and adjusted total duration (i.e., the sum of the pause and drawing durations, per unit stroke length). The drawing speed represented the speed of the pen tip on the surface during drawing motions. The variabilities were evaluated using the coefficient of variation to remove the effect of the absolute value. The features for non-smoothness were calculated using the number of local extrema per unit length. Pauses within a stroke were detected when the pen tip’s movement was within a circle of radius 0.5 mm (approximately 4 pixels) on the drawing surface for more than 100 ms. These parameters were empirically determined. Note that to obtain a common set of drawing features for all five tasks, we did not include task-specific features such as linguistic features for the sentence-writing task [32] or the number of errors for the TMT tasks [33].
Statistical analysis
Group differences between AD, LBD, and CN in terms of the demographics and cognitive/clinical measures were examined by using the chi-square test for categorical data and one-way analysis of variance (ANOVA) tests for continuous data. To test the hypothesis that both AD and DLB patients would demonstrate differences in drawing features, between-group comparisons of the drawing features were conducted with one-way analysis of covariance (ANCOVA) tests, with the age, sex, and years of education as covariates. For multiple testing of the 40 drawing features, Benjamini-Hochberg correction was applied. Post-hoc pairwise comparisons between the diagnostic groups were performed by using Tukey-Kramer tests for continuous data and chi-square tests for categorical data. To assess the effect size of each feature, we calculated the generalized eta-squared (η2), for which the values 0.01, 0.06, and 0.14 are considered to indicate small, medium, and large effects, respectively [34]. All the statistical analyses were performed using R (version 4.0.5) with an alpha value of 0.05 (p < 0.05, two-sided).
Machine-learning analysis
To evaluate the validity of using drawing features to identify and differentiate AD and DLB, we used supervised machine-learning models to classify the diagnostic groups via the drawing features. The input variables for the models were the 40 drawing features extracted from the five different tasks, and the three types of demographic information, i.e., age, sex, and years of education (43 features in total). In our previous study, the drawing features extracted from these five tasks could capture different, complementary aspects of cognitive impairments and improve the classification accuracy for CN, MCI, and AD, as compared with a model based on a single task [35]. Therefore, we focused here on the classification performance by combining the five tasks rather than by using individual tasks.
The model performance was evaluated with a 10×10 nested cross-validation procedure. We used this procedure to tune the hyperparameters and train the models independently on the test data to reduce overfitting [36, 37] (see Supplementary Figure 1 for a schematic overview of the nested cross-validation procedure). In the outer loop, the dataset was split into training (9/10) and test (1/10) partitions, and each test partition was later used as an independent testing set. In the inner loop, each training partition was further split into inner training and testing folds by using another ten-fold cross-validation procedure to tune the hyperparameters. To reduce overfitting, we first applied feature selection by using elastic net regularization with regularization parameters ranging from 0.1 (i.e., closer to the L2 norm) to 1.0 (i.e., the L1 norm) throughout the same nested cross-validation procedure. After feature selection, the classification model’s hyperparameters were chosen in the inner loop on the basis of the training partitions through a grid-search method. The procedure was repeated 10 times with different training and test partitions, and the model performance was evaluated with the area under the receiver operating characteristic curve (AUC) as well as the accuracy. A three-class AUC was computed as defined by Hand and Till [38]. Because our dataset was imbalanced in terms of the clinical diagnostic groups, we used stratified sampling in the cross-validation procedure such that each fold contained approximately the same proportion of the different diagnostic groups.
For the classification algorithm, we used a random forest implemented with the Python package scikit-learn (version 0.23.2) to capture nonlinear relationships, given that nonlinear interactions between drawing features and cognitive impairments were observed in previous studies [21, 31, 35] (see Supplementary Method 2 for the details of the model hyperparameters). For missing values, we applied multivariate imputation by chained equations [39].
The significance of the classification performance derived from the nested cross-validation was determined through permutation tests. Specifically, we randomly permuted the participants’ diagnosis labels and performed the same nested cross-validation procedure described above. We performed 1,000 permutations to build a null distribution for the classification performance. When the performance value achieved with the true data was greater than 95% (p < 0.05) of that achieved during the permutations, we considered the classification performance to be significantly greater than chance.
To identify the features that most contributed to the classification in terms of both robustness across different training sets and impact on the final model, we carried out the following investigation into the classification models. First, we ranked the features in accordance with the selection frequency and chose features with repeat occurrences over 50%, aiming to exclude non-robust features across different training sets. We then evaluated the importance of each feature by calculating SHapley Additive exPlanations (SHAP) values on the basis of their impact on the model output [40]. Specifically, we compared the mean absolute SHAP values of each feature. The following Python packages were used: scikit-learn (version 0.23.2) and SHAP (version 0.40.0).
RESULTS
Sample characteristics
A total of 123 participants met the inclusion criteria. They comprised three diagnostic groups of 47 AD, 27 LBD, and 49 CN participants (see Table 1 for the demographic and cognitive/clinical information on all three groups, and Supplementary Table 1 for additional clinical information on the LBD group). The sample size met the requirement for a power analysis (>21 for each group) to detect an effect size of Cohen’s f = 0.4 with a power of 0.8 at α= 0.05. The AD and LBD groups included 25 and 19 MCI patients, respectively, and their proportions were not statistically significantly different (p = 0.229). Regarding the demographics, neither the age, proportion of female participants, nor years of education showed any statistically significant differences among the groups (p > 0.05). The proportion of participants on antipsychotic medication was higher for the LBD group than for the CN group (p = 0.002 among the three groups; p = 0.003 for LBD versus CN). All 12 cognitive and clinical measures except for the Geriatric Depression Scale were different among the diagnostic groups (all p < 0.05; Table 1). As for the MMSE sub-items, the pentagon-copying score was not statistically significantly different between the AD and LBD groups, while it was lower for the AD and LBD groups than for the CN group (p = 0.029). The sentence-writing score did not show any statistically significant differences among the groups (p = 0.890). Detailed information about missing values in the drawing data is reported in Supplementary Result 1.
Table 1
Participant demographics and cognitive/clinical measures
| AD (n = 47) | LBD (n = 27) | CN (n = 49) | p | |
| Age, y, mean ± SD | 73.2 ± 6.6 | 75.1 ± 5.0 | 72.3 ± 3.8 | 0.103 |
| Sex, female, n (%) | 21 (44.7%) | 12 (44.4%) | 31 (63.3%) | 0.128 |
| Education, y, mean ± SD | 13.1 ± 2.8 | 12.7 ± 2.8 | 13.1 ± 2.0 | 0.748 |
| MCI, n (%) | 25 (53.2%) | 19 (70.4%) | NA | 0.229 |
| Antipsychotic medication, n (%) | 3 (6.5%)1 | 6 (23.1%)C,1 | 0 (0.0%)L | 0.002 |
| MMSE, mean ± SD | 23.2 ± 4.6L,C | 26.5 ± 3.6A | 28.0 ± 1.6A | <0.001 |
| MMSE sentence-writing, score = 1, n (%) | 46 (97.9%) | 26 (96.3%) | 48 (98.0%) | 0.890 |
| MMSE pentagon-copying, score = 1, n (%) | 39 (83.0%)C | 22 (81.5%)C | 48 (98.0%)A,L | 0.029 |
| Frontal Assessment Battery, mean ± SD | 10.9 ± 3.7C | 11.1 ± 4.1C | 13.6 ± 2.5A,L | <0.001 |
| Logical Memory-immediate, mean ± SD | 4.3 ± 3.5L,C | 7.9 ± 3.9A,C | 11.1 ± 3.3A,L | <0.001 |
| Logical Memory-delayed, mean ± SD | 2.1 ± 2.6L,C | 5.9 ± 4.1A,C | 9.2 ± 3.0A,L | <0.001 |
| TMT-A, mean ± SD | 54.4 ± 46.6 | 68.5 ± 54.0C | 36.0 ± 11.7L | 0.002 |
| TMT-B, mean ± SD | 166.3 ± 86.2C | 183.7 ± 86.8C | 91.6 ± 39.9A,L | <0.001 |
| CDT, mean ± SD | 6.0 ± 2.0C | 6.6 ± 1.1 | 6.7 ± 0.8A | 0.033 |
| Clinical Dementia Rating, mean ± SD | 0.7 ± 0.4C | 0.6 ± 0.4C | 0.0 ± 0.0A,L | <0.001 |
| Geriatric Depression Scale, mean ± SD | 3.7 ± 3.1 | 4.1 ± 3.9 | 3.2 ± 3.0 | 0.464 |
| Activities of Daily Living, mean ± SD | 98.3 ± 4.9 | 97.2 ± 5.9C | 99.7 ± 1.2L | 0.042 |
| Instrumental Activities of Daily Living, mean ± SD | 6.6 ± 1.7C | 6.1 ± 2.1C | 7.8 ± 0.6A,L | <0.001 |
| Medial temporal lobe atrophy, mean ± SD | 1.6 ± 1.0L,C | 1.1 ± 0.6A | 0.8 ± 0.5A | <0.001 |
Bold values highlight statistically significant differences (chi-square test, p < 0.05, for categorical data; one-way ANOVA, p < 0.05, for continuous data). Significant differences between individual diagnostic groups (chi-square test, p < 0.05, for categorical data; Tukey-Kramer test, p < 0.05, for continuous data) are marked with A, L, or C (A: different from AD; L: different from LBD; C: different from CN). The total score ranges are as follows: MMSE, 0 to 30; Frontal Assessment Battery, 0 to 18; Logical Memory-immediate and -delayed, 0 to 25; TMT-A and B, 0 to 300; CDT, 0 to 7; Geriatric Depression Scale, 0 to 15; Activities of Daily Living, 0 to 100; Instrumental Activities of Daily Living, 0 to 8. Logical Memory-immediate and Logical Memory-delayed respectively refer to immediate and delayed recall of Logical Memory Story A from the Wechsler Memory Scale-Revised. AD, Alzheimer’s disease; LBD, Lewy body disease; CN, cognitively normal; MCI, mild cognitive impairment; MMSE, Mini-Mental State Examination; TMT-A, Trail Making Test part A; TMT-B, Trail Making Test part B; CDT, Clock Drawing Test; ANOVA, analysis of variance. 1Data missing for one patient.
Differences in drawing features between AD, LBD, and CN groups
To test our first hypothesis, we investigated whether the drawing features had statistically discernable differences between the clinical diagnostic groups of AD, LBD, and CN. The ANCOVAs with age, sex, and years of education as covariates revealed that 34 of the 40 drawing features showed statistically significant differences between the diagnostic groups (Benjamini-Hochberg adjusted p < 0.05; Fig. 1A and Supplementary Table 2). Regarding the feature types, the following five types consistently showed significant differences in all five tasks: the drawing speed and its non-smoothness, pressure non-smoothness, mean pause duration, and adjusted total duration (Fig. 1A). In terms of the drawing tasks, all eight features derived from the CDT task showed significant differences across the clinical diagnostic groups (Fig. 1A). These 34 features all showed at least a medium effect size (η2 >0.06), with 15 features showing a large effect size (η2 >0.14). Regarding the overall trends, 31 of these 34 features showed larger differences from CN in the LBD group as compared with those in the AD group (Supplementary Table 2). The remaining three features were all pause-related, and the AD group showed a longer mean pause in the sentence-writing task and a greater pause/drawing duration ratio in the TMT-A and TMT-B tasks, as compared with the CN and LBD groups.
Fig. 1
Differences in drawing features between the clinical diagnostic groups of AD, LBD, and CN. A) Each square’s color represents the generalized eta-squared for one-way analyses of covariance (ANCOVAs) with the age, sex, and years of education as covariates. Red outlines represent drawing features with no statistically significant differences between the diagnostic groups (Benjamini-Hochberg adjusted p > 0.05). The rows indicate the feature types, and the columns indicate the drawing tasks. Sentence, sentence-writing item of the Mini-Mental State Examination (MMSE); Pentagon, pentagon-copying item of the MMSE; TMT-A, Trail Making Test part A; TMT-B, Trail Making Test part B; CDT, Clock Drawing Test. B) Mean Z-scores of the drawing features for each clinical diagnostic group, obtained by averaging across the five drawing tasks. The Z-score of each drawing feature was calculated by using the means and standard deviations for the CN group. AD, Alzheimer’s disease; LBD, Lewy body disease; CN, cognitively normal.
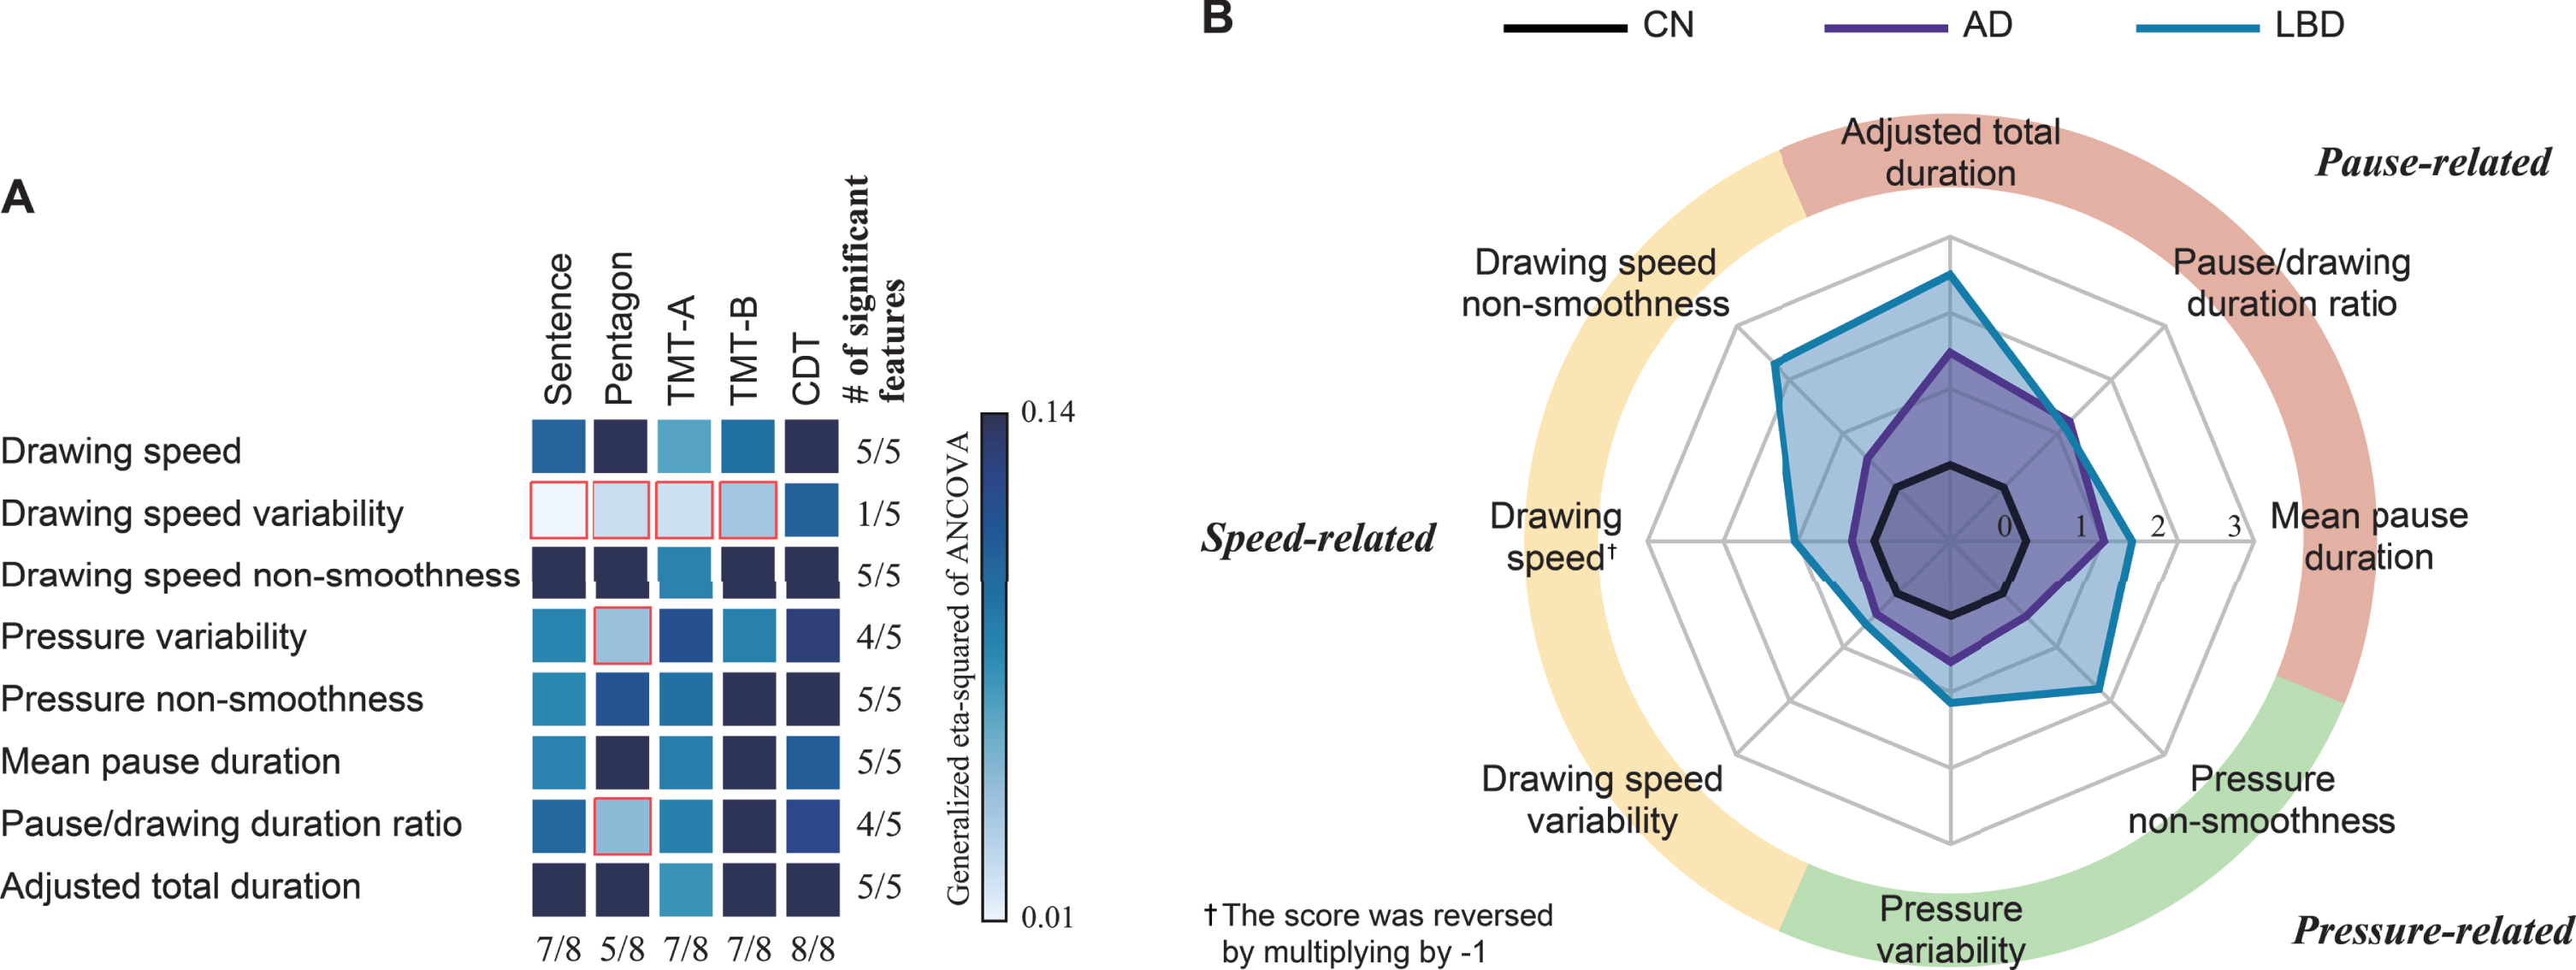
As an exploratory analysis, post-hoc pairwise comparisons revealed the following patterns of statistically significant differences (Tukey-Kramer adjusted p < 0.05; see Fig. 2 for the CDT features as representative examples and Supplementary Table 2 for the full results). Regarding the feature types, the overall trend was that the LBD and AD groups both showed comparable differences from CN in pause-related features, while the LBD group also showed significant differences in both speed- and pressure-related features (Fig. 1B). Specifically, 10 of the 12 features with significant differences between the AD and CN groups were pause-related (Supplementary Table 3). In particular, a longer mean pause was consistently observed for the AD group in all tasks except the pentagon-copying task. In contrast, features with statistical differences for differentiating LBD from CN occurred in all three categories of speed-, pressure-, and pause-related features (Supplementary Table 3). In particular, the smoothness in speed and pressure, as well as the drawing speed, was consistently lower in the LBD group as compared with CN for all five tasks. In terms of the drawing tasks, statistically significant features for discriminating LBD from CN were derived from all five tasks, while those for discriminating AD from CN were particularly derived from the CDT, TMT-A, and TMT-B tasks (Supplementary Table 4). On the other hand, features with statistically significant differences between the AD and LBD groups were particularly derived from the pentagon-copying and sentence-writing tasks (Supplementary Table 4).
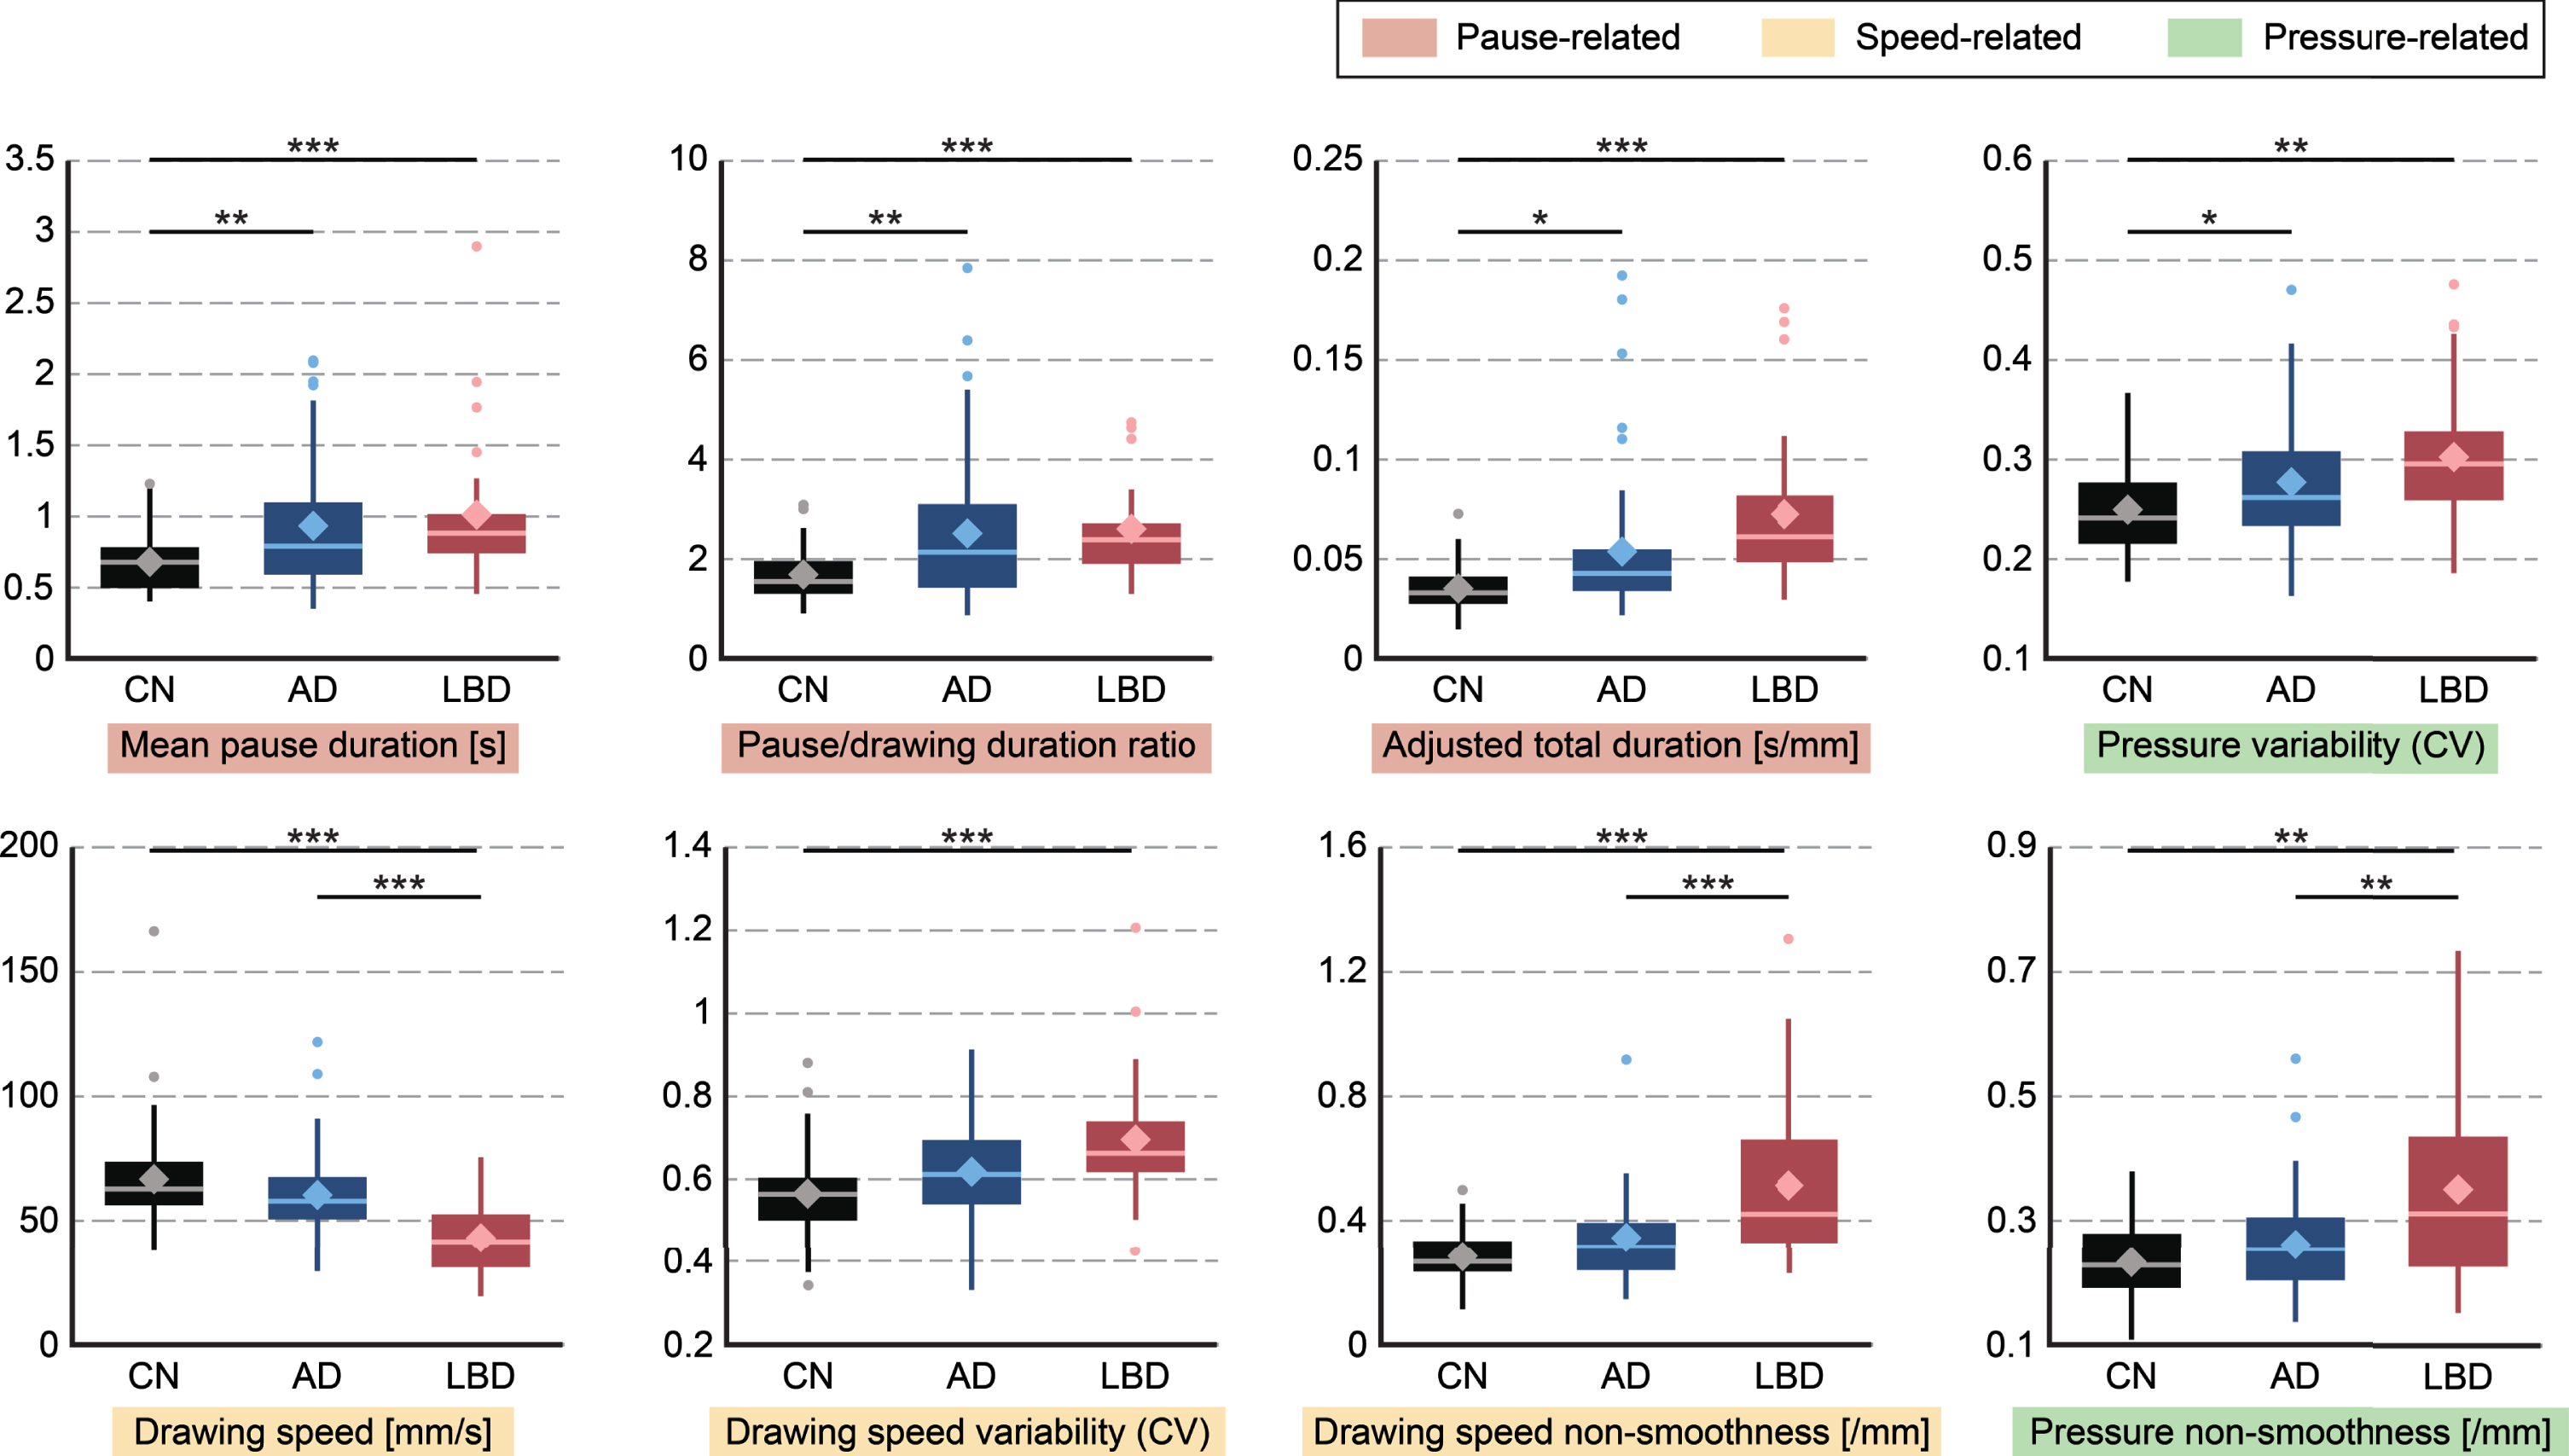
Fig. 2
Group differences in each drawing feature extracted from the CDT task. Horizontal bars indicate significant differences (Tukey-Kramer test: *p < 0.05, **p < 0.01, ***p < 0.001). Boxes indicate the 25th (Q1) and 75th (Q3) percentiles; whiskers indicate the upper and lower adjacent values that are most extreme within Q3+1.5(Q3-Q1) and Q1-1.5(Q3-Q1), respectively; the line and diamond in each box represent the median and mean, respectively; and dots denote outliers. AD, Alzheimer’s disease; LBD, Lewy body disease; CN, cognitively normal; CDT, Clock Drawing Test.
To investigate whether these differences in drawing features could be observed even in the MCI stage, we also compared them between MCI-AD, MCI-LB, and CN by using ANCOVAs with the age, sex, and years of education as covariates. Consequently, compared to patients with MCI-AD, patients with MCI-LB showed larger differences from CN and had more features with significant differences from CN. Specifically, among 25 features with significant differences among MCI-AD, MCI-LB, and CN, 24 features showed larger differences from CN in MCI-LB as compared with those in MCI-AD (Benjamini-Hochberg adjusted p < 0.05; Supplementary Table 5). Moreover, in MCI-LB and MCI-AD, 23 and three drawing features respectively showed significant differences from CN (Tukey-Kramer adjusted p < 0.05; Supplementary Table 5). Furthermore, the overall trend regarding the feature types remained the same as that for the clinical diagnostic groups of AD, LBD, and CN: MCI-LB showed significant differences from CN in speed-, pressure-, and pause-related features, while MCI-AD showed statistical differences only in pause-related features (Supplementary Table 6).
Model for classifying diagnosis groups by using drawing features
To test our second hypothesis, we evaluated the model by using drawing features for classifying the diagnostic groups with a nested cross-validation procedure. The classification models achieved an AUC of 0.80 (95% confidence interval (CI), 0.79 to 0.81; p < 0.001; 79.1% accuracy) for AD versus CN; an AUC of 0.88 (95% CI, 0.87 to 0.89; p < 0.001; 85.3% accuracy) for LBD versus CN; and an AUC of 0.77 (95% CI, 0.75 to 0.78; p = 0.009; 73.8% accuracy) for AD versus LBD. The three-class classification model for the AD, LBD, and CN groups achieved an AUC of 0.81 (95% CI, 0.81 to 0.82; p < 0.001; 68.6% accuracy). We also evaluated the models with different settings (i.e., number of outer folds = 10, 20; number of inner folds = 5, 10) and confirmed that their accuracies did not statistically change (p > 0.05).
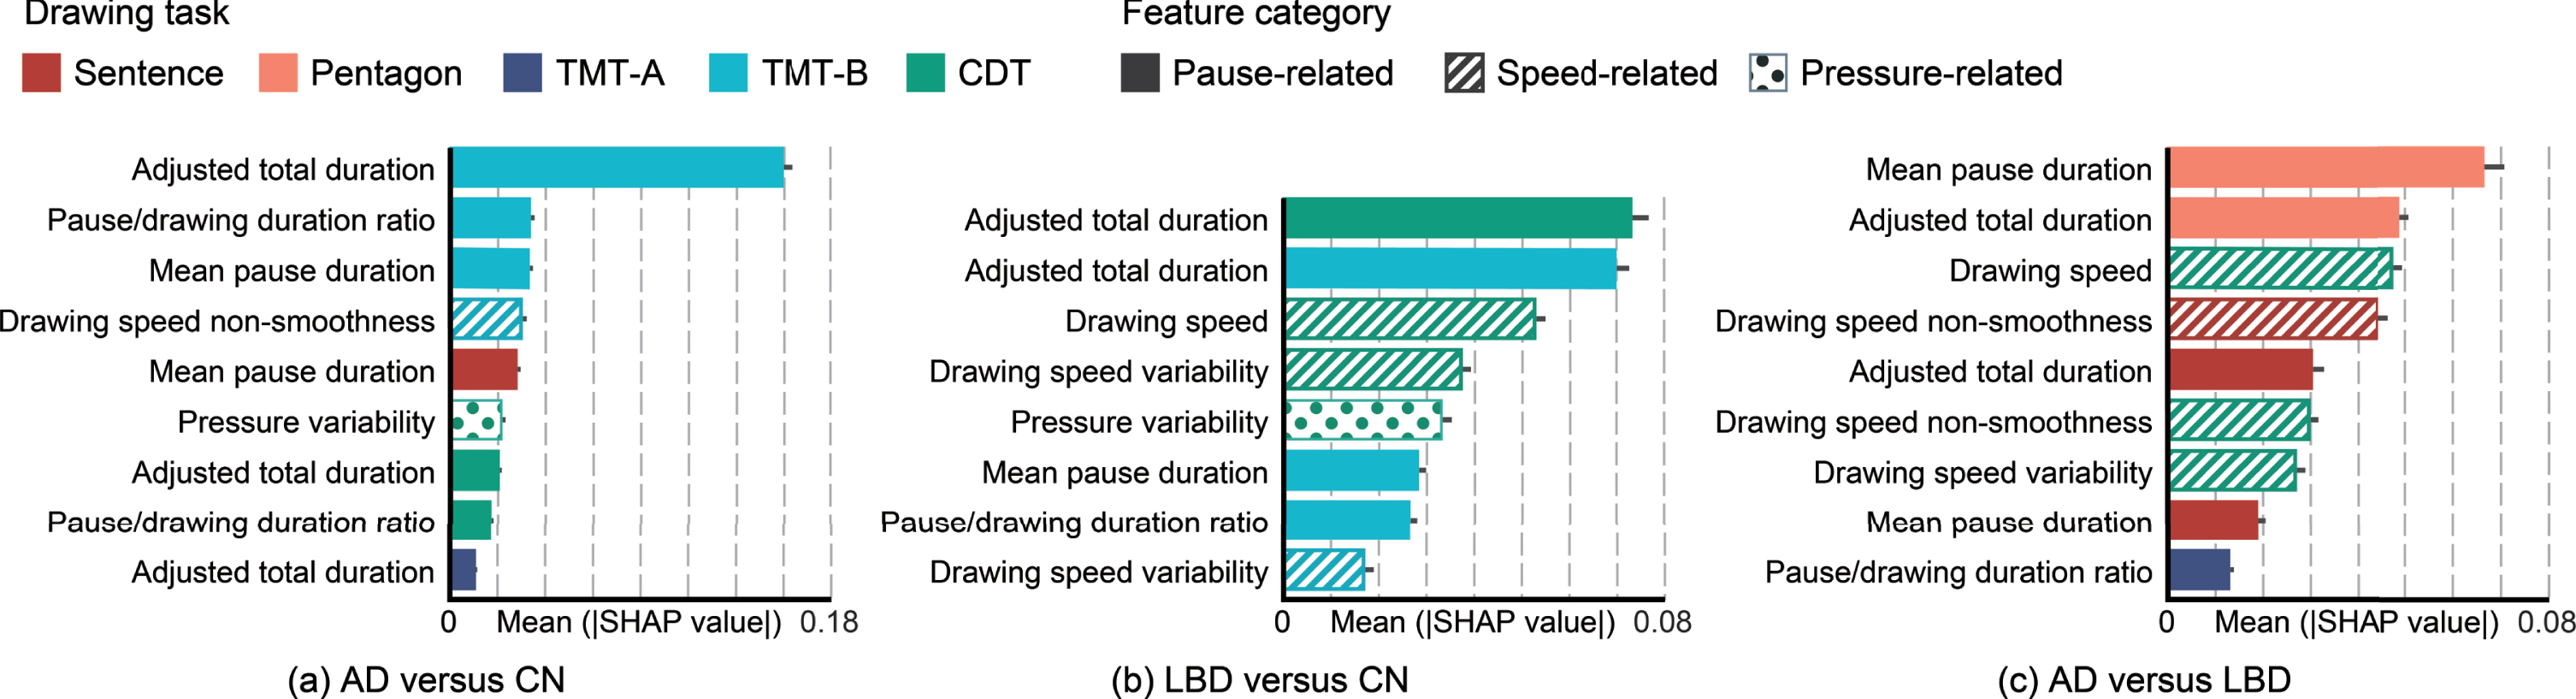
For an exploratory analysis, we next investigated the drawing tasks and feature types that contributed to identification and differentiation of AD and LBD in the classification models. From the results of feature selection (Fig. 3), each classification model mainly used nine drawing features for AD versus CN; eight drawing features for LBD versus CN; and nine drawing features for AD versus LBD. The demographic variables for age, sex, and years of education were not included. We then investigated the importance of each drawing feature by estimating SHAP values for each model (Fig. 3). Regarding the feature types, pause-related features dominantly contributed to differentiating AD from CN, while speed-related features in addition to pause-related features contributed to differentiating LBD from AD or CN. In addition to slower drawing speed in the LBD group, greater speed variability contributed to differentiating LBD from CN, and lower speed smoothness contributed to differentiating LBD from AD. In terms of drawing tasks, the classification models for differentiating AD or LBD from CN were mainly driven by features extracted from the TMT-B and CDT tasks. In contrast, the model for differentiating AD and LBD was driven by features extracted from the pentagon-copying task, followed by the CDT and sentence-writing tasks. Of note, the top three features in terms of the SHAP values were 100% selected for each model, which confirmed that the feature selection based on elastic net regularization and SHAP analysis produced consistent results.
Fig. 3
Comparison of the features’ importance in the classification models by drawing task and feature categories. Each plot presents the mean absolute SHAP value with a 95% confidence interval. AD, Alzheimer’s disease; LBD, Lewy body disease; CN, cognitively normal; SHAP, SHapley Additive exPlanations; Sentence, sentence-writing item of the Mini-Mental State Examination (MMSE); Pentagon, pentagon-copying item of the MMSE; TMT-A, Trail Making Test part A; TMT-B, Trail Making Test part B; CDT, Clock Drawing Test.
DISCUSSION
We investigated features characterizing the drawing process in terms of speed, pressure, and pauses by using data collected from 123 participants in the AD, LBD, and CN groups; as a result, we obtained three main findings. First, statistical analysis showed that the LBD group demonstrated larger differences in the drawing features than the AD group consistently across the five different tasks. As an overall trend, speed- and pressure-related features showed reduced speed and smoothness particularly in the LBD group, while pause-related features showed increased pauses and total durations in both the AD and LBD groups. This trend was still evident even in patients with MCI-AD and MCI-LB. Second, the combination of drawing features could identify and differentiate AD and LBD. Specifically, nested cross-validation showed that machine-learning models using these features achieved an AUC of 0.80 for AD versus CN, 0.88 for LBD versus CN, and 0.77 for AD versus LBD. Third, drawing features derived from different tasks played different roles in identifying and differentiating AD and LBD. Specifically, drawing features extracted from the TMT and CDT tasks showed statistically significant differences, particularly for AD or LBD versus CN, and they strongly contributed to the models for discriminating AD or LBD from CN. In contrast, drawing features extracted from the sentence-writing and pentagon-copying tasks showed statistical differences, particularly between the AD and LBD groups, and they strongly contributed to the models for differentiating AD and LBD. To the best of our knowledge, this is the first study to show the validity of using features characterizing the drawing process to identify and differentiate AD and DLB.
The LBD group showed larger differences in features characterizing the drawing process as compared with the AD group, thus matching our hypothesis on the basis of previous studies that reported greater visuospatial/constructional deficits in DLB patients than in equally demented AD patients [11–13]. Aligning with these previous studies on conventional cognitive measures for drawing tests, our study supports the feasibility of using drawing tests for differentiating AD and DLB, by showing discriminative patterns in drawing-process impairments that were consistent across different drawing tasks. Note that the LBD group showed a larger deviation from CN in terms of the drawing features, even though the AD group in our dataset had higher disease severity in terms of the MMSE score. This might indicate that the drawing features could be still discriminative between the two groups even if they were matched for severity.
A few early studies suggested that visuospatial deficits can be present in the prodromal stage of DLB [41, 42], and that this deficit in DLB is predictive of a more malignant disease course [43]. Of note, in our dataset, patients with MCI-LB showed greater deficits in terms of the drawing features than those with MCI-AD. Our results may suggest that the use of computer-based analysis of the drawing process in combination with conventional clinical scores for drawing tests could help differential diagnosis of AD and DLB at earlier stages. To confirm this hypothesis, we will need a further study focusing on the prodromal stages of AD and DLB, along with detailed clinical examinations on visuospatial/constructional abilities [44] to better associate drawing features with patients’ cognitive profiles. In addition, previous studies suggested that visuospatial deficits in AD and DLB were associated with distinct pathological substrates [45]. Further studies with pathological biomarkers may reveal unique signatures of drawing impairments that are reflective of underlying pathologies in AD and DLB.
Our results suggest that the combination of multiple drawing tasks varying in their sensitivity to AD and DLB could achieve both identification and differentiation of AD and DLB. Specifically, the identification of AD or DLB in contrast to CN was mainly driven by the features from the TMT and CDT tasks, while the differentiation of AD and DLB was particularly driven by the features from the sentence-writing and pentagon-drawing tasks, as well as the CDT. In addition to confirming the usefulness of the CDT and TMT tasks for identifying AD, which aligns with previous studies on the detection of AD and MCI [21, 35], our results highlight the usefulness of combining multiple drawing tasks for differentiating AD and DLB.
As for specific differences in the LBD group, our results demonstrated that this group had a slower drawing speed and reduced smoothness in speed and pressure consistently across all five tasks. Lower speed and smoothness have also been reported in PD [22], which indicates that these differences in drawing characteristics may capture common manifestations in the spectrum of Lewy body disorders. In the literature, although visuospatial and motor deficits are common symptoms in Lewy body disorders [46, 47], comparisons of visuospatial abilities in patients with these diseases have yielded mixed results, with some studies showing a similar level of impairments [43, 48, 49] and others showing differential deficits [12, 13, 45, 50]. Furthermore, motor performance in terms of gait, balance, and hand dexterity showed different patterns of deficits in DLB, PD, and PD dementia [51–53]. Detailed comparisons of drawing features among different Lewy body disorders may provide useful insights to deepen our understanding of the heterogeneous nature of this disease spectrum.
Computer-based, automated analysis of drawing data has been evaluated for its capability to help clinical diagnosis of dementias and related neurological diseases. Previous studies have shown its usefulness in the contexts of detecting MCI and AD [16, 31, 35], or PD [16, 22]; differentiating between AD and vascular dementia [54], or between amnestic and mixed/dysexecutive MCI [55]; estimating standard cognitive measures [56–59]; and investigating associations with amyloid and tau burden [60]. However, to the best of our knowledge, there has been no such investigation for identification of DLB or differentiation between AD and DLB, which we addressed in this study. In addition, several recent studies have investigated local temporal/spatial pattens within a drawing task, by using either hand-crafted, task-specific features (e.g., pauses before drawing numbers or hands in the CDT) [54, 55, 57], or machine-learned features extracted automatically through neural networks [61]. Those approaches differ from ours that used global features to capture the overall profile of the drawing process for each task. The adaptation of local features is a promising area of future research to improve the accuracy and interpretability of identification/differentiation of AD and DLB by better capturing different cognitive profiles in the two types of dementias.
Our findings can be incorporated into clinical practice, although further research is needed to investigate the real-world operability and acceptability of the proposed approach. To obtain drawing data, a range of commercial-grade digital devices is available, such as a mobile tablet with a stylus [17, 56, 62], a smart pad [63], and a digital pen [58]. As previous studies showed strong agreement between the results of digital and standard paper-based versions of drawing tests [56], clinicians may benefit from our findings without significantly altering their current routines.
The strengths of this study include a unique dataset of multi-task drawing data from individuals in three diagnostic groups, which led to unique insights into identifying and differentiating AD and DLB. However, there are several limitations. First, this study was limited by the small dataset with different sizes of diagnostic groups, which might affect the generalizability of our findings. Second, the patients were not explicitly matched for disease severity, and selection bias and residual confounding could exist because of the nature of convenience sampling. Although we adjusted for several covariates, we did not adjust our statistical analyses for co-morbidities and medications. Additionally, the detailed profile of visuospatial function was not assessed, even though it could have impacted the characteristics of the drawing process. To confirm our findings, further studies are required with stratified sampling to capture the representative variation in disease symptoms and cognitive dysfunction in AD and DLB [64]. Third, the diagnosis in our dataset was based on clinical features, and thus, DLB mixed with AD pathology could not be excluded [65]. Further research with validated neuropathological biomarkers is required. Fourth, our analysis only used global drawing features that captured the overall profile for each task. Further insights may be obtained by using in-depth features to capture local changes in drawing profiles within a task.
In conclusion, our results provide initial evidence of (i) discriminative differences in features characterizing the drawing process that would reflect cognitive and motor impairments in AD and DLB, and (ii) the feasibility of machine-learning models using these features to identify and differentiate AD and DLB. Specifically, we identified particular features and drawing tasks that could facilitate either the identification or differentiation of AD and DLB, and effective combination of those features and tasks could enable both identification and differentiation. A future study is needed to better understand the applicability of our findings to clinical practice and to other forms of Lewy body disorders and related diseases.
ACKNOWLEDGMENTS
This work was supported by the Japan Society for the Promotion of Science, KAKENHI (grant 19H01084). The funder did not play any active role in either the scientific investigation or the reporting of the study.
Authors’ disclosures available online (https://www.j-alz.com/manuscript-disclosures/22-0546r1).
SUPPLEMENTARY MATERIAL
[1] The supplementary material is available in the electronic version of this article: https://dx.doi.org/10.3233/JAD-220546.
REFERENCES
[1] | Savica R , Boeve BF , Logroscino G ((2016) ) Epidemiology of alpha-synucleinopathies: From Parkinson disease to dementia with Lewy bodies. Handb Clin Neurol 138: , 153–158. |
[2] | Chatterjee A , Hirsch-Reinshagen V , Moussavi SA , Ducharme B , Mackenzie IR , Hsiung GYR ((2021) ) Clinico-pathological comparison of patients with autopsy-confirmed Alzheimer’s disease, dementia with Lewy bodies, and mixed pathology. Alzheimers Dement (Amst.) 13: , e12189. |
[3] | McKeith IG , Boeve BF , Dickson DW , Halliday G , Taylor John , Weintraub D , Aarsland D , Galvin J , Attems J , Ballard CG , Bayston A , Beach TG , Blanc F , Bohnen N , Bonanni L , Bras J , Brundin P , Burn D , Chen-Plotkin A , Duda JE , El-Agnaf O , Feldman H , Ferman TJ , ffytche D , Fujishiro H , Galasko D , Goldman JG , Gomperts SN , Graff-Radford NR , Honig LS , Iranzo A , Kantarci K , Kaufer D , Kukull W , Lee VMY , Leverenz JB , Lewis S , Lippa C , Lunde A , Masellis M , Masliah E , McLean P , Mollenhauer B , Montine TJ , Moreno E , Mori E , Murray M , O’Brien JT , Orimo S , Postuma RB , Ramaswamy S , Ross OA , Salmon DP , Singleton A , Taylor A , Thomas A , Tiraboschi P , Toledo JB , Trojanowski JQ , Tsuang D , Walker Z , Yamada M , Kosaka K ((2017) ) Diagnosis and management of dementia with Lewy bodies: Fourth consensus report of the DLB Consortium. Neurology 89: , 88–100. |
[4] | Rasmussen J , Langerman H ((2019) ) Alzheimer’s disease – why we need early diagnosis. Degener Neurol Neuromuscul Dis 9: , 123–130. |
[5] | McKhann GM , Knopman DS , Chertkow H , Hyman BT , Jack CR Jr , Kawas CH , Klunk WE , Koroshetz WJ , Manly JJ , Mayeux R , Mohs RC , Morris JC , Rossor MN , Scheltens P , Carrillo MC , Thies B , Weintraub S , Phelps CH ((2011) ) The diagnosis of dementia due to Alzheimer’s disease: Recommendations from the National Institute on Aging-Alzheimer’s Association workgroups on diagnostic guidelines for Alzheimer’s disease. Alzheimers Dement 7: , 263–269. |
[6] | Dubois B , Feldman HH , Jacova C , Hampel H , Molinuevo JL , Blennow K , DeKosky ST , Gauthier S , Selkoe D , Bateman R , Cappa S , Crutch S , Engelborghs S , Frisoni GB , Fox NC , Galasko D , Habert M , Jicha GA , Nordberg A , Pasquier F , Rabinovici G , Robert P , Rowe C , Salloway S , Sarazin M , Epelbaum S , de Souza LC , Vellas B , Visser PJ , Schneider L , Stern Y , Scheltens P , Cummings JL ((2014) ) Advancing research diagnostic criteria for Alzheimer’s disease: The IWG-2 criteria. Lancet Neurol 13: , 614–629. |
[7] | Garre-Olmo J , Faúndez-Zanuy M , López-de-Ipiña K , Calvó-Perxas L , Turró-Garriga O ((2017) ) Kinematic and pressure features of handwriting and drawing: Preliminary results between patients with mild cognitive impairment, Alzheimer disease and healthy controls. Curr Alzheimer Res 14: , 960–968. |
[8] | van Galen GP ((1991) ) Handwriting: Issues for a psychomotor theory. Hum Mov Sci 10: , 165–191. |
[9] | Ismail Z , Rajji TK , Shulman KI ((2010) ) Brief cognitive screening instruments: An update. Int J Geriatr Psychiatry 25: , 111–120. |
[10] | Gurnani AS , Gavett BE ((2017) ) The differential effects of Alzheimer’s disease and Lewy body pathology on cognitive performance: A meta-analysis. Neuropsychol Rev 27: , 1–17. |
[11] | Ala TA , Hughes LF , Kyrouac GA , Ghobrial MW , Elble RJ ((2001) ) Pentagon copying is more impaired in dementia with Lewy bodies than in Alzheimer’s disease. J Neurol Neurosurg Psychiatry 70: , 483–488. |
[12] | Cormack F , Aarsland D , Ballard C , Tovée MJ ((2004) ) Pentagon drawing and neuropsychological performance in dementia with Lewy bodies, Alzheimer’s disease, Parkinson’s disease and Parkinson’s disease with dementia. Int J Geriat Psychiatry 19: , 371–377. |
[13] | Ferman TJ , Smith GE , Boeve BF , Graff-Radford NR , Lucas JA , Knopman DS , Petersen RC , Ivnik RJ , Wszolek Z , Uitti R , Dickson DW ((2006) ) Neuropsychological differentiation of dementia with Lewy bodies from normal aging and Alzheimer’s disease. Clin Neuropsychol 20: , 623–636. |
[14] | Oliveira FF , Machado FC , Sampaio G , Marin SMC , Chen ES , Smith MC , Bertolucci PHF ((2015) ) Contrasts between patients with Lewy body dementia syndromes and APOE-ɛ3/ɛ3 patients with late-onset Alzheimer disease dementia. Neurologist 20: , 35–41. |
[15] | Oliveira FF , Machado FC , Sampaio G , Marin SMC , Naffah-Mazzacoratti MG , Bertolucci PHF ((2020) ) Neuropsychiatric feature profiles of patients with Lewy body dementia. Clin Neurol Neurosurg 194: , 105832. |
[16] | Impedovo D , Pirlo G ((2019) ) Dynamic handwriting analysis for the assessment of neurodegenerative diseases: A pattern recognition perspective. IEEE Rev Biomed Eng 12: , 209–220. |
[17] | Impedovo D , Pirlo G , Vessio G , Angelillo MT ((2019) ) A handwriting-based protocol for assessing neurodegenerative dementia. Cogn Comput 11: , 576–586. |
[18] | Werner P , Rosenblum S , Bar-On G , Heinik J , Korczyn A ((2006) ) Handwriting process variables discriminating mild Alzheimer’s disease and mild cognitive impairment. J Gerontol B Psychol Sci Soc Sci 61: , P228–P236. |
[19] | Yan JH , Rountree S , Massman P , Doody RS , Li H ((2008) ) Alzheimer’s disease and mild cognitive impairment deteriorate fine movement control. J Psychiatr Res 42: , 1203–1212. |
[20] | Kawa J , Bednorz A , Stępień P , Derejczyk J , Bugdol M ((2017) ) Spatial and dynamical handwriting analysis in mild cognitive impairment. Comput Biol Med 82: , 21–28. |
[21] | Müller S , Herde L , Preische O , Zeller A , Heymann P , Robens S , Elbing U , Laske C ((2019) ) Diagnostic value of digital clock drawing test in comparison with CERAD neuropsychological battery total score for discrimination of patients in the early course of Alzheimer’s disease from healthy individuals. Sci Rep 9: , 3543. |
[22] | Thomas M , Lenka A , Kumar Pal P ((2017) ) Handwriting analysis in Parkinson’s disease: Current status and future directions. Mov Disord Clin Pract 4: , 806–818. |
[23] | Albert MS , DeKosky ST , Dickson D , Dubois B , Feldman HH , Fox NC , Gamst A , Holtzman DM , Jagust WJ , Petersen RC , Snyder PJ , Carrillo MC , Thies B , Phelps CH ((2011) ) The diagnosis of mild cognitive impairment due to Alzheimer’s disease: Recommendations from the National Institute on Aging-Alzheimer’s Association workgroups on diagnostic guidelines for Alzheimer’s disease. Alzheimers Dement 7: , 270–279. |
[24] | Petersen RC , Aisen PS , Beckett LA , Donohue MC , Gamst AC , Harvey DJ , Jack CR Jr , Jagust WJ , Shaw LM , Toga AW , Trojanowski JQ , Weiner MW ((2010) ) Alzheimer’s Disease Neuroimaging Initiative (ADNI). Neurology 74: , 201–209. |
[25] | McKeith IG , Ferman TJ , Thomas AJ , Blanc F , Boeve BF , Fujishiro H , Kantarci K , Muscio C , O’Brien JT , Postuma RB , Aarsland D , Ballard C , Bonanni L , Donaghy P , Emre M , Galvin JE , Galasko D , Goldman JG , Gomperts SN , Honig LS , Ikeda M , Leverenz JB , Lewis SJG , Marder KS , Masellis M , Salmon DP , Taylor JP , Tsuang DW , Walker Z , Tiraboschi P , for the prodromal DLB Diagnostic Study Group ((2020) ) Research criteria for the diagnosis of prodromal dementia with Lewy bodies. Neurology 94: , 743–755. |
[26] | Gorelick PB , Scuteri A , Black SE , DeCarli C , Greenberg SM , Iadecola C , Launer LJ , Laurent S , Lopez OL , Nyenhuis D , Petersen RC , Schneider JA , Tzourio C , Arnett DK , Bennett DA , Chui HC , Higashida RT , Lindquist R , Nilsson PM , Roman GC , Sellke FW , Seshadri S ((2011) ) Vascular contributions to cognitive impairment and dementia: A statement for healthcare professionals from the American Heart Association/American Stroke Association. Stroke 42: , 2672–2713. |
[27] | Bowie CR , Harvey PD ((2006) ) Administration and interpretation of the Trail Making Test. Nat Protoc 1: , 2277–2281. |
[28] | Solomon PR , Hirschoff A , Kelly B , Relin M , Brush M , DeVeaux RD , Pendlebury WW ((1998) ) A 7 minute neurocognitive screening battery highly sensitive to Alzheimer’s disease. Arch Neurol 55: , 349–355. |
[29] | Folstein MF , Folstein SE , McHugh PR ((1975) ) “Mini-mental state”. A practical method for grading the cognitive state of patients for the clinician. J Psychiatr Res 12: , 189–198. |
[30] | Szumilas M , Lewenstein K , Ślubowska E , Szlufik S , Koziorowski D ((2020) ) A multimodal approach to the quantification of kinetic tremor in Parkinson’s disease. Sensors 20: , 184. |
[31] | Yamada Y , Shinkawa K , Kobayashi M , Caggiano V , Nemoto M , Nemoto K , Arai T ((2021) ) Combining multimodal behavioral data of gait, speech, and drawing for classification of Alzheimer’s disease and mild cognitive impairment. J Alzheimers Dis 84: , 315–327. |
[32] | Press Y , Velikiy N , Berzak A , Tandeter H , Peleg R , Freud T , Punchik B , Dwolatzky T ((2012) ) A retrospective analysis of the sentence writing component of the Mini Mental State Examination: Cognitive and affective aspects. Dement Geriatr Cogn Disord 33: , 125–131. |
[33] | Ashendorf L , Jefferson AL , O’Connor MK , Chaisson C , Green RC , Stern RA ((2008) ) Trail Making Test errors in normal aging, mild cognitive impairment, and dementia. Arch Clin Neuropsychol 23: , 129–137. |
[34] | Lakens D ((2013) ) Calculating and reporting effect sizes to facilitate cumulative science: A practical primer for t-tests and ANOVAs. Front Psychol 4: , 863. |
[35] | Kobayashi M , Yamada Y , Shinkawa K , Nemoto M , Nemoto K , Arai T ((2022) ) Automated early detection of Alzheimer’s disease by capturing impairments in multiple cognitive domains with multiple drawing tasks. J Alzheimers Dis 88: , 1075–1089. |
[36] | Cawley GC , Talbot NLC ((2010) ) On over-fitting in model selection and subsequent selection bias in performance evaluation. J Mach Learn Res 11: , 2079–2107. |
[37] | Varoquaux G , Raamana PR , Engemann DA , Hoyos-Idrobo A , Schwartz Y , Thirion B ((2017) ) Assessing and tuning brain decoders: Cross-validation, caveats, and guidelines. Neuroimage 145: , 166–179. |
[38] | Hand DJ , Till RJ ((2001) ) A simple generalisation of the area under the ROC curve for multiple class classification problems. Mach Learn 45: , 171–186. |
[39] | van Buuren S , Groothuis-Oudshoorn K ((2011) ) MICE: Multivariate imputation by chained equations in R. J Stat Soft 45: , 1–67. |
[40] | Lundberg SM , Lee SI ((2017) ) A unified approach to interpreting model predictions. In Advances in Neural Information Processing Systems 30 (NIPS 2017) GuyonI, Von LuxburgU, BengioS, WallachH, FergusR, VishwanathanS, GarnettR, eds, . |
[41] | Sadiq D , Whitfield T , Lee L , Stevens T , Costafreda S , Walker Z ((2017) ) Prodromal dementia with Lewy bodies and prodromal Alzheimer’s disease: A comparison of the cognitive and clinical profiles. J Alzheimers Dis 58: , 463–470. |
[42] | Ferman TJ , Smith GE , Kantarci K , Boeve BF , Pankratz VS , Dickson DW , Graff-Radford NR , Wszolek Z , Gerpen JV , Uitti R , Pedraza O , Murray ME , Aakre J , Parisi J , Knopman DS , Petersen RC ((2013) ) Nonamnestic mild cognitive impairment progresses to dementia with Lewy bodies. Neurology 81: , 2032–2038. |
[43] | Hamilton JM , Salmon DP , Galasko D , Raman R , Emond J , Hansen LA , Masliah E , Thal LJ ((2008) ) Visuospatial deficits predict rate of cognitive decline in autopsy-verified dementia with Lewy bodies. Neuropsychology 22: , 729–737. |
[44] | Shin M-S , Park S-Y , Park S-R , Seol S-H , Kwon JS ((2006) ) Clinical and empirical applications of the Rey– Osterrieth Complex Figure Test. Nat Protoc 1: , 892–899. |
[45] | Beretta L , Caminiti SP , Santangelo R , Magnani G , Ferrari-Pellegrini F , Caffarra P , Perani D ((2019) ) Two distinct pathological substrates associated with MMSE-pentagons item deficit in DLB and AD. Neuropsychologia 133: , 107174. |
[46] | Goldman JG , Williams-Gray C , Barker RA , Duda JE , Galvin JE ((2014) ) The spectrum of cognitive impairment in Lewy body diseases. Mov Disord 29: , 608–621. |
[47] | Coughlin DG , Hurtig H , Irwin DJ ((2020) ) Pathological influences on clinical heterogeneity in Lewy body diseases. Mov Disord 35: , 5–19. |
[48] | Johnson DK , Morris JC , Galvin JE ((2005) ) Verbal and visuospatial deficits in dementia with Lewy bodies. Neurology 65: , 1232–1238. |
[49] | Kraybill ML , Larson EB , Tsuang DW , Teri L , McCormick WC , Bowen JD , Kukull WA , Leverenz JB , Cherrier MM ((2005) ) Cognitive differences in dementia patients with autopsy-verified AD, Lewy body pathology, or both. Neurology 64: , 2069–2073. |
[50] | Yoshizawa H , Vonsattel JPG , Honig LS ((2013) ) Early neuropsychological discriminants for Lewy body disease: An autopsy series. J Neurol Neurosurg Psychiatry 84: , 1326–1330. |
[51] | Mc Ardle R , Galna B , Donaghy P , Thomas A , Rochester ((2019) ) Do Alzheimer’s and Lewy body disease have discrete pathological signatures of gait? Alzheimers Dement 15: , 1367–1377. |
[52] | Mc Ardle R , Pratt S , Buckley C , Del Din S , Galna B , Thomas A , Rochester L , Alcock L ((2021) ) Balance impairments as differential markers of dementia disease subtype. Front Bioeng Biotechnol 9: , 104. |
[53] | Fritz NE , Kegelmeyer DA , Kloos AD , Linder S , Park A , Kataki M , Adeli A , Agrawal P , Scharre DW , Kostyk SK ((2016) ) Motor performance differentiates individuals with Lewy body dementia, Parkinson’s and Alzheimer’s disease. Gait Posture 50: , 1–7. |
[54] | Davoudi A , Dion C , Amini S , Tighe PJ , Price CC , Libon DJ , Rashidi P ((2021) ) Classifying non-dementia and Alzheimer’s disease/vascular dementia patients using kinematic, time-based, and visuospatial parameters: The Digital Clock Drawing Test. J Alzheimers Dis 82: , 47–57. |
[55] | Binaco R , Calzaretto N , Epifano J , McGuire S , Umer M , Emrani S , Wasserman V , Libon DJ , Polikar R ((2020) ) Machine learning analysis of Digital Clock Drawing Test performance for differential classification of mild cognitive impairment subtypes versus Alzheimer’s disease. J Int Neuropsychol Soc 26: , 690–700. |
[56] | Fellows RP , Dahmen J , Cook D , Schmitter-Edgecombe M ((2017) ) Multicomponent analysis of a digital Trail Making Test. Clin Neuropsychol 31: , 154–167. |
[57] | Dion C , Arias F , Amini S , Davis R , Penney D , Libon DJ , Price CC ((2020) ) Cognitive correlates of digital clock drawing metrics in older adults with and without mild cognitive impairment. J Alzheimers Dis 75: , 73–83. |
[58] | Souillard-Mandar W , Penney D , Schaible B , Pascual-Leone A , Au R , Davis R ((2021) ) DCTclock: Clinically-interpretable and automated artificial intelligence analysis of drawing behavior for capturing cognition. Front Digit Health 3: , 750661. |
[59] | Yamada Y , Shinkawa K , Kobayashi M , Badal VD , Glorioso D , Lee EE , Daly R , Nebeker C , Twamley EW , Depp C , Nemoto M , Nemoto K , Kim H-C , Arai T , Jeste DV ((2022) ) Automated analysis of drawing process to estimate global cognition in older adults: Preliminary international validation on the US and Japan data sets. JMIR Form Res 6: , e37014. |
[60] | Rentz DM , Papp KV , Mayblyum DV , Sanchez JS , Klein H , Souillard-Mandar W , Sperling RA , Johnson KA ((2021) ) Association of Digital Clock Drawing with PET amyloid and tau pathology in normal older adults. Neurology 96: , e1844–e1854. |
[61] | Moetesum M , Diaz M , Masroor U , Siddiqi I , Vessio G ((2022) ) A survey of visual and procedural handwriting analysis for neuropsychological assessment. Neural Comput Appl 34: , 9561–9578. |
[62] | Sisti JA , Christophe B , Seville AR , Garton ALA , Gupta VP , Bandin AJ , Yu Q , Pullman SL ((2017) ) Computerized spiral analysis using the iPad. J Neurosci Methods 275: , 50–54. |
[63] | Cilia ND , De Stefano C , Fontanella F , Scotto di Freca A ((2021) ) Handwriting-based classifier combination for cognitive impairment prediction. Lect Notes Comput Sci 12661: , 587–599. |
[64] | Simard M , van Reekum R , Myran D ((2003) ) Visuospatial impairment in dementia with Lewy bodies and Alzheimer’s disease: A process analysis approach. Int J Geriatr Psychiatry 18: , 387–391. |
[65] | Jia L , Yang J , Zhu M , Pang Y , Wang Q , Wei Q , Li Y , Li T , Li F , Wang Q , Li Y , Wei Y ((2022) ) A metabolite panel that differentiates Alzheimer’s disease from other dementia types. Alzheimers Dement 18: , 1345–1356. |


