
Investigating Casual Associations Among Gut Microbiota, Metabolites, and Neurodegenerative Diseases: A Mendelian Randomization Study
Abstract
Background:
Recent studies had explored that gut microbiota was associated with neurodegenerative diseases (including Alzheimer’s disease (AD), Parkinson’s disease (PD), and amyotrophic lateral sclerosis (ALS)) through the gut-brain axis, among which metabolic pathways played an important role. However, the underlying causality remained unclear.
Objective:
Our study aimed to evaluate potential causal relationships between gut microbiota, metabolites, and neurodegenerative diseases through Mendelian randomization (MR) approach.
Methods:
We selected genetic variants associated with gut microbiota traits (N = 18,340) and gut microbiota-derived metabolites (N = 7,824) from genome-wide association studies. Summary statistics of neurodegenerative diseases were obtained from IGAP (AD, 17,008 cases; 37,154 controls), IPDGC (PD, 37,688 cases; 141,779 controls), and IALSC (ALS, 20,806 cases; 59,804 controls) respectively.
Results:
Greater abundance of Ruminococcus (OR, 1.245; 95% CI, 1.103–1.405; p = 0.0004) was found significantly related to higher risk of ALS. Besides, our study found suggestive associations of Actinobacteria, Lactobacillaceae, Faecalibacterium, Ruminiclostridium, and Lachnoclostridium with AD, of Lentisphaerae, Lentisphaeria, Oxalobacteraceae, Victivallales, Bacillales, Eubacteriumhalliigroup, Anaerostipes, and Clostridiumsensustricto1 with PD, and of Lachnospira, Fusicatenibacter, Catenibacterium, and Ruminococcusgnavusgroup with ALS. Our study also revealed suggestive associations between 12 gut microbiome-dependent metabolites and neurodegenerative diseases. Glutamine was related to lower risk of AD. For the serotonin pathway, serotonin was found as a protective factor of PD, while kynurenine as a risk factor for ALS.
Conclusion:
Our study firstly applied a two-sample MR approach to detect causal relationships among gut microbiota, gut metabolites, and neurodegenerative diseases. Our findings may provide new targets for treatments and may offer valuable insights for further studies on the underlying mechanisms.
INTRODUCTION
Neurodegenerative diseases are characterized by progressive loss of structure or function of neurons in the central or peripheral nervous system, which involves irreversible long-term motor or cognitive impairments [1]. The prevalence of neurodegenerative diseases, including Alzheimer’s disease (AD), Parkinson’s disease (PD), and amyotrophic lateral sclerosis (ALS), are rising worldwide with the increasing life expectancy. In recent years, emerging evidence has indicated that gut microbiota derived metabolites including short-chain fatty acids (SCFAs) [2, 3] and neurotransmitters such as glutamate [4], serotonin [5, 6], and γ-aminobutyric acid (GABA) [7] may play a central role in the gut-brain axis alterations and risk of neurodegenerative diseases [8]. However, few consistent links connecting gut microbiota and diseases or their associated metabolic pathways were found.
Increasing number of cross-sectional studies have implicated the association between gut microbiota and neurodegenerative diseases, including AD, PD, and ALS [9]; however, such associations differed across studies. For example, an observational study (N = 25) found a significantly decreased abundance of Ruminococcaceae and Actinobacteria and significant increase in abundance of Bacteroidetes in patients with AD compared with control individuals [10]; while another cross-sectional study (N = 43) showed an opposite outcome of those microbiota [11]. Similarly, the association between gut microbiota and PD or ALS also differed in different studies [12–15]. The results of those small observational studies should be considered with caution due to participant selection bias, confounding bias, and reverse causation. However, it is crucial to identify whether those relationships were robust causal associations or spurious correlations.
Mendelian randomization (MR) approach, which uses genetic variants as instrumental variables (IVs), has been widely accepted to determine the causal effect of exposures on diseases [16]. As single nucleotide polymorphisms (SNPs) are of random allocation and is independent of confounders, MR is similar to randomized controlled trial and circumvent the limitations of previous observational studies.
Therefore, our study firstly applied a two-sample MR approach to detect causal relationships among gut microbiota, metabolites, and neurodegenerative disorders including AD, PD, and ALS, using summary statistics from the largest genome-wide association studies (GWAS) so far.
MATERIALS AND METHODS
Data sources and instruments
Summary statistics applied for investigating traits had the largest sample sizes with similar populations, and exposure and outcome statistics were obtained from different consortia, sample overlap tended to be little [17]. Details of the contributing GWAS consortiums are listed in Supplementary Table 1.
Gut microbiota
We leveraged summary statistics from most comprehensive exploration of genetic influences on human gut microbiota so far. The MiBioGen consortium recruited 18,340 participants of multiple ancestries (including European, American Hispanic/Latin, East Asian, etc.) from 24 cohorts [18]. After extracting DNA from fecal samples, 16S rRNA gene sequencing was utilized to characterize the gut microbiome using SILVA as a reference database [19], with truncation of the taxonomic resolution to genus level.
Gut metabolites
Considering the important roles of gut metabolites in microbiota-host crosstalk, we also leveraged summary-level data from a GWAS of the human metabolome conducted among European-descent subjects (TwinsUK and KORA, N = 7824). The GWAS tested all 486 metabolite concentrations present in both datasets at each SNP. Then we applied HMDB [20] to obtain a list of 81 gut microbiota derived metabolite traits from all the quantified metabolites in the GWAS.
Neurodegenerative diseases
We utilized the GWAS summary statistics from the largest and most recent datasets for AD, PD, and ALS so far. We obtained the corresponding genetic variants from the International Genomics of Alzheimer’s Project (IGAP) including 17,008 cases and 37,154 controls [21], the International Parkinson’s Disease Genomics Consortium (IPDGC) including 37,688 cases and 141,779 million controls [22], and the International Amyotrophic Lateral Sclerosis Genomics Consortium (IALSC) including 20,806 cases with ALS and 59,804 controls [23]. Cases of those neurodegenerative diseases were all clinically confirmed using published criteria.
Ethical approval for each study had been obtained in all original articles [18, 21–24], and no ethical approval for the current analyses was needed as they were based on publicly available summary statistics.
Selection of instrumental variables
To ensure the validity of the conclusion, our study applied several quality control steps to select instrument variables. First, SNPs significantly related to gut microbiome were selected as instrumental variables. Two thresholds were used to select the instrumental variable. In order to obtain more comprehensive results and increase sensitivity to IVs, SNPs smaller than the locus-wide significance level (1×10⁻⁵) was selected as instrumental variables in primary analysis. We also selected exposure-related SNPs at genome-wide significance (p < 5×10⁻⁸) as instrumental variables in secondary analysis to maximize specificity. Second, we manually checked all the identified SNPs by PhenoScanner GWAS database (http://www.phenoscanner.medschl.cam.ac.uk/) and excluded variants for the linkage disequilibrium (LDlink: https://ldlink.nci.nih.gov/; LD, R2 < 0.001). All GWAS were assumed to be coded on the forward strand. Third, we also computed the F-statistic of each exposure, and SNPs that had F-statistics less than 10 were excluded to avoid weak instrument bias. Finally, for gut microbiota instruments, a total of 8,269 host SNPs were identified, which were associated with 200 gut microbiota traits (9 phyla + 16 classes + 20 orders + 36 families + 119 genera), and for gut metabolite instruments, 3,134 SNPs associated with 81 traits were included in our study. Summary statistics of these significant SNPs are assessed in Supplementary Tables 2 and 3.
Statistical analyses
We applied two sample MR as our main statistical methods to estimate causal associations between each instrument-exposure (gut microbiota and metabolite) and instrument-outcome (AD, PD, and ALS). The MR approach was based on three key assumptions: 1) the genetic variant must be truly associated with the exposure; 2) the genetic variant should not be associated with confounders of the exposure-outcome relationship; and 3) the genetic variant should only be related to the outcome of interest through the exposure under study [25].
Primary analyses were performed using Inverse-variance weighted (IVW) method, which essentially assumed the intercept was zero, and our results were corrected for multiple hypothesis testing using the Benjamini and Hochberg false discovery rate (FDR), as significance threshold was set at FDR-corrected p-values < 0.05 [26], while associations with p < 0.05, but not reaching the FDR-controlled threshold were reported as suggestive of association. Power calculations were conducted based on the website http://cnsgenomics.com/shiny/mRnd/ [27] (see Supplementary Table 6).
To validate assumption 3 and improve the robustness of the findings, we also undertook a series of sensitivity analyses including MR-Egger regression, weighted mode, weighted median, simple median methods, and robust adjusted profile score (MR.RAPS) method, which provided different assumptions about horizontal pleiotropy [28, 29]. However, the MR-Egger method had the lowest power among the 6 methods and was based on the instrument strength independent of the direct effects (INSIDE) assumption, with no measurement error in the SNP exposure effects (NOME) assumption [30]. Therefore, MR Egger was performed when I2GX was > 0.9 [31].
Cochran Q statistic and leave-one-out sensitivity analysis were also adopted to the SNPs that may influence the outcome through an unaccounted causal pathway, and Steiger analysis was performed to explore direction of causal effects [32]. Furthermore, MR-Egger intercept and Mendelian Randomization Pleiotropy RESidual Sum and Outlier (MR-PRESSO) global test were used to detect the presence of pleiotropy [33].
At last, we conducted multivariable MR (MVMR) analyses using IVW method to estimate the direct and indirect effect of each exposure on an outcome, as we found a high degree of IV overlap across gut microbiota (Lentisphaerae at phylum level, Lentisphaeria at class level, and Victivallales at order level) in univariable MR analyses on PD [34]. Furthermore, we also conducted multivariable MR-Egger analyses to evaluate the horizontal pleiotropy for direct and indirect effects. The IVs used for MVMR analysis were listed in Supplementary Table 8.
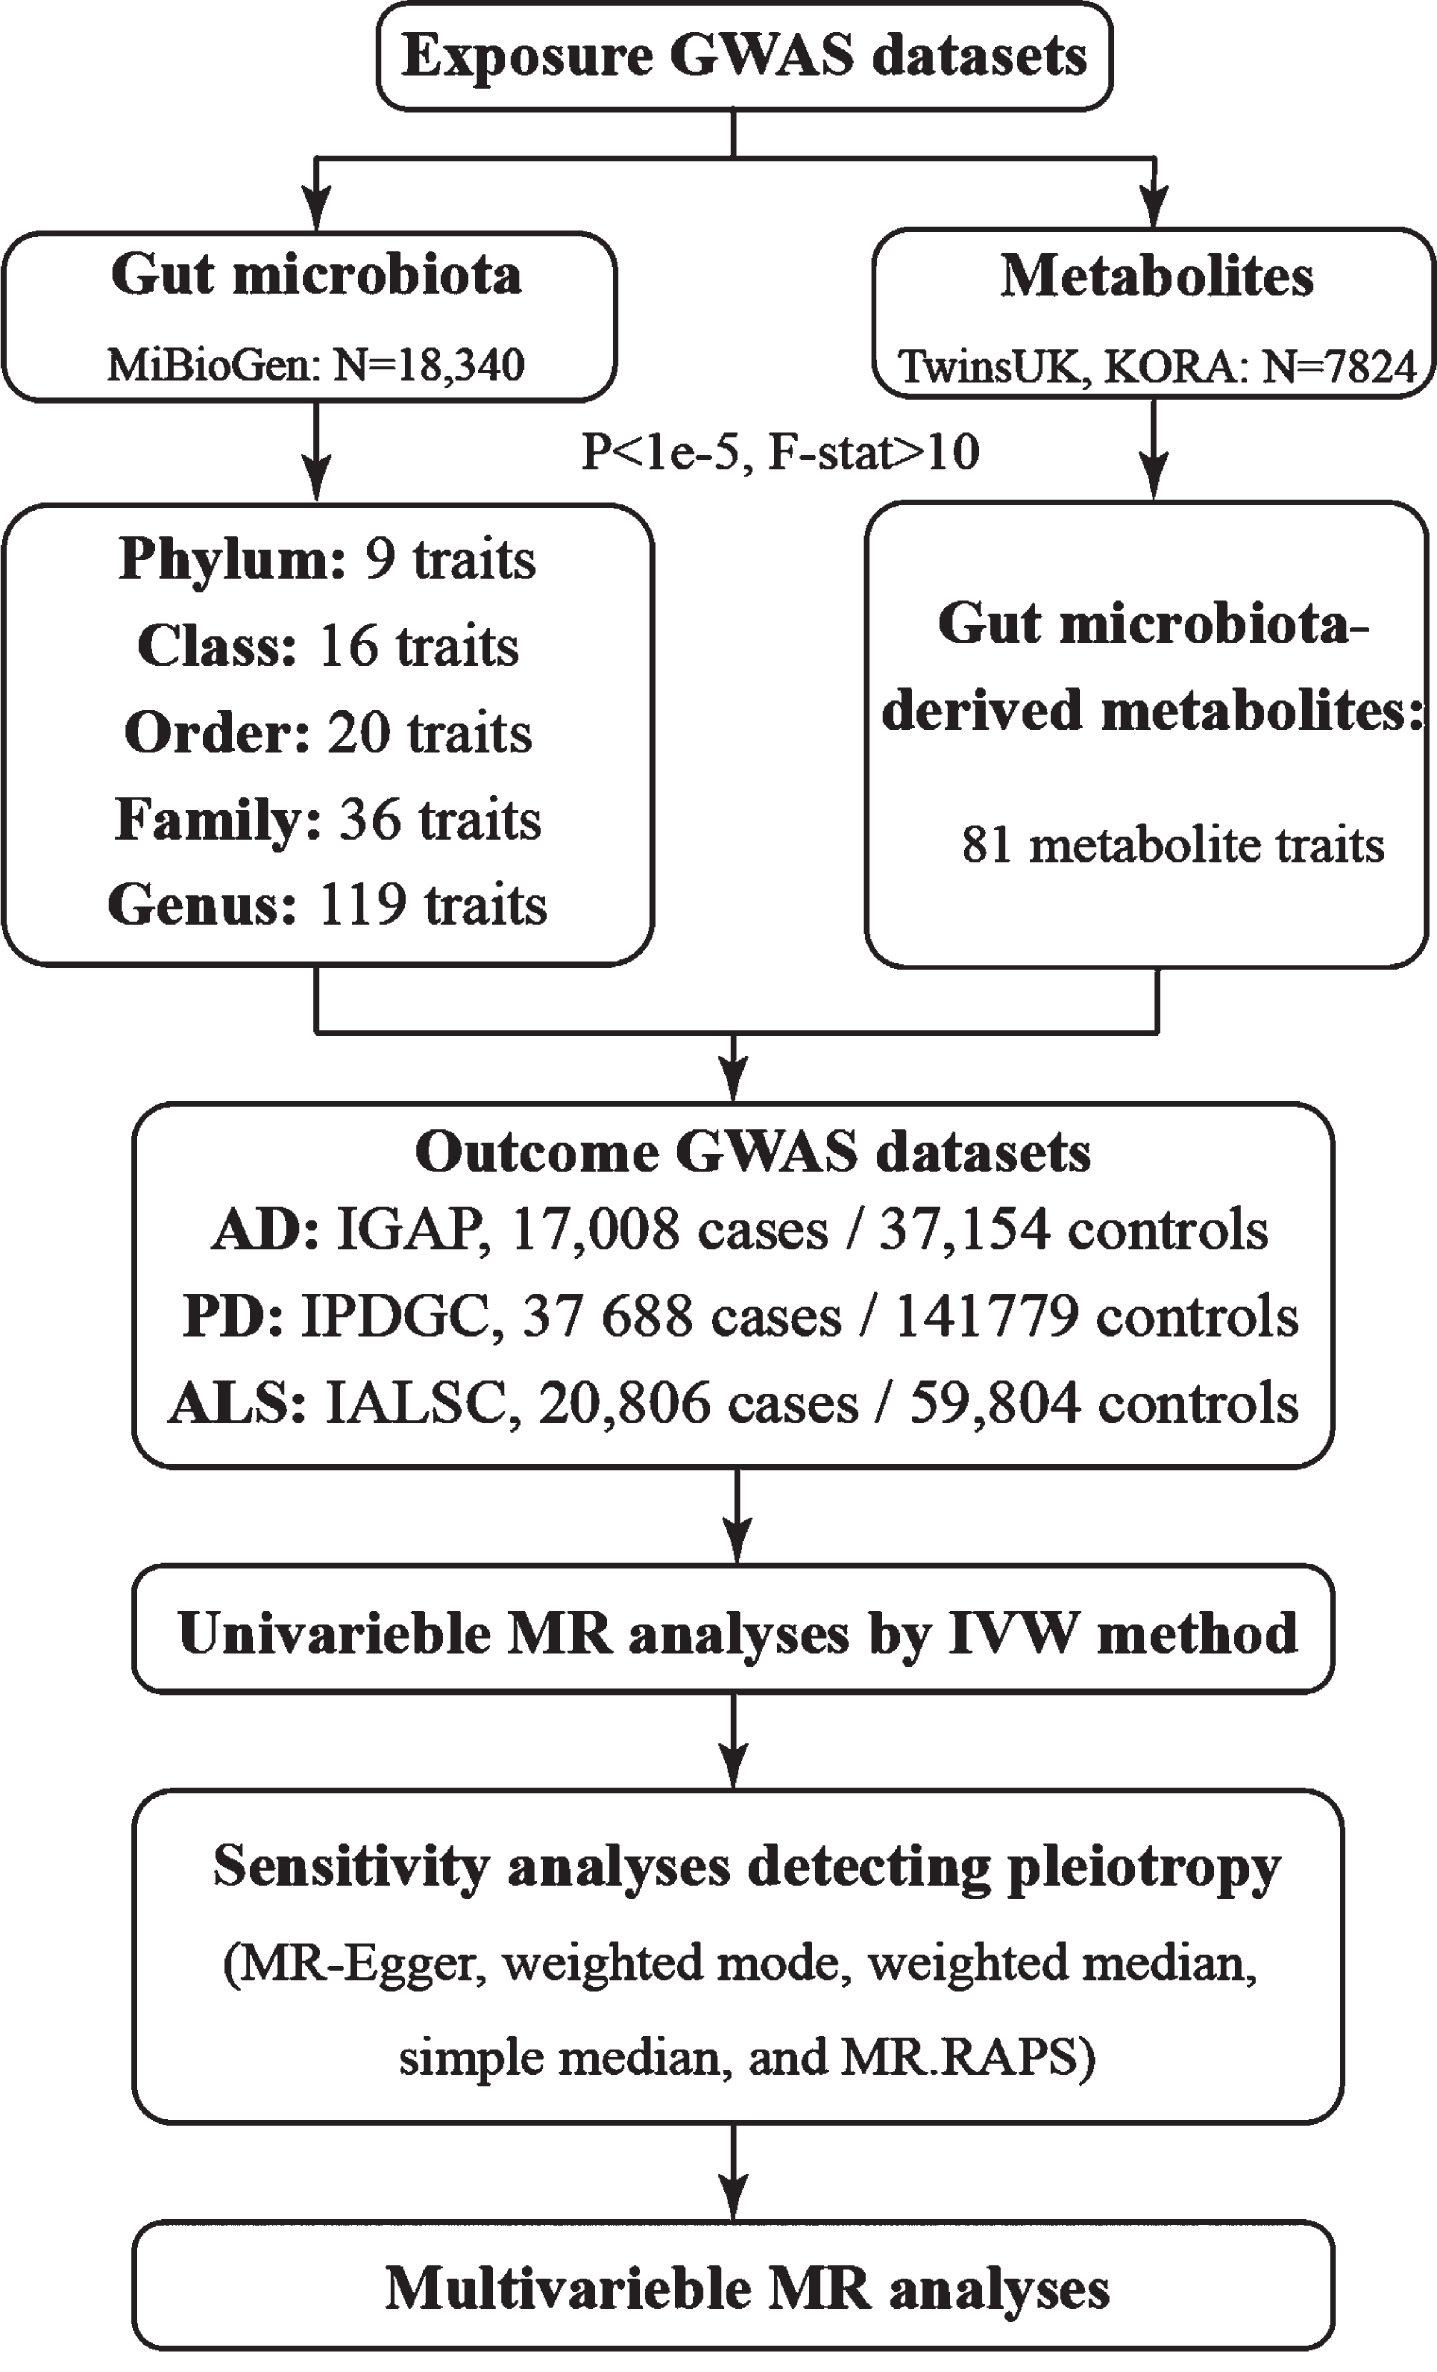
A flowchart of our study was provided in Fig. 1. The MR analyses were performed in the R version 4.0.2 computing environment using the latest TwoSampleMR (https://github.com/MRCIEU/TwoSampleMR), MVMR (https://github.com/WSpiller/MVMR), and MRPRESSO (https://github.com/rondolab/MR-PRESSO) packages.
Fig. 1
Flowchart of current study. AD, Alzheimer’s disease; PD, Parkinson’s disease; ALS, amyotrophic lateral sclerosis.
RESULTS
Associations between gut microbiota and neurodegenerative diseases
By the means of IVW method, results reaching a threshold of p < 0.05 are presented in Fig. 2. Causal effects were estimated by odds ratio (OR), which represented increased risk of binary outcomes (AD, PD, ALS) per SD increase in abundance of gut microbiota feature. By the means of IVW method, we found suggestive associations of host-genetic-driven increases in Actinobacteria at class level (OR, 1.027; 95% CI, 1.006–1.048; p = 0.013); Lactobacillaceae at family level (OR, 1.027; 95% CI, 1.006–1.048; p = 0.014); Lachnoclostridium at genus level (OR, 1.03; 95% CI, 1.005–1.056; p = 0.019) and higher risks of AD, while genetically increased in Faecalibacterium at genus level (OR, 0.975; 95% CI, 0.954–0.997; p = 0.028) were associated with protective effects on the risk of AD. We also found suggestive causal effect of Ruminiclostridium6 at genus level (OR, 1.025; 95% CI, 1.006–1.045; p = 0.009) on higher risk of AD, while Ruminiclostridium9 (OR, 0.969; 95% CI, 0.943–0.996; p = 0.009) on lower risk of AD. However, after calculating FDR, we found that all q-values were over 0.05, suggesting no significant associations. In addition, associations between the gut microbiota traits and risk of AD were consistent in sensitivity analyses (see Table 1). MR-Egger intercept (we calculated I2GX, which were all over 0.9) and Mendelian randomization pleiotropy residual sum and outlier (MR-PRESSO) were applied to test the directional pleiotropy, and all p values were over 0.05, suggesting no significant pleiotropy, while Cochran Q statistic of both the IVW test and the MR-Egger regression was used to test the heterogeneity, and no notable heterogeneity across instrument SNP effects was indicated (see Supplementary Table 7). However, we had limited power (less than 80%) to test causal effects of those gut microbiota features on AD.
Fig. 2
Associations of genetically predicted gut microbiota with risk of neurodegenerative diseases using IVW method. OR, odds ratio; CI, confidence interval; FDR, False discovery rate.
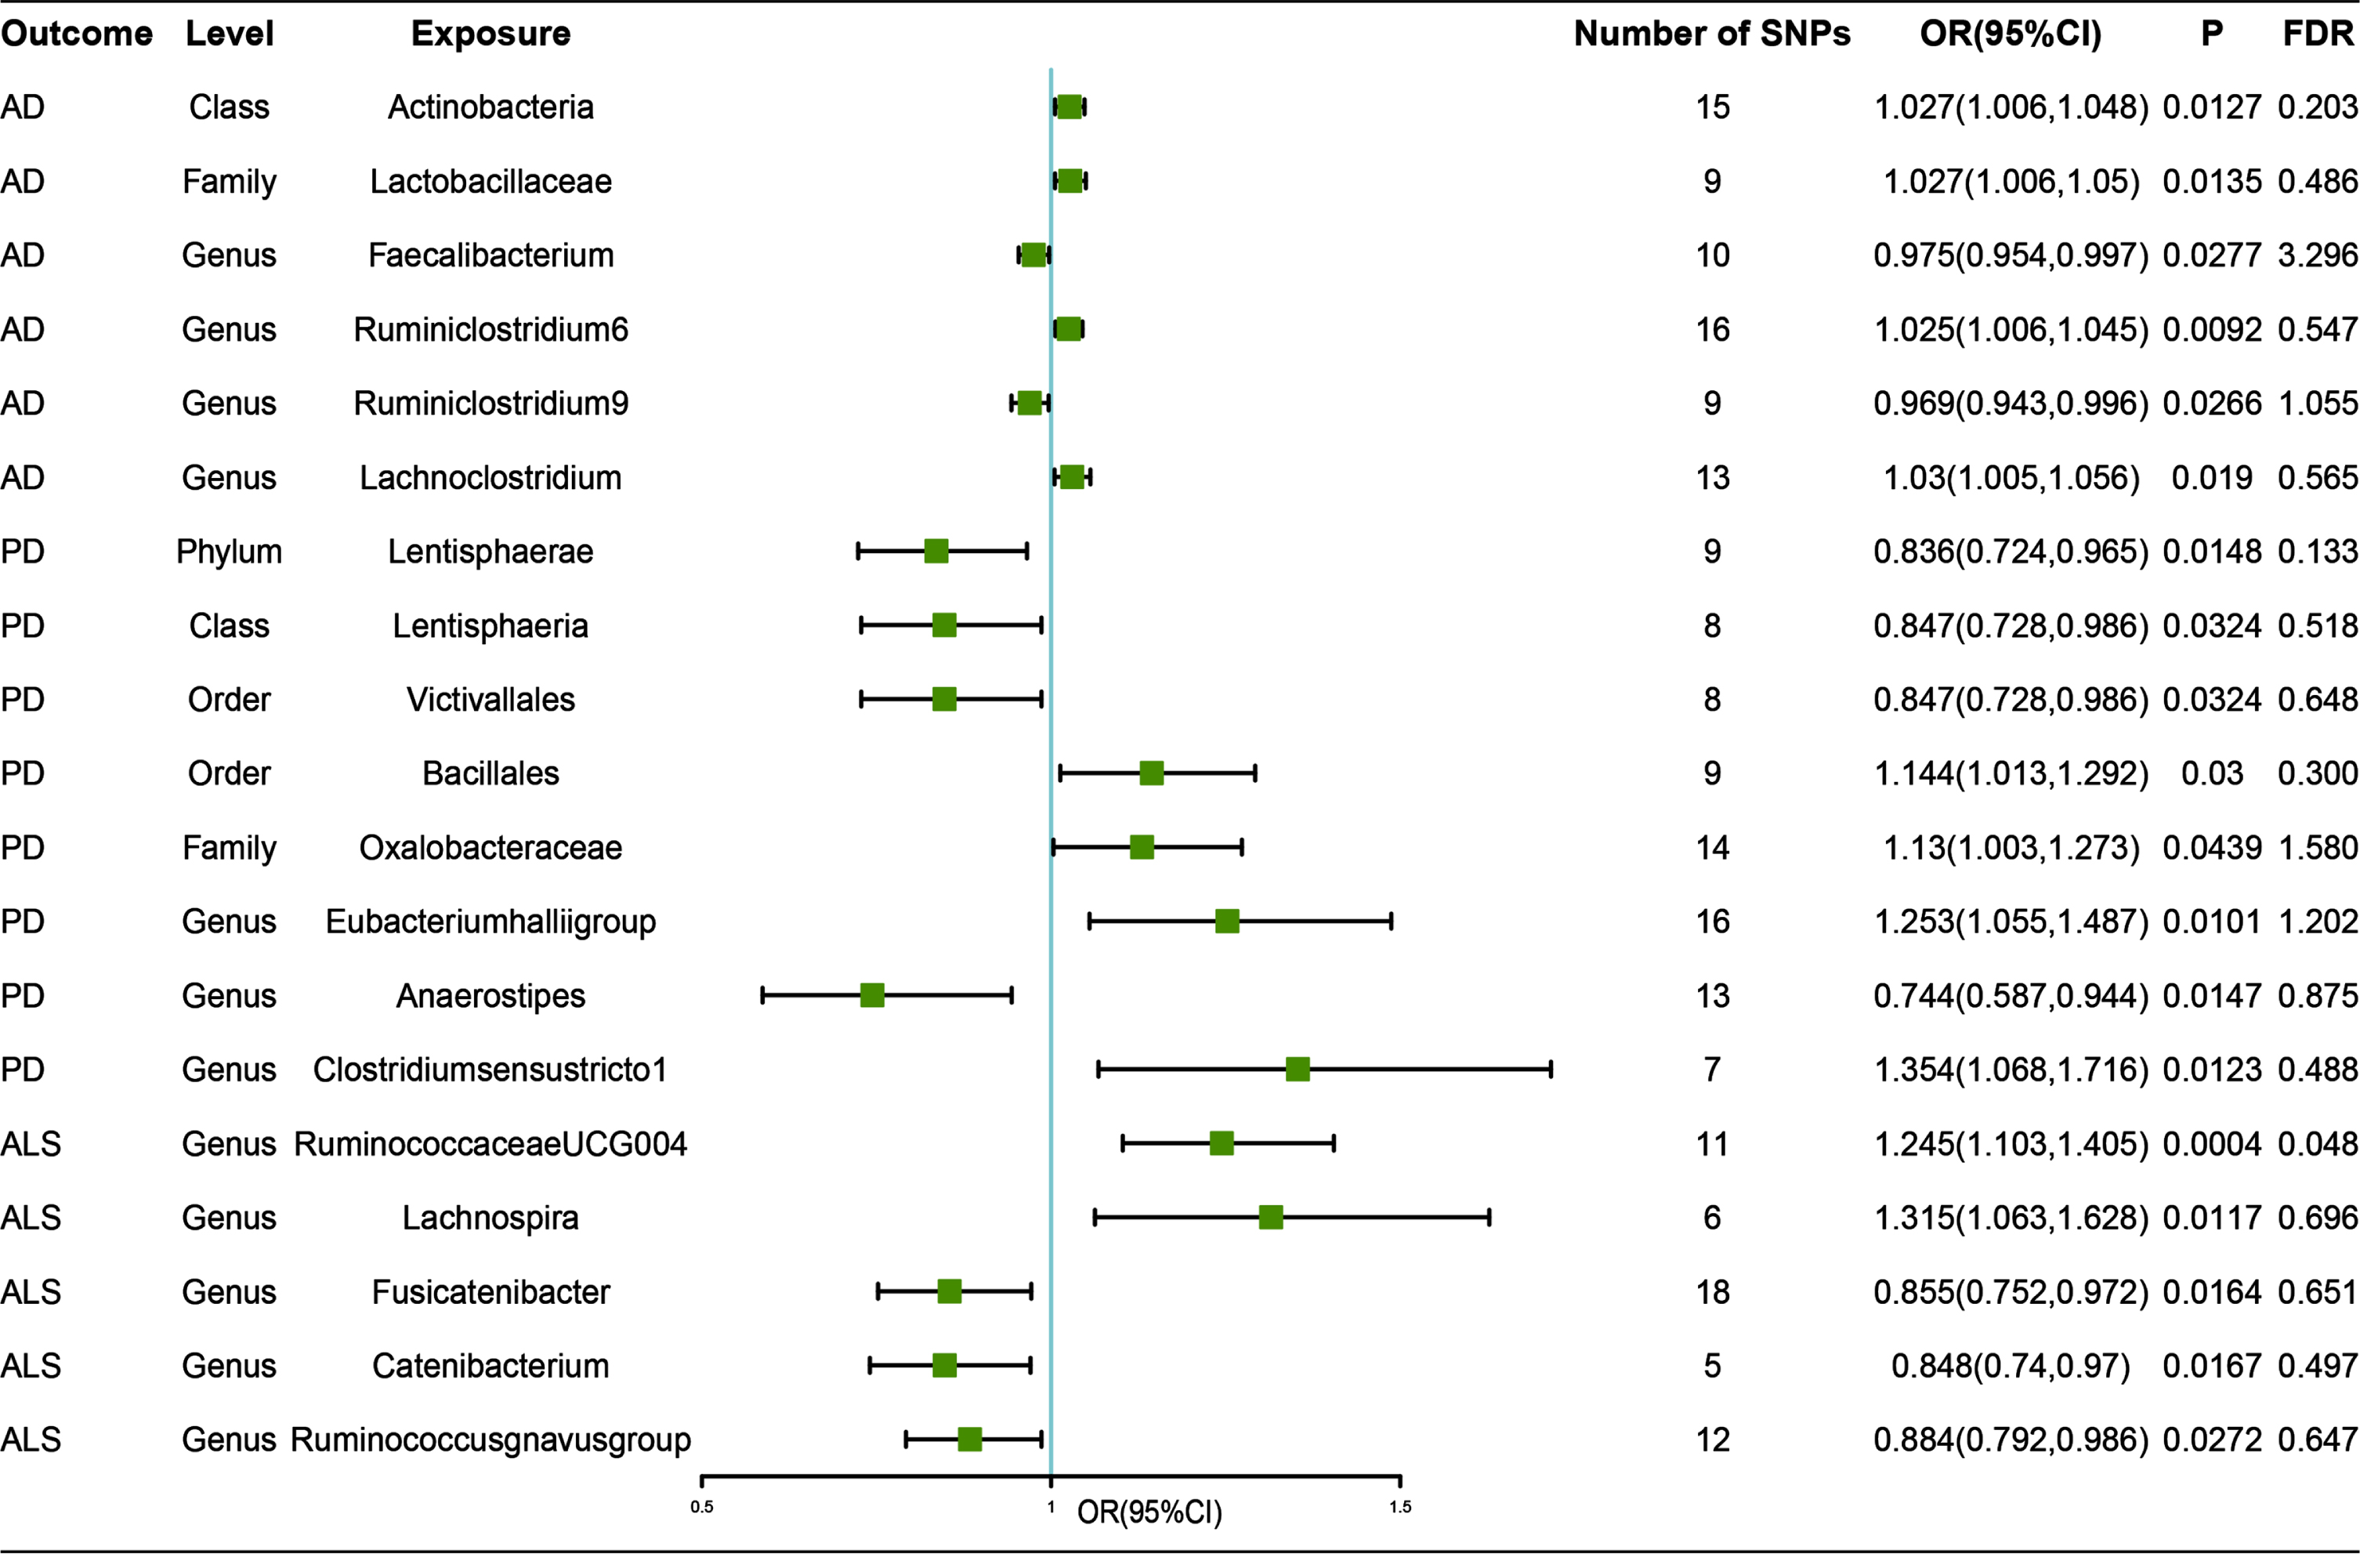
Table 1
Sensitivity analyses of MR analyses of neurodegenerative diseases on gut microbiota by MR Egger, simple mode, weighted median, and weighted mode
| Outcome | Exposure level | Weighted mode | Weighted median | Simple mode | MR Egger | RAPS | ||||||
| Microbiota | OR (95% CI) | p | OR (95% CI) | p | OR (95% CI) | p | OR (95% CI) | p | OR (95% CI) | p | ||
| AD | Class | Actinobacteria | 1.048 (1.009,1.088) | 0.03 | 1.039 (1.011,1.068) | 0.01 | 1.022 (0.979,1.067) | 0.33 | 1.08 (1.023,1.141) | 0.02 | 1.031 (1.01,1.052) | 0.00 |
| AD | Family | Lactobacillaceae | 1.015 (0.981,1.051) | 0.41 | 1.022 (0.996,1.049) | 0.10 | 1.01 (0.978,1.043) | 0.56 | 0.986 (0.936,1.038) | 0.60 | 1.024 (1.002,1.046) | 0.03 |
| AD | Genus | Faecalibacterium | 0.98 (0.946,1.015) | 0.29 | 0.977 (0.949,1.007) | 0.13 | 0.979 (0.942,1.018) | 0.31 | 0.979 (0.938,1.021) | 0.35 | 0.976 (0.952,1) | 0.05 |
| AD | Genus | Ruminiclostridium6 | 1.01 (0.974,1.048) | 0.59 | 1.019 (0.992,1.048) | 0.17 | 1.015 (0.97,1.062) | 0.53 | 1.005 (0.958,1.053) | 0.85 | 1.025 (1.004,1.045) | 0.02 |
| AD | Genus | Ruminiclostridium9 | 0.984 (0.926,1.045) | 0.61 | 0.984 (0.947,1.022) | 0.40 | 0.983 (0.921,1.05) | 0.63 | 0.96 (0.852,1.082) | 0.53 | 0.967 (0.938,0.996) | 0.03 |
| AD | Genus | Lachnoclostridium | 1.004 (0.939,1.074) | 0.91 | 1.023 (0.99,1.058) | 0.17 | 1.006 (0.944,1.073) | 0.85 | 1.031 (0.939,1.133) | 0.53 | 1.034 (1.007,1.062) | 0.01 |
| PD | Phylum | Lentisphaerae | 0.745 (0.555,0.999) | 0.08 | 0.762 (0.629,0.921) | 0.01 | 0.743 (0.538,1.026) | 0.11 | 0.715 (0.431,1.186) | 0.23 | 0.832 (0.71,0.975) | 0.02 |
| PD | Class | Lentisphaeria | 0.751 (0.559,1.009) | 0.10 | 0.783 (0.641,0.957) | 0.02 | 0.747 (0.539,1.037) | 0.13 | 0.743 (0.45,1.225) | 0.29 | 0.844 (0.714,0.996) | 0.04 |
| PD | Family | Oxalobacteraceae | 1.202 (0.934,1.547) | 0.18 | 1.177 (1.007,1.376) | 0.04 | 1.194 (0.901,1.583) | 0.24 | 1.422 (0.856,2.362) | 0.20 | 1.133 (0.994,1.291) | 0.06 |
| PD | Order | Victivallales | 0.751 (0.555,1.015) | 0.11 | 0.783 (0.64,0.959) | 0.02 | 0.747 (0.536,1.042) | 0.13 | 0.743 (0.45,1.225) | 0.29 | 0.844 (0.714,0.996) | 0.04 |
| PD | Order | Bacillales | 1.221 (0.931,1.601) | 0.19 | 1.179 (0.996,1.397) | 0.06 | 1.215 (0.934,1.581) | 0.18 | 1.133 (0.614,2.092) | 0.70 | 1.164 (1.017,1.331) | 0.03 |
| PD | Genus | Eubacterium hallii group | 1.462 (0.97,2.202) | 0.09 | 1.361 (1.075,1.723) | 0.01 | 1.526 (0.967,2.407) | 0.09 | 1.329 (0.916,1.928) | 0.16 | 1.274 (1.056,1.538) | 0.01 |
| PD | Genus | Anaerostipes | 0.588 (0.336,1.029) | 0.09 | 0.747 (0.54,1.034) | 0.08 | 0.6 (0.342,1.052) | 0.10 | 0.579 (0.26,1.288) | 0.21 | 0.739 (0.569,0.961) | 0.02 |
| PD | Genus | Clostridium sensustricto 1 | 1.416 (0.942,2.128) | 0.15 | 1.413 (1.043,1.915) | 0.03 | 1.404 (0.915,2.154) | 0.17 | 1.728 (1.009,2.959) | 0.10 | 1.358 (1.041,1.77) | 0.02 |
| ALS | Genus | Ruminoco ccaceae UCG 004 | 1.259 (0.92,1.723) | 0.18 | 1.251 (1.06,1.476) | 0.05 | 1.263 (0.934,1.707) | 0.17 | 0.76 (0.398,1.45) | 0.18 | 1.271 (1.114,1.45) | 0.00 |
| ALS | Genus | Lachnospira | 1.15 (0.745,1.776) | 0.56 | 1.298 (0.987,1.708) | 0.01 | 1.431 (0.933,2.196) | 0.16 | 2.518 (0.707,8.97) | 0.43 | 1.326 (1.046,1.682) | 0.02 |
| ALS | Genus | Fusicatenibacter | 0.882 (0.635,1.225) | 0.46 | 0.838 (0.703,0.999) | 0.06 | 0.873 (0.617,1.234) | 0.16 | 0.702 (0.423,1.166) | 0.23 | 0.848 (0.735,0.979) | 0.02 |
| ALS | Genus | Catenibacterium | 0.924 (0.757,1.128) | 0.48 | 0.884 (0.756,1.034) | 0.05 | 0.927 (0.731,1.176) | 0.45 | 0.617 (0.159,2.39) | 0.19 | 0.841 (0.723,0.978) | 0.02 |
| ALS | Genus | Ruminococ cusgnavus group | 0.811 (0.628,1.047) | 0.14 | 0.887 (0.775,1.014) | 0.12 | 0.776 (0.599,1.004) | 0.57 | 0.921 (0.542,1.563) | 0.53 | 0.875 (0.772,0.991) | 0.04 |
OR, Odds ratios for associations of genetically predicted gut microbiota traits with neurodegenerative diseases; CI, confidence interval; MR, Mendelian randomization; RAPS, robust adjusted profile score; AD, Alzheimer’s disease; PD, Parkinson’s disease; ALS, amyotrophic lateral sclerosis.
Causal relationship between gut microbiota and other neurodegenerative diseases were also analyzed by the same process. Our study revealed that genetically increased abundance of Lentisphaerae at phylum level (OR, 0.836; 95% CI, 0.724–0.965; p = 0.015); Lentisphaeria at class level (OR, 0.847; 95% CI, 0.728–0.986; p = 0.032), and Victivallales at order level (OR, 0.847; 95% CI, 0.728–0.986; p = 0.032) were potentially associated with a protective effect of PD. In contrast, no notable effects of the three gut microbiota features on the risk of PD could be observed after mutual adjustment using multivariable MR method (see Supplementary Table 7). In addition, genetically increased abundance of Oxalobacteraceae at family level (OR, 1.13; 95% CI, 1.003–1.273; p = 0.044); Bacillales at order level (OR, 1.144; 95% CI, 1.013–1.292; p = 0.03); Eubacteriumhalliigroup (OR, 1.253; 95% CI, 1.055–1.487; p = 0.01), and Clostridiumsensustricto1 (OR, 1.354; 95% CI, 1.068–1.716; p = 0.012) were related to higher risk of AD; while Anaerostipes (OR, 0.744; 95% CI, 0.587–0.944; p = 0.015) was related to protective effect of PD (Fig. 2).
Besides, genetically increased Lachnospira (OR, 1.315; 95% CI, 1.063–1.628; p = 0.012); decreased Fusicatenibacter (OR, 0.855; 95% CI, 0.752–0.972; p = 0.016) and Catenibacterium (OR, 0.848; 95% CI, 0.74–0.97; p = 0.017) were potentially related to a higher risk of ALS. Our study also revealed that increased RuminococcaceaeUCG004 (OR, 1.245; 95% CI, 1.103–1.405; p = 0.0004) and decreased Ruminococcusgnavusgroup (OR, 0.884; 95% CI, 0.792–0.986; p = 0.027) were related to a higher risk of ALS. Among all those results, we found a significant causal effect of increased RuminococcaceaeUCG004 on risk of ALS (FDR-corrected p-value < 0.05) (Fig. 2).
Those estimate effects mentioned above were considered robust (Table 1) with no directional pleiotropy or heterogeneity was significant (see Supplementary Table 7), and MR power calculation results were showed in Supplementary Table 6.
Associations between gut metabolites and neurodegenerative diseases
Among 81 gut microbiota-derived metabolites incorporated in our MR analyses, we found 11 suggestive estimate effects of gut metabolite on neurodegenerative diseases. Those metabolites were classified into two types: host-derived or dietary molecules [35].
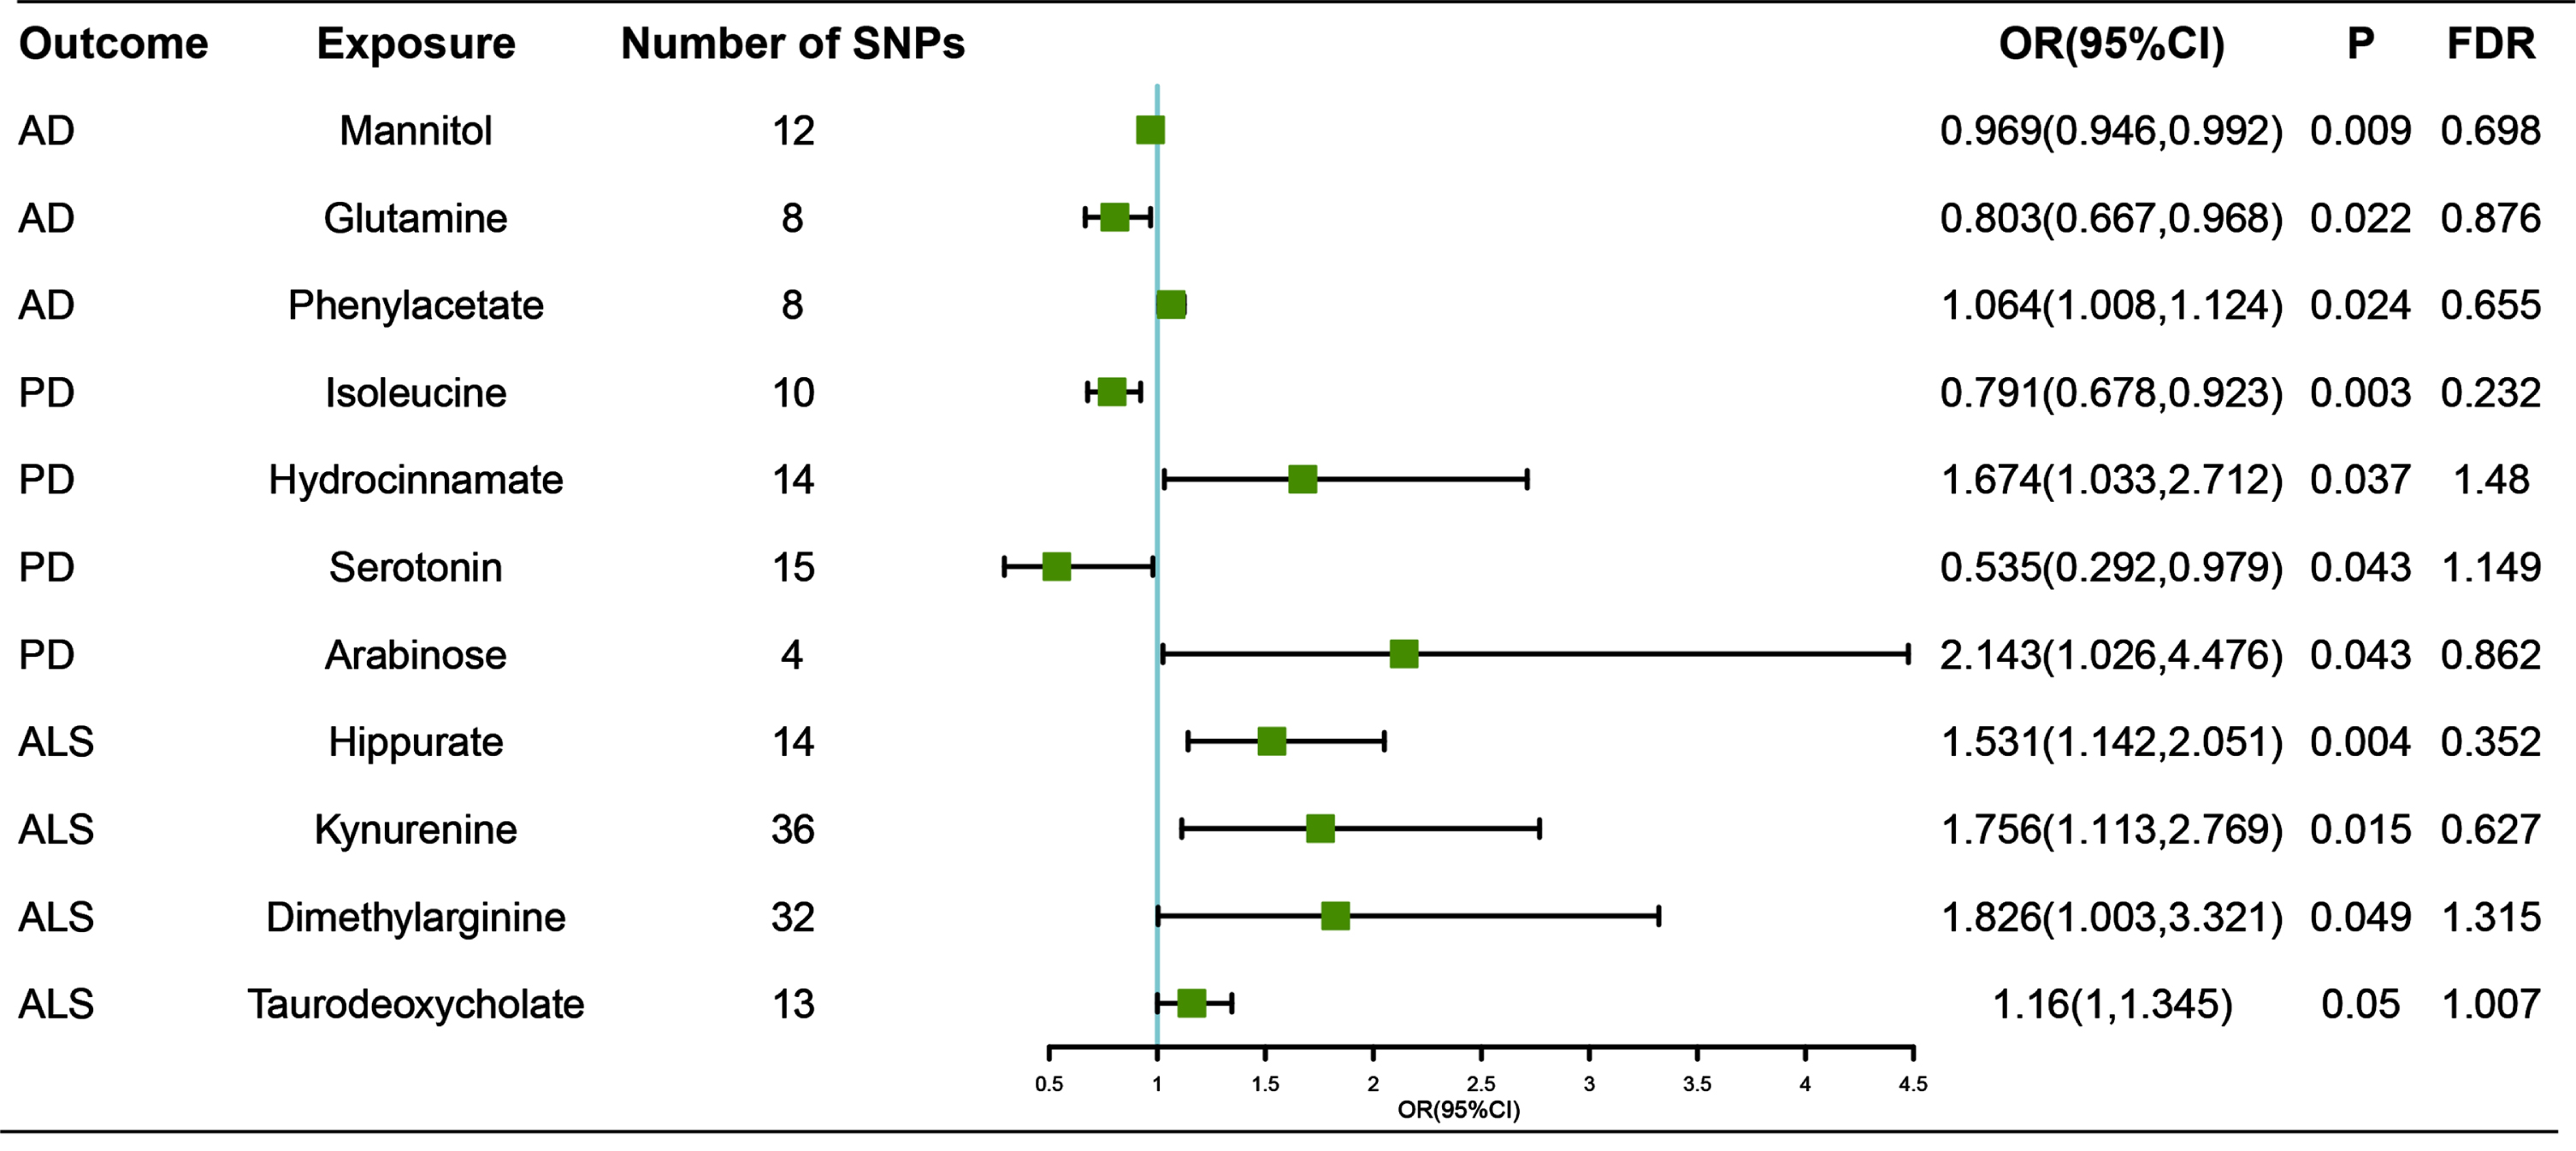
With regard to host metabolites transformation, our study suggested that increased abundance of taurodeoxycholate, which was a product of primary bile acids (OR, 1.16 for risk ratio of ALS per SD unit of taurodeoxycholate; 95% CI, 1–1.345; p = 0.050) was associated with higher risk of ALS. However, no steroid hormone was proved relevance to neurodegenerative diseases.
For the dietary molecules, amino acids, complex plant polysaccharides and polyphenols were considered to exert impact on brain function. In tryptophan metabolism, our study revealed that serotonin (OR, 0.535; 95% CI, 0.292–0.979; p = 0.043) was a protection factor of PD, while kynurenine (OR, 1.756; 95% CI, 1.113–2.769; p = 0.015) was a risk factor of ALS. In arginine metabolism, dimethylarginine (OR, 1.826; 95% CI, 1.003–3.321; p = 0.049) was suggested to be related to higher risk of ALS. Phenylacetate, a modulator of central adrenergic functions (OR, 1.064; 95% CI, 1.008–1.124; p = 0.024). Other ammino acids such as glutamine (OR, 0.803; 95% CI, 0.667–0.968; p = 0.022) and isoleucine (OR, 0.791; 95% CI, 0.678–0.923; p = 0.003) were revealed as protective factors of AD and PD respectively. Besides, phenylalanine (PAA), one of phenylalanine derivatives (OR, 1.064; 95% CI, 1.008–1.124; p = 0.024) was indicated to increase the risk of AD. We also found that hippurate, a product of polyphenols (OR, 1.531; 95% CI, 1.142–2.051; p = 0.004), was associated with high risk of ALS. Gut microbiota also generated a protective factor of AD, mannitol (OR, 0.993; 95% CI, 0.988–0.998; p = 0.009), and a risk factor of PD (OR, 2.143; 95% CI, 1.026–4.476; p = 0.043).
Furthermore, those results were judged to be reliable without pleiotropy through sensitivity analyses (Table 2, Supplementary Table 7). However, no significant association was revealed (FDR-corrected p-values > 0.05), and MR power calculation results were showed in Supplementary Table 6.
Table 2
Sensitivity analyses of MR analyses of neurodegenerative diseases on gut microbiota dependent metabolites features by MR Egger, simple mode, weighted median, and weighted mode
| Outcome | Exposure | MR Egger | Simple mode | Weighted median | Weighted mode | RAPS | |||||
| OR (95% CI) | p | OR (95% CI) | p | OR (95% CI) | p | OR (95% CI) | p | OR (95% CI) | p | ||
| AD | Mannitol | 0.962 (0.911,1.016) | 0.19 | 1 (0.946,1.058) | 0.99 | 0.976 (0.944,1.009) | 0.15 | 0.981 (0.935,1.029) | 0.45 | 0.969 (0.944,0.994) | 0.02 |
| AD | Glutamine | 0.617 (0.441,0.864) | 0.03 | 0.972 (0.654,1.445) | 0.89 | 0.727 (0.573,0.923) | 0.01 | 0.714 (0.547,0.932) | 0.04 | 0.801 (0.655,0.98) | 0.03 |
| AD | Phenylacetate | 1.046 (0.965,1.134) | 0.31 | 1.058 (0.946,1.184) | 0.36 | 1.063 (0.99,1.14) | 0.09 | 1.063 (0.989,1.142) | 0.14 | 1.065 (1,1.133) | 0.05 |
| PD | Isoleucine | 0.847 (0.677,1.06) | 0.19 | 0.758 (0.517,1.11) | 0.19 | 0.818 (0.667,1.004) | 0.06 | 0.819 (0.679,0.987) | 0.07 | 0.786 (0.661,0.935) | 0.01 |
| PD | Hydrocinnamate | 2.296 (0.914,5.772) | 0.10 | 1.942 (0.75,5.029) | 0.19 | 2.026 (1.092,3.761) | 0.03 | 1.942 (0.937,4.024) | 0.10 | 1.754 (1.09,2.821) | 0.02 |
| PD | Serotonin | 0.672 (0.178,2.545) | 0.57 | 0.418 (0.11,1.595) | 0.22 | 0.498 (0.218,1.14) | 0.10 | 0.459 (0.15,1.404) | 0.19 | 0.535 (0.285,1.006) | 0.05 |
| PD | Arabinose | 1.939 (0.379,9.935) | 0.51 | 2.345 (0.752,7.319) | 0.24 | 2.156 (0.862,5.39) | 0.10 | 2.184 (0.836,5.708) | 0.21 | 2.153 (0.931,4.983) | 0.07 |
| ALS | Hippurate | 1.2 (0.611,2.357) | 0.61 | 1.909 (0.992,3.673) | 0.07 | 1.405 (0.963,2.051) | 0.08 | 1.277 (0.784,2.079) | 0.34 | 1.587 (1.152,2.187) | 0.00 |
| ALS | Kynurenine | 1.956 (0.772,4.956) | 0.17 | 1.791 (0.567,5.654) | 0.33 | 1.682 (0.885,3.197) | 0.11 | 1.791 (0.859,3.733) | 0.13 | 2.056 (1.318,3.206) | 0.00 |
| ALS | Dimethylarginine | 1.525 (0.262,8.872) | 0.64 | 3.646 (0.655,20.297) | 0.15 | 2.202 (0.913,5.315) | 0.08 | 3.073 (0.831,11.369) | 0.10 | 1.853 (0.968,3.545) | 0.06 |
| ALS | Taurodeoxycholate | 1.132 (0.683,1.876) | 0.64 | 1.125 (0.783,1.616) | 0.54 | 1.138 (0.922,1.404) | 0.23 | 1.158 (0.833,1.608) | 0.40 | 1.162 (0.99,1.364) | 0.07 |
OR, Odds ratios for associations of genetically predicted gut microbiota-derived metabolite traits with neurodegenerative diseases; CI, confidence interval; MR, Mendelian randomization; RAPS, robust adjusted profile score; AD, Alzheimer’s disease; PD, Parkinson’s disease; ALS, amyotrophic lateral sclerosis.
Fig. 3
Associations of genetically predicted gut microbiota-dependent metabolites with risk of neurodegenerative diseases using IVW method. OR, odds ratio; CI, confidence interval; FDR, False discovery rate.
The results of MR analysis which applied a SNP selecting threshold of genome-wide significant level of p < 5×10⁻⁸ were shown in Supplementary Tables 10 and 11. However, the results should be considered with caution as the number of the IVs applied in analysis was not much enough to perform sensitivity analysis.
DISCUSSION
In the present MR study, we found significant association of increased abundance of genera RuminococcaceaeUCG004 and higher risk of ALS. Besides, we found suggestive evidence of causal associations of Actinobacteria, Lactobacillaceae, Faecalibacterium, and Ruminiclostridium, Lachnoclostridium with AD, of Lentisphaerae, Lentisphaeria, Oxalobacteraceae, Victivallales, Bacillales, Eubacteriumhalliigroup, Anaerostipes, and Clostridiumsensustricto1 with PD, and of Lachnospira, Fusicatenibacter, Catenibacterium, and Ruminococcusgnavusgroup with ALS. Additionally, metabolites including amino acids, bile acids, amino acids, polyphenols produced by gut microbiota were also potentially related to the risks of neurodegenerative disorders, indicating their important roles in gut microbiota-brain axis.
A previous MR study has suggested that increase in Blautia and elevated γ-aminobutyric acid (GABA) were related to lower risk of AD [36]. However, our study failed to repeat these findings, nor Blautia or GABA including putrescine, glutamate, arginine, or ornithin which produces GABA were found related to risk of AD, which is potentially due to lack of significance of results and scale of GWAS. Another MR study proved no causal association of trimethylamine N-oxide (TMAO) or its precursor with AD, which was consistent with our results [37]. Additionally, our finding of Actinobacteria at family level as a risk factor of AD was opposite to previous studies [10], while the findings of relationships between Lactobacillaceae and Faecalibacterium with AD were in accordance with the result of previous cross-sectional studies [11]. Interestingly, genera Ruminiclostridium6 and Ruminiclostridium9 represent different effects on risk of AD in our analysis results, which remind us that inconsistencies in results of previous clinical studies were potentially due to insufficiently digging deeper into classification of genera level of gut microbiota. Besides, our study suggested that phenylacetate, which was a potential tracer of glibal metabolism was related to increased risk of AD [38]. In addition, mannitol, a microbial metabolite was found as protective factor of AD, which may provide new ideas for disease interventions.
Our study revealed suggestive causal effect of increased abundance of phylum Lentisphaerae, class Lentisphaeria, and order Victivallales on protective effects of PD; however, no direct effect revealed after multivariable MR analysis, while no relevant result was reported in previous studies either, therefore, such results should be treated with caution. Other associations of Family Oxalobacteraceae, Order Bacillales, Eubacteriumhalliigroup, Anaerostipes, and Clostridiumsensustrictol with risk of PD were in accordance with the result of previous cross-sectional studies [12, 13, 39]. In a previous clinical study, which compared the fecal microbiota of 25 ALS patients with 32 controls, significant higher abundance of uncultured Ruminococcaceae at genus level was observed in ALS patients [14]. However, our study found significant association between RuminococcaceaeUCG004 and higher risk of ALS, and suggestive association between Ruminococcusgnavusgroup and lower risk of ALS. Inconsistent results between these studies may likely be attributed to small study sample sizes of previous observational studies, sample heterogeneity, and different sequencing technologies. Therefore, a standardized classification system for gut microbiota at genus level or even more specific level is crucial to direct mechanism research and provide more accurate clinical guidance.
Tryptophan is broken down by the microbiota into indole derivatives and also tryptamine and kynurenine metabolites, and those metabolites were considered important in gut-brain axis [40, 41]. Previous studies have revealed that glutamate signals are destroyed by serotonergic overdrive, and serotonergic dysfunction is associated with the development of motor and non-motor symptoms and complications in PD [42]. Moreover, kynurenine pathway (KP) of tryptophan degradation is involved with several neuropathological features present in ALS including neuroinflammation, excitotoxicity, oxidative stress, immune system activation, and dysregulation of energy metabolism [43]. Previous clinical studies have revealed that serum kynurenine in controls were lower than that in ALS [44]. Our study proved that serotonin was protective factor of PD, while kynurenine was risk factor of ALS, and those molecules may become potential biomarkers to assess the progression of relative diseases. In addition, other amino acid such as glutamine and isoleucine were found causally associated with lower risk of AD and PD. Actually, up to 50% of all α-amino groups of glutamate and glutamine are derived from leucine. Leucine is a regulator of the mechanistic target of rapamycin (mTOR) complex 1 (mTORC1), which is critical on protein synthesis and degradation, autophagy as well as maintenance of glutamate homeostasis, and may have effects on the neuronal solute transport and the excitatory neurotransmitter function [45]. Moreover, in the glutamate-glutamine cycle, synaptically-released glutamate is rapidly transported into astrocytes, and glutamine is then released by astrocytes through SN-type glutamine transporters into the extracellular fluid. Aβ has been shown to reduce the surface expression of GLT-1and to impair astrocyte glutamate uptake [46, 47]. A recent study demonstrated that altered astrocyte glutamine synthesis directly impaired neuronal GABA synthesis in brain slices of the 5xFAD mouse model of AD [48], and our results provided clinical evidence to confirm that reduction of glutamine in peripheral blood was causally associated with occurrence of AD.
Bacterial metabolites produced from polyphenol precursors were also found at levels sufficient to exert biological effects enter circulation [49]. In vitro cultures have shown that polyphenol metabolites such as ferulic acid are able to exert protective effects on neuronal cultures and neurodegenerative models, mostly through a decrease in inflammatory responses [50, 51]; however, in vivo evidence remains lacking. Our study suggested hippurate belongs to the group of uremic toxins as a risk factor of ALS, which may indicate potential treatment of disease. Since those neurodegenerative diseases develop through a long prodromal phase, it is plausible that our findings may inform early interventions by targeting the microbiota via gut microbiota transplantation, psychobiotics, or antibiotics in the future. Plus, gut microbiome is explicitly bidirectionally associated with diet [52]. Recent studies have found that Mediterranean diet adherence is found to reshape gut microbiota composition with increased abundance of Bacteroides, Prevotella, Ruminococcus, and Faecalibacterium. Those gut microbiota may play a role through generating healthy SCFAs and producing anti-inflammation effects in preventing AD, PD, and ALS [54–56]. Therefore, more in-depth investigations are needed to find out mechanisms underlying the relationships among diet, gut microbiota, and occurrence of different neurodegenerative diseases.
Among the strengths of the study are the most comprehensive MR study on association of gut microbiota and metabolite traits with neurodegenerative diseases, and the largest sample size so far. However, our study still suffers from several limitations. First, most of the results did not survive a strict FDR correction. However, MR was a hypothesis-driven approach, and it could be used to detect some causal relationships regardless of FDR adjusting when some biological evidence exists. Second, 16S rRNA gene sequencing describes gut microbiota from genus to phylum level only, and metagenomic and multiomic approaches may offer opportunities to target gut microbiota composition at a more specific level, avoiding bias if species of more specific level associated with neurodegenerative diseases. Third, our findings might have been affected by weak instrument bias as we included a loose cutoff of exposure-related SNPs at a threshold of p < 1×10⁻⁵, although we had excluded SNPs that had F-statistics less than 10 to avoid weak instrument bias, and the result based on exposure-related SNPs at genome-wide significance (p < 5×10⁻⁸) should be considered with caution due to low sensitivity of IVs. Finally, gut microbiota is affected by several environmental factors including diet, lifestyle, and medication, whereas the original studies lacked detailed information on disease severity or medication status, further subgroup analysis was hard to be performed so far.
ACKNOWLEDGMENTS
All data used in the current study were based on summary-level data that have been made publicly available. Summary data from genome-wide association studies for the gut microbiota (Kurilshikov et al.) is available at https://www.mibiogen.org/. Metabolomic GWAS summary statistics (Shin et al.) are available for download from the metabolomics GWAS server (http://metabolomics.helmholtz-muenchen.de/gwas/index.php?task=download). Summary level data for AD (Jansen et al.) can be obtained from https://ctg.cncr.nl/, for PD (Nalls et al.) from https://pdgenetics.org/resources (participants from 23andMe Inc. were excluded), and for ALS (Nicolas et al.) from http://als.umassmed.edu. All data generated or analyzed during this study are included in this published article and its Supplementary Material.
This study was supported by grants from the National Natural Science Foundation of China (82071201, 82071201), Shanghai Municipal Science and Technology Major Project (No.2018SHZDZX01) and ZHANGJIANG LAB, Tianqiao and Chrissy Chen Institute, and the State Key Laboratory of Neurobiology and Frontiers Center for Brain Science of Ministry of Education, Fudan University.
Authors’ disclosures available online (https://www.j-alz.com/manuscript-disclosures/21-5411r2).
SUPPLEMENTARY MATERIAL
[1] The supplementary material is available in the electronic version of this article: https://dx.doi.org/10.3233/JAD-215411.
REFERENCES
[1] | Hussain R , Zubair H , Pursell S , Shahab M ((2018) ) Neurodegenerative diseases: Regenerative mechanisms and novel therapeutic approaches. Brain Sci 8: , 177. |
[2] | Patnala R , Arumugam TV , Gupta N , Dheen ST ((2017) ) HDAC inhibitor sodium butyrate-mediated epigenetic regulation enhances neuroprotective function of microglia during ischemic stroke. Mol Neurobiol 54: , 6391–6411. |
[3] | Val-Laillet D , Guérin S , Coquery N , Nogret I , Formal M , Romé V , Le Normand L , Meurice P , Randuineau G , Guilloteau P , Malbert CH , Parnet P , Lallès JP , Segain JP ((2018) ) Oral sodium butyrate impacts brain metabolism and hippocampal neurogenesis, with limited effects on gut anatomy and function in pigs. FASEB J 32: , 2160–2171. |
[4] | Strandwitz P ((2018) ) Neurotransmitter modulation by the gut microbiota. Brain Res 1693: , 128–133. |
[5] | Cervenka I , Agudelo LZ , Ruas JL ((2017) ) Kynurenines: Tryptophan’s metabolites in exercise, inflammation, and mental health. Science 357: , eaaf9794. |
[6] | Platten M , Nollen EAA , Röhrig UF , Fallarino F , Opitz CA ((2019) ) Tryptophan metabolism as a common therapeutic target in cancer, neurodegeneration and beyond. Nat Rev Drug Discov 18: , 379–401. |
[7] | Pokusaeva K , Johnson C , Luk B , Uribe G , Fu Y , Oezguen N , Matsunami RK , Lugo M , Major A , Mori-Akiyama Y , Hollister EB , Dann SM , Shi XZ , Engler DA , Savidge T , Versalovic J ((2017) ) GABA-producing Bifidobacterium dentium modulates visceral sensitivity in the intestine. Neurogastroenterol Motil 29: , e12904. |
[8] | Caspani G , Swann J ((2019) ) Small talk: Microbial metabolites involved in the signaling from microbiota to brain. Curr Opin Pharmacol 48: , 99–106. |
[9] | Cryan JF , O’Riordan KJ , Sandhu K , Peterson V , Dinan TG ((2020) ) The gut microbiome in neurological disorders. Lancet Neurol 19: , 179–194. |
[10] | Vogt NM , Kerby RL , Dill-McFarland KA , Harding SJ , Merluzzi AP , Johnson SC , Carlsson CM , Asthana S , Zetterberg H , Blennow K , Bendlin BB , Rey FE ((2017) ) Gut microbiome alterations in Alzheimer’s disease. Sci Rep 7: , 13537–13537. |
[11] | Zhuang ZQ , Shen LL , Li WW , Fu X , Zeng F , Gui L , Lü Y , Cai M , Zhu C , Tan YL , Zheng P , Li HY , Zhu J , Zhou HD , Bu XL , Wang YJ ((2018) ) Gut microbiota is altered in patients with Alzheimer’s disease. J Alzheimers Dis 63: , 1337–1346. |
[12] | Unger MM , Spiegel J , Dillmann KU , Grundmann D , Philippeit H , Bürmann J , Faßbender K , Schwiertz A , Schäfer KH ((2016) ) Short chain fatty acids and gut microbiota differ between patients with Parkinson’s disease and age-matched controls. Parkinsonism Relat Disord 32: , 66–72. |
[13] | Hill-Burns EM , Debelius JW , Morton JT , Wissemann WT , Lewis MR , Wallen ZD , Peddada SD , Factor SA , Molho E , Zabetian CP , Knight R , Payami H ((2017) ) Parkinson’s disease and Parkinson’s disease medications have distinct signatures of the gut microbiome. Mov Disord 32: , 739–749. |
[14] | Brenner D , Hiergeist A , Adis C , Mayer B , Gessner A , Ludolph AC , Weishaupt JH ((2018) ) The fecal microbiome of ALS patients. Neurobiol Aging 61: , 132–137. |
[15] | Di Gioia D , Bozzi Cionci N , Baffoni L , Amoruso A , Pane M , Mogna L , Gaggìa F , Lucenti MA , Bersano E , Cantello R , De Marchi F , Mazzini L ((2020) ) A prospective longitudinal study on the microbiotacomposition in amyotrophic lateral sclerosis. BMC Med 18: , 153. |
[16] | Lawlor DA , Harbord RM , Sterne JA , Timpson N , Davey Smith G ((2008) ) Mendelian randomization: Using genes as instruments for making causal inferences in epidemiology. Stat Med 27: , 1133–1163. |
[17] | Shi H , Mancuso N , Spendlove S , Pasaniuc B ((2017) ) Local genetic correlation gives insights into the shared genetic architecture of complex traits. Am J Hum Genet 101: , 737–751. |
[18] | Kurilshikov A , Medina-Gomez C , Bacigalupe R , Radjabzadeh D , Wang J , Demirkan A , Le Roy CI , Raygoza Garay JA , Finnicum CT , Liu X , Zhernakova DV , Bonder MJ , Hansen TH , Frost F , Rühlemann MC , Turpin W , Moon JY , Kim HN , Lüll K , Barkan E , Shah SA , Fornage M , Szopinska-Tokov J , Wallen ZD , Borisevich D , Agreus L , Andreasson A , Bang C , Bedrani L , Bell JT , Bisgaard H , Boehnke M , Boomsma DI , Burk RD , Claringbould A , Croitoru K , Davies GE , van Duijn CM , Duijts L , Falony G , Fu J , van der Graaf A , Hansen T , Homuth G , Hughes DA , Ijzerman RG , Jackson MA , Jaddoe VWV , Joossens M , Jørgensen T , Keszthelyi D , Knight R , Laakso M , Laudes M , Launer LJ , Lieb W , Lusis AJ , Masclee AAM , Moll HA , Mujagic Z , Qibin Q , Rothschild D , Shin H , Sørensen SJ , Steves CJ , Thorsen J , Timpson NJ , Tito RY , Vieira-Silva S , Völker U , Völzke H , Võsa U , Wade KH , Walter S , Watanabe K , Weiss S , Weiss FU , Weissbrod O , Westra HJ , Willemsen G , Payami H , Jonkers D , Arias Vasquez A , de Geus EJC , Meyer KA , Stokholm J , Segal E , Org E , Wijmenga C , Kim HL , Kaplan RC , Spector TD , Uitterlinden AG , Rivadeneira F , Franke A , Lerch MM , Franke L , Sanna S , D’Amato M , Pedersen O , Paterson AD , Kraaij R , Raes J , Zhernakova A ((2021) ) Large-scale association analysesidentify host factors influencing human gut microbiome composition. Nat Genet 53: , 156–165. |
[19] | Quast C , Pruesse E , Yilmaz P , Gerken J , Schweer T , Yarza P , Peplies J , Glöckner FO ((2013) ) The SILVA ribosomal RNA gene database project: Improved data processing and web-based tools. Nucleic Acids Res 41: , D590–596. |
[20] | Wishart DS , Feunang YD , Marcu A , Guo AC , Liang K , Vázquez-Fresno R , Sajed T , Johnson D , Li C , Karu N , Sayeeda Z , Lo E , Assempour N , Berjanskii M , Singhal S , Arndt D , Liang Y , Badran H , Grant J , Serra-Cayuela A , Liu Y , Mandal R , Neveu V , Pon A , Knox C , Wilson M , Manach C , Scalbert A ((2018) ) HMDB 4.0: The human metabolome database for 2018. Nucleic Acids Res 46: , D608–D617. |
[21] | Jansen IE , Savage JE , Watanabe K , Bryois J , Williams DM , Steinberg S , Sealock J , Karlsson IK , Hägg S , Athanasiu L , Voyle N , Proitsi P , Witoelar A , Stringer S , Aarsland D , Almdahl IS , Andersen F , Bergh S , Bettella F , Bjornsson S , Brækhus A , Bråthen G , de Leeuw C , Desikan RS , Djurovic S , Dumitrescu L , Fladby T , Hohman TJ , Jonsson PV , Kiddle SJ , Rongve A , Saltvedt I , Sando SB , Selbæk G , Shoai M , Skene NG , Snaedal J , Stordal E , Ulstein ID , Wang Y , White LR , Hardy J , Hjerling-Leffler J , Sullivan PF , van der Flier WM , Dobson R , Davis LK , Stefansson H , Stefansson K , Pedersen NL , Ripke S , Andreassen OA , Posthuma D ((2019) ) Genome-wide meta-analysis identifies new loci and functional pathways influencing Alzheimer’s disease risk. Nat Genet 51: , 404–413. |
[22] | Nalls MA , Blauwendraat C , Vallerga CL , Heilbron K , Bandres-Ciga S , Chang D , Tan M , Kia DA , Noyce AJ , Xue A , et al. ((2019) ) Identification of novel risk loci, causal insights, and heritable risk for Parkinson’s disease: A meta-analysis of genome-wide association studies. Lancet Neurol 18: , 1091–1102. |
[23] | Nicolas A , Kenna KP , Renton AE , Ticozzi N , Faghri F , Chia R , Dominov JA , Kenna BJ , Nalls MA , Keagle P , et al. ((2018) ) Genome-wide analyses identify KIF5A as a novel ALS gene. Neuron 97: , 1268–1283.e1266. |
[24] | Shin SY , Fauman EB , Petersen AK , Krumsiek J , Santos R , Huang J , Arnold M , Erte I , Forgetta V , Yang TP , Walter K , Menni C , Chen L , Vasquez L , Valdes AM , Hyde CL , Wang V , Ziemek D , Roberts P , Xi L , Grundberg E ; Multiple Tissue Human Expression Resource (MuTHER) Consortium Waldenberger M , Richards JB , Mohney RP , Milburn MV , John SL , Trimmer J , Theis FJ , Overington JP , Suhre K , Brosnan MJ , Gieger C , Kastenmüller G , Spector TD , Soranzo N ((2014) ) An atlas of genetic influences on human blood metabolites. Nat Genet 46: , 543–550. |
[25] | Zheng J , Baird D , Borges M-C , Bowden J , Hemani G , Haycock P , Evans DM , Smith GD ((2017) ) Recent developments in Mendelian randomization studies. Curr Epidemiol Rep 4: , 330–345. |
[26] | Benjamini Y , Hochberg Y ((1995) ) Controlling the false discovery rate: A practical and powerful approach to multiple testing. J R Stat Soc Series B Methodol 57: , 289–300. |
[27] | Brion MJ , Shakhbazov K , Visscher PM ((2013) ) Calculating statistical power in Mendelian randomization studies. Int J Epidemiol 42: , 1497–1501. |
[28] | Hartwig FP , Davey Smith G , Bowden J ((2017) ) Robust inference in summary data Mendelian randomization via the zero modal pleiotropy assumption. Int J Epidemiol 46: , 1985–1998. |
[29] | Sanderson E , Spiller W , Bowden J (2020) Testing and correcting for weak and pleiotropic instruments in two sample multivariable Mendelian randomisation. bioRxiv, 2020.2004.2002.021980. |
[30] | Bowden J , Davey Smith G , Burgess S ((2015) ) Mendelian randomization with invalid instruments: Effect estimation and bias detection through Egger regression. Int J Epidemiol 44: , 512–525. |
[31] | Bowden J , Del Greco MF , Minelli C , Davey Smith G , Sheehan NA , Thompson JR ((2016) ) Assessing the suitability of summary data for two-sample Mendelian randomization analyses using MR-Egger regression: The role of the I2 statistic. Int J Epidemiol 45: , 1961–1974. |
[32] | Hemani G , Tilling K , Davey Smith G ((2017) ) Orienting the causal relationship between imprecisely measured traits using GWAS summary data. PLoS Genet 13: , e1007081. |
[33] | Verbanck M , Chen CY , Neale B , Do R ((2018) ) Detection of widespread horizontal pleiotropy in causal relationships inferred from Mendelian randomization between complex traits and diseases. Nat Genet 50: , 693–698. |
[34] | Burgess S , Thompson SG ((2015) ) Multivariable Mendelian randomization: The use of pleiotropic genetic variants to estimate causal effects. Am J Epidemiol 181: , 251–260. |
[35] | Needham BD , Kaddurah-Daouk R , Mazmanian SK ((2020) ) Gut microbial molecules in behavioural and neurodegenerative conditions. Nat Rev Neurosci 21: , 717–731. |
[36] | Zhuang Z , Yang R , Wang W , Qi L , Huang T ((2020) ) Associations between gut microbiota and Alzheimer’s disease, major depressive disorder, and schizophrenia. J Neuroinflammation 17: , 288. |
[37] | Zhuang Z , Gao M , Yang R , Liu Z , Cao W , Huang T ((2021) ) Causal relationships between gut metabolites and Alzheimer’s disease: A bidirectional Mendelian randomization study. Neurobiol Aging 100: , 119.e115–119.e118. |
[38] | Inoue O , Hosoi R , Momosaki S , Yamamoto K , Amitani M , Yamaguchi M , Gee A ((2006) ) Evaluation of [14C]phenylacetate as a prototype tracer for the measurement of glial metabolism in the rat brain. Nucl Med Biol 33: , 985–989. |
[39] | Bedarf JR , Hildebrand F , Coelho LP , Sunagawa S , Bahram M , Goeser F , Bork P , Wüllner U ((2017) ) Functional implications of microbialand viral gut metagenome changes in early stage L-DOPA-naïveParkinson’s disease patients. Genome Med 9: , 39. |
[40] | O’Farrell K , Harkin A ((2017) ) Stress-related regulation of the kynurenine pathway: Relevance to neuropsychiatric and degenerative disorders. Neuropharmacology 112: , 307–323. |
[41] | Jaglin M , Rhimi M , Philippe C , Pons N , Bruneau A , Goustard B , Daugé V , Maguin E , Naudon L , Rabot S ((2018) ) Indole, a signaling molecule produced by the gut microbiota, negatively impacts emotional behaviors in rats. Front Neurosci 12: , 216. |
[42] | Politis M , Niccolini F ((2015) ) Serotonin in Parkinson’s disease. Behav Brain Res 277: , 136–145. |
[43] | Tan VX , Guillemin GJ ((2019) ) Kynurenine pathway metabolites as biomarkers for amyotrophic lateral sclerosis. Front Neurosci 13: , 1013–1013. |
[44] | Chen Y , Stankovic R , Cullen KM , Meininger V , Garner B , Coggan S , Grant R , Brew BJ , Guillemin GJ ((2010) ) The kynurenine pathway and inflammation in amyotrophic lateral sclerosis. Neurotox Res 18: , 132–142. |
[45] | Wuolikainen A , Jonsson P , Ahnlund M , Antti H , Marklund SL , Moritz T , Forsgren L , Andersen PM , Trupp M ((2016) ) Multi-platform mass spectrometry analysis of the CSF and plasma metabolomes of rigorously matched amyotrophic lateral sclerosis, Parkinson’s disease and control subjects. Mol Biosyst 12: , 1287–1298. |
[46] | Scimemi A , Meabon JS , Woltjer RL , Sullivan JM , Diamond JS , Cook DG ((2013) ) Amyloid-β1-42 slows clearance of synaptically released glutamate by mislocalizing astrocytic GLT-1. J Neurosci 33: , 5312–5318. |
[47] | Andersen JV , Markussen KH , Jakobsen E , Schousboe A , Waagepetersen HS , Rosenberg PA , Aldana BI ((2021) ) Glutamate metabolism and recycling at the excitatory synapse in health and neurodegeneration. Neuropharmacology 196: , 108719. |
[48] | Andersen JV , Christensen SK , Westi EW , Diaz-delCastillo M , Tanila H , Schousboe A , Aldana BI , Waagepetersen HS ((2021) ) Deficient astrocyte metabolism impairs glutamine synthesis and neurotransmitter homeostasis in a mouse model of Alzheimer’s disease. Neurobiol Dis 148: , 105198. |
[49] | Gasperotti M , Passamonti S , Tramer F , Masuero D , Guella G , Mattivi F , Vrhovsek U ((2015) ) Fate of microbial metabolites of dietary polyphenols in rats: Is the brain their target destination? ACS Chem Neurosci 6: , 1341–1352. |
[50] | Figueira I , Garcia G , Pimpão RC , Terrasso AP , Costa I , Almeida AF , Tavares L , Pais TF , Pinto P , Ventura MR , Filipe A , McDougall GJ , Stewart D , Kim KS , Palmela I , Brites D , Brito MA , Brito C , Santos CN ((2017) ) Polyphenols journey through blood-brain barrier towardsneuronal protection. Sci Rep 7: , 11456. |
[51] | Mori T , Koyama N , Guillot-Sestier MV , Tan J , Town T ((2013) ) Ferulic acid is a nutraceutical β-secretase modulator that improves behavioral impairment and Alzheimer-like pathology in transgenic mice. PLoS One 8: , e55774. |
[52] | Sonnenburg JL , Bäckhed F ((2016) ) Diet-microbiota interactions as moderators of human metabolism. Nature 535: , 56–64. |
[53] | Nagpal R , Shively CA , Register TC , Craft S , Yadav H ((2019) ) Gut microbiome-Mediterranean diet interactions in improving host health. F1000Res 8: , 699. |
[54] | Ballarini T , Melo van Lent D , Brunner J , Schröder A , Wolfsgruber S , Altenstein S , Brosseron F , Buerger K , Dechent P , Dobisch L , Duzel E , Ertl-Wagner B , Fliessbach K , Freiesleben SD , Frommann I , Glanz W , Hauser D , Haynes JD , Heneka MT , Janowitz D , Kilimann I , Laske C , Maier F , Metzger CD , Munk M , Perneczky R , Peters O , Priller J , Ramirez A , Rauchmann B , Roy N , Scheffler K , Schneider A , Spottke A , Spruth EJ , Teipel SJ , Vukovich R , Wiltfang J , Jessen F , Wagner M ((2021) ) Mediterranean diet, Alzheimer disease biomarkers and brain atrophy in old age. Neurology 96: , e2920–2932. |
[55] | Metcalfe-Roach A , Yu AC , Golz E , Cirstea M , Sundvick K , Kliger D , Foulger LH , Mackenzie M , Finlay BB , Appel-Cresswell S ((2021) ) MIND and Mediterranean diets associated with later onset of Parkinson’s disease. Mov Disord 36: , 977–984. |
[56] | Caplliure-Llopis J , Peralta-Chamba T , Carrera-Juliá S , Cuerda-Ballester M , Drehmer-Rieger E , López-Rodriguez MM , de la Rubia Ortí JE ((2020) ) Therapeutic alternative of the ketogenic Mediterranean diet to improve mitochondrial activity in amyotrophic lateral sclerosis (ALS): A comprehensive review. Food Sci Nutr 8: , 23–35. |


