
Neuronal Cell Cycle Re-Entry Enhances Neuropathological Features in AppNLF Knock-In Mice
Abstract
Background:
Aberrant cell cycle re-entry is a well-documented process occurring early in Alzheimer’s disease (AD). This is an early feature of the disease and may contribute to disease pathogenesis.
Objective:
To assess the effect of forced neuronal cell cycle re-entry in mice expressing humanized Aβ, we crossed our neuronal cell cycle re-entry mouse model with AppNLF knock-in (KI) mice.
Methods:
Our neuronal cell cycle re-entry (NCCR) mouse model is bitransgenic mice heterozygous for both Camk2a-tTA and TRE-SV40T. The NCCR mice were crossed with AppNLF KI mice to generate NCCR-AppNLF animals. Using this tet-off system, we triggered NCCR in our animals via neuronal expression of SV40T starting at 1 month of age. The animals were examined at the following time points: 9, 12, and 18 months of age. Various neuropathological features in our mice were evaluated by image analysis and stereology on brain sections stained using either immunofluorescence or immunohistochemistry.
Results:
We show that neuronal cell cycle re-entry in humanized Aβ plaque producing AppNLF KI mice results in the development of additional AD-related pathologies, namely, pathological tau, neuroinflammation, brain leukocyte infiltration, DNA damage response, and neurodegeneration.
Conclusion:
Our findings show that neuronal cell cycle re-entry enhances AD-related neuropathological features in AppNLF mice and highlight our unique AD mouse model for studying the pathogenic role of aberrant cell cycle re-entry in AD.
INTRODUCTION
Alzheimer’s disease (AD) is a progressive neurodegenerative disease resulting in memory loss and cognitive decline, and is the most common form of dementia. The main pathological hallmarks of AD are amyloid-β (Aβ) plaques, neurofibrillary tau tangles (NFT), and neuronal loss. Although the majority of the AD cases are sporadic, approximately 1-2%of the AD cases are caused by genetic mutations in amyloid precursor protein (APP) and presenilin (PSEN1 and PSEN2). This discovery led to the development of numerous transgenic mouse models harboring one or more of the familial AD (FAD) mutations [1]. These models produce substantial Aβ deposition demonstrating the pathological significance of Aβ plaque formation in the disease. However, these animals do not display tau pathologies reminiscent of AD and do not demonstrate substantial neuronal loss [2], suggesting that Aβ alone may be insufficient for AD pathogenesis.
Another potential contributing factor in AD is ectopic cell cycle activation as suggested by the evidence of aberrant neuronal cell cycle re-entry in AD patients and AD mouse models [3–21]. Between 5 and 10%of the cells show cell cycle marker labeling in the hippocampus, locus coeruleus, and dorsal raphe nucleus of postmortem AD brain samples, whereas little staining is observed in control brains [14, 21]. Additionally, cell cycle protein expression and DNA synthesis appear to correlate with neuronal degeneration in AD. Human autopsy samples show that areas vulnerable to neuronal loss in AD patients express cell cycle proteins, whereas areas that do not experience neuronal death are negative for cell cycle markers [14, 22]. Furthermore, forced cell cycle re-entry in postmitotic neurons leads to neurodegeneration and cell death [23]. Multiple laboratories have reported neurodegeneration as a result of neuronal cell cycle induction [14, 16, 24–26]. More recently, genome wide association studies (GWAS) highlight the potential cell cycle related genes that are associated with AD. Specifically, KAT8, BHMG1, and ANKRD31 are all involved in the control of cell cycle progression or regulation, and have been implicated by GWAS studies as being mechanistically involved in AD [27–30]. A network analysis using epigenetic and transcriptomic datasets from AD brains identified major hub genes associated with molecular pathways involved in cell cycle re-entry and inflammation [31]. Thus, several lines of evidence support a role for aberrant cell cycle re-entry as a pathogenic factor in human AD.
The relationship between neuronal cell cycle re-entry and various AD pathologies has been demonstrated in various models. Connections have been made between neuronal cell cycle re-entry and Aβ pathology [25, 32], tau dysfunction [25, 33–35], neuroinflammation [24, 26, 36, 37], and neuronal loss [24, 25, 33]. Of these models, our Simian Virus 40 Large T (SV40T)-mediated neuronal cell cycle re-entry mouse model is the only one shown to simultaneously display the greatest number of pathologies associated with AD [24, 26].
Our mice were designed to conditionally express SV40T to force cell cycle re-entry in mature neurons using the Tet-off system for evaluating the role of neuronal cell cycle re-entry in AD [25]. SV40T is a powerful oncoprotein that activates the cell cycle by inhibiting the retinoblastoma protein (pRb)- and p53-mediated tumor suppressor pathways [38]. pRb is hyperphosphorylated and p53 is dysregulated in AD [39–44]. Phosphorylated pRb is also associated with tau pathology in various tauopathies [45]. Expression of SV40T in either Purkinje cells or rod photoreceptors results in degeneration [46–48]. Others have shown in culture that forced cell cycle re-entry in primary neurons through expression of SV40T results in hyperploidy, which is also observed in AD brains [20, 49].
The expression of SV40T is under the regulation of a tetracycline response element in these mice (TRE-SV40T or “TAg” mice). The expression of SV40T is targeted to excitatory forebrain neurons by crossing the TAg mice with Camk2a-tTA Tg mice that express tetracycline-controlled transactivator (tTA) under the control of the CamKinase IIα (Camk2a) promoter (Camk2a-tTA, or “OFF” mice) [50]. Mice expressing both “TAg” and “OFF” undergo neuronal cell cycle re-entry once doxycycline is removed from the diet, typically at one month of age [25, 37]. And this neuronal cell cycle re-entry is abolished when the animals are put back on dox diet to suppress SV40T expression [37]. Our work using the TAg (het)/OFF (het) bi-transgenic mice (hereafter referred to as neuronal cell cycle re-entry (NCCR) mice) showed that forced ectopic neuronal cell cycle activation induces a number of pathological features that mirror multiple pathological hallmarks of AD: Aβ and tau pathologies from endogenous mouse proteins, gliosis, neuroinflammation, brain leukocyte infiltration, and neurodegeneration [25, 37].
To investigate the pathogenic role of neuronal cell cycle re-entry in mice expressing humanized Aβ plaques from endogenous amyloid-β protein precursor (AβPP), we crossed our unique NCCR mouse model with AppNLF KI mice. AppNLF KI mice possess FAD-linked Swedish and Iberian mutations to enhance Aβ production [51]. Furthermore, the Aβ domain in the mouse AβPP is humanized [51]. The mouse Aβ is less amyloidogenic compared to its human counterpart, and this is likely to be due to three amino acid substitutions in the Aβ [51–56]. These mice produce robust humanized Aβ plaques but do not demonstrate other late-stage AD pathologies such as neuronal loss and tau hyperphosphorylation [51].
Here we report that forced neuronal cell cycle re-entry in AppNLF KI mice enhances late-stage AD pathologies. We show that neuronal cell cycle re-entry results in the appearance of PHF-1 phospho-tau lesions formed from endogenous wildtype mouse tau. And the cortical appearance of PHF-1 phospho-tau lesions are correlated with severe cortical atrophy in NCCR-AppNLF mice. Additionally, our newly generated AD-relevant NCCR mouse model progressively displays many of the pathological features observed in AD, including ectopic neuronal cell cycle re-entry, human Aβ plaques, early neuroinflammation, and neurodegeneration. Hence, our findings suggest that NCCR-AppNLF mice are a promising AD model for gaining new insights into putative pathogenic role of aberrant cell cycle re-entry in AD.
MATERIALS AND METHODS
Animals
All mice were maintained on a C57BL/6N (B6N) genetic background. AppNLF mice were supplied by Saido Lab and have been previously described [51]. Camk2a-tTA (OFF) mice were obtained from the Jackson Laboratory (Bar Harbor, ME). TRE-SV40T (TAg) mice were maintained in house having been previously generated and characterized [25]. All these lines were backcrossed with B6N mice (n = 8 generations) to generate B6N congenic lines for each prior to generating the following animals. AppNLF KI mice were crossed with both Camk2a-tTA and TRE-SV40T to generate Camk2a-tTA: AppNLF (homo) [OFF(het)/AppNLF] and TRE-SV40T:AppNLF (homo) [TAg(het)/AppNLF] lines that are both homozygous for AppNLF KI. TAg(het)/AppNLF mice were bred with OFF(het)/AppNLF mice to generate TAg(het)/OFF(het)/AppNLF (NCCR-AppNLF) mouse model. Breeding pairs were maintained on doxycycline (dox) diet to ensure no SV40T expression in offspring in utero and until weaning. Following weaning at 21 days, offspring was also maintained on dox diet until 1 month of age, at which time they were switched to standard diet (std diet) to induce cell cycle re-entry in postmitotic neurons via SV40T expression. AppNLF litter mate mice were used as controls in this study since our study showed that TAg(het) animals do not show SV40T expression [37]. We confirmed that this is the case for TAg(het)/AppNLF mice (unpublished data). We also confirmed that OFF(het)/AppNLF mice do not show neuroinflammation typical of TAg(het)/OFF(het)/AppNLF (NCCR-AppNLF) animals (unpublished data). We also did not observe cortical atrophy in the OFF(het)/AppNLF mice, and this is likely due to their B6 background and continuous exposure to dox in utero and until postnatal 1 month of age [57]. Both males and females were used in the study, with their data combined in our analysis (9 months, n = 4/sex/genotype; 12 months, n = 4/sex/genotype; 18 months, NCCR-AppNLF, n = 2 females; AppNLF, n = 2 males). No sex difference was observed at 9 months and 12 months of ages for either genotype. All animals were group housed in individually ventilated cages and maintained on a 12-h light cycle with access to food and water ad libitum. PCR analysis was performed on genomic DNA isolated from tail tissue collected at the time of weaning and again at the animal’s endpoint. All animal protocols were approved by the Institutional Animal Care and Use Committee at Central Michigan University.
Antibodies
The following antibodies were used in this study: PCNA (1:1000) and SV40T (1:500) (PC10 and Pab 101, respectively, Santa Cruz Biotechnology, Dallas, TX, USA); C-terminal human Aβ42 (C42; 1:1000) (IBL-America, Minneapolis, MN); 6E10 (1:1000) (Biolegend, San Diego, CA, USA); GFAP (1:1000) (MAB360, Millipore, Billerica, MA, USA); CD68 (1:1000) (MCAA1957GA, Bio-Rad, Hercules, CA, USA); Iba1 (1:1000) (178846, Abcam, Cambridge, MA, USA); MHCII (1:1000) (#556999, BD Biosciences, San Jose, CA, USA); CD45 (1:1000) (YW62.3, Thermo Fisher Scientific, Waltham, MA, USA); PHF-1 antibody (1:2500) (generously provided by Dr. Peter Davies, The Feinstein Institute for Medical Research, Manhasset, NY); γH2AX phospho-Ser139 (1:4000) (11174, Abcam, Cambridge, MA, USA); NeuroTrace® Nissl stain (LifeTechnologies/Thermo Fisher Scientific, Waltman, MA, USA); Fluro-Jade C (Histo-Chem Inc., Arkansas, USA). Secondary antibodies used: Alexa fluor conjugated goat-anti mouse 594, goat-anti rabbit 488, goat-anti rabbit 594, and goat-anti rat 594 (Thermo Fisher Scientific, Waltham, MA, USA).
Immunofluorescence
Immunofluorescence staining was performed as previously described [58]. Briefly, mice were anesthetized, perfused using 4%paraformaldehyde, followed by overnight storage in 4%paraformaldehyde then storage in 1X phosphate buffer saline (1X PBS) until sectioning. Thirty-micron thick, coronal sections were cut using a vibrating microtome (Leica VT1000 S, Leica Biosystems, Buffalo Grove, IL, USA) and stored at –20°C until staining. Sections were rinsed three times in 1X TBS for 15 min. This was followed by permeabilization in a 3%H2O2/0.3%Triton-x100/1X TBS solution for 30 min at RT. Following a rinse three times in 1X TBS for 5 min, the sections were blocked in 5%NGS/1%BSA/TBS blocking solution for 1 h. Sections were then incubated in the primary antibody in the blocking solution overnight at 4°C on a shaker. The following day the sections were rinsed, followed by incubation with the appropriate secondary antibodies conjugated with Alexa Fluor 488 or 594 (1:500, Life Technology/Thermo Fisher Scientific, Waltham, MA). Following a rinse, the sections were incubated in Hoechst (1:5000 in 1X tris buffer saline (1X TBS), Thermo Fisher Scientific, Waltham, MA), rinsed again, then mounted on Superfrost Plus microscope slides (Thermo Fisher Scientific, Waltham, MA) and cover-slipped using Fluromount G. Some antibodies required antigen retrieval prior to the above protocol. When staining using C42, sections were first incubated in 90%formic acid at room temperature for 5 min, then rinsed once for 5 min in distilled water before staining as described above. When staining for SV40T and PCNA, sections were first incubated in 10 mM Sodium Citrate, pH 6.0, in a 95°C water bath for 10 min, then allowed to cool at room temperature for 20 min after which immunofluorescence staining procedure proceeded as described above. Images were taken on a Zeiss AxioCam M2 microscope (Carl Zeiss Inc., Thornwood, NY) and digitized using the ZEN software (Carl Zeiss Inc., Thornwood, NY). Confocal images were captured using a Nikon Eclipse Ti inverted microscope on a Nikon A1R confocal, using NIS-Elements software (version 5.20.00, Nikon, Melville, NY, USA).
Stereological analysis
Aβ plaque load and cortical area measurements were quantified using unbiased stereology. The plaque load was measured on four matched coronal sections per animal, ranging from anteroposterior position Bregma –1.06 to –3.16 mm [59]. Cortical plaque load was measured by identifying the area covered by C42 stained extracellular plaques using the Area Fractionator Probe within the Stereo Investigator software (MicroBrightField, Williston, VT,USA), similar to that described previously [58]. The parameters used were as follows: counting frame 250×250μm, sampling grid 400×400μm, and grid point spacing of 50μm. The area of the cortex was also quantified using the Cavalieri Estimator Probe within the procedures outlined above.
The Optical Fractionator Probe was used for cell quantification. To quantify the proportion of neuronal cells expressing SV40T or PCNA, one region matched section per animal was analyzed. To quantify CD45 + /Iba1, CD45 + /Iba1+, and PHF1 cells, three region matched coronal sections per animal ranging from anteroposterior position Bregma 1.06 to –3.16 mm were analyzed [59]. Both the cortex and hippocampus were assessed using the following parameters: for CD45 quantification: counting frame 400×400μm, sampling grid 800×800μm; for PHF1 quantification: counting frame 200×200μm, sampling grid 400×400μm. Results were reported as estimated cell population per mm3. Each section analyzed was used as a data point, as done previously [58].
ImageJ analysis
ImageJ was used to quantify cortical area fraction covered by GFAP signal. This analysis was performed on the same four matched coronal sections used for cortical Aβ plaque load quantification. To do so, images were converted to 8-bit grey scale, and threshold was appropriately adjusted to minimize artifact and background. Threshold intensity was adjusted similarly for all sections across groups and ages. These images were then made binary. The whole cortex of each section image was outlined, and area fraction of the cortex occupied by GFAP was quantified.
Immunohistochemistry
Sections were rinsed three times in 1X TBS for 15 min. This was followed by permeabilization in a 3%H2O2/0.3%Triton-x100/1X TBS solution for 30 min at RT. Following a rinse three times in 1X TBS for 5 min, the sections were blocked in 5%NGS/1%BSA/TBS blocking solution for 1 h. Sections were then incubated in the primary antibody in the blocking solution overnight at 4°C on a shaker. The following day, the sections were rinsed in 0.015%Triton-x100/1X TBS solution followed by two rinses in 1X TBS for 15 min at RT. The sections were then incubated with goat anti-mouse biotin conjugated secondary antibody (1:500; Southern Biotechnology, Birmingham, AL, USA) for 2 h at RT. Next, sections were rinsed one time in 0.015%Triton-x100/1X TBS solution followed by two rinses in 1X TBS for 15 min. Sections were then incubated in VECTASTAIN® Elite® ABC HRP solution (Vector Laboratories, Burlingame, CA, USA) for 1 h. Following four rinses in 1XTBS for 10 min, sections were incubated in Pierce™ DAB Substrate solution (Thermo Fisher Scientific, Waltham, MA), which was prepared following manufacturer instructions. Tissue incubation times varied depending on the antibody reaction and background development. Finally, tissue was rinsed twice in 1X TBS for 10 min, mounted on Superfrost Plus microscope slides (Thermo Fisher Scientific, Waltham, MA), and left to air dry overnight. The next day, slides were incubated in xylenes for 2 min and cover-slipped using Permount (Thermo Fisher Scientific, Waltham, MA). Brightfield images were captured on a Zeiss AxioCam M2 microscope (Carl Zeiss Inc., Thornwood, NY) using a 63X objective and digitized using the ZEN software (Carl Zeiss Inc., Thornwood, NY).
Nissl staining
Sections were permeabilized using 0.3%triton-x100 in TBS for 30 min at RT. Next, the sections were rinsed three times in 1X TBS for 10 min each, followed by incubation in NeuroTrace® Nissl solution (1:500 dilution) for 20 min in the dark. Following three subsequent rinses in 1X TBS for 10 min the sections were mounted on Superfrost Plus microscope slides (Thermo Fisher Scientific, Waltham, MA) and cover-slipped using Fluromount G.
TUNEL staining
Sections were permeabilized using 0.3%Triton-x100 in TBS for 45 min at RT, rinsed 3 times in PBS, then mounted on Superfrost Plus microscope slides (Thermo Fisher Scientific, Waltham, MA). TUNEL reaction mixture was prepared following manufacturer instructions (#11684795910, Millipore, Billerica, MA, USA). Next, 50μl of solution was put on each sample and the slide was left to incubate in a humidified atmosphere for 60 min at 37°C in the dark. Following this, the slides were rinsed 3 times in 1X PBS then cover-slipped.
Fluro-Jade C staining
Sections were mounted on Superfrost Plus microscope slides (Thermo Fisher Scientific, Waltham, MA) and then let dry at 50°C for 1 h. The slide was allowed to return to room temperature before being immersed in basic alcohol (1%NaOH in 80%ethanol) for 5 min, followed by 2 min in 70%alcohol. Next, the slides were rinsed once in distilled water and left to dry at 45°C for 10 min before being left to return to room temperature. Next, the slides were immersed in KMnO4 for 15 min, followed by 4 rinses in distilled water for 1 min. Following this, 0.0002%Fluro-Jade C solution was made using manufacturer’s instructions, and slides were immersed in this solution for 20 min in the dark. The slides were rinsed in distilled water 4 times for 1 min and then left to dry, at room temperature, in the dark overnight. The following day the slides were cleared 3 times in xylenes for 1 min and cover-slipped using DPX mounting medium. The number of Fluro-Jade C cells was then quantified similar to that previously described [60]. Briefly, Fluro-Jade positive somas were manually counted within a 20x objective field of view consistent across animals. This was done for two sections per animal and reported as cells per mm2.
DAPI fluorescence intensity analysis
Zeiss ZEN (blue edition, 2.6) software (Carl Zeiss, Jena, Germany) was utilized to measure the fluorescence intensities of DAPI signal in individual cell nuclei. This analysis was performed on brain sections immunolabeled with either SV40T/NeuN/DAPI or PCNA/NeuN/DAPI. DAPI fluorescence intensities were measured for SV40T+/NeuN+ and SV40T-/NeuN+cells, or PCNA+/NeuN+and PCNA-/NeuN+cells in the same sections. Only cells which were in focus and not overlapping other cells were measured. The whole nucleus of the cell was outlined, and the mean intensity of DAPI fluorescence signal was quantified.
Statistical analysis
The two-ANOVA was used on data sets, followed by a post-hoc Tukey’s multiple comparisons test. For DAPI intensity data, two-tailed Mann-Whitney U test was used since the variance between the two groups were statistically different. All statistical tests were performed using Prism 9 for Mac OS (GraphPad Software Inc., San Diego, CA, USA). Statistical significance was set at p < 0.05. The sample size for each test is reported in the figure legend.
RESULTS
SV40T induced neuronal cell cycle re-entry enhances PHF-1 phospho-tau lesion and neurodegeneration in AppNLF mice
To examine the effect of forced neuronal cell cycle induction on mice expressing humanized Aβ plaques from endogenous AβPP, we crossed our NCCR mice with AppNLF KI mice to generate NCCR-AppNLF homozygous KI mice. As anticipated, conditional expression of SV40T is restricted to neuronal population in our NCCR-AppNLF KI mice. Our double immunofluorescence labeling in the cortex showed SV40T and NeuN co-labeling, demonstrating SV40T expression restricted to neurons in NCCR-AppNLF mice (Fig. 1A). Neuronal cell cycle re-entry in these animals was confirmed using proliferating cell nuclear antigen (PCNA) antibody. PCNA and NeuN double immunofluorescence labeling shows co-labeling in NCCR-AppNLF mice, while no such co-staining was observed in AppNLF mice (Fig. 1B). Quantification of brain samples from 12-month-old NCCR-AppNLF animals showed that approximately 1%and 2%of NeuN-positive cortical neurons are co-labeled for SV40T and PCNA, respectively (Fig. 1C). The proportion of neurons showing the cell cycle marker in NCCR- AppNLF animals is comparable to that observed in the postmortem AD brains [14, 21]. However, the absence of PCNA labeled NeuN-positive neurons in the AppNLF mice is in disagreement with findings demonstrating that Aβ is sufficient for inducing neuronal cell cycle re-entry (Fig. 1C) [61, 62].
Fig. 1
SV40T expression induces cell cycle re-entry in AppNLF KI mice. A) Representative images from the primary somatosensory areas of the cortex stained with SV40T (red), NeuN (green), and DAPI (blue). Expression of SV40T is restricted to neurons in 9, 12, and 18-month-old NCCR-AppNLF mice, as seen by co-localization of SV40T with NeuN and DAPI. No SV40T staining was detected in AppNLF animals. B) Representative cortical images of PCNA (red), NeuN (green), and DAPI (blue). NCCR-AppNLF mice display neuronal cell cycle reentry at 9, 12, and 18 months of age, shown through co-localization of PCNA, NeuN, and DAPI. No neuronal PNCA staining was detected in AppNLF animals. C) Quantification of percentage of cortical NeuN-positive neurons expressing SV40T (left) and PCNA (right). N = 5 animals per group. Scale bar 10μm
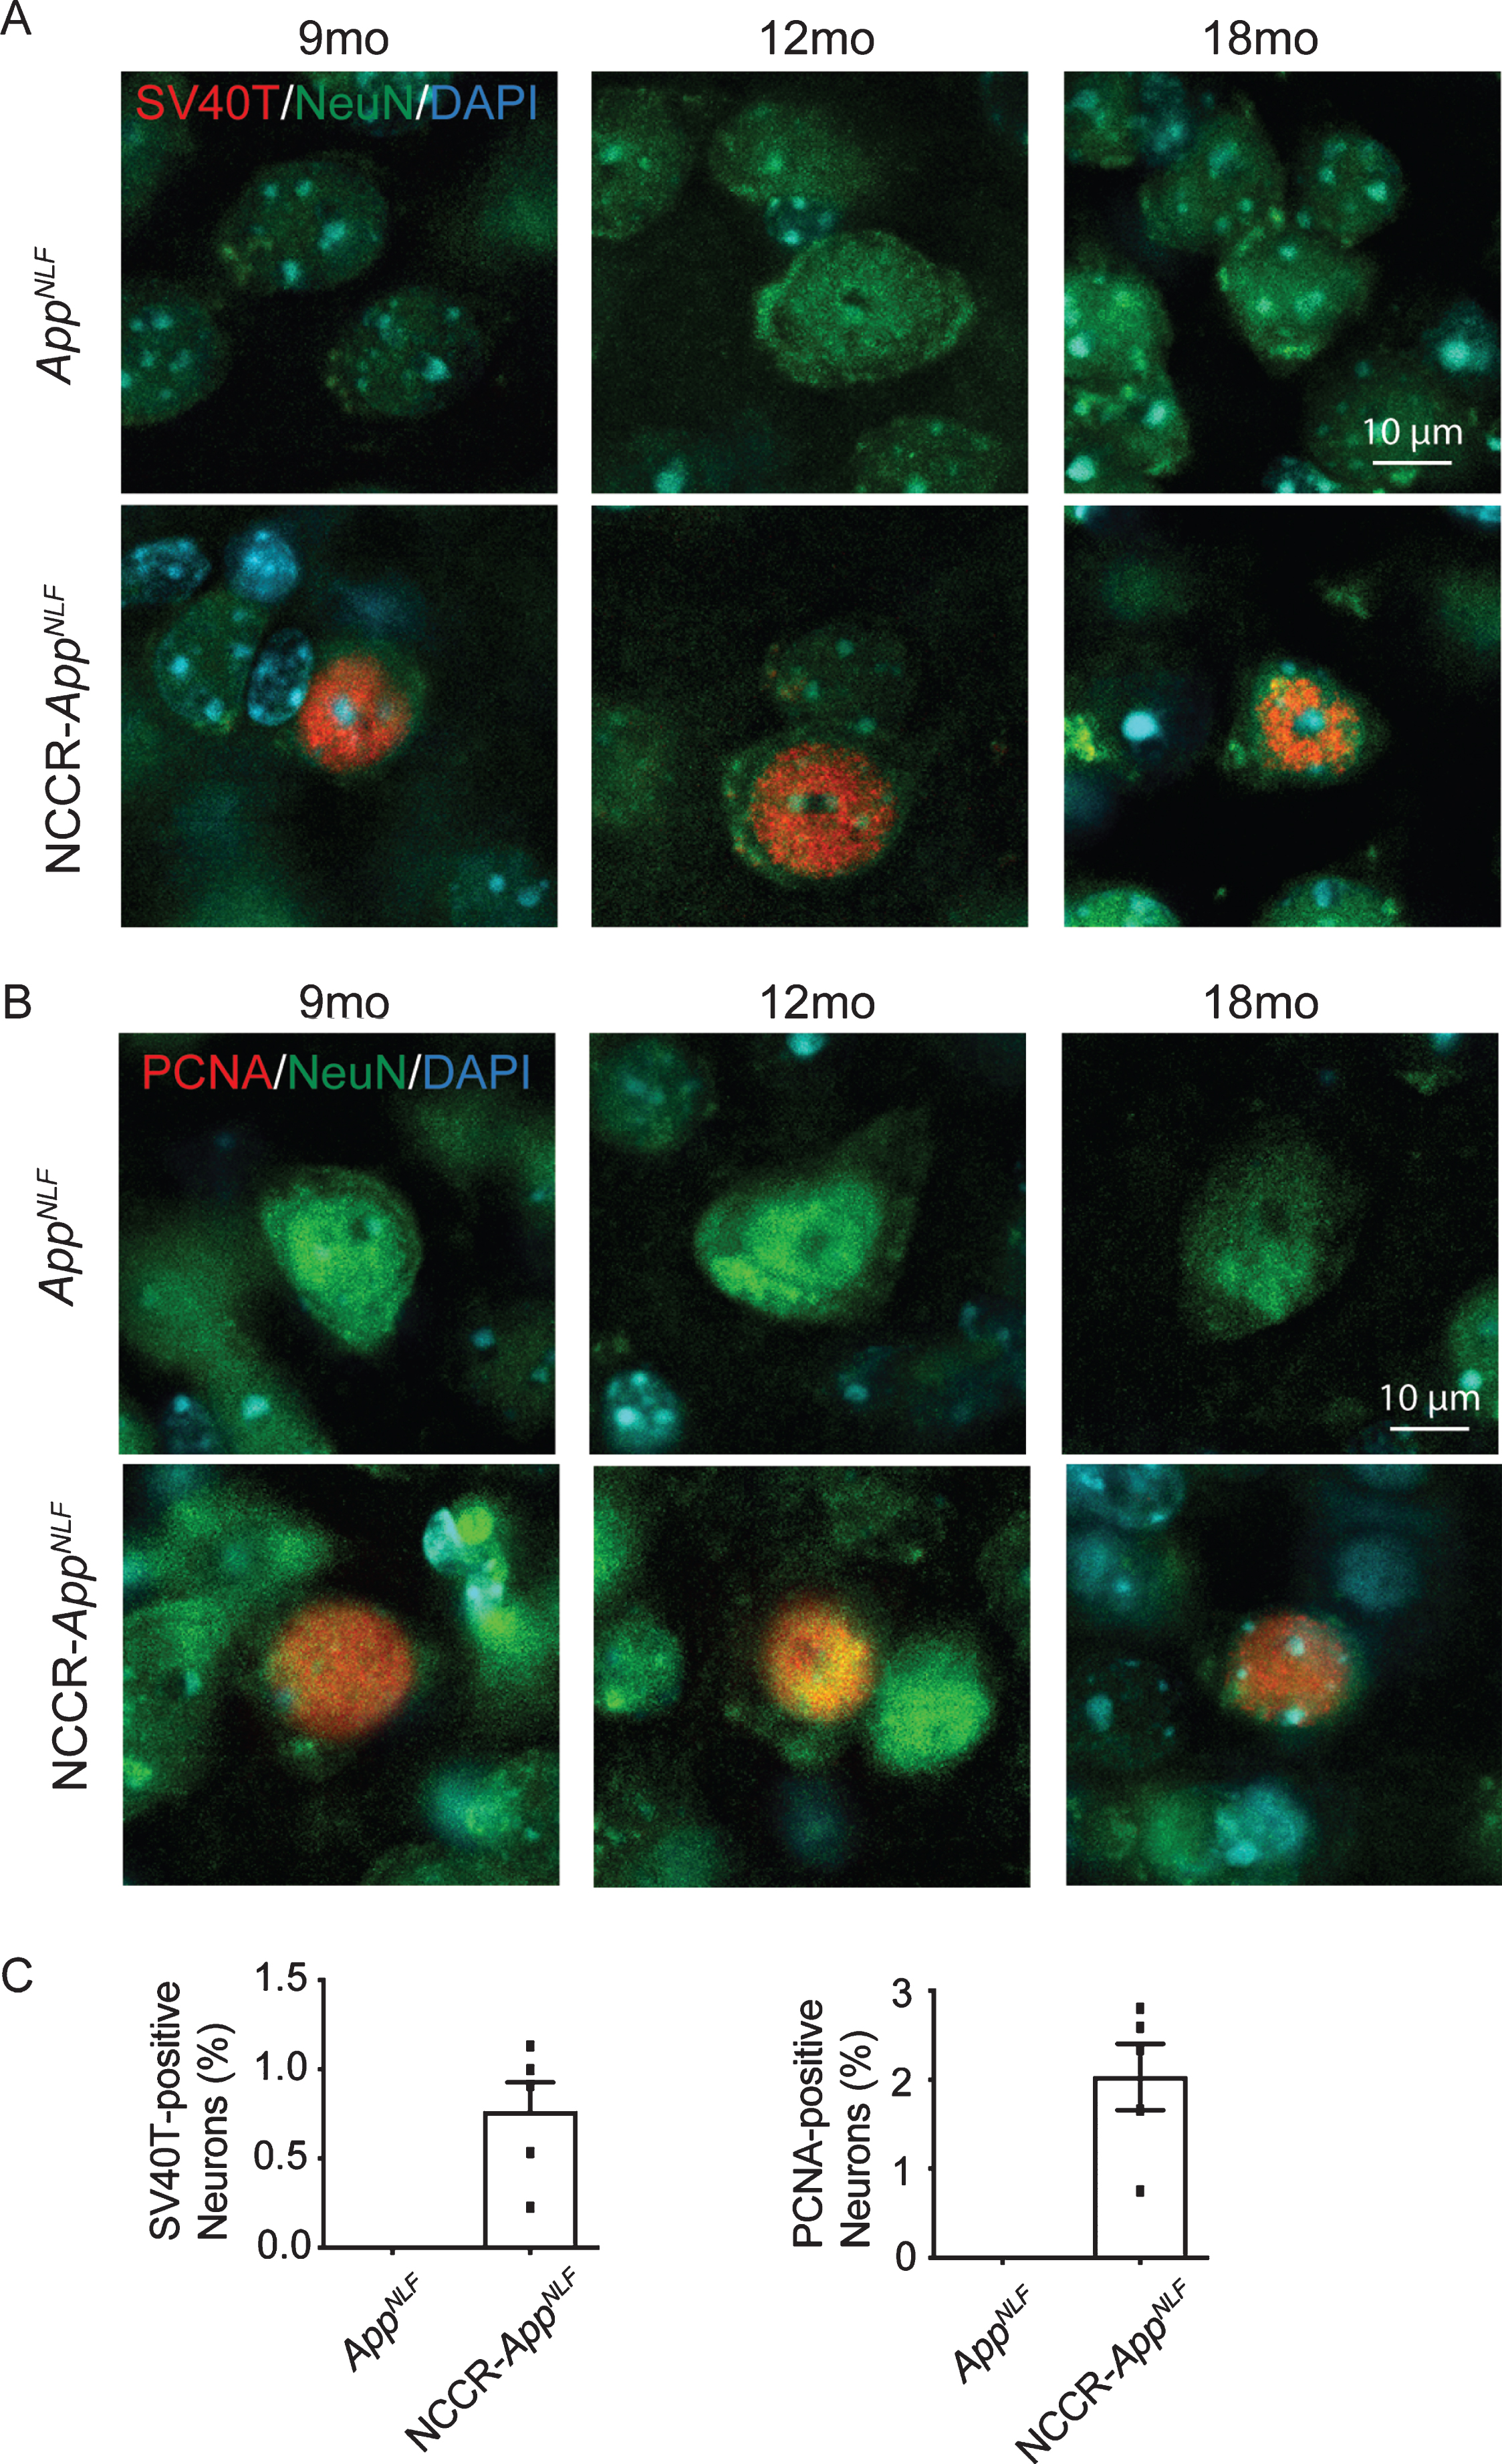
It has been shown that SV40T expression in primary cortical neurons in culture induces hyperploidy [49]. We measured DAPI intensities in SV40T+/NeuN+ and PCNA+/NeuN+ cells and compared them to DAPI intensities measured in SV40 T-/NeuN+ and PCNA-/NeuN+ cells in the cortex for NCCR-AppNLF animals, respectively, from same brain sections immunolabeled with either SV40T/NeuN/DAPI or PCNA/NeuN/DAPI corresponding to the three different ages examined (Supplementary Figure 1). DAPI intensities were increased in SV40T+/NeuN+ cells (Supplementary Figure 1A; +47.7%, two-tailed Mann-Whitney U, p = 0.0004) and PCNA+/NeuN+ cells (Supplementary Figure 1B; +43.8%, two-tailed Mann-Whitney U, p = 0.0263) compared to SV40T-/NeuN+ and PCNA-/NeuN+ cells, respectively. The PCNA expression in the NCCR animals are mediated by SV40T expression [37]. Similar amount of increase in DAPI intensities from independently stained targets suggest increased nuclear DNA content with neuronal cell cycle re-entry.
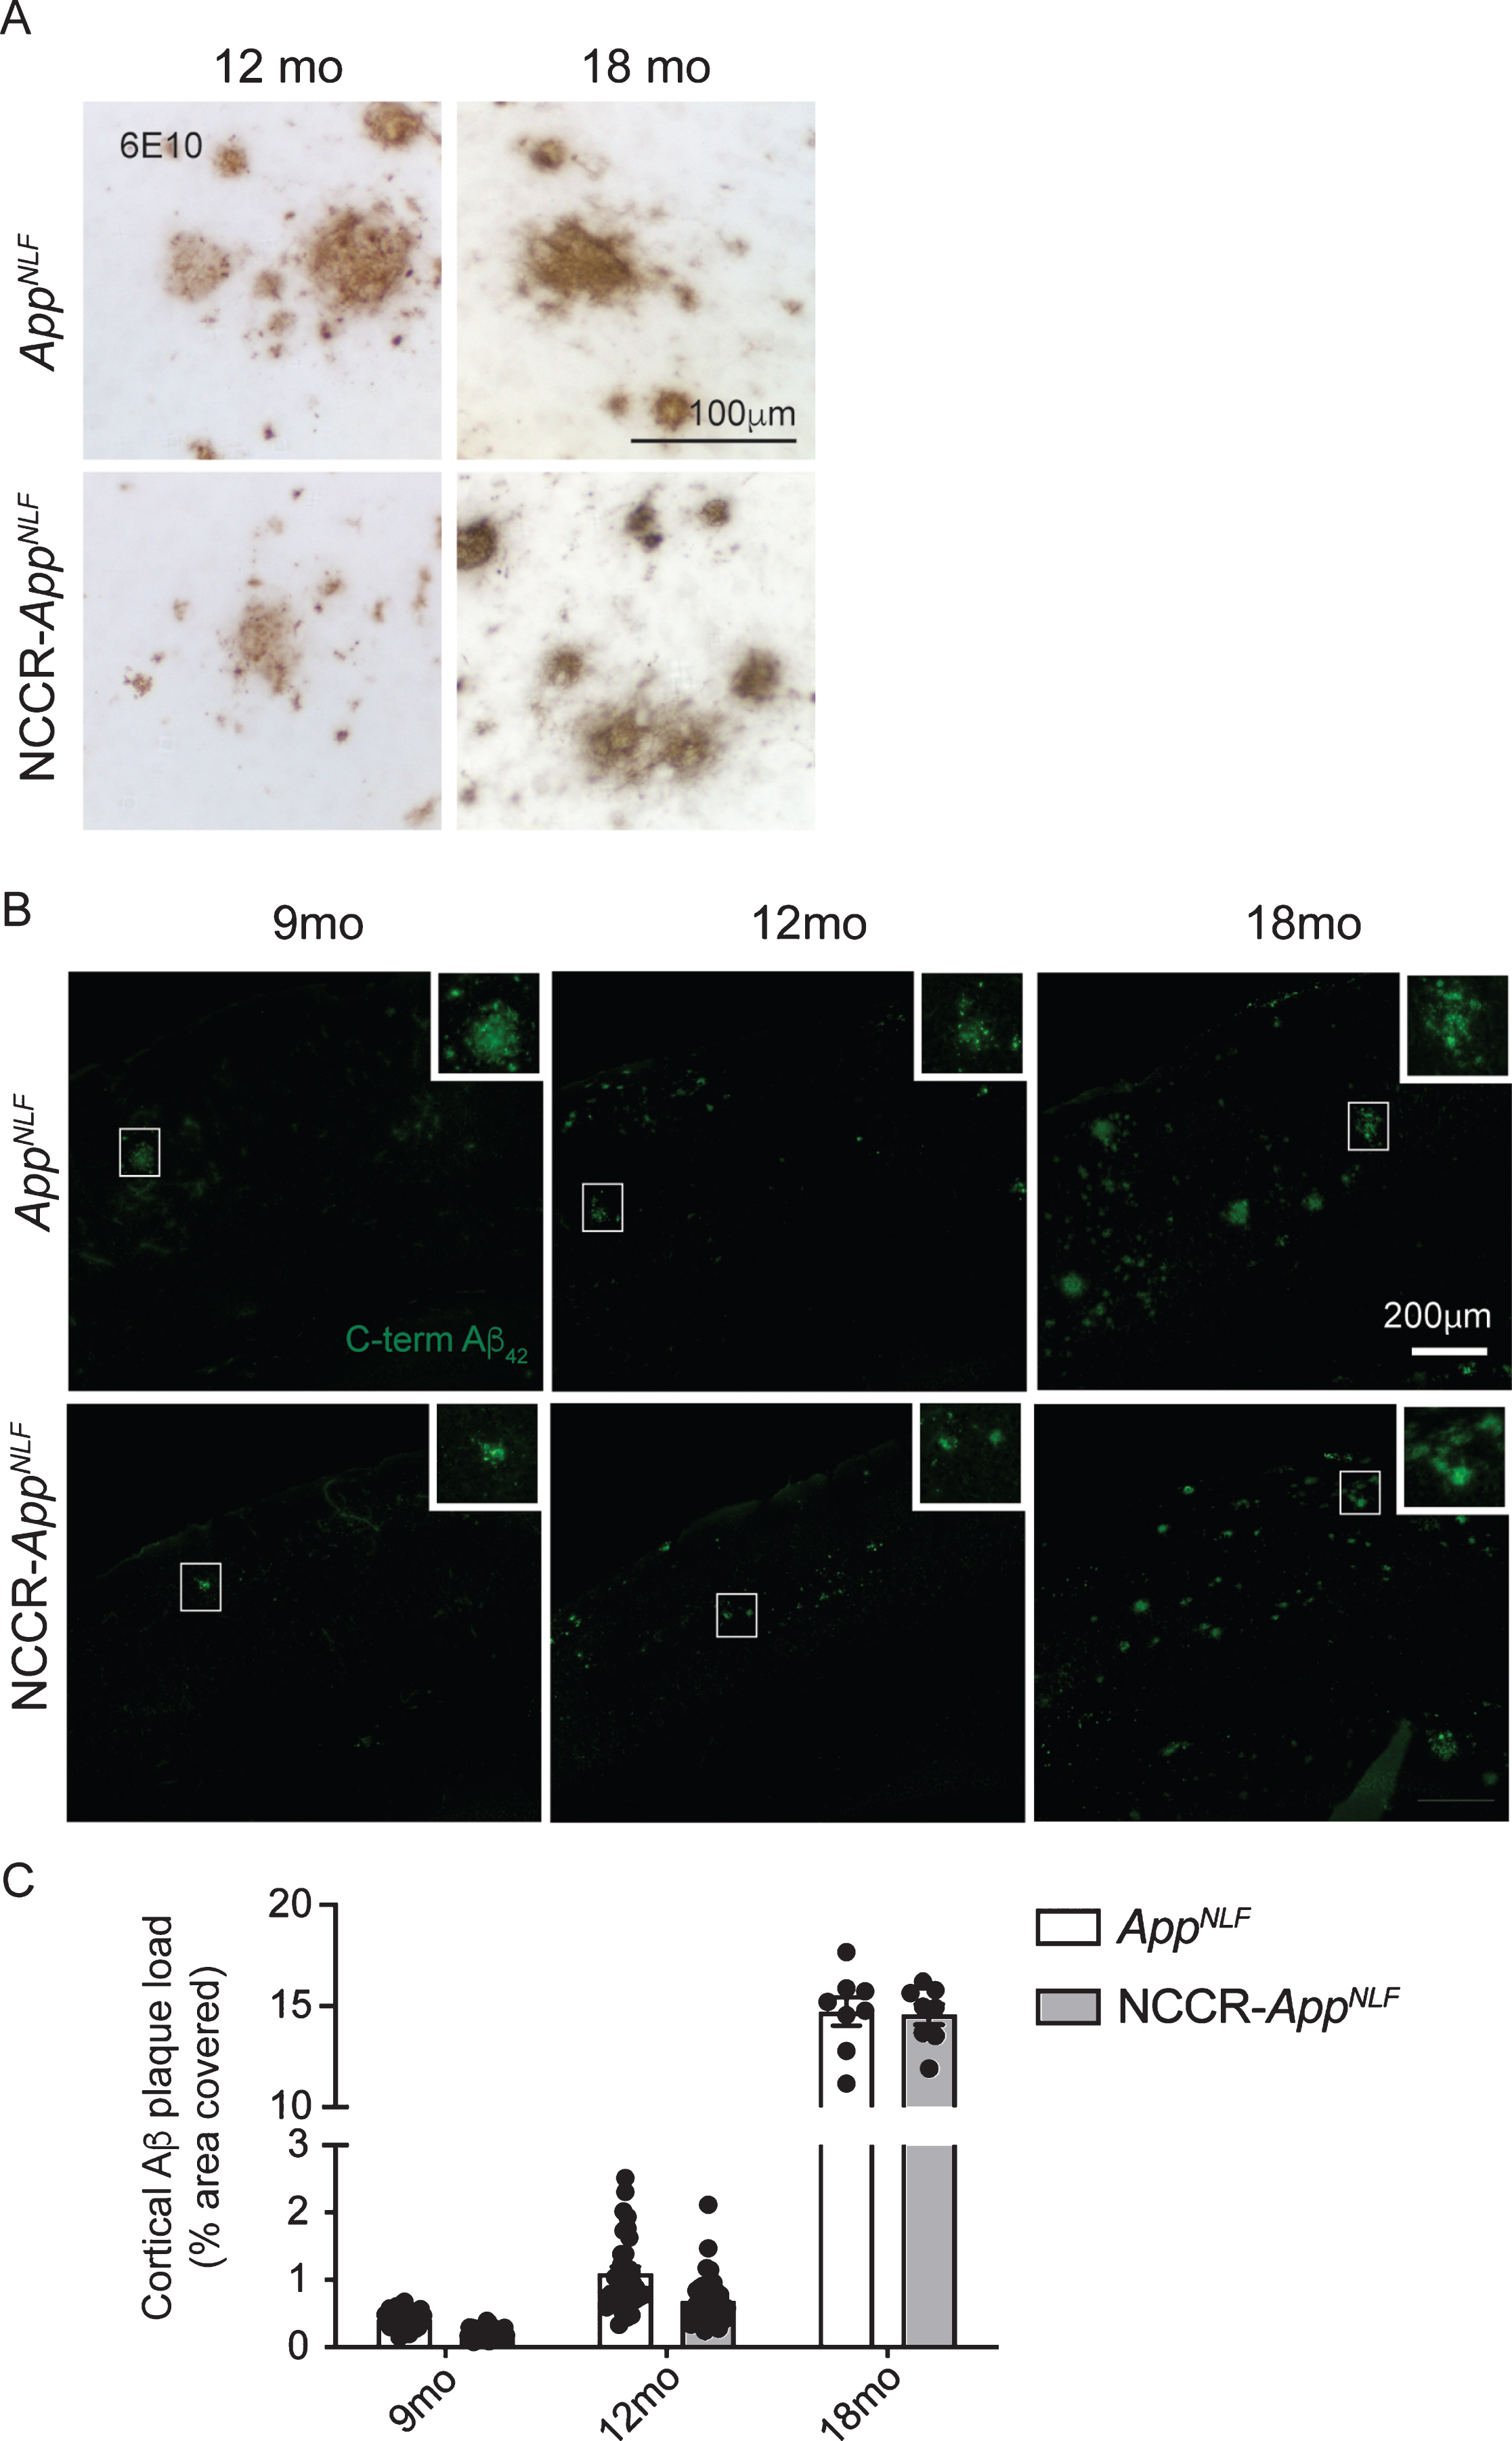
Aβ deposition is a key pathological hallmark of AD. AppNLF mice display progressive Aβ plaque formation beginning around 6 months of age [51]. As anticipated, we observed a progressive increase in humanized Aβ plaque deposition in NCCR-AppNLF and AppNLF mice using the 6E10 Aβ antibody (aa 1–17) (Supplementary Figure 2). Aβ plaques between these two types of animals were qualitatively similar (Fig. 2A). To investigate the effect of neuronal cell cycle re-entry on Aβ plaque formation in an AD mouse model, we quantified the cortical Aβ plaque load detected using a C-terminal Aβ42 antibody in brain sections from 9-, 12-, and 18-month-old NCCR-AppNLF mice (Fig. 2B). A significant age effect was observed (Fig. 2C, two-way ANOVA, F (2, 140) = 3,437, p < 0.0001) while the genotype effect did not reach significance (Fig. 2C, two-way ANOVA, F (1, 140) = 3.637, p = 0.0586). The data suggests that the NCCR does not enhance Aβ plaque deposition in the AppNLF animals.
Fig. 2
Aβ plaque load in AppNLF KI mice is not altered by neuronal cell cycle re-entry. A) DAB stained Immunohistochemical (6E10 antibody) image showing Aβ deposition in the primary somatosensory areas of cortex in AppNLF KI and NCCR-AppNLF KI mice. Scale bar 100μm. B) Representative immunofluorescence images of C-terminal Aβ42 antibody-positive Aβ plaque staining in the primary somatosensory areas of cortex in AppNLF and NCCR-AppNLF mice at 9, 12, and 18 months of age used for Aβ plaque load analysis. Insert is a magnified image of the region inside the white square. Cortical areas covered by C-terminal Aβ42 positive extracellular signals were quantified in four matched coronal brain sections from each perfusion fixed animals using the Area Fraction Fractionator probe (Stereoinvestigator, MBF). Scale bar 200μm. C) Two-way ANOVA showed significant age effect (F (2, 140) = 3437, p < 0.0001) but no difference between genotypes (F (1, 140) = 3.637, p = 0.0586), 9 months: n = 8/group; 12 months: n = 8-9/group; 18 months: n = 2/group. Bars represent mean±SEM.
Tau pathology is a key pathological hallmark of AD [63, 64]. NCCR mice display endogenous tau pathology in the absence of tau mutations [25, 37]. PHF-1 antibody is a common marker for pathological tau phosphorylated at Ser 396/404 that is observed early in disease [65–68]. NCCR-AppNLF mice showed a substantial increase in PHF-1 phospho-tau lesions in the hippocampus and cortex at 18 months of age (Supplementary Figure 3A). At 12 months of age, we observed some PHF-1 phospho-tau lesions in the hippocampus of NCCR- AppNLF mice (Supplementary Figure 3B) but not much in the cortex (Fig. 3A). Using unbiased stereology, we quantified the number of PHF-1 phospho-tau lesioned cells in cortical sections of 12- and 18-month-old NCCR-AppNLF and AppNLF mice (Fig. 3A). Comparisons of the number of PHF-1 phospho-tau lesioned cells showed a significant age effect (two-way ANOVA, F (1, 32) = 15.06, p = 0.0005), genotype effect (two-way ANOVA, F (1, 32) = 21.97, p < 0.0001), and interaction effect (two-way ANOVA, F (1, 32) = 15.58, p = 0.0004) (Fig. 3B). Post-hoc pairwise analysis revealed a significant increase in the number of PHF-1 phospho-tau lesioned cells in 18-month-old NCCR-AppNLF mice compared to all other genotypes and ages (Fig. 3B).
Fig. 3
Aged NCCR-AppNLF mice show increased cortical tau lesions and atrophy. A) Representative cortical images of PHF-1 immuno-labeled DAB stained sections from primary somatosensory areas. At 12 months of age, no discernible PHF-1 phospho-tau lesions was observed in the cortex of either genotypes. On the other hand, at 18 months of age, increase in PHF-1 phospho-tau lesions (arrows) were detected in the cortex (CTX) of NCCR-AppNLF animals compared to 18-month-old AppNLF mice. B) Quantification of cortical cells with PHF-1 phospho-tau accumulation show statistically significant increase at 18 months of age for NCCR-AppNLF animals. Two-way ANOVA shows significant age effect (F(1, 32) = 15.06, p = 0.0005), genotype effect (F(1, 31) = 21.97, p < 0.0001), and interaction effect (F(1, 31) = 15.58, p = 0.0004). Tukey’s multiple comparison test demonstrates statistically significant increase in 18-month-old NCCR-AppNLF animals compared to other groups. The following numbers of animals were examined; at 12 months of age: NCCR-AppNLF, n = 4; AppNLF, n = 4‐ at 18 months of age: NCCR-AppNLF, n = 2; AppNLF, n = 2. Four matched coronal sections were measured across the animals and each data point represents a measure from each section. C) Fluorescent Nissl (NeuroTrace) showing anatomically matched coronal sections (white arrows) from 9-, 12-, and 18-month-old AppNLF and NCCR-AppNLF animals. The NeuroTrace stained image shows cortical thinning (yellow dashed lines) in the 18-month-old NCCR-AppNLF mice. D) Measurements of cortical areas as shown by blue dashed lines in (C) was analyzed using Stereo Investigator. Two-way ANOVA showed significant age effect (F(2, 140) = 6.69, p = 0.0017), genotype effect (F(1, 140) = 53.13, p < 0.0001), and interaction effect (F(2, 140) = 5.164, p = 0.0068). Tukey’s multiple comparison test shows an age-dependent loss of cortical area in the NCCR-AppNLF but not in the AppNLF animals. NCCR-AppNLF cortical areas are smaller than age-matched AppNLF animals at all ages compared. Furthermore, the statistically significant decrease in the cortical area is observed in NCCR-AppNLF animals at 18 months of age compared to either 9 or 12 months of age (&9 months versus #18 months, p < 0.0001; &12 months versus #18 months, p = 0.0002). Following numbers of animals were examined; 9 months: n = 8/genotype; 12 months: n = 8/genotype; 18 months: n = 2/genotype. Four matched coronal sections were measured across the animals. Each data point represents a measure from each section.
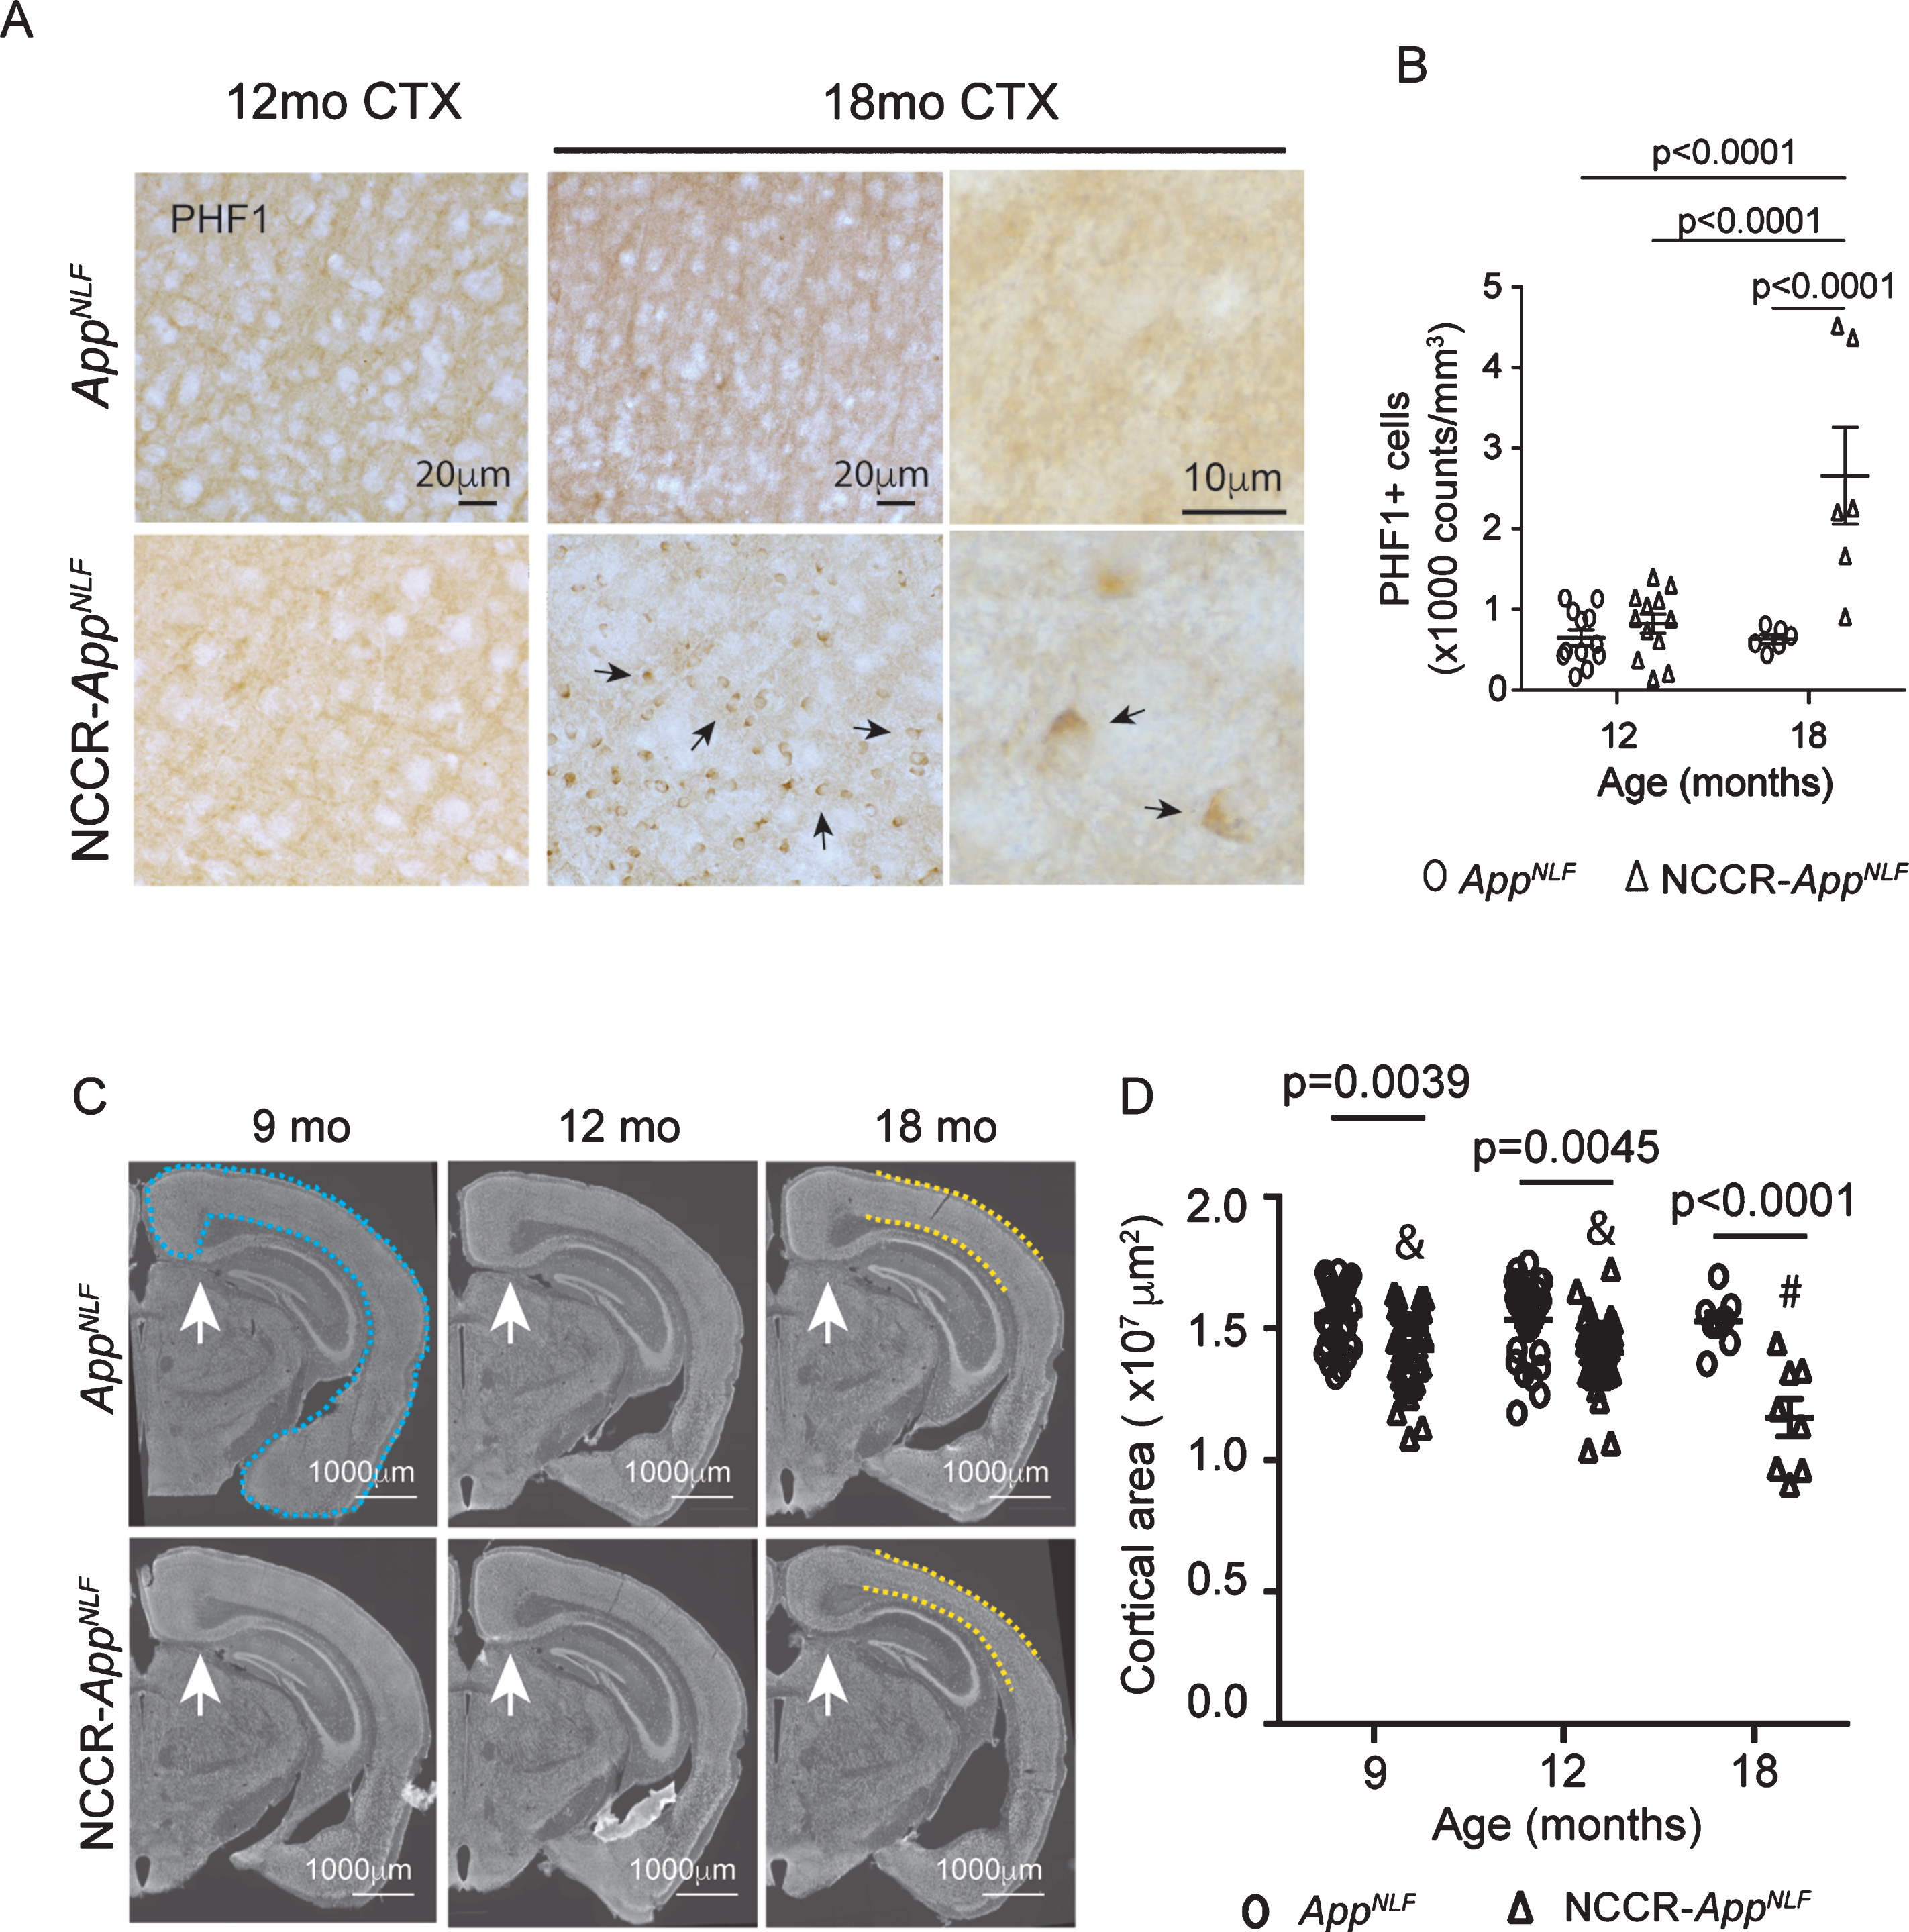
It has been shown that tau pathology is strongly correlated with neurodegeneration in AD [69]. To assess whether neurodegeneration is increased in the NCCR-AppNLF animals, we measured the cortical areas in fluorescent Nissl-stained region-matched brain sections from 9-, 12-, and 18-month-old animals (Fig. 3C). Comparison of cortical areas showed a significant age effect (two-way ANOVA, F (2, 140) = 6.69, p = 0.0017), genotype effect (two-way ANOVA, F (1, 140) = 53.13, p < 0.0001), and interaction effect (two-way ANOVA, F (2,140)=5.164, p = 0.0068) (Fig. 3D). Pairwise comparisons showed greater cortical atrophy in NCCR-AppNLF animals compared to AppNLF animals at each time point (NCCR-AppNLF versus AppNLF: 9 months, –8.4%; 12 months, –8.2%; 18 months, –24%). Additionally, pairwise comparisons show age-dependent cortical atrophy in the NCCR-AppNLF mice (9 months versus 12 months: –0.9%; 9 months versus 18 months: –18.2%; 12 months versus 18 months: –17.5%), but not in the AppNLF animals (9 months versus 12 months: –1.1%; 9 months versus 18 months: –1.5%; 12 months versus 18 months: –0.4%), at 9, 12, and 18 months of age, demonstrating that neuronal cell cycle re-entry results in progressive neurodegenerative phenotype in the AppNLF mice (Fig. 3B).
SV40T-mediated neuronal cell cycle re-entry enhances neuroinflammation in AppNLF mice
It is becoming increasingly clear that neuroinflammation plays a critical role in AD pathogenesis [70, 71]. In AD, neuroinflammation is characterized by activated microglia and astrocytes in the CNS. This activation of astrocyte and microglia can influence Aβ deposition, tau pathology, and neurodegeneration [72–75]. We previously showed that SV40T-mediated neuronal cell cycle induction in wild type mice results in chronic gliosis and enhanced microglial activation [37]. Therefore, we evaluated the effect of SV40T-mediated neuronal cell cycle re-entry on the neuroinflammation process in AppNLF mice.
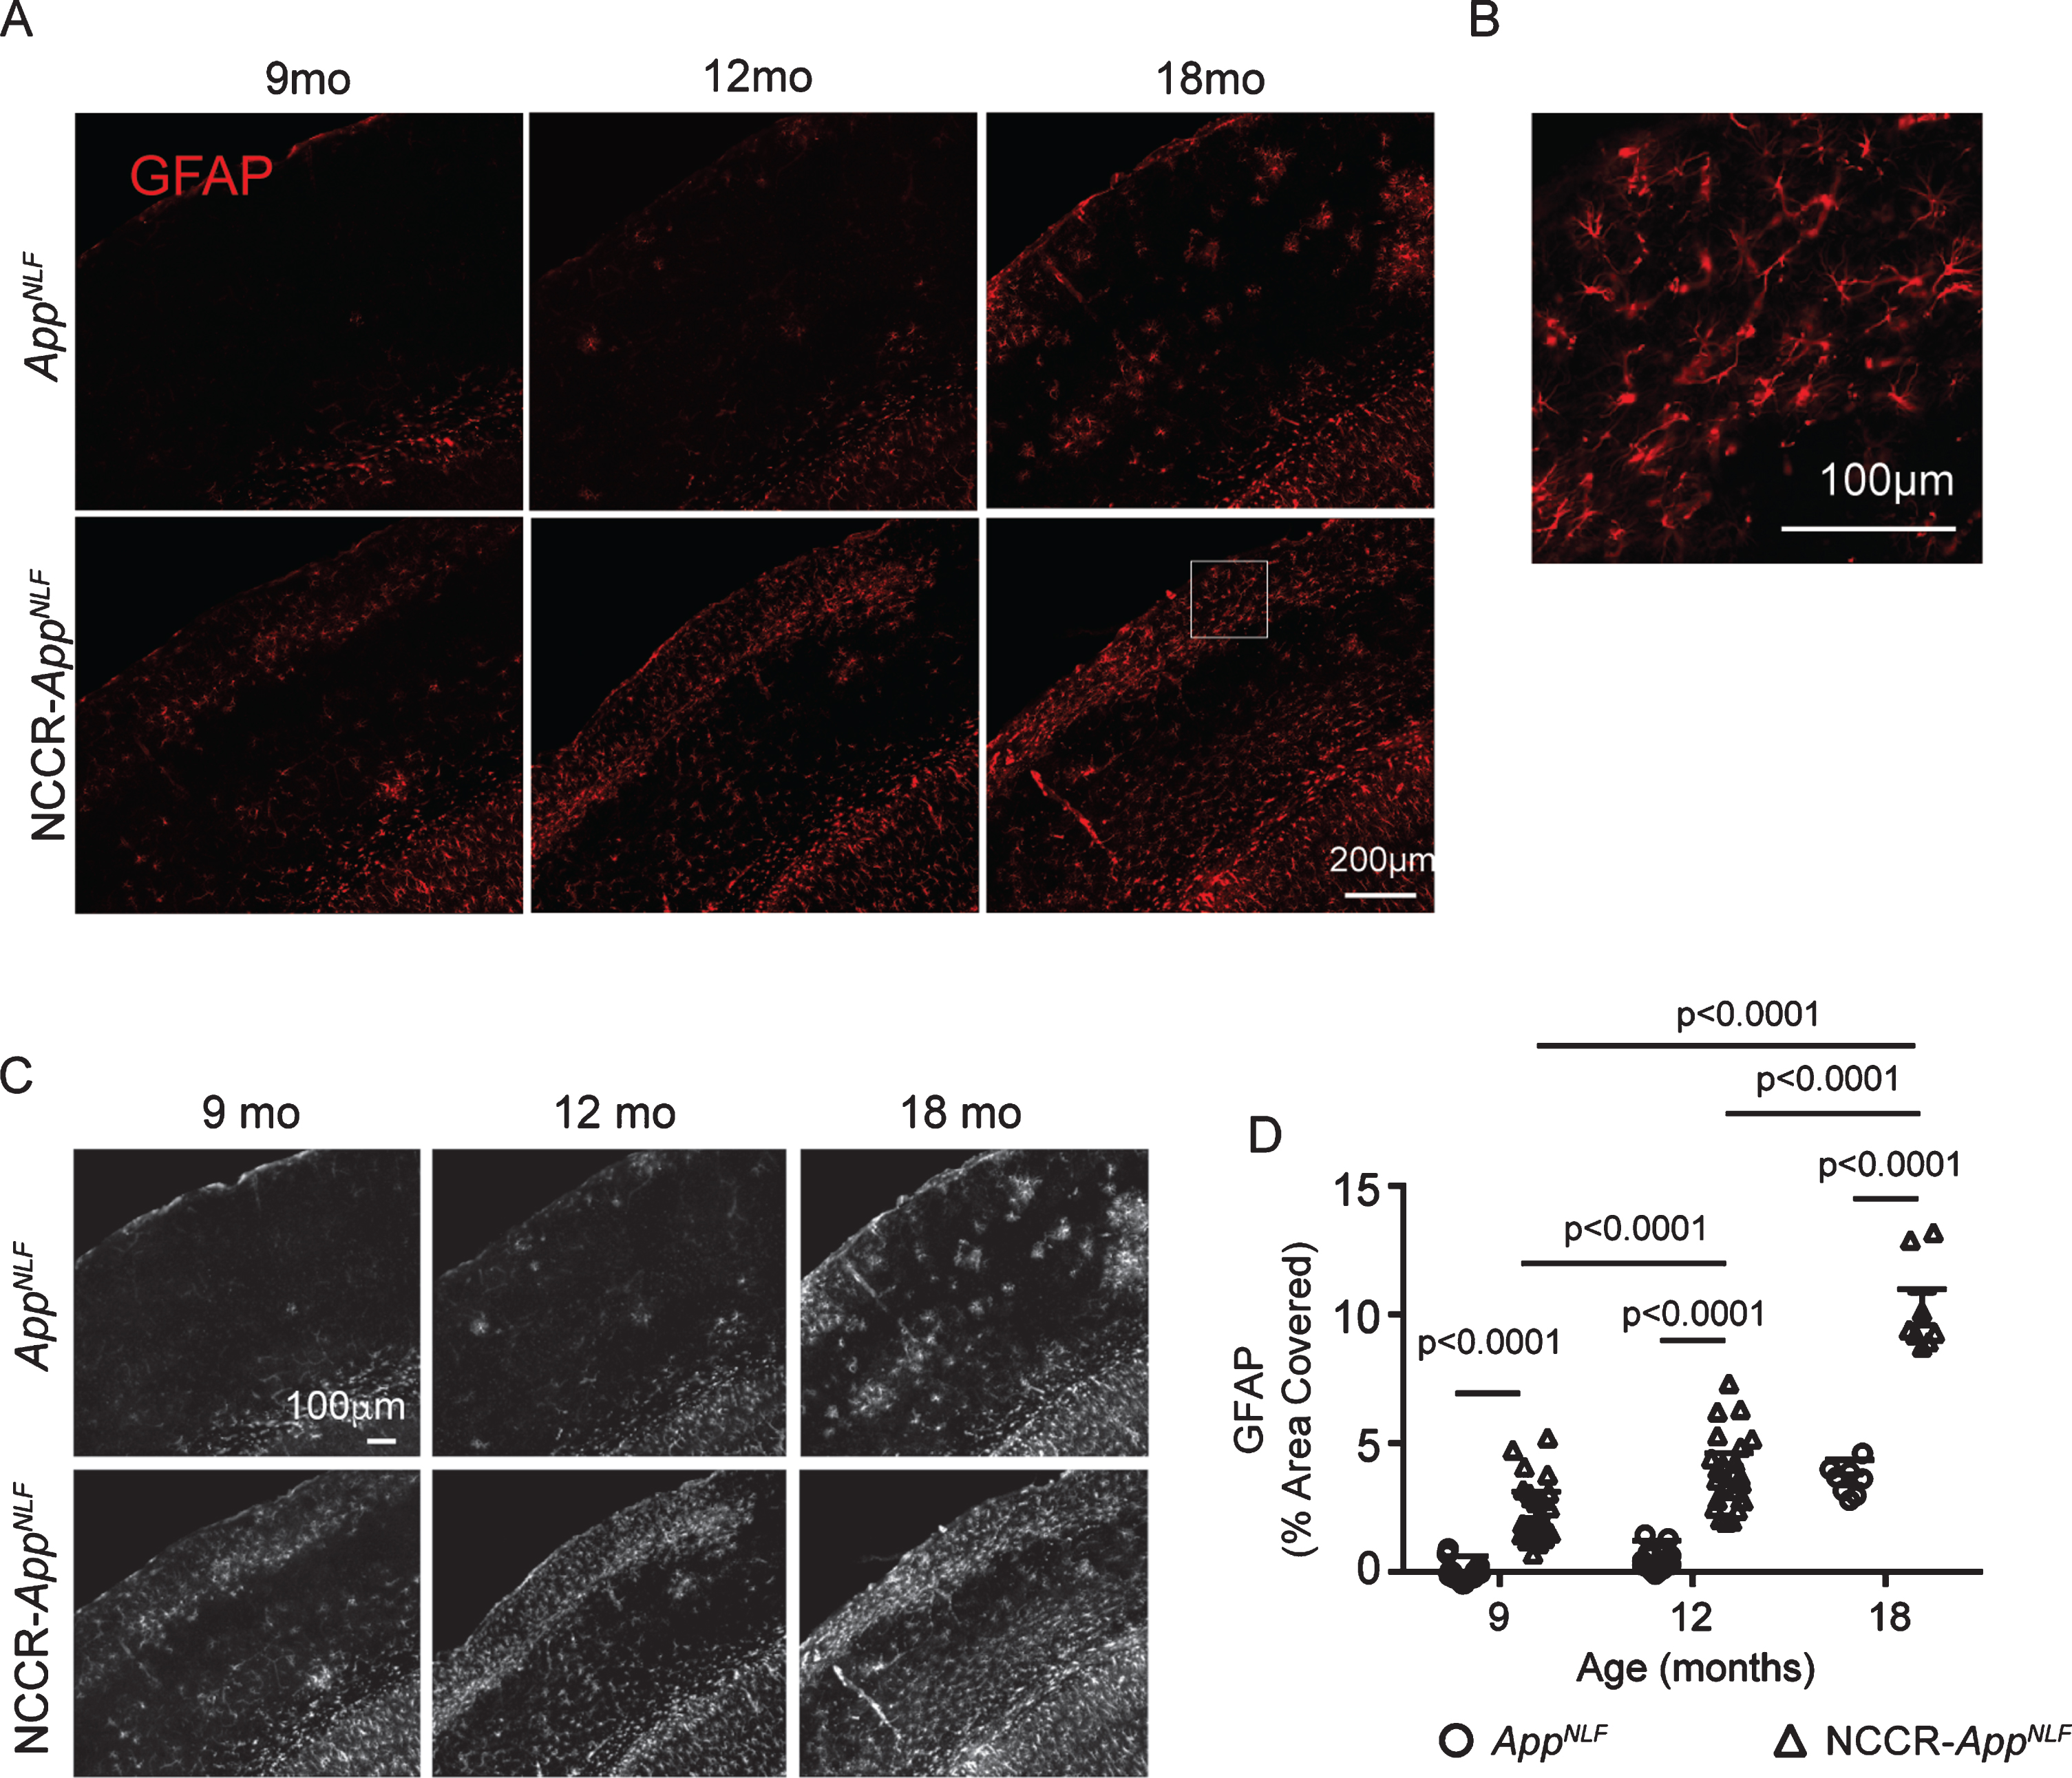
Reactive astrocytes are characterized by increased expression of glial fibrillary acidic protein (GFAP). Progressive increase in GFAP immunolabeling was observed in both NCCR-AppNLF and AppNLF animals (Fig. 4A, B). Analysis of grayscale images of GFAP immunofluorescence labeled brain sections from 9-, 12-, and 18-month-old NCCR-AppNLF and AppNLF animals (Fig. 4C) showed significant age effect (two-way ANOVA, F (2, 105) = 196, p < 0.0001), genotype effect (two-way ANOVA, F (1, 105) = 359.3, p < 0.0001), and interaction effect (two-way ANOVA, F (2, 105) = 24.68, p < 0.0001) in the percentage of cortical area covered by the GFAP signal (Fig. 4D). Post-hoc pairwise comparisons showed that cortical area covered by GFAP signal increases with age in the NCCR- AppNLF mice but not in the AppNLF mice (Fig. 4D). Furthermore, cortical GFAP immunoreactivity was increased in the NCCR-AppNLF animals compared to age-matched AppNLF animals at all ages examined (Fig. 4D).
Fig. 4
Neuronal cell cycle re-entry increases astrocytosis in AppNLF mice. A) Representative fluorescently labeled images of cortical areas (primary somatosensory region) stained using GFAP antibody. B) Magnification of white inset in (A) demonstrating astrocyte specific GFAP-labeling. C) Grayscale images of GFAP immunofluorescence labeled whole cortical regions in brain sections from 9‐, 12‐, and 18‐month-old NCCR‐AppNLF and AppNLF animals were evaluated using Image J. D) Two-way ANOVA shows significant age effect (F(2, 105) = 196, p < 0.0001), genotype effect (F(1, 105) = 359.3, p < 0.0001), and interaction effect (F(2, 105) = 24.68, p < 0.0001). GFAP immunoreactive cortical area is greater in the NCCR- AppNLF animals compared to age-matched AppNLF animals at all ages. Furthermore, NCCR-AppNLF animals show progressive increase with age (Tukey’s multiple comparison test, 9 months versus 12 months, p < 0.0001; 9 months versus 18 months, p < 0.0001; 12 months versus 18 months, p < 0.0001). Following numbers of animals were examined; at 9 months of age: NCCR-AppNLF, n = 4; AppNLF, n = 4‐ at 12 months of age: NCCR-AppNLF, n = 4; AppNLF, n = 4; at 18 months of age: NCCR-AppNLF, n = 2; AppNLF, n = 2. Four matched coronal sections were measured per animal. Each data point represents a measure from each section.
We previously showed that SV40T-mediated neuronal cell cycle induction in wild type mice also induces microglial activation [37]. CD45 is highly expressed in activated proinflammatory microglia that are identified as CD45 + /Iba1 + cells [76, 77]. CD45 immunolabeling was noticeably observed in the NCCR-AppNLF animals at all ages (Fig. 5A). Quantification of CD45 and Iba1 co-labeled cells in the cortex of 9-, 12-, and 18-month-old NCCR-AppNLF and AppNLF mice (Fig. 5B, arrowheads) showed significant age effect (two-way ANOVA, F(2, 53) = 35.74, p < 0.0001), genotype effect (two-way ANOVA, F (1, 53) = 38.11, p < 0.0001), and interaction effect (two-way ANOVA, F (2, 53) = 7.052, p < 0.0019) (Fig. 5C). Post-hoc pairwise comparisons showed a significant increase in the number of CD45-positive microglia in 12- and 18-month-old NCCR-AppNLF mice compared to age-matched AppNLF mice (Fig. 5C).
Fig. 5
Neuronal cell cycle re-entry increases neuroinflammation in AppNLF mice. A) Representative fluorescently labeled cortical images (primary somatosensory region) showing Iba1 (green), CD45 (red), and DAPI (blue) showing increased CD45 labeling in the NCCR-AppNLF animals at 9, 12, and 18 months of age. B) Higher magnification images of CD45 (red), Iba1 (green), and DAPI (blue) immunofluorescent labeled brain sections from NCCR-AppNLF and AppNLF animals. Leukocytes were identified by donut-shaped CD45 stains not co-localized with Iba1 labeling in the cortex (arrows). Activated microglia were identified by Iba1 stained cells co-labeled with CD45 (arrowheads). C) Two-way ANOVA showed significant age effect (F(2, 53) = 35.74, p < 0.0001), genotype effect (F(1, 53) = 38.11, p < 0.0001), and interaction effect (F(2, 53) = 7.052, p < 0.0019) on CD45-positive microglia counts. Number of CD45/Iba1 co-labeled cells were increased in NCCR-AppNLF mice compared to AppNLF mice at 12 and 18 months of age, suggesting enhanced neuroinflammation (Tukey’s multiple comparison test). D) Two-way ANOVA showed significant genotype effect (F(1, 53) = 39.34, p < 0.0001) on CD45-postive, Iba1-negative cells. Brain leukocyte infiltration is observed in 9-, 12-, and 18-month-old NCCR-AppNLF animals (Tukey’s multiple comparison test). The following numbers of animals were examined: 9 months: n = 4/genotype; 12 months: n = 4/genotype; 18 months: n = 2/genotype. Four matched coronal sections were measured across the animals. Each data point represents a measure from each section.
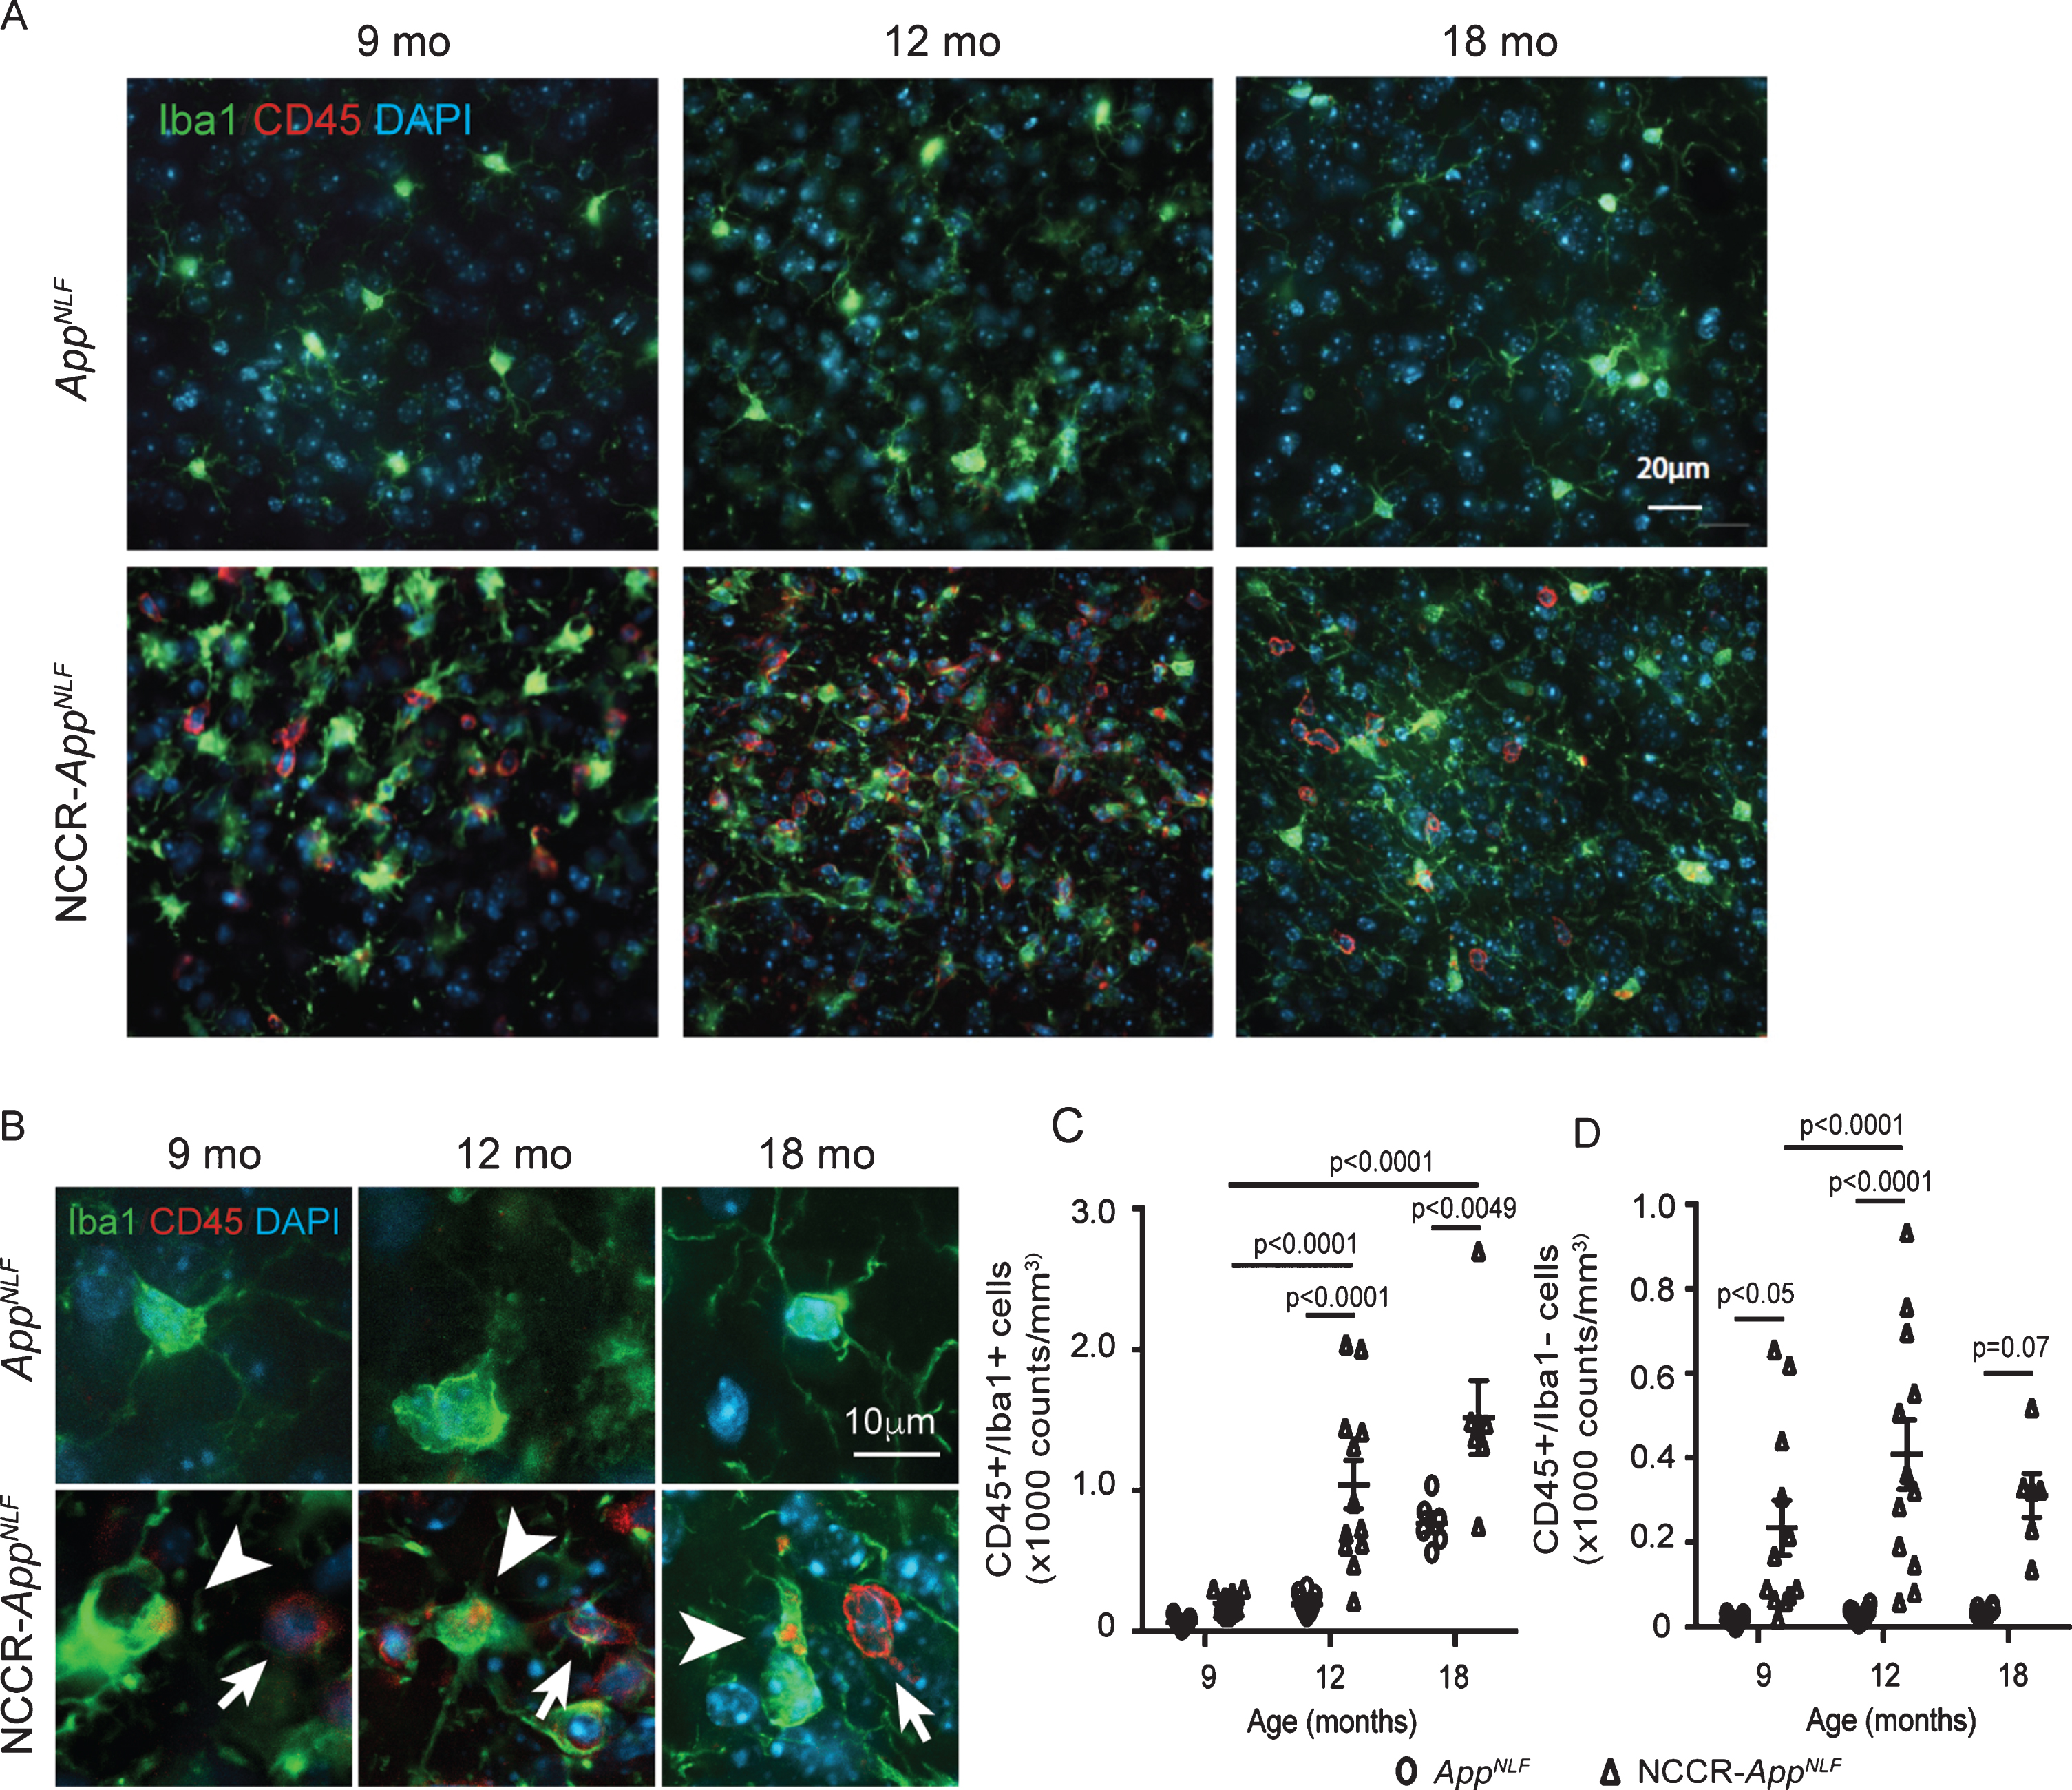
CD45 is also a pan-leukocyte marker indicative of infiltrating leukocytes as indicated by CD45-positive/Iba1-negative labeled cells in the brain [78–80]. Increased number of Iba1-negative cells showing donut-shaped CD45 staining in our NCCR-AppNLF suggests an increase in infiltrating leukocytes in these mice (Fig. 5B, arrows). Quantification of CD45-positive/Iba1-negative cells in 9-, 12-, and 18-month-old NCCR-AppNLF and AppNLF animals showed a significant genotype effect (Fig. 5D, two-way ANOVA, F (1, 53) = 39.34, p < 0.0001). Post-hoc pairwise comparison shows significantly elevated levels of brain leukocyte infiltration in the cortex of 9- and 12-month-old NCCR-AppNLF mice compared to age-matched AppNLF mice, while at 18-month-old samples did not reach significance (Fig. 5D).
Pan-nuclear γH2AX signal is selectively observed in NCCR-AppNLF mice
Neuronal DNA damage is increased in many neurodegenerative diseases and has been suggested to contribute to the neuronal loss [81–84]. A commonly used marker for DNA damage is γH2AX, which stains for phosphorylation of the histone variant H2AX at serine 139. It appears in two distinct staining morphologies, which have been suggested to have differing causes and consequences. Focal γH2AX staining is associated with DNA double strand breaks (DSBs) [83]. Pan-nuclear γH2AX staining is also observed following UV-exposure, and though recently it has been suggested not to be associated with DSBs [83], numerous studies suggest it is associated with a pre-apoptotic state due to replicative stress [85–89]. Additionally, γH2AX has previously been used to identify early neuronal DNA damage in human AD patients and mouse models of AD [83].
Analysis of γH2AX staining in the cortical sections showed that focal γH2AX staining is not statistically different between NCCR-AppNLF and
AppNLF animals at any of the time points examined (data not shown). On the other hand, pan-nuclear γH2AX
staining was primarily observed in 9-, 12-, and 18-month-old NCCR-AppNLF animals (Fig. 6A). Quantification of pan-nuclear γH2AX staining showed that pan-nuclear γH2AX signal is mainly present in NCCR-AppNLF animals and is observed in both NeuN-positive and NeuN-negative cells at all time points (Fig. 6A-C). Additionally, pan-nuclear γH2AX labeling was more frequently observed in NeuN+ cells compared NeuN- cells (Fig. 6C).
Fig. 6
Pan-nuclear γH2AX signal is selectively observed in NCCR-AppNLF animals. A) immunofluorescence staining for γH2AX, a marker for DNA damage response, in cortex shows pan-nuclear labeling that is restricted to NCCR-AppNLF animals at 9, 12, and 18 months of age (arrows, primary somatosensory areas shown). B) Magnified image showing γH2AX labeled NeuN+and NeuN- cells (arrowhead and arrow, respectively). C) Quantification of pan-nuclear γH2AX labeling shows that pan-nuclear γH2AX signal is present in both NeuN+and NeuN- cells in NCCR-AppNLF animal-specific manner. Pan-nuclear γH2AX labeling was observed more frequently in NeuN+cells compared NeuN- cells. N = 2 animals per genotype/age were evaluated. Four matched coronal sections were measured across the animals. Each data point represents a measure from each section. D) SV40T expression modulates pan-nuclear γH2AX signal. Representative images of SV40T (red), γH2AX (green), and DAPI (blue) staining in CA1 of NCCR mice. Panel “a” shows 3-month-old NCCR mice maintained on regular diet for 2 months displaying increased pan-nuclear γH2AX staining. When NCCR mice are put back on dox diet to halt SV40T expression (panel “b”, pulsed) or continuously maintained on dox diet thus never having expressed SV40T (panel “c”, always on dox), no pan-nuclear γH2AX labeling is detected, demonstrating its modulation by SV40T expression. TAg (TRE-SV40T) animals were used as controls. A complex relationship between neuronal SV40T expression and pan-nuclear γH2AX expression is demonstrated by the staining data. In addition to co-labeling of SV40T and γH2AX (Fig. 6D,a; arrowhead), there are instances of γH2AX labeling in the absence of SV40T (Fig. 6D,a; asterisks) and SV40T labeling in the absence of γH2AX signal (Fig. 6D,a; arrow). Therefore, the effect of neuronal SV40T expression on pan-nuclear γH2AX signal can be non-cell autonomous, but at the same time, the cell-autonomous response to SV40T expression can also be variable. Scale bar 20μm.
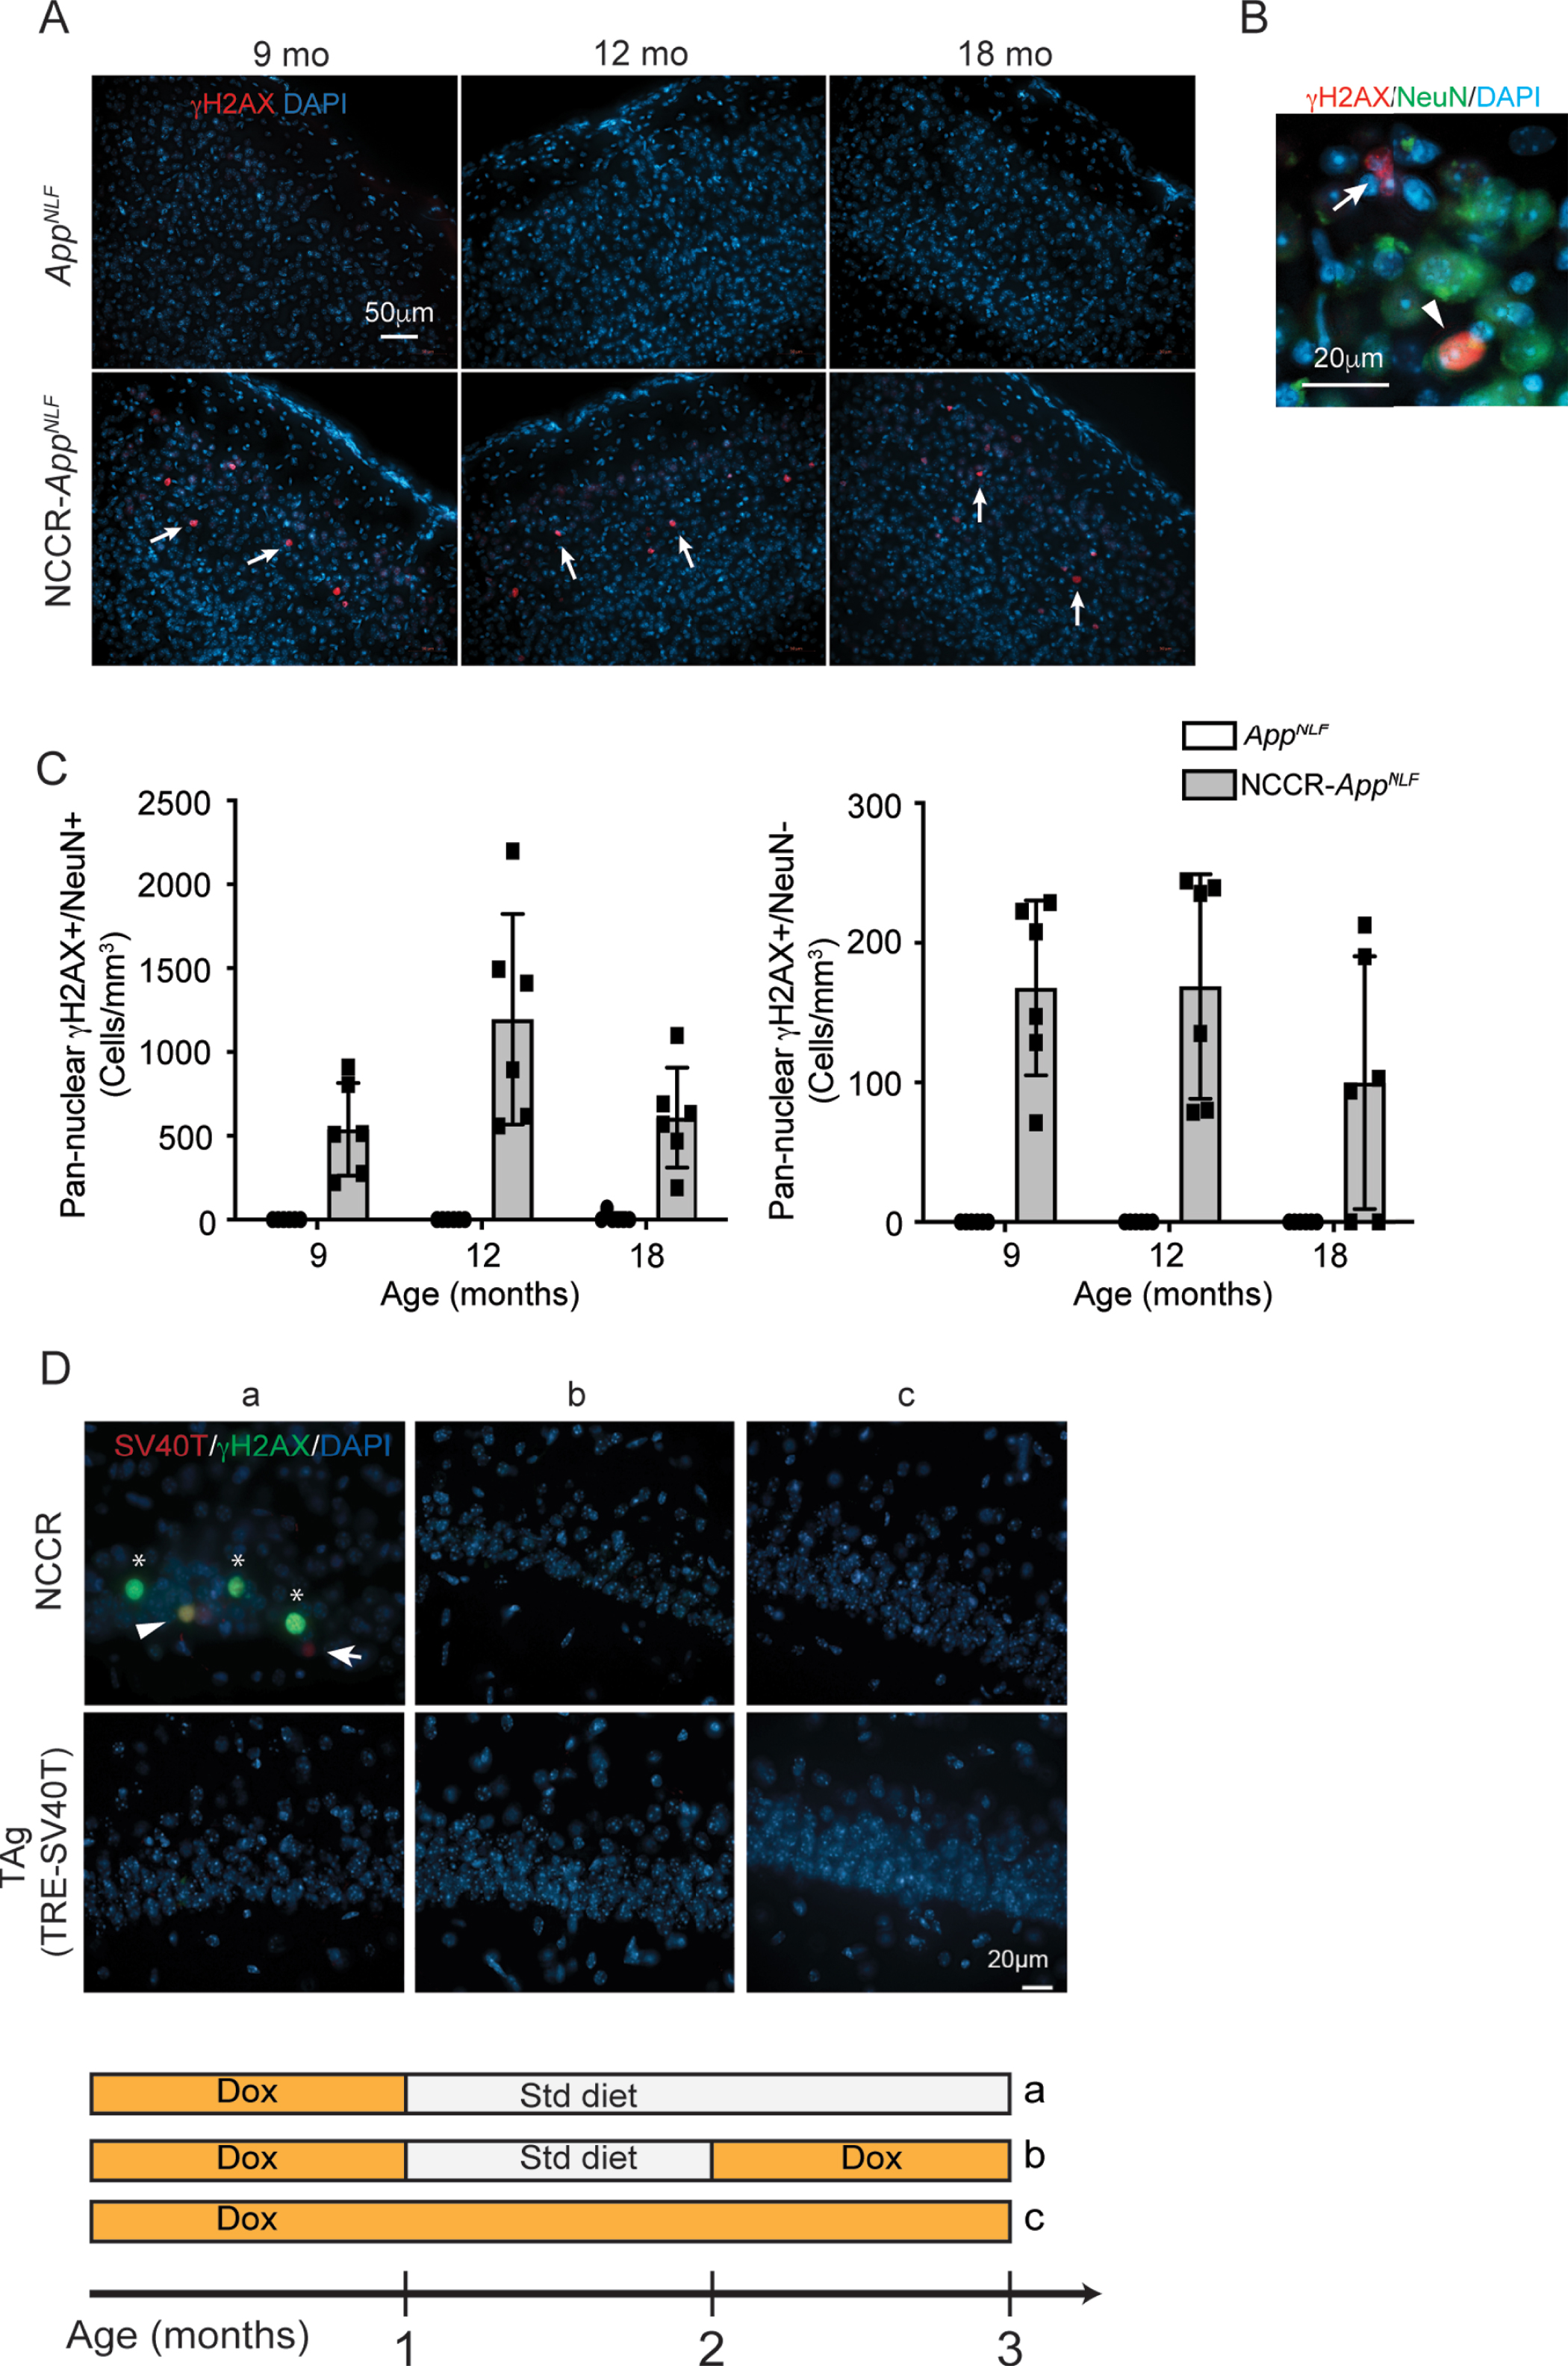
This increase in pan-nuclear γH2AX staining is induced by neuronal expression of SV40T. Examination of brain samples from 3-month-old NCCR mice that are maintained on regular diet for two months showed pan-nuclear γH2AX staining (Fig. 6D,a). On the other hand, brain samples from 3-month-old NCCR animals that were either put back on dox diet at 2 months of age thus turning off SV40T expression (Fig. 6D,b) or continuously maintained on dox diet for continual suppression of SV40T (Fig. 6D,c) did not show γH2AX staining. However, the staining data demonstrates a complex relationship between neuronal SV40T expression and pan-nuclear γH2AX expression. In addition to co-labeling of SV40T and γH2AX (Fig. 6D,a; arrowhead), there are instances of γH2AX labeling in the absence of SV40T (Fig. 6D,a; asterisks) and SV40T labeling in the absence of γH2AX signal (Fig. 6D,a; arrow). This suggests that the effect of neuronal SV40T expression on pan-nuclear γH2AX signal can be non-cell autonomous but at the same time, the cell-autonomous response to SV40T expression can also be variable. Further study is needed for understanding the relationship between neuronal SV40T expression and the appearance of pan-nuclear γH2AX.
Given the increased staining for γH2AX, a marker for DNA damage response, we performed terminal deoxynucleotidyl transferase dUTP nick end labeling (TUNEL) staining for the presence of DNA fragmentation which typically occurs during the latter stages of apoptosis. We did not observe TUNEL signal in our NCCR-AppNLF mice in any of the age groups (Supplementary Figure 4A). We also did not detect any caspase-3 signal in either genotypes at any of the ages (data not shown). This result is in line with in vitro work which showed that cell death following induction of SV40T expression in neurons is non-apoptotic and does not produce TUNEL staining [49]. Furthermore, it has been shown that pan-nuclear γH2AX is not associated with DNA fragmentation [83]. However, we did observe significantly increased Fluoro-Jade C labeling in the NCCR-AppNLF animals compared to AppNLF animals at 9, 12, and 18 months of age (Supplementary Figure 5A, B). Constellation of punctate Fluoro-Jade C labeling suggests neuropil degeneration in the NCCR-AppNLF animals (Supplementary Figure 5B).
DISCUSSION
We have shown previously that our neuronal cell cycle re-entry (NCCR) mouse model display in a progressive manner a number of pathological features associated with AD: endogenously generated Aβ and tau pathologies, neuroinflammation, peripheral immune cell infiltration, and neurodegeneration [25, 37]. Though significant, the pathologies observed in these mice are relatively mild, likely due to the differences in mouse and human AD related proteins. For example, AβPP is a well conserved protein between mouse and human. However, a difference in 3 of the amino acids within the Aβ domain makes mouse Aβ less prone to aggregation than its human counterpart [53, 55, 56, 90]. To increase the AD-relevance of our NCCR mice, we crossed these mice with AppNLF KI mice that produce humanized Aβ plaques from endogenous levels of AβPP that harbor humanized Aβ domains.
NCCR-AppNLF mice demonstrated SV40T induced neuronal cell cycle re-entry. Although past studies have reported that Aβ can induce neuronal cell cycle re-entry [61, 62], we did not detect any neuronal PCNA expression in the AppNLF animals. Evaluation of 12-month-old NCCR-AppNLF mice showed that between 1–3%of the cortical neurons express SV40T and PCNA, suggesting that a small proportion of neurons are in a state of cell cycle activation in the NCCR-AppNLF mice. The proportion of neurons showing the cell cycle marker in NCCR-AppNLF animals is comparable to that observed in the postmortem AD brains where it has been shown that approximately 5%of neurons are undergoing cell cycle re-entry at any one time [14, 21]. It has been demonstrated that SV40T expression induces neuronal tetraploidy [49]. The proportion of neuronal SV40T expression is similar to the proportion of tetraploidy neurons observed in AD brains [10, 13]. Evaluation of DAPI fluorescence intensities showed increases in SV40T+/NeuN+ and PCNA+/NeuN+ cells compared to SV40T-/NeuN+ and PCNA-/Neun+ cells, respectively, suggesting increased nuclear DNA content with neuronal cell cycle re-entry in the NCCR-AppNLF animals. Our findings suggest that a small proportion of neurons undergoing cell cycle re-entry can induce many of the late-stage AD pathologies. This is further suggested by the non-cell autonomous modulatory effect of SV40T expression on pan-nuclear γH2AX signal shown in Fig. 6D,a.
Although the Aβ plaque load was not significantly altered, tau dysfunction seems to be enhanced in the NCCR-AppNLF mice compared to the AppNLF mice as demonstrated by an increase in the number of cells with PHF-1 phospho-tau lesions. This finding is in agreement with our past studies using the NCCR mice [25, 37] and demonstrates that SV40T induced neuronal cell cycle re-entry can promote tau lesions generated from endogenous mouse tau in the absence of tau mutations in the AppNLF mice. Cell cycle protein expression precedes neurofibrillary tangle formation in AD brains [8, 91]. It is suggested that with ectopic neuronal cell cycle activation, tau is phosphorylated by numerous cyclin dependent kinases [25, 33–35]. However, our current findings also point to other potential pathophysiological processes involved in the generation of tau lesions in the NCCR-AppNLF animals. The appearance of PHF-1 phospho-tau lesions in the NCCR-AppNLF mice is also preceded by neuroinflammation, and brain leukocyte infiltration in addition to neuronal cell cycle activation. The confluence of these pathological features suggests that the interaction between these changes could contribute to the development of tau lesions that postcedes Aβ plaque deposition.
The presence of chronic neuroinflammation could play a role in the development of PHF-1 phospho-tau lesions in the NCCR-AppNLF animals. It has been shown that mutant tau transgenic mouse model deficient in NLRP3 inflammasome activation in microglia reduces tau hyperphosphorylation and aggregation [92]. Additionally, depletion of microglia mitigates tau propagation and neurotoxicity in mice [93]. The presence of early gliosis and neuroinflammation preceding the tau pathology, including brain leukocyte infiltration, in the NCCR-AppNLF mice warrants future investigation in their role in the formation of tau pathology in the context of secondary tauopathies such as AD. Brain expression levels of CD68 and MHCII are higher in AD [94–99] and we previously showed that microglial activation in NCCR mice through co-staining of Iba1 with either MHCII or CD68, two other markers of pro-inflammatory microglia [37, 77, 100, 101]. These findings suggest that chronic neuronal cell cycle activation induced by SV40T expression increases the presence of proinflammatory microglia in NCCR-AppNLF mice. Further study is needed to determine the relationship between SV40T-mediated neuronal cell cycle activation and the increase in neuroinflammation.
Qualitative assessment of the neuroinflammation pathology in the NCCR animals shows increased response in the somatosensory/motor regions of the cortex, suggesting regional sensitivity or vulnerability. Further evaluation is needed to identify the physiological properties that give rise to the regional difference, which could help better understand the pathophysiological process underlying regional vulnerability in AD.
The neurodegeneration in NCCR-AppNLF mice is also enhanced compared to AppNLF mice at 9, 12, and 18 months of age examined as demonstrated by increased cortical atrophy and Fluoro-Jade C staining. This increase in neurodegenerative phenotype could result from the convergence of various pathological features in the NCCR-AppNLF animals. Neuronal cell cycle on its own can result in neurodegeneration [26, 33, 102]. Elevated cell cycle related proteins are observed in neurons of brain areas susceptible to degeneration in AD [14, 22, 103, 104]. Likewise, other neuronal cell cycle re-entry models also display neurodegeneration [24, 26, 33]. SV40T expression in cultured cortical neurons increased cell death susceptibility [49]. This study found that cell death following SV40T expression is non-apoptotic and similar to our findings, SV40T expressing cells were negative for TUNEL staining [49]. Interestingly, the presence of apoptotic cell death in human AD samples is rare, and it is believed that neuronal cell cycle re-entry results in delayed cell death, which may also partially explain the progressive neurodegeneration in NCCR-AppNLF mice as demonstrated by increased Fluoro-Jade C stain [3, 49, 105]. Additionally, chronic neuroinflammation has been shown to occur in AD and may contribute to AD associated neurodegeneration [71, 106–108].
Further enhancement of neurodegeneration in the18-month-old NCCR-AppNLF mice compared to 9- and 12-month-old NCCR-AppNLF mice suggests that the increase in PHF-1 phospho-tau lesions observed in these mice at 18 months of age could also contribute and exacerbate neurodegeneration. A positron emission tomography (PET) imaging study showed that the presence of both Aβ and tau is the best predictor of degeneration, suggesting that both Aβ and tau interact to affect neurodegeneration in AD, and tau pathology is believed to be essential to the Aβ induced neurotoxicity [109, 110]. And it has been suggested that neuroinflammation can aggravate tau pathologies and neurodegeneration, potentially linking the three main key pathological hallmarks of AD; Aβ plaques, neurofibrillary tangles, and neurodegeneration [111].
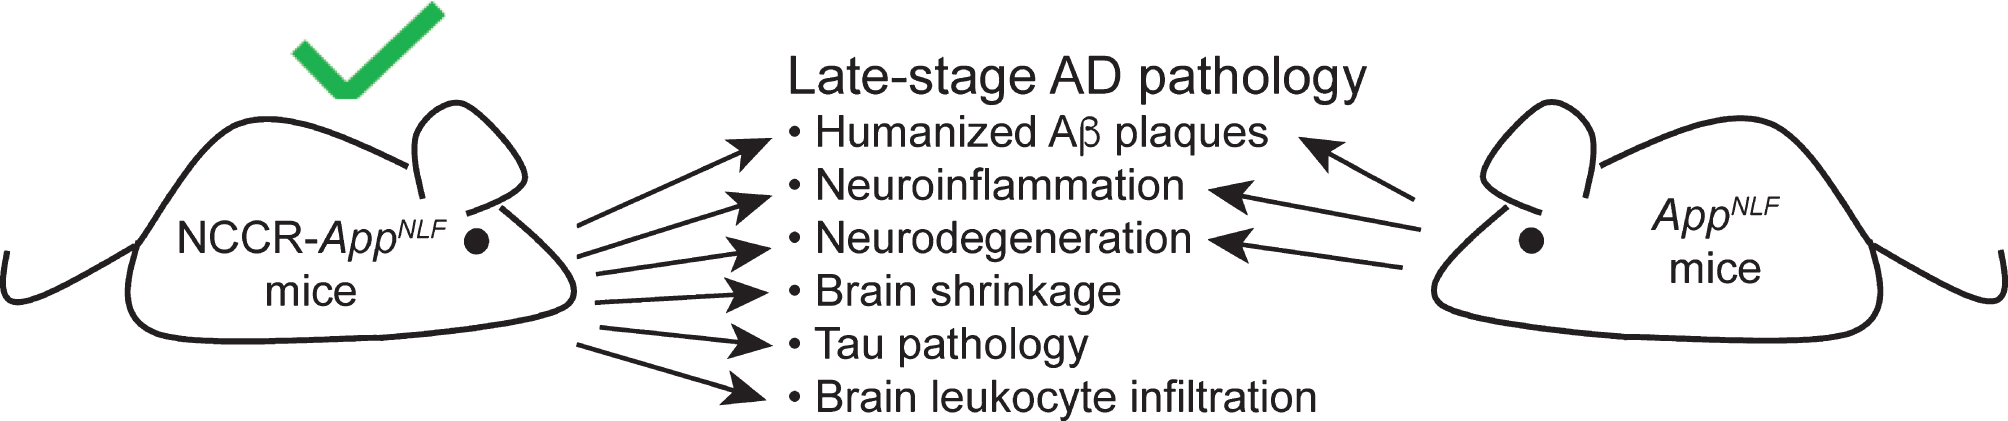
AD is a complex disorder with assorted pathological changes that manifest during an abnormal aging process that is mainly characterized by Aβ plaques, neurofibrillary tangles, neuroinflammation, and neuronal loss. The commonly used AD mouse models represent the FAD pathogenic mechanisms affecting 1-2%of the AD cases while 95%of the AD cases are sporadic with no underlying genetic cause. Our neuronal cell cycle re-entry (NCCR) mice represent an alternative AD mouse model for ectopic neuronal cell cycle activation in AD. In summary, SV40T-mediated neuronal cell cycle re-entry in AppNLF FAD mouse model results in the progressive development of Aβ and tau pathologies, gliosis, neuroinflammation, brain leukocyte infiltration and neurodegeneration with cortical atrophy (Fig. 7). Significantly, the PHF-1 phospho-tau lesions generated from endogenous tau occurs in the absence of tau mutations. The simultaneous display of the many key pathological features associated with AD in the NCCR-AppNLF mice highlights their value as an alternative AD mouse model. By understanding how SV40T induced neuronal cell cycle re-entry generates comprehensive AD-like pathologies, we will gain new insights into pathogenic mechanisms of AD. Furthermore, our NCCR-AppNLF mice represent an alternative to the numerous existing FAD mouse models.
Fig. 7
A diagram showing a comparison of late-stage pathological features observed in NCCR-AppNLF and AppNLF mice. Induction of neuronal cell cycle re-entry results in additional AD-related pathological features that are not present in AppNLF mice.
ACKNOWLEDGMENTS
We would like to thank Carol Stevens for help with mouse colony management. This work was supported by NIH R03AG060144 grant (KP).
Authors’ disclosures available online (https://www.j-alz.com/manuscript-disclosures/21-0091r3).
SUPPLEMENTARY MATERIAL
[1] The supplementary material is available in the electronic version of this article: https://dx.doi.org/10.3233/JAD-210091.
REFERENCES
[1] | Sasaguri H , Nilsson P , Hashimoto S , Nagata K , Saito T , De Strooper B , Hardy J , Vassar R , Winblad B , Saido TC ((2017) ) APP mouse models for Alzheimer’s disease preclinical studies. EMBO J 36: , 2473–2487. |
[2] | Jankowsky JL , Zheng H ((2017) ) Practical considerations for choosing a mouse model of Alzheimer’s disease. Mol Neurodegener 12: , 89. |
[3] | Arendt T , Brückner MK , Mosch B , Lösche A ((2010) ) Selective cell death of hyperploid neurons in Alzheimer’s disease. Am J Pathol 177: , 15–20. |
[4] | Boeras DI , Granic A , Padmanabhan J , Crespo NC , Rojiani AM , Potter H ((2008) ) Alzheimer’s presenilin 1 causes chromosome missegregation and aneuploidy. Neurobiol Aging 29: , 319–328. |
[5] | Zhu X , Raina AK , Perry G , Smith MA ((2004) ) Alzheimer’s disease: The two-hit hypothesis. Lancet Neurol 3: , 219–226. |
[6] | Vincent I , Rosado M , Davies P ((1996) ) Mitotic mechanisms in Alzheimer’s disease? J Cell Biol 132: , 413–425. |
[7] | Vincent I , Jicha G , Rosado M , Dickinson DW ((1997) ) Aberrant expression of mitotic cdc2/cyclin B1 kinase in degenerating neurons of Alzheimer’s disease brain. J Neurosci 17: , 3588–3598. |
[8] | Vincent I , Zheng JH , Dickson DW , Kress Y , Davies P ((1998) ) Mitotic phosphoepitopes precede paired helical filaments in Alzheimer’s disease. Neurobiol Aging 19: , 287–296. |
[9] | Ding XL , Husseman J , Tomashevski A , Nochlin D , Jin LW , Vincent I ((2000) ) The cell cycle Cdc25A tyrosine phosphatase is activated in degenerating postmitotic neurons in Alzheimer’s disease. Am J Pathol 157: , 1983–1990. |
[10] | López-sánchez N , Fontán-lozano Á , Pallé A , González-Álvarez V , Rábano A , Trejo JL , Frade JM ((2017) ) Neuronal tetraploidization in the cerebral cortex correlates with reduced cognition in mice and precedes and recapitulates Alzheimer’s-associated neuropathology. Neurobiol Aging 56: , 50–66. |
[11] | Malik B , Currais A , Andres A , Towlson C , Pitsi D , Nunes A , Niblock M , Cooper J , Hortobágyi T , Soriano S ((2008) ) Loss of neuronal cell cycle control as a mechanism of neurodegeneration in the presenilin-1 Alzheimer’s disease brain. Cell Cycle 7: , 637–646. |
[12] | Ogawa O , Lee HG , Zhu X , Raina A , Harris PLR , Castellani RJ , Perry G , Smith MA ((2003) ) Increased p27, an essential component of cell cycle control, in Alzheimer’s disease. Aging Cell 2: , 105–110. |
[13] | Mosch B , Morawski M , Mittag A , Lenz D , Tarnok A , Arendt T ((2007) ) Aneuploidy and DNA replication in the normal human brain and Alzheimer’s disease. J Neurosci 27: , 6859–6867. |
[14] | Busser J , Geldmacher DS , Herrup K ((1998) ) Ectopic cell cycle proteins predict the sites of neuronal cell death in Alzheimer’s disease brain. J Neurosci 18: , 2801–2807. |
[15] | Herrup K , Yang Y ((2007) ) Cell cycle regulation in the postmitotic neuron: Oxymoron or new biology? Nat Rev Neurosci 8: , 368–378. |
[16] | Kruman II , Wersto RP , Cardozo-Pelaez F , Smilenov L , Chan SL , Chrest FJ , Emokpae R , Gorospe M , Mattson MP ((2004) ) Cell cycle activation linked to neuronal cell death initiated by DNA damage. Neuron 41: , 549–561. |
[17] | McShea A , Harris PLR , Webster KR , Wahl AF , Smith MA ((1997) ) Abnormal expression of the cell cycle regulators P16 and CDK4 in Alzheimer’s disease. Am J Pathol 150: , 1933–1939. |
[18] | Nagy Z , Esiri MM , Smith AD ((1997) ) Expression of cell division markers in the hippocampus in Alzheimer’s disease and other neurodegenerative conditions. Acta Neuropathol 93: , 294–300. |
[19] | Nagy Z , Esiri MM , Cato AM , Smith AD ((1997) ) Cell cycle markers in the hippocampus in Alzheimer’s disease. Acta Neuropathol 94: , 6–15. |
[20] | Yang Y , Geldmacher DS , Herrup K ((2001) ) DNA replication precedes neuronal cell death in Alzheimer’s disease. J Neurosci 21: , 2661–8. |
[21] | Yang Y , Mufson EJ , Herrup K ((2003) ) Neuronal cell death is preceded by cell cycle events at all stages of Alzheimer’s disease. J Neurosci 23: , 2557–2563. |
[22] | Herrup K ((2010) ) The involvement of cell cycle events in the pathogenesis of Alzheimer’s disease. Alzheimers Res Ther 2: , 13. |
[23] | Herrup K , Neve R , Ackerman SL , Copani A ((2004) ) Divide and die: Cell cycle events as triggers of nerve cell death. J Neurosci 24: , 9232–9239. |
[24] | Lee H , Casadesus G , Nunomura A , Zhu X , Castellani RJ , Richardson SL , Perry G , Felsher DW , Petersen RB , Smith MA ((2009) ) The neuronal expression of MYC causes a neurodegenerative phenotype in a novel transgenic mouse. Am J Pathol 174: , 891–897. |
[25] | Park KH , Hallows JL , Chakrabarty P , Davies P , Vincent I ((2007) ) Conditional neuronal simian virus 40 T antigen expression induces Alzheimer-like tau and amyloid pathology in mice. J Neurosci 27: , 2969–2978. |
[26] | Schlatterer SD , Suh H , Conejero-Goldberg C , Chen S , Acker CM , Lee SC , Davies P , Tremblay MA , Acker CM , Davies P ((2011) ) Neuronal c-Abl overexpression leads to neuronal loss and neuroinflammation in the mouse forebrain. J Alzheimers Dis 25: , 119–33. |
[27] | Tábuas-Pereira M , Santana I , Guerreiro R , Bras J ((2020) ) Alzheimer’s disease genetics: Review of novel loci associated with disease. M, Santana I, Guerreiro R, Bras J (2020) Alzheimer’s disease genetics: Review of novel loci associated with disease. Curr Genet Med Rep 8: , 1–16. |
[28] | Moreno-Grau S , de Rojas I , Hernández I , Quintela I , Montrreal L , Alegret M , Hernández-Olasagarre B , Madrid L , González-Perez A , Maroñas O , Rosende-Roca M , Mauleón A , Vargas L , Lafuente A , Abdelnour C , Rodríguez-Gómez O , Gil S , Santos-Santos MÁ , Espinosa A , Ortega G , Sanabria Á , Pérez-Cordón A , Cañabate P , Moreno M , Preckler S , Ruiz S , Aguilera N , Pineda JA , Macías J , Alarcón-Martín E , Sotolongo-Grau O , Abdelnour C , Alarcon E , Benaque A , Boada M , Buendia M , Carracedo A , Corbatón A , Diego S , Gailhajenet A , García González P , Guitart M , Ibarria M , Macias J , Martín E , Martínez MT , Marquié M , Monté-Rubio G , Orellana A , Pancho A , Pelejá E , Real LM , Ruiz A , Ruiz S , Sáez ME , Sanabria A , Serrano-Rios M , Tárraga L , Valero S , Adarmes-Gómez AD , Álvarez I , Álvarez V , Amer-Ferrer G , Antequera M , Antúnez C , Baquero M , Bernal M , Blesa R , Buiza-Rueda D , Bullido MJ , Burguera JA , Calero M , Carrillo F , Carrión-Claro M , Casajeros MJ , Clarimón J , Cruz-Gamero JM , de Pancorbo MM , del Ser T , Diez-Fairen M , Fortea J , Franco E , Frank-García A , García-Alberca JM , Garcia Madrona S , Garcia-Ribas G , Gómez-Garre P , Hevilla S , Jesús S , Espinosa L , Lage C , Legaz A , Lleó A , López de Munáin A , López-García S , Macias D , Manzanares S , Marín M , Marín-Muñoz J , Marín T , Martín Montes A , Martínez B , Martínez C , Martínez V , Martínez-Lage Álvarez P , Medina M , Mendioroz Iriarte M , Menéndez-González M , Mir P , Molinuevo JL , Pastor AB , Pástor P , Pérez Tur J , Periñán-Tocino T , Piñol Ripoll G , Rábano A , Real de Asúa D , Rodrigo S , Rodríguez-Rodríguez E , Royo JL , Ruiz A , Sanchez R , Sánchez-Juan del Valle Díaz P , Sastre I , Vicente MP , Vivancos L , García-Ribas G , Piñol-Ripoll G , Medina M , Ávila J ((2019) ) Genome-wide association analysis of dementia and its clinical endophenotypes reveal novel loci associated with Alzheimer’s disease and three causality networks: The GR@ACE project. Alzheimers Dement 15: , 1333–1347. |
[29] | Jansen IE , Savage JE , Watanabe K , Bryois J , Williams DM , Steinberg S , Sealock J , Karlsson IK , Hägg S , Athanasiu L , Voyle N , Proitsi P , Witoelar A , Stringer S , Aarsland D , Almdahl IS , Andersen F , Bergh S , Bettella F , Bjornsson S , Brækhus A , Bråthen G , de Leeuw C , Desikan RS , Djurovic S , Dumitrescu L , Fladby T , Hohman TJ , Jonsson P V. , Kiddle SJ , Rongve A , Saltvedt I , Sando SB , Selbæk G , Shoai M , Skene NG , Snaedal J , Stordal E , Ulstein ID , Wang Y , White LR , Hardy J , Hjerling-Leffler J , Sullivan PF , van der Flier WM , Dobson R , Davis LK , Stefansson H , Stefansson K , Pedersen NL , Ripke S , Andreassen OA , Posthuma D ((2019) ) Genome-wide meta-analysis identifies new loci and functional pathways influencing Alzheimer’s disease risk. Nat Genet 51: , 404–413. |
[30] | Marioni RE , Harris SE , Zhang Q , McRae AF , Hagenaars SP , Hill WD , Davies G , Ritchie CW , Gale CR , Starr JM , Goate AM , Porteous DJ , Yang J , Evans KL , Deary IJ , Wray NR , Visscher PM ((2018) ) GWAS on family history of Alzheimer’s disease. Transl Psychiatry 8: , 99. |
[31] | Li P , Marshall L , Oh G , Jakubowski JL , Groot D , He Y , Wang T , Petronis A , Labrie V ((2019) ) Epigenetic dysregulation of enhancers in neurons is associated with Alzheimer’s disease pathology and cognitive symptoms. Nat Commun 10: , 2246. |
[32] | Suzuki T , Oishi M , Marshak DR , Czernik AJ , Nairn AC , Greengard P ((1994) ) Cell cycle-dependent regulation of the phosphorylation and metabolism of the Alzheimer amyloid precursor protein. EMBO J 13: , 1114–1122. |
[33] | McShea A , Lee HG , Petersen RB , Casadesus G , Vincent I , Linford NJ , Funk JO , Shapiro RA , Smith MA ((2007) ) Neuronal cell cycle re-entry mediates Alzheimer disease-type changes. Biochim Biophys Acta 1772: , 467–472. |
[34] | Hradek AC , Lee HP , Siedlak SL , Torres SL , Jung W , Han AH , Lee HG ((2014) ) Distinct chronology of neuronal cell cycle re-entry and tau pathology in the 3xTg-AD mouse model and Alzheimer’s disease patients. J Alzheimers Dis 43: , 57–65. |
[35] | Lee KH , Lee SJ , Lee HJ , Choi GE , Jung YH , Kim DI , Gabr AA , Ryu JM , Han HJ ((2017) ) Amyloid β1-42 (Aβ1-42) induces the CDK2-mediated phosphorylation of tau through the activation of the mtorc1 signaling pathway while promoting neuronal cell death. Front Mol Neurosci 10: , 229. |
[36] | Varvel NH , Bhaskar K , Kounnas MZ , Wagner SL , Yang Y , Lamb BT , Herrup K , Clinic TC , Avenue E , Therapeutics TP , Jolla L ((2009) ) NSAIDs prevent, but do not reverse, neuronal cell cycle re-entry in Alzheimer’s disease mouse models. Cell Cycle 119: , 1–46. |
[37] | Park KH , Barrett T ((2020) ) Gliosis precedes amyloid-β deposition and pathological tau accumulation in the neuronal cell cycle re-entry mouse model of Alzheimer’s disease. J Alzheimers Dis Rep 4: , 243–253. |
[38] | Ahuja D , Saenz-Robles MT , Pipas JM ((2005) ) SV40 large T antigen targets multiple cellular pathways to elicit cellular transformation. Oncogene 24: , 7729–7745. |
[39] | Ranganathan S , Scudiere S , Bowser R ((2001) ) Hyperphosphorylation of the retinoblastoma gene product and altered subcellular distribution of E2F-1 during Alzheimer’s disease and amyotrophic lateral sclerosis. J Alzheimers Dis 3: , 377–385. |
[40] | Hooper C , Meimaridou E , Tavassoli M , Melino G , Lovestone S , Killick R ((2007) ) p53 is upregulated in Alzheimer’s disease and induces tau phosphorylation in HEK293a cells. Neurosci Lett 418: , 34–37. |
[41] | Jazvinsćak Jembrek M , Slade N , Hof PR , Simić G ((2018) ) The interactions of p53 with tau and Aβ as potential therapeutic targets for Alzheimer’s disease. Prog Neurobiol 168: , 104–127. |
[42] | Jordan-Sciutto KL , Malaiyandi LM , Bowser R ((2002) ) Altered distribution of cell cycle transcriptional regulators during Alzheimer disease. J Neuropathol Exp Neurol 61: , 358–367. |
[43] | Lapresa R , Agulla J , Sánchez-Morán I , Zamarreño R , Prieto E , Bolaños JP , Almeida A ((2019) ) Amyloid-β promotes neurotoxicity by Cdk5-induced p53 stabilization. Neuropharmacology 146: , 19–27. |
[44] | Thakur A , Siedlak SL , James SL , Bonda DJ , Rao A , Webber KM , Camins A , Pallás M , Casadesus G , Lee H-G , Bowser R , Raina AK , Perry G , Smith MA , Zhu X ((2008) ) Retinoblastoma protein phosphorylation at multiple sites is associated with neurofibrillary pathology in Alzheimer disease. Int J Clin Exp Pathol 1: , 134–146. |
[45] | Stone JG , Siedlak SL , Tabaton M , Hirano A , Castellani RJ , Santocanale C , Perry G , Smith MA , Zhu X , Lee H ((2011) ) The cell cycle regulator phosphorylated retinoblastoma protein is associated with tau pathology in several tauopathies. J Neuropathol Exp Neurol 70: , 578–87. |
[46] | Feddersen RM , Ehlenfeldt R , Yunis WS , Clark HB , Orr HT ((1992) ) Disrupted cerebellar cortical development and progressive degeneration of Purkinje cells in SV40 T antigen transgenic mice. Neuron 9: , 955–966. |
[47] | Feddersen RM , Clark HB , Yunis WS , Orr HT ((1995) ) viability of postmitotic Purkinje neurons require pRB family member function. Mol Cell Neurosci 6: , 153–167. |
[48] | Al-Ubaidi MR , Hollyfield JG , Overbeek PA , Baehr W ((1992) ) Photoreceptor degeneration induced by the expression of simian virus 40 large tumor antigen in the retina of transgenic mice. Proc Natl Acad Sci U S A 89: , 1194–1198. |
[49] | Barrio-Alonso E , Hernández-Vivanco A , Walton CC , Perea G , Frade JM ((2018) ) Cell cycle reentry triggers hyperploidization and synaptic dysfunction followed by delayed cell death in differentiated cortical neurons. Sci Rep 8: , 14316. |
[50] | Mayford M , Bach ME , Huang YY , Wang L , Hawkins RD , Kandel ER ((1996) ) Control of memory formation through regulated expression of a CaMKII transgene. Science 274: , 1678–1683. |
[51] | Saito T , Matsuba Y , Mihira N , Takano J , Nilsson P , Itohara S , Iwata N , Saido TC ((2014) ) Single App knock-in mouse models of Alzheimer’s disease. Nat Neurosci 17: , 661–663. |
[52] | Hilbich C , Kisters-Woike B , Reed J , Masters CL , Beyreuther K ((1991) ) Aggregation and secondary structure of synthetic amyloid βA4 peptides of alzheimer’s disease. J Mol Biol 218: , 149–163. |
[53] | Jarrett JT , Berger EP , Lansbury PT ((1993) ) The carboxy terminus of the β amyloid protein is critical for the seeding of amyloid formation: Implications for the pathogenesis of Alzheimer’s disease. Biochemistry 32: , 4693–4697. |
[54] | Xu G , Ran Y , Fromholt SE , Fu C , Yachnis AT , Golde TE , Borchelt DR ((2015) ) Murine Aβ over-production produces diffuse and compact Alzheimer-type amyloid deposits. Acta Neuropathol Commun 3: , 72. |
[55] | Dyrks T , Dyrks E , Masters L.C , Beyreuther K ((1993) ) Amyloidogenicity of rodent and human βA4 sequences. FEBS Lett 324: , 231–236. |
[56] | Jankowsky JL , Younkin LH , Gonzales V , Fadale DJ , Slunt HH , Lester HA , Younkin SG , Borchelt DR ((2007) ) Rodent Abeta modulates the solubility and distribution of amyloid deposits in transgenic mice. J Biol Chem 282: , 22707–22720. |
[57] | Han HJ , Allen CC , Buchovecky CM , Yetman MJ , Born HA , Marin MA , Rodgers SP , Song BJ , Lu H-C , Justice MJ , Probst FJ , Jankowsky JL ((2012) ) Strain background influences neurotoxicity and behavioral abnormalities in mice expressing the tetracycline transactivator. J Neurosci 32: , 10574–10586. |
[58] | Barrett T , Marchalant Y , Park KHJ ((2019) ) p35 hemizygous deletion in 5xFAD mice increases Aβ plaque load in males but not in females. Neuroscience 417: , 45–56. |
[59] | Franklin K , Paxinos G ((1997) ) The mouse brain in stereotaxic coordinates, Academic Press. |
[60] | Intson K , van Eede MC , Islam R , Milenkovic M , Yan Y , Salahpour A , Henkelman RM , Ramsey AJ ((2019) ) Progressive neuroanatomical changes caused by Grin1 loss-of-function mutation. Neurobiol Dis 132: , 104527. |
[61] | Seward ME , Swanson E , Norambuena A , Reimann A , Cochran JN , Li R , Roberson ED , Bloom GS ((2013) ) Amyloid-β signals through tau to drive ectopic neuronal cell cycle re-entry in Alzheimer’s disease. J Cell Sci 126: , 1278–86. |
[62] | Yang Y , Varvel NH , Lamb BT , Herrup K ((2006) ) Ectopic cell cycle events link human Alzheimer’s disease and amyloid precursor protein transgenic mouse models. J Neurosci 26: , 775–784. |
[63] | Ballatore C , Lee VMY , Trojanowski JQ ((2007) ) Tau-mediated neurodegeneration in Alzheimer’s disease and related disorders. Nat Rev Neurosci 8: , 663–672. |
[64] | Duyckaerts C , Delatour B , Potier MC ((2009) ) Classification and basic pathology of Alzheimer disease. Acta Neuropathol 118: , 5–36. |
[65] | Otvos L , Feiner L , Lang E , Szendrei GI , Goedert M , Lee VM ((1994) ) Monoclonal antibody PHF-1 recognizes tau protein phosphorylated at serine residues 396 and 404. J Neurosci Res 39: , 669–673. |
[66] | Braak E , Braak H , Mandelkow EM ((1994) ) A sequence of cytoskeleton changes related to the formation of neurofibrillary tangles and neuropil threads. Acta Neuropathol 87: , 554–567. |
[67] | Braak H , Thal DR , Ghebremedhin E , Del Tredici K ((2011) ) Stages of the pathologic process in Alzheimer disease: Age categories from 1 to 100 years. J Neuropathol Exp Neurol 70: , 960–969. |
[68] | Mondragón-Rodríguez S , Perry G , Luna-Muñoz J , Acevedo-Aquino MC , Williams S ((2014) ) Phosphorylation of tau protein at sites Ser(396-404) is one of the earliest events in Alzheimer’s disease and Down syndrome. Neuropathol Appl Neurobiol 40: , 121–135. |
[69] | Spillantini MG , Goedert M ((2013) ) Tau pathology and neurodegeneration. Lancet Neurol 12: , 609–622. |
[70] | Simard AR , Soulet D , Gowing G , Julien JP , Rivest S ((2006) ) Bone marrow-derived microglia play a critical role in restricting senile plaque formation in Alzheimer’s disease. Neuron 49: , 489–502. |
[71] | Heneka MT , Carson MJ , Khoury J El , Landreth GE , Brosseron F , Feinstein DL , Jacobs AH , Wyss-Coray T , Vitorica J , Ransohoff RM , Herrup K , Frautschy SA , Finsen B , Brown GC , Verkhratsky A , Yamanaka K , Koistinaho J , Latz E , Halle A , Petzold GC , Town T , Morgan D , Shinohara ML , Perry VH , Holmes C , Bazan NG , Brooks DJ , Hunot S , Joseph B , Deigendesch N , Garaschuk O , Boddeke E , Dinarello CA , Breitner JC , Cole GM , Golenbock DT , Kummer MP ((2015) ) Neuroinflammation in Alzheimer’s disease. Lancet Neurol 14: , 388–405. |
[72] | Jaworski T , Lechat B , Demedts D , Gielis L , Devijver H , Borghgraef P , Duimel H , Verheyen F , Kgler S , Van Leuven F ((2011) ) Dendritic degeneration, neurovascular defects, and inflammation precede neuronal loss in a mouse model for tau-mediated neurodegeneration. Am J Pathol 179: , 2001–2015. |
[73] | Solito E , Sastre M ((2012) ) Microglia function in Alzheimer’s disease. Front Pharmacol 3: , 14. |
[74] | Spanić E , Langer Horvat L , Hof PR , Simić G ((2019) ) Role of microglial cells in Alzheimer’s disease tau propagation. Front Aging Neurosci 11: , 271. |
[75] | Habib N , McCabe C , Medina S , Varshavsky M , Kitsberg D , Dvir-Szternfeld R , Green G , Dionne D , Nguyen L , Marshall JL , Chen F , Zhang F , Kaplan T , Regev A , Schwartz M ((2020) ) Disease-associated astrocytes in Alzheimer’s disease and aging. Nat Neurosci 23: , 701–706. |
[76] | Ponomarev ED , Shriver LP , Dittel BN ((2006) ) CD40 expression by microglial cells is required for their completion of a two-step activation process during central nervous system autoimmune inflammation. J Immunol 176: , 1402–1410. |
[77] | Sarlus H , Heneka MT ((2017) ) Microglia in Alzheimer’s disease. J Clin Invest 127: , 3240–3249. |
[78] | Nakano A , Harada T , Morikawa S , Kato Y ((1990) ) Expression of leukocyte common antigen (CD45) on various human leukemia/lymphoma cell lines. Pathol Int 40: , 107–115. |
[79] | Jung S , Aliberti J , Graemmel P , Sunshine MJ , Kreutzberg GW , Sher A , Littman DR ((2000) ) Analysis of fractalkine receptor CX3CR1 function by targeted deletion and green fluorescent protein reporter gene insertion. Mol Cell Biol 20: , 4106–4114. |
[80] | Dénes Á , Ferenczi S , Halász J , Környei Z , Kovács KJ ((2008) ) Role of CX3CR1 (fractalkine receptor) in brain damage and inflammation induced by focal cerebral ischemia in mouse. J Cereb Blood Flow Metab 28: , 1707–1721. |
[81] | Dobbin MM , Madabhushi R , Pan L , Chen Y , Kim D , Gao J , Ahanonu B , Pao PC , Qiu Y , Zhao Y , Tsai LH ((2013) ) SIRT1 collaborates with ATM and HDAC1 to maintain genomic stability in neurons. Nat Neurosci 16: , 1008–1015. |
[82] | Madabhushi R , Pan L , Tsai LH ((2014) ) DNA damage and its links to neurodegeneration. Neuron 83: , 266–282. |
[83] | Shanbhag NM , Evans MD , Mao W , Nana AL , Seeley WW , Adame A , Rissman RA , Masliah E , Mucke L ((2019) ) Early neuronal accumulation of DNA double strand breaks in Alzheimer’s disease. Acta Neuropathol Commun 7: , 77. |
[84] | Pao P-C , Patnaik D , Watson LA , Gao F , Pan L , Wang J , Adaikkan C , Penney J , Cam HP , Huang W-C , Pantano L , Lee A , Nott A , Phan TX , Gjoneska E , Elmsaouri S , Haggarty SJ , Tsai L-H ((2020) ) HDAC1 modulates OGG1-initiated oxidative DNA damage repair in the aging brain and Alzheimer’s disease. Nat Commun 11: , 2484. |
[85] | Rogakou EP , Nieves-Neira W , Boon C , Pommier Y , Bonner WM ((2000) ) Initiation of DNA fragmentation during apoptosis induces phosphorylation of H2AX histone at serine 139. J Biol Chem 275: , 9390–9395. |
[86] | Huang X , Okafuji M , Traganos F , Luther E , Holden E , Darzynkiewicz Z ((2004) ) Assessment of histone H2AX phosphorylation induced by DNA topoisomerase I and II inhibitors topotecan and mitoxantrone and by the DNA cross-linking agent cisplatin. Cytometry 58A: , 99–110. |
[87] | De Feraudy S , Revet I , Bezrookove V , Feeney L , Cleaver JE ((2010) ) A minority of foci or pan-nuclear apoptotic staining of γH2AX in the S phase after UV damage contain DNA double-strand breaks. Proc Natl Acad Sci U S A 107: , 6870–6875. |
[88] | Crowe SL , Tsukerman S , Gale K , Jorgensen TJ , Kondratyev AD ((2011) ) Phosphorylation of histone H2A.X as an early marker of neuronal endangerment following seizures in the adult rat brain. J Neurosci 31: , 7648–7656. |
[89] | Müller B , Ellinwood NM , Lorenz B , Stieger K ((2018) ) Detection of DNA double strand breaks by γH2AX does not result in 53bp1 recruitment in mouse retinal tissues. Front Neurosci 12: , 286. |
[90] | Krohn M , Bracke A , Avchalumov Y , Schumacher T , Hofrichter J , Paarmann K , Fröhlich C , Lange C , Brüning T , Von Bohlen und Halbach O , Pahnke J ((2015) ) Accumulation of murine amyloid-β mimics early Alzheimer’s disease. Brain 138: , 2370–2382. |
[91] | Preuss U , Mandelkow EM ((1998) ) Mitotic phosphorylation of tau protein in neuronal cell lines resembles phosphorylation in Alzheimer’s disease. Eur J Cell Biol 76: , 176–184. |
[92] | Ising C , Venegas C , Zhang S , Scheiblich H , Schmidt S V. , Vieira-Saecker A , Schwartz S , Albasset S , McManus RM , Tejera D , Griep A , Santarelli F , Brosseron F , Opitz S , Stunden J , Merten M , Kayed R , Golenbock DT , Blum D , Latz E , Buée L , Heneka MT ((2019) ) NLRP3 inflammasome activation drives tau pathology. Nature 575: , 669–673. |
[93] | Asai H , Ikezu S , Tsunoda S , Medalla M , Luebke J , Haydar T , Wolozin B , Butovsky O , Kugler S , Ikezu T ((2015) ) Depletion of microglia and inhibition of exosome synthesis halt tau propagation. Nat Neurosci 18: , 1584–1593. |
[94] | Perego C , Fumagalli S , De Simoni MG ((2011) ) Temporal pattern of expression and colocalization of microglia/macrophage phenotype markers following brain ischemic injury in mice. J Neuroinflammation 8: , 174. |
[95] | Minett T , Classey J , Matthews FE , Fahrenhold M , Taga M , Brayne C , Ince PG , Nicoll JAR , Boche D ((2016) ) Microglial immunophenotype in dementia with Alzheimer’s pathology. J Neuroinflammation 13: , 135. |
[96] | Rakic S , Hung YMA , Smith M , So D , Tayler HM , Varney W , Wild J , Harris S , Holmes C , Love S , Stewart W , Nicoll JAR , Boche D ((2018) ) Systemic infection modifies the neuroinflammatory response in late stage Alzheimer’s disease. Acta Neuropathol Commun 6: , 88. |
[97] | Lue LF , Walker DG , Brachova L , Beach TG , Rogers J , Schmidt AM , Stern DM , Yan Du S ((2001) ) Involvement of microglial receptor for advanced glycation endproducts (RAGE) in Alzheimer’s disease: Identification of a cellular activation mechanism. Exp Neurol 171: , 29–45. |
[98] | Parachikova A , Agadjanyan MG , Cribbs DH , Blurton-Jones M , Perreau V , Rogers J , Beach TG , Cotman CW ((2007) ) Inflammatory changes parallel the early stages of Alzheimer disease. Neurobiol Aging 28: , 1821–1833. |
[99] | Lopes KO , Sparks DL , Streit WJ ((2008) ) Microglial dystrophy in the aged and Alzheimer’s disease brain is associated with ferritin immunoreactivity. Glia 56: , 1048–1060. |
[100] | Godbout JP , Chen J , Abraham J , Richwine AF , Berg BM , Kelley KW , Johnson RW ((2005) ) Exaggerated neuroinflammation and sickness behavior in aged mice following activation of the peripheral innate immune system. FASEB J 19: , 1329–1331. |
[101] | Henry CJ , Huang Y , Wynne AM , Godbout JP ((2009) ) Peripheral lipopolysaccharide (LPS) challenge promotes microglial hyperactivity in aged mice that is associated with exaggerated induction of both pro-inflammatory IL-1β and anti-inflammatory IL-10 cytokines. Brain Behav Immun 23: , 309–317. |
[102] | Marlier Q , Tine D , Verteneuil S , Vandenbosch R , Malgrange B ((2020) ) Core cell cycle machinery is crucially involved in both life and death of post-mitotic neurons. Cell Mol Life Sci 77: , 4553–4571. |
[103] | Herrup K , Busser JC ((1995) ) The induction of multiple cell cycle events precedes target-related neuronal death. Development 121: , 2385–2395. |
[104] | Li L , Cheung T , Chen J , Herrup K ((2011) ) A comparative study of five mouse models of Alzheimer’s disease: Cell cycle events reveal new insights into neurons at risk for death. Int J Alzheimers Dis 2011: , 171464. |
[105] | Katchanov J , Harms C , Gertz K , Hauck L , Waeber C , Hirt L , Priller J , Von Harsdorf R , Brück W , Hörtnagl H , Dirnagl U , Bhide PG , Endres M ((2001) ) Mild cerebral ischemia induces loss of cyclin-dependent kinase inhibitors and activation of cell cycle machinery before delayed neuronal cell death. J Neurosci 21: , 5045–5053. |
[106] | Bamberger ME , Landreth GE ((2002) ) Inflammation, apoptosis, and Alzheimer’s disease. Neuroscientist 8: , 276–283. |
[107] | Wyss-Coray T , Mucke L ((2002) ) Inflammation in neurodegenerative disease –a double-edged sword. Neuron 35: , 419–432. |
[108] | Griffin WST , Sheng JG , Royston MC , Gentleman SM , McKenzie JE , Graham DI , Roberts GW , Mrak RE ((2006) ) Glial-neuronal interactions in Alzheimer’s disease: The potential role of a ‘cytokine cycle’ in disease progression. Brain Pathol 8: , 65–72. |
[109] | Wang L , Benzinger TL , Su Y , Christensen J , Friedrichsen K , Aldea P , McConathy J , Cairns NJ , Fagan AM , Morris JC , Ances BM ((2016) ) Evaluation of tau imaging in staging Alzheimer disease and revealing interactions between β-amyloid and tauopathy. JAMA Neurol 73: , 1070–1077. |
[110] | Rapoport M , Dawson HN , Binder LI , Vitek MP , Ferreira A ((2002) ) Tau is essential to β-amyloid-induced neurotoxicity. Proc Natl Acad Sci U S A 99: , 6364–6369. |
[111] | Leyns CEG , Holtzman DM ((2017) ) Glial contributions to neurodegeneration in tauopathies. Mol Neurodegener 12: , 50. |

