
Brain Metabolic, Structural, and Behavioral Pattern Learning for Early Predictive Diagnosis of Alzheimer’s Disease
Abstract
Alzheimer’s disease (AD) is a devastating neurodegenerative disorder affecting millions of people worldwide. Laboratory research and longitudinal clinical studies have helped to reveal various information about the disease but the exact causal process is not known yet. Patterns from alteration of neurochemicals (e.g., glutathione depletion, etc.), hippocampal atrophy, and brain effective connectivity loss as well as associated behavioral changes have generated important characteristic features. These imaging-based readouts and neuropsychological outcomes along with supervised clinical review are critical for developing a comprehensive artificial intelligence strategy for early predictive AD diagnosis and therapeutic development.
Alzheimer’s disease (AD) is an irreversible progressive neurodegenerative disorder manifested by cognitive deterioration as a variety of neuropsychiatric symptoms and associated behavioral disturbances leading to impairment of activities of daily living [1, 2]. Every year an estimated 9.9 million new dementia cases worldwide are being populated with one new AD case in every 3.2 seconds [3]. At present, precise diagnostic confirmation of AD is only possible by autopsy. Extensive research is being carried out for the non-invasive identification of associated changes in brain to understand the cause of neurodegeneration in AD for accurate preventive treatment.
Distinct imaging modalities such as positron emission tomography (PET) [4], magnetic resonance imaging (MRI) [5], functional imaging (fMRI) [6], and spectroscopy (MRS) [7] in the clinical setting are intrinsic to delineate AD. Neuropsychological screenings such as the Mini-Mental State Examination (MMSE) [8], the Geriatric Depression Scale – Short Form (GDS-SF) [9], the Hachinski Ischemic Score (HIS) [10], the Functional Assessment Questionnaire (FAQ) [11], and Trail making test A and B (TMT-A and TMT-B) [12] provide critical associative behavioral information. There are exhaustive neuropsychological assessments like forward and backward digit span test (Wechsler memory scale, WMS-III), immediate and delayed recall (WMS-III), and Boston naming test (BNT) [13] used for cohort studies [14]. MRI generated information of brain has a role in finding robust biomarkers for early AD detection non-invasively. Available tools such as FreeSurfer [15] and SPM [16] have been useful for most of the anatomical and functional activity analysis [17]. Huge supportive imaging studies have reported anatomical atrophy [5] and disrupted functional activities [6] in associated brain regions such as frontal, temporal and occipital lobes, hippocampus, corpus callosum, cortical and thalamic regions involved in cognitive dysfunction as the promising biomarkers for early AD diagnosis. Recent susceptibility imaging studies have also reported iron accumulation on parietal cortex, motor cortex, hippocampus, and basal ganglia as possible influential effect in AD progression [18, 19]. Although in present clinical practice, MRI provides the supportive information used for the clinician’s observation and diagnosis, specific anatomical conversion from normal control to mild cognitive impairment (MCI) may not be identified based on MRI data.
The fundamental molecular etiology which leads to neuronal loss resulting in cognitive decline in AD is still unknown, and some studies reported the supportive results for oxidative stress to be linked with molecular change and anatomical atrophy to initiate the pathocascade of AD [20]. PET scans also demonstrated significant impact of characteristic patterns of glucose metabolism on brain, which can help in differentiating AD from overlapping symptoms of frontotemporal dementia and dementia of Lewy body (DLB); however, it involves oral or intravenous administration of radiolabeled tracer [4, 21]. The non-invasive MRS imaging techniques are being used to investigate metabolic alteration and understanding the impact of neurochemical imbalance in the AD pathogenesis [7]. Identification and quantitation of the distinctive, specific, and robust surrogate biomarkers in the brain regions are critical in case of overlapping diagnostic symptoms for early diagnosis of AD patients. State-of-the-art MRS research in brain metabolic alteration with precision have gained improved response due to availability of advanced MR pulse sequence and signal processing packages/toolboxes like LCModel [22], jMRUI [23], Gannet [24], and KALPANA [25], which provide absolute quantitation of neurometabolites in a selected region of brain. Over the years, various neurochemicals N-acetyl aspartate (NAA) [26] and myo inositol (mI) and or NAA/mI ratio modulation have been followed and clinically correlated with the behavioral changes [27]. Apart from these specific neurochemicals, antioxidant glutathione (GSH) [28] and neurotransmitter gamma-aminobutyric acid (GABA) [29] detected using specialized MEGA-PRESS [30] pulse sequence have added new scientific information to AD diagnosis.
GSH as a free radical scavenger plays key role in maintaining the oxidative and redox balance in human cells. The concentration of antioxidant GSH has been studied in different regions of brain to show its variability with disease progression. Extended and closed (stable) forms of GSH were hypothesized based on state-of-the-art-NMR reports [31]. Close scrutiny of metabolic patterns through advanced processing of in vivo MRS data has validated the existence of two conformers, extended and closed (stable) forms of GSH in human brain, which has been first time investigated and found with its exclusiveness from well-established other metabolites such as NAA and aspartate. Detailed clinical study involving autopsy brain of AD, Parkinson’s disease (PD) and DLB disease have reported that the GSH level in the cingulate cortex brain region of AD patients is reduced (49%) compared to age-matched control subjects, while this specific change is not found in PD and DLB patients [32]. It is required to demonstrate that depletion of GSH in the hippocampus is a dominant marker for the conversion from normal control subject to MCI or MCI to AD. The limitations of the MRS studies are the large time requirement for data acquisition from multiple brain regions as well as the availability of hardware setup (e.g., multinuclear MRS amplifiers, dual tuned coils and special pulse sequence, etc.) in the clinical setting.
In the last few years, the scientific literature has accumulated on predictive AD diagnosis based on only MRI specific outcomes to learn and classify the detection of microstructural white matter degeneration, cerebrospinal fluid, and atrophic changes in brain as the possible biomarker for disease [33– 36]. The MRS driven clinical research outcome, in spite of their detailed cellular information for AD diagnosis, has not yet been incorporated for predictive disease modeling. A recent work on early predictive diagnostic system presented 1H (proton) single voxel MRS information with region specific spectroscopic metabolite concentrations available using LCModel signal processing tool in combination to the tissue content in selected voxel [37]. However, other important neurochemicals like antioxidant GSH and neurotransmitter GABA obtained using specialized MEGA-PRESS sequence have not yet been included in predictive AD diagnostic system. Clinical studies have demonstrated the influence of GSH in the cognitive decline in AD. Inclusion of the high quality and diverse MRS information for different neurometabolite requires a dedicated tool to process and analyze different MRS data types generated from different scanners. Most of the available MRS processing tools are restrictive to their data types and MEGA-PRESS data handling features. In order to bridge the gap between spectroscopic data processing and significant feature extraction (using “GAURI” framework) for predictive diagnosis, we have developed a KALPANA package [25] to perform the processing and absolute metabolic quantitation for different single voxel PRESS and MEGA-PRESS MRS data acquired from different scanners.
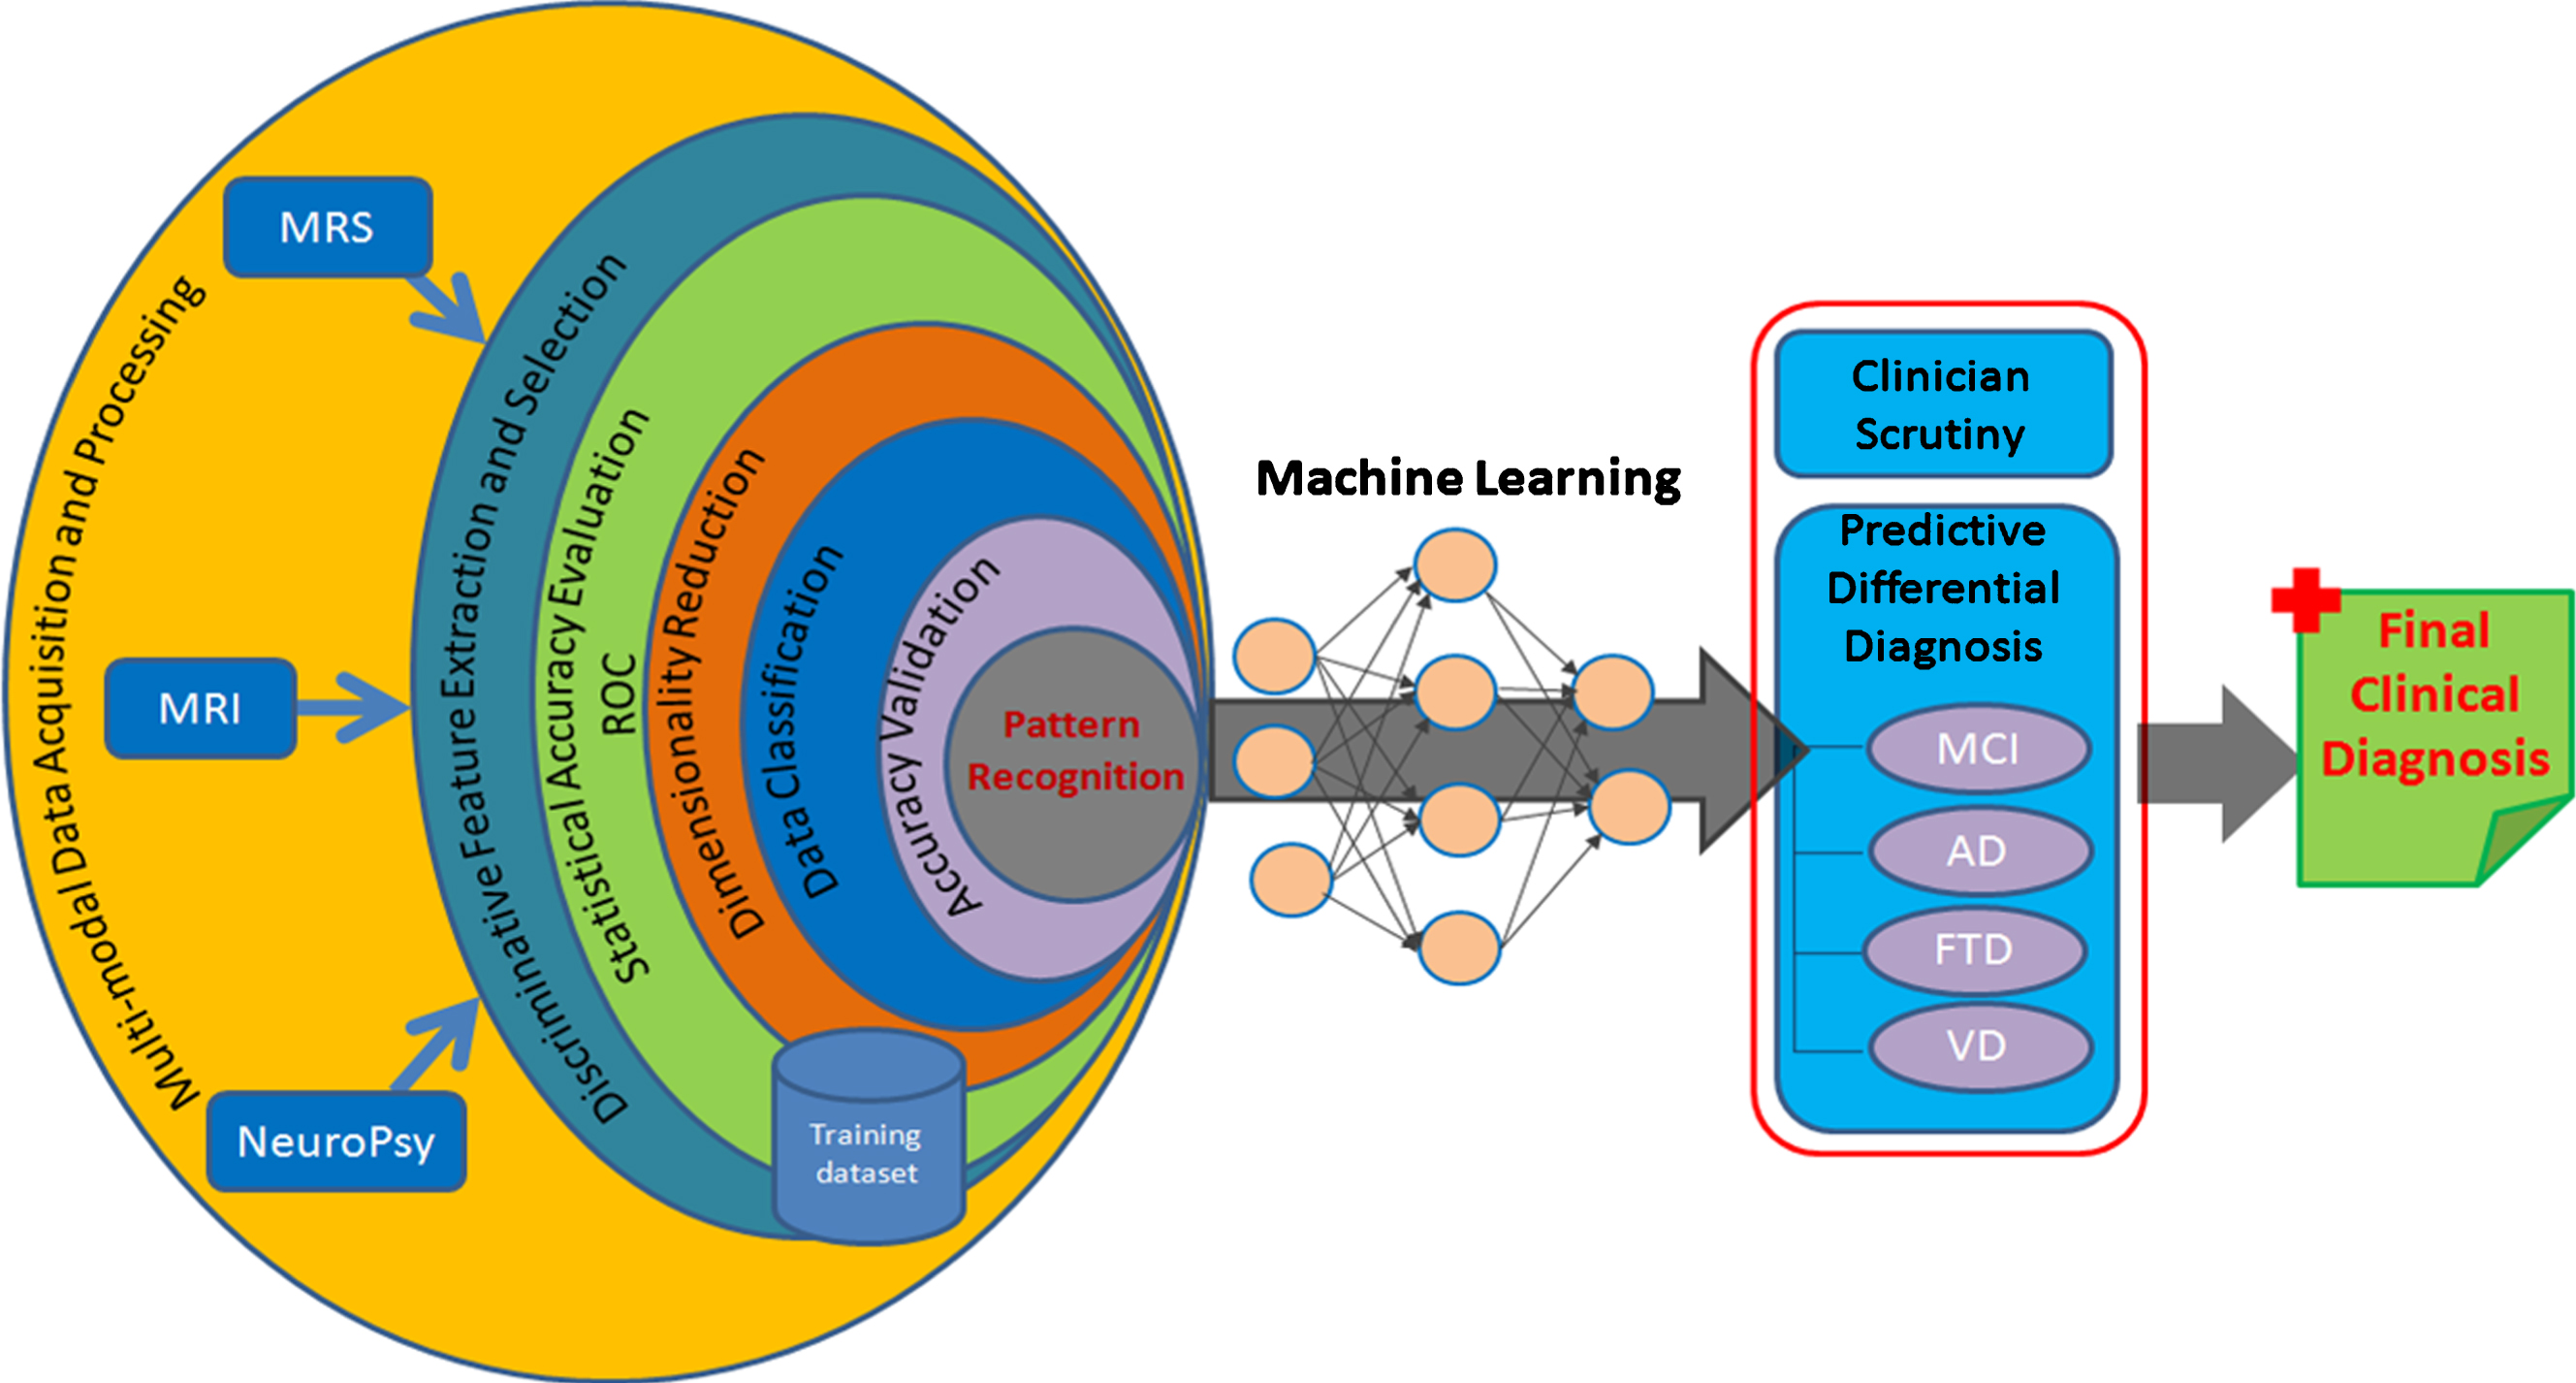
Intrinsic diagnosis of AD in the present world of technological hurl demands complete pathogenesis follow-up tracked from molecular process using MR spectroscopy, anatomical changes from MR imaging, and cognitive scores from neuropsychological evaluation. The present standalone mode of the metabolic quantitation or the anatomical observation cannot provide high confidence of the derived diagnostic measure and thus the entire scheme needs to be expanded to form a close logical conclusion from receiver operating characteristic (ROC) curve and its admissibility in the clinical setting [4, 38]. Figure 1 represents a complete spectrum inclusive of multi-modal data involving anatomical atrophy, MRS-devised molecular profile, and neuropsychological measures to extract sensitive disease specific biomarkers. Selected biomarker features from the labeled training dataset are analyzed with ROC curve and further classification (supervised) is performed to get a pattern model representing the disease specific changes in input modalities. This trained data information from a large dataset can be used to create an artificial intelligent system for differential diagnostic outcomes, which would help with the diagnosis of a new unknown case with the use of self-learning neural network models using machine learning approaches. Such type integrated multi-modal predictive diagnostic system for AD diagnosis would aid the clinician in early differential diagnostics to deliver the most appropriate treatment.
Fig.1
A comprehensive artificial intelligence scheme for predictive AD diagnosis.
In the neuroimaging field, pattern recognition and machine learning promise improved disease diagnosis accuracy with their actuating objective in decision-making process [35, 39– 41]. Artificial intelligence is likely to transform diagnostic imaging, and expected to be capable of offering concrete prospects for quantized predictive diagnosis measure at personalized level. Moving ahead from the state-of-the-art quantitative imaging modalities, we are developing an integrated framework “GAURI” for generalized metabolic profile estimator with statistical and predictive diagnostic capability using the advanced pattern classifier schemes. The system provides a complete view of brain atrophy, metabolic change, behavioral change, sociodemographic for the combined feature analysis. With AD being a progressive disorder, single-time point (cross-sectional) data would unlikely suffice for the diagnostic needs at an early stage and thus, necessitates longitudinal assessment of the multi-modal imaging features. Longitudinal multi-modal imaging data from different centers prompts increasing interests for modeling the initial stage and progression of disease (AD, frontotemporal dementia, vascular dementia, DLB, and PD) with combined modality driven analytics using machine learning. Automatic pattern classification to analyze and observe inherent disease-related patterns in a high-dimensional multimodal neuroimaging data for dementia study incorporates supervised learning to infer a model function from a larger disease labeled training dataset and uses this model to predict response output as a specific disease class. Training data in the present scenario will be the MRI derived outcomes for different regions of brain as volume, texture, entropy and tissue content. The neurochemical information would be in terms of area, concentration, height, and line-broadening of individual metabolic peak, and neuropsychological scores from MMSE, CDR, TMT-A, and TMT-B tests provided as features, represent the characteristics of supplied input information and derived outcomes. A wide range of different classifiers such as support vector machines, principal components analysis, and linear discriminate analysis can be used to discriminate AD patients from healthy control subjects and to predict conversion from MCI to AD. Further, feature reduction methods are applied to extract only the distinctive and most relevant features in high-dimensional data for estimating accurate prediction model. Such predictive analysis of multi-model biomarkers will allow differential-diagnosis both at the single-subject level and between the healthy and pathological cohorts.
Artificial intelligence in clinical diagnosis requires huge amount of training data to develop the intelligence in neural networks, particularly deep networks with their manifold learning parameters [40]. The robust amount of healthcare data in clusters from different centers cannot be used for training purposes because of hidden differences in acquisition protocols, insufficient disease specifications, and unclear diagnostic label information [41]. Therefore, a multi-center collaboration with common imaging data protocols for carefully annotated and case-specific MRS and MRI databases are required urgently to develop and validate diagnostic outcome to be well suited to deep learning application in early predictive AD diagnosis.
Integration of multi-modal information with machine leaning is expected to help in diagnostic accuracy in AD. Currently significant amount of data from different streams (e.g., imaging, pathology, genomics) for AD characterization mostly remains unexplored for its deeper insights into disease processes and mechanisms [42]. This acquired neuroimaging and health informatics big-data containing cues on disease behavior and patient outcome call for better, higher resolution technologies or additional tests to uncover remaining knowledge-base. Such an intelligent predictive diagnostic system with integration of diagnostic radiology will pose an astounding aid in better outcome-oriented clinical decision-making for precise results in differential diagnosis conditions. Observations from clinical trial involving anti-oxidant GSH supplement to investigate its subsequent neuro-protective effect may also be helpful to get critical information on AD pathogenesis. This technology driven research outcome will be a big boon for countries with serious crunch in specialized clinicians. We strongly believe that these technological developments in medical imaging will assist clinicians with highly accurate tools to analyze and detect AD as well as secernate the patient-specific treatment.
ACKNOWLEDGMENTS
Financial support (TATA INNOVATION AWARD) to Prof. Mandal from DBT, Ministry of Science and Technology, Government of India is appreciated.
Authors’ disclosures available online (https://www.j-alz.com/manuscript-disclosures/18-0063r2).
REFERENCES
[1] | Cummings JL ((2004) ) Alzheimer’s disease. N Engl J Med 351: , 56–67. |
[2] | Braak E , Griffing K , Arai K , Bohl J , Bratzke H , Braak H ((1999) ) Neuropathology of Alzheimer’s disease: What is new since A. Alzheimer? Eur Arch Psychiatry Clin Neurosci 249: (Suppl 3), 14–22. |
[3] | Dementia statistics. Alzheimer’s Disease International. https://www.alz.co.uk/research/statistics |
[4] | Patwardhan MB , McCrory DC , Matchar DB , Samsa GP , Rutschmann OT ((2004) ) Alzheimer disease: Operating characteristics of PET–a meta-analysis. Radiology 231: , 73–80. |
[5] | Vemuri P , Jack CRJr ((2010) ) Role of structural MRI in Alzheimer’s disease. Alzheimers Res Ther 2: , 23. |
[6] | Alsop DC , Press DZ ((2007) ) Activation and baseline changes in functional MRI studies of Alzheimer disease. Neurology 69: , 1645–1646. |
[7] | Mandal PK ((2007) ) Magnetic resonance spectroscopy (MRS) and its application in Alzheimer’s disease. Concepts Magn Reson 30: , 40–64. |
[8] | Lobo A , Ezquerra J , Gomez Burgada F , Sala JM , Seva Diaz A ((1979) ) Cognocitive mini-test (a simple practical test to detect intellectual changes in medical patients). Actas Luso Esp Neurol Psiquiatr Cienc Afines 7: , 189–202. |
[9] | Yesavage JA , Brink TL , Rose TL , Lum O , Huang V , Adey M , Leirer VO ((1982) ) Development and validation of a geriatric depression screening scale: A preliminary report. J Psychiatr Res 17: , 37–49. |
[10] | Rosen WG , Terry RD , Fuld PA , Katzman R , Peck A ((1980) ) Pathological verification of ischemic score in differentiation of dementias. Ann Neurol 7: , 486–488. |
[11] | Pfeffer RI , Kurosaki TT , Harrah CHJr , Chance JM , Filos S ((1982) ) Measurement of functional activities in older adults in the community. J Gerontol 37: , 323–329. |
[12] | Reitan RM ((1958) ) Validity of the trail making test as an indicator of organic brain damage. Percept Mot Skills 8: , 271–276. |
[13] | Williams BW , Mack W , Henderson VW ((1989) ) Boston Naming Test in Alzheimer’s disease. Neuropsychologia 27: , 1073–1079. |
[14] | Lopez-Sanz D , Bruna R , Garces P , Camara C , Serrano N , Rodriguez-Rojo IC , Delgado ML , Montenegro M , Lopez-Higes R , Yus M , Maestu F ((2016) ) Alpha band disruption in the AD-continuum starts in the Subjective Cognitive Decline stage: A MEG study. Sci Rep 6: , 37685. |
[15] | FreeSurfer, https://surfer.nmr.mgh.harvard.edu/ |
[16] | Statistical Parametric Mapping, http://www.fil.ion.ucl.ac.uk/spm/ |
[17] | Cox RW , Hyde JS ((1997) ) Software tools for analysis and visualization of fMRI data. NMR Biomed 10: , 171–178. |
[18] | Belaidi AA , Bush AI ((2016) ) Iron neurochemistry in Alzheimer’s disease and Parkinson’s disease: Targets for therapeutics. J Neurochem 139: (Suppl 1), 179–197. |
[19] | Wang D , Li YY , Luo JH , Li YH ((2014) ) Age-related iron deposition in the basal ganglia of controls and Alzheimer disease patients quantified using susceptibility weighted imaging. Arch Gerontol Geriatr 59: , 439–449. |
[20] | Perry G , Cash AD , Smith MA ((2002) ) Alzheimer disease and oxidative stress. J Biomed Biotechnol 2: , 120–123. |
[21] | Marcus C , Mena E , Subramaniam RM ((2014) ) Brain PET in the diagnosis of Alzheimer’s disease. Clin Nucl Med 39: , e413–422; quiz e423-416. |
[22] | Provencher SW ((2001) ) Automatic quantitation of localized in vivo 1H spectra with LCModel. NMR Biomed 14: , 260–264. |
[23] | Naressi A , Couturier C , Castang I , de Beer R , Graveron-Demilly D ((2001) ) Java-based graphical user interface for MRUI, a software package for quantitation of in vivo/medical magnetic resonance spectroscopy signals. Comput Biol Med 31: , 269–286. |
[24] | Edden RA , Puts NA , Harris AD , Barker PB , Evans CJ ((2014) ) Gannet: A batch-processing tool for the quantitative analysis of gamma-aminobutyric acid-edited MR spectroscopy spectra. J Magn Reson Imaging 40: , 1445–1452. |
[25] | Grewal M , Dabas A , Saharan S , Barker PB , Edden RA , Mandal PK ((2016) ) GABA quantitation using MEGA-PRESS: Regional and hemispheric differences. J Magn Reson Imaging 44: , 1619–1623. |
[26] | Adalsteinsson E , Sullivan EV , Kleinhans N , Spielman DM , Pfefferbaum A ((2000) ) Longitudinal decline of the neuronal marker N-acetyl aspartate in Alzheimer’s disease. Lancet 355: , 1696–1697. |
[27] | Doraiswamy PM , Charles HC , Krishnan KR ((1998) ) Prediction of cognitive decline in early Alzheimer’s disease. Lancet 352: , 1678. |
[28] | Sáez EA , Mato Abad V , Garcia-Alvarez R , Cervantes JG , I Rodal González IR , Noeske R , Hernandez-Tamames J ((2016) ) The quantification of glutathione (GSH) using 1H-MRS, is possible. Eur Soc Radiol, 1–12. |
[29] | Limon A , Reyes-Ruiz JM , Miledi R ((2012) ) Loss of functional GABA(A) receptors in the Alzheimer diseased brain. Proc Natl Acad Sci U S A 109: , 10071–10076. |
[30] | Terpstra M , Henry PG , Gruetter R ((2003) ) Measurement of reduced glutathione (GSH) in human brain using LCModel analysis of difference-edited spectra. Magn Reson Med 50: , 19–23. |
[31] | Mandal PK , Shukla D , Govind V , Boulard Y , Ersland L ((2017) ) Glutathione conformations and its implications for in vivo magnetic resonance spectroscopy. J Alzheimers Dis 59: , 537–541. |
[32] | Gu M , Owen AD , Toffa SE , Cooper JM , Dexter DT , Jenner P , Marsden CD , Schapira AH ((1998) ) Mitochondrial function, GSH and iron in neurodegeneration and Lewy body diseases. J Neurol Sci 158: , 24–29. |
[33] | Beheshti I , Demirel H , Matsuda H , Alzheimer’s Disease Neuroimaging Initiative ((2017) ) Classification of Alzheimer’s disease and prediction of mild cognitive impairment-to-Alzheimer’s conversion from structural magnetic resource imaging using feature ranking and a genetic algorithm. Comput Biol Med 83: , 109–119. |
[34] | Korolev IO , Symonds LL , Bozoki AC , Alzheimer’s Disease Neuroimaging Initiative ((2016) ) Predicting progression from mild cognitive impairment to Alzheimer’s dementia using clinical, MRI, and plasma biomarkers via probabilistic pattern classification. PLoS One 11: , e0138866. |
[35] | Dyrba M , Barkhof F , Fellgiebel A , Filippi M , Hausner L , Hauenstein K , Kirste T , Teipel SJ , EDSD study group ((2015) ) Predicting prodromal Alzheimer’s disease in subjects with mild cognitive impairment using machine learning classification of multimodal multicenter diffusion-tensor and magnetic resonance imaging data. J Neuroimaging 25: , 738–747. |
[36] | Willette AA , Calhoun VD , Egan JM , Kapogiannis D , Alzheimers Disease Neuroimaging Initiative ((2014) ) Prognostic classification of mild cognitive impairment and Alzheimer’s disease: MRI independent component analysis. Psychiatry Res 224: , 81–88. |
[37] | Munteanu CR , Lozano CF , Abad VM ((2015) ) Classification of mild cognitive impairment and Alzheimer’s disease with machine-learning techniques using 1H magnetic resonance spectroscopy data. Expert Syst Appl 42: , 6205–6214. |
[38] | Hajian-Tilaki K ((2013) ) Receiver operating characteristic (ROC) curve analysis for medical diagnostic test evaluation. Caspian J Intern Med 4: , 627–635. |
[39] | Casanova R , Hsu FC , Sink KM , Rapp SR , Williamson JD , Resnick SM , Espeland MA , Alzheimer’s Disease Neuroimaging Initiative ((2013) ) Alzheimer’s disease risk assessment using large-scale machine learning methods. PLoS One 8: , e77949. |
[40] | Shen D , Wu G , Suk HI ((2017) ) Deep learning in medical image analysis. Annu Rev Biomed Eng 19: , 221–248. |
[41] | Ravi D , Wong C , Deligianni F , Berthelot M , Andreu-Perez J , Lo B , Yang GZ ((2017) ) Deep learning for health informatics. IEEE J Biomed Health Inform 21: , 4–21. |
[42] | Morris MA , Saboury B , Burkett B , Gao J , Siegel EL ((2018) ) Reinventing radiology: Big data and the future of medical imaging. J Thorac Imaging 33: , 4–16. |


