
Comparison of Model-Based Indices of Cerebral Autoregulation and Vasomotor Reactivity Using Transcranial Doppler versus Near-Infrared Spectroscopy in Patients with Amnestic Mild Cognitive Impairment
Abstract
We recently introduced model-based “physiomarkers” of dynamic cerebral autoregulation and CO2 vasomotor reactivity as an aid for diagnosis of early-stage Alzheimer’s disease (AD) [1], where significant impairment of dynamic vasomotor reactivity (DVR) was observed in early-stage AD patients relative to age-matched controls. Milder impairment of DVR was shown in patients with amnestic mild cognitive impairment (MCI) using the same approach in a subsequent study [2]. The advocated approach utilizes subject-specific data-based models of cerebral hemodynamics to quantify the dynamic effects of resting-state changes in arterial blood pressure and end-tidal CO2 (the putative inputs) upon cerebral blood flow velocity (the putative output) measured at the middle cerebral artery via transcranial Doppler (TCD). The obtained input-output models are then used to compute model-based indices of DCA and DVR from model-predicted responses to an input pressure pulse or an input CO2 pulse, respectively. In this paper, we compare these model-based indices of DVR and DCA in 46 amnestic MCI patients, relative to 20 age-matched controls, using TCD measurements with their counterparts using Near-Infrared Spectroscopy (NIRS) measurements of blood oxygenation at the lateral prefrontal cortex in 43 patients and 22 age-matched controls. The goal of the study is to assess whether NIRS measurements can be used instead of TCD measurements to obtain model-based physiomarkers with comparable diagnostic utility. The results corroborate this view in terms of the ability of either output to yield model-based physiomarkers that can differentiate the group of aMCI patients from age-matched healthy controls.
INTRODUCTION
There have been many studies that examined the relation between cognitive impairment and cerebrovascular dysfunction [1–20]. Although a possible causative relation is still debated, the view that the two conditions often co-exist is becoming widely accepted. These studies generally fall into three categories: (1) exploration of the molecular/cellular biological mechanisms; (2) statistical analysis of phenomenological clinical data; (3) quantitative analysis of the relation between cognitive impairment and measures of cerebral hemodynamics. The present study falls in the latter category and seeks to examine the relation of quantitative measures of cerebral hemodynamic function with clinical assessments of amnestic mild cognitive impairment (MCI)— a transitional stage between normal aging and Alzheimer’s disease (AD)— as well as elucidate the possible biological/physiological mechanisms that affect these measures of cerebral hemodynamics. The motivation for this work is provided by the view that the availability of such quantitative and objective measures with diagnostic and/or prognostic utility will improve the clinical management of these two major public health problems (MCI and AD) as well as other types of neurodegenerative disease.
In the quest to discover possible relationshipa between cognitive impairment and dysfunction of cerebral hemodynamics, the dominant role has been occupied by the quantitative analysis of cerebral autoregulation [21–44] that concerns the change in cerebral blood flow in response to changes in systemic arterial pressure, or the study of cerebrovascular reactivity [1, 2, 45–48] that concerns the change in cerebral blood flow in response to changes in blood CO2 tension. The latter study typically utilizes models that account for the combined effects of arterial pressure and CO2 changes upon cerebral blood flow velocity measured via transcranial Doppler at the middle cerebral arteries. The assessment of these two aspects of cerebral hemodynamics employs either direct observations (e.g., the use of a ratio of steady-state change in cerebral blood flow in response to prolonged inhalation of CO2 as a measure of cerebrovascular reactivity) or indirect measures obtained through beat-to-beat data analysis (e.g., correlation coefficients, cross-spectral and phase-shift analysis, regression analysis, and model-based indices). The most sophisticated methods of analysis employ dynamic nonlinear or nonstationary models in open-loop or closed-loop context [1, 2, 45–51], although the potential benefits of such sophisticated (and typically more complex) analysis remain to be evaluated with large cohorts.
Among the model-based approaches, a key distinction must be made between models that are static versus dynamic, linear versus nonlinear, and single-input (arterial pressure) versus dual-input (arterial pressure and end-tidal CO2) for a flow output. The latter is usually measured via transcranial Doppler (TCD) in the middle cerebral arteries or via near-infrared spectroscopy (NIRS) in a local vascular bed composed of arterioles, venules, and capillary space of the prefrontal cortex. The present study compares the results of modeling the combined dynamic effects of blood pressure and CO2 variations upon cerebral flow measured concurrently in the two aforementioned ways.
In order to place the present study in the proper context relative to the state of the art, we must clarify the key definitions regarding static or dynamic cerebral autoregulation and CO2 vasomotor reactivity. The term “cerebral autoregulation” was initially used to indicate the homeostatic mechanism of constraining the steady-state cerebral flow changes in response to steady-state changes in arterial blood pressure (cf. Lassen’s seminal work [52]). This homeostatic mechanism results in a nonlinear steady-state pressure-flow relation that exhibits a plateau in the middle range of pressures and two rising/declining segments above/below this middle range. Since this nonlinear curve relates the steady-state values of pressure and flow, it does not contain any information about the dynamics of the relation between beat-to-beat variations of blood pressure and flow. In our work, we analyze resting-state spontaneous-variation data to extract the dynamic pressure-flow relationship (within the plateau of the aforementioned homeostatic curve), which contains information distinct from the homeostatic curve of steady-state cerebral autoregulation [25]. This is the reason why we use the term “Dynamic Cerebral Autoregulation” (DCA) to make clear that it is distinct from the celebrated homeostatic curve.
The term “cerebrovascular reactivity” (CVR) is traditionally used to indicate the property of the cerebral vasculature to dilate in response to a steady-state elevation of blood CO2 tension that is usually induced through CO2 inhalation over several minutes (typically 5% CO2 over 5 or 10 min). The CVR is measured as the ratio of the steady-state rise in cerebral flow to the inhaled CO2 level. In our work, we analyze resting-state spontaneous variations in end-tidal CO2 (ETCO2) data (a proxy of changes in arterial CO2 tension) concurrently with spontaneous changes in the arterial blood pressure (ABP). Therefore, our models quantify the dynamic relationship between CO2 variations and cerebral blood flow velocity, measured via TCD or NIRS as indicated above. This measure of the dynamic relationship between CO2 and cerebral flow (velocity) is termed “Dynamic Vasomotor Reactivity” (DVR) to make clear that it is understood as being distinct from the commonly used CVR.
We have demonstrated in our previous work that potentially useful measures of DCA and DVR can be obtained from resting-state spontaneous data using input-output models of the dynamic relationship (linear or nonlinear) between beat-to-beat changes in ABP and cerebral blood flow velocity (CBFV) (DCA) or between ETCO2 and CBFV (DVR) [1, 2, 49–51]. Our working hypothesis is that quantitative and reliable measures of these two key aspects of cerebral hemodynamics (DCA and DVR) may contain valuable diagnostic and prognostic information for AD or amnestic MCI, as well as other diseases with a strong cerebrovascular component (e.g., hypertension, diabetes, stroke, traumatic brain injury). Initial results from AD and amnestic MCI patients show that these patients have impaired DVR relative to age-matched controls, with the impairment in AD being more severe than MCI [1, 2].
The key to the extraction of reliable model-based DCA and DVR physiomarkers (using TCD or NIRS) is the modeling methodology that has been pioneered by our lab and employs Principal Dynamic Modes (PDMs) [54, 55] to obtain reliable hemodynamic models from the aforementioned measurements (typically over 5-6 min as dictated by clinical constraints). This methodology will be applied in this paper using TCD or NIRS beat-to-beat output data from amnestic MCI patients and age-matched control subjects in order to allow comparison of the two types of DVR physiomarkers (obtained from TCD versus NIRS output data).
METHODS
Data collection
Time-series data were collected over 5-6 min in healthy controls and age-matched patients with amnestic MCI, who participated voluntarily in this study and signed the Informed Consent Form that has been approved by the Institutional Review Board of the UT Southwestern Medical Center and Texas Health Presbyterian Hospital Dallas. The diagnosis of amnestic MCI was based on modified Petersen criteria [55]. The scores of the Mini-Mental State Exam (MMSE) and the Delayed Logical Memory Recall (DLMR) test were used to assess memory function. The subjects were screened to exclude clinical histories of stroke, major medical and psychiatric disorders, unstable heart diseases, uncontrolled hypertension, and diabetes mellitus. The gender composition, the age (mean and standard deviation), and the neuropsychological scores (MMSE and DLMR) of the patients and controls with TCD and NIRS data (separate sets) are given in Table 1.
All measurements are non-invasive, safe, and comfortable for the subjects. The data were collected in a quiet, environmentally controlled laboratory under resting seated conditions. After 20 min of rest, 5-6 min recordings were made at an initial sampling rate of 1 KHz for (1) ABP measured continuously with finger photo-plethysmography (Finapres); (2) ETCO2 measured via a nasal cannula using capnography (Criticare Systems); (3) CBFV measured in the middle cerebral arteries using a 2 MHz TCD probe (Multiflow, DWL) placed over the temporal window and fixed at constant angle with a custom-made holder; (4) tissue oxygenation index (TOI), defined as the ratio of oxyhemoglobin to total hemoglobin multiplied by 100, measured via NIRS (Hamamatsu). Analysis was performed on usable data from two sets of patients and controls: (1) 20 healthy controls (10 male and 10 female) and 46 age-matched patients with amnestic MCI (17 male and 29 female) from whom ABP, ETCO2, and TCD data were collected; (2) 22 healthy controls (11 male and 11 female) and 43 age-matched patients with amnestic MCI (13 male and 30 female), from whom ABP, ETCO2, and NIRS data were collected. The reason for different numbers of MCI patients and controls with TCD or NIRS data is the presence of occasional gaps in some data-recordings that made them unusable for analysis. The results of analysis from the two sets (TCD versus NIRS data) were compared. The subjects in these two sets who had both TCD and NIRS usable recordings were 14 controls (5 female and 9 male) and 38 MCI patients (25 female and 13 male).
Data preprocessing
The collected sampled data of ABP, ETCO2, CBFV, and TOI were reduced to beat-to-beat time-series data using averages over the respective R-R intervals, after removal of occasional measurement artifacts through application of hard-clipping at±20% of average values. These beat-to-beat values were re-sampled every 0.25 s via cubic-spline interpolation and were high-pass filtered (via subtraction of a 2-min moving-average using a Hanning window) to remove the constant baseline and very low frequency trends below 0.01 Hz. The ETCO2 data were shifted by 1 s (to right) to compensate for the latency of the measurement apparatus. Figure 1 shows illustrative time-series data (both raw and pre-processed) for one of the control subjects over 5 min.
Modeling methods
For this modeling study, we employ the concept of PDMs to obtain compact dynamic models of the relationship between two input signals: ABP and ETCO2, and one output signal: either CBFV or TOI. The data collected from the control subjects in each set of groups (with TCD or NIRS data) were used to obtain the “global” PDMs that are utilized as the common “functional basis” for the estimation of data-based input-output models for the respective group of patients and controls, which are subsequently used for the computation of model-based indices that serve as potential “physiomarkers” in this study. The use of PDMs makes the obtained dynamic models compact and allows their accurate estimation from short data-records (5-6 min). The PDMs also facilitate the physiological interpretation of the obtained models as discussed below [42–46]. We briefly outline in the Supplementary Material the PDM-based modeling approach, which is intentionally limited to linear models in this study. For the many mathematical and computational details of Volterra-type modeling that forms the methodological foundation of PDM-based modeling, the reader is referred to the monograph [55] and to our recent publications presenting its application to cerebral hemodynamics [1, 2].
Four “global” PDMs were found to be adequate for each input in this application, whether the output is CBFV or TOI. The employed global PDMs represent a common “functional basis” for efficient representation of all kernels for all control subjects. Although the global PDMs are common for all control subjects, the estimated Gains that define the relative contribution of each global PDM output to the model prediction are subject-specific and can be used to characterize the cerebral hemodynamics of each subject with regard to the specific output analyzed (CBFV/TCD or TOI/NIRS). The same global PDMs are used for the modeling of the patient data, so that the resulting Gain estimates can quantify possible differences between controls and patients in the manner by which each PDM output affects the total model output.
RESULTS
Following the procedure outlined in Methods, we obtained the four “global” PDMs for the ABP and ETCO2 inputs, either from the reference set of 20 control subjects (10 male and 10 female) when the output is CBFV (measured via TCD) or from the reference set of 22 control subjects (11 male and 11 female) when the output is TOI (measured via NIRS). We note that there are 10 male and 5 female control subjects who have both TCD and NIRS measurements. The normalized mean-square error (NMSE) of the model prediction was generally smaller for the TCD/CBFV output (an average of about 37% versus an average of about 63% for NIRS/TOI output). An illustrative example of the quality of the model prediction is given in Fig. 2 for both types of output in the same control subject. It is evident that the prediction for the TCD-output model is better (NMSE of 26.6% for the TCD-output model versus 54.5% for the NIRS-output model).
The obtained PDMs for the ABP input are shown in Fig. 3 for the TCD/CBFV output (top panels) and for the NIRS/TOI output (bottom panels) in the time-domain (left panels) and frequency-domain (right panels). We observe that the global PDMs exhibit distinctive spectral characteristic in the form of resonant peaks that may attain importance for the physiological interpretation of the PDM-based model when the requisite knowledge becomes available. We also observe that the spectral peaks of the PDMs for the NIRS output are generally at lower frequencies and their memory extent is longer (about10 s for the TCD output versus 35 s for the NIRS output). The physiological interpretation of the waveforms of the obtained PDMs is potentially valuable, although it requires careful studies in thefuture.
The obtained four global PDMs for the ETCO2 input are shown in Fig. 4 for the TCD/CBFV output (top panels) and for the NIRS/TOI output (bottom panels) in the time-domain (left panels) and frequency-domain (right panels). We observe that the global PDMs exhibit distinctive resonant peaks that are generally found at lower frequencies for the NIRS output relative to the TCD output. The PDM memory extent for the NIRS output is again longer (about 50 s versus 30 s for the TCD output). As observed in our previous TCD studies, the dynamics of the ETCO2 PDMs are generally slower that the ABP PDMs.
As indicated in Methods, to obtain the linear PDM-based model for each subject, we must estimate the Gain of each PDM output for this subject through linear regression. These scalar Gains are distinct for each subject and can be used to quantify the dynamic cerebral autoregulation (DCA) and dynamic vasomotor reactivity (DVR) of each subject from the model predicted response to a step change in the respective input (ABP for DCA and ETCO2 for DVR). Such DCA and DVR indices can be obtained for the TCD and NIRS measurements separately. It is critical to note that the model-predicted response to a step change in one input is computed while the other input is kept at its baseline level (simulated clamping). The average of such model-predicted responses to unit input pulses are shown in Fig. 5 for the CBFV/TCD output and in Fig. 6 for the TOI/NIRS output, where the responses to the ABP input and ETCO2 input pulses are shown in the left and right panels, respectively. The average responses of the control subjects are shown with blue line and of the MCI patients are shown with red line. The reduced average dynamic CO2 vasomotor reactivity is evident in the MCI patients relative to the controls for both types of output, with the difference being more pronounced for the TOI/NIRS output. There are no discernible differences between controls and patients in their response to ABP input changes, suggesting that the process of cerebral autoregulation is not affected in MCI patients (see Discussion).
It is instructive to see the average Impulse Response Functions (or, equivalently, 1st order kernels) that are obtained for the 2×2 input-output combinations, along with one standard deviation bounds for the estimates from all controls and all MCI patients. Fig. 7 shows the average 1st order kernel estimates (± 1 SD bounds marked with dotted lines) over all controls (top panels) and MCI patients (bottom panels) for the ABP input (left panels) and ETCO2 input (right panels) when the output is CBFV/TCD. The average ABP-to-CBFV kernel for both controls and patients exhibits a positive peak at zero lag and a negative undershoot for lags of 1–3 s, consistent with previous studies of cerebral autoregulation in healthy subjects [1, 2]. The variance of these estimates is low. However, we observe distinctive differences in the average for the ETCO2-to-CBFV kernels for controls and patients, whereby the latter exhibits lower values in the early part (<2-3 s lag) in patients relative to controls. This, along with the smaller positive values over 3–30 s lags for the patients, quantifies the reduced average vasomotor reactivity in the MCI patients. We also observe higher variability for the ETCO2-to-CBFV kernels for both controls and patients, relative to the ABP-to-CBFV kernel estimates.
Figure 8 shows the average 1st order kernel estimates (± 1 SD bounds marked with dotted lines) over all controls (top panels) and MCI patients (bottom panels) for the ABP input (left panels) and ETCO2 input (right panels) when the output is TOI/NIRS. We observe significant differences in the average ABP-to-TOI and ETCO2-to-TOI kernels between controls and patients— with most significant being the early negative portion of the ETCO2-to-TOI kernel for the MCI patients, suggestive of reduced dynamic vasomotor reactivity (see Discussion). The variance of these estimates is comparable for the two inputs and larger for the TOI/NIRS output relative to the CBFV/TCD output.
We also wish to examine possible statistical differences in the estimated Gains of the PDM-based models and the resulting DCA/DVR indices between the groups of control subjects and amnestic MCI patients in the two sets of data with TCD/CBFV or NIRS/TOI output. For the TCD/CBFV output data, the estimated Gains of the PDM outputs for the ABP and ETCO2 inputs are shown in Tables 2 and 3, respectively. The Tables show the mean (standard deviation) values of the estimated Gains for 20 control subjects (10 male and 10 female) and 46 MCI patients (17 male and 29 female), along with the corresponding p-values for each PDM. The obtained p-values indicate that statistically significant differences between the estimated Gains for controls and patients exist only for the Gains of the 1st PDM of the ETCO2 input (p = 0.0210) for the TDC/CBFV output, whereby the controls exhibit significantly larger Gains, suggestive of DVR impairment in the MCI patients (see Discussion).
For the NIRS/TOI output data, the estimated Gains of the PDM outputs for the ABP and ETCO2 inputs are shown in Tables 4 and 5, respectively. The Tables show the mean (standard deviation) values of the estimated Gains for 22 control subjects (11 male and 11 female) and 43 MCI patients (13 male and 30 female), along with the corresponding p-values for each PDM. The obtained p-values indicate that statistically significant differences between the estimated Gains for controls and patients exist only for the Gains of the 1st and 4th PDMs of the ETCO2 input (p = 0.0226 and p = 0.0358, respectively) for the TOI/NIRS output, whereby the controls exhibit significantly larger Gains, suggestive of DVR impairment in the MCI patients (see Discussion). The p-values for the Gains of the 1st PDM of the ETCO2 input are comparable for TCD and NIRS output, suggesting that the two types of measurements exhibit similar differentiation ability between controls and patients. However, the TOI output measurement also allows additional differentiation between controls and patients based on the Gains of the 4th PDM of the ETCO2 input (see Table 5). We note that the 1st PDMs of ETCO2 for the two types of output have integrative characteristics (see Discussion).
We propose the use of model-based indices of DCA and DVR for each subject/patient that may be used (when fully validated) for diagnostic and/or prognostic purposes. The rationale for these indices is provided by the differences observed in Figs. 5 and 6 between the average model-predicted responses of patients versus controls to pulse changes in each of the inputs (ABP or ETCO2). They are computed via simulation of the PDM-based model derived for each subject/patient for unit pulse inputs of ABP or ETCO2 (for DCA and DVR, respectively, while the other input remains at baseline) as follows:
– DCA index: the PDM-based model of the subject/patient is simulated for a unit ABP input pulse, while the ETCO2 input is kept at zero, and the resulting response (CBFV or TOI) is used to compute the DCA index as the difference of the peak response value minus the steady-state value at 10 sec, according to the schematic in Fig. 9 (left panel).
– DVR index: the PDM-based model of the subject/patient is simulated for a unit ETCO2 input pulse, while the ABP input is kept at zero, and the resulting response (CBFV or TOI) is used to compute the DVR index as the time-averaged response over the first 5 s, according to the schematic in Fig. 9 (right panel).
The computed model-based DCA and DVR indices for the two types of outputs are reported in Tables 6, 7 and indicate statistically significant differences between controls and patients only for the DVR index for both types of output. This is consistent with the observed statistically significant differences in the Gains of the 1st PDM of the ETCO2 input for both outputs, although the NIRS data also yielded statistically different Gains for the 4th PDM of the ETCO2 input. The resulting p-values (0.0476 for TCD-DVR and 0.0050 for NIRS-DVR) imply stronger differentiation capability using these indices compared to the Gains.
An interesting question arises as to whether the two indices (DCA and DVR), derived from the same type of output (CBFV/TCD or TOI/NIRS), contain independent information. This question is addressed in the scatter-plots of Fig. 10 for each type of output, where the two indices are shown to have greater correlation for the CBFV/TCD output (left panel). The correlation coefficient between the TCD indices is 0.361 (p = 0.0028) and between the NIRS indices is 0.028 (p = 0.8239).
Since the DVR indices for both types of output appear to have greater ability to delineate patients from controls (see Tables 6 and 7), we examine in Fig. 11 whether a possible combination of the TCD-DVR and NIRS-DVR indices could improve further the delineation between the 14 controls (5 female and 9 male), marked with blue circles, and the 38 patients (25 female and 13 male), marked with red triangles, who have both TCD and NIRS recordings. The scatter-plots of Fig. 11 indicate that the combinations corresponding to the dashed lines separating the two groups would yield better delineation between patients and controls. In the left panel, the separation line is the Fisher Linear Discriminant that yields the lowest p-value (p = 0.0044) under the Gaussian assumption for the underlying distributions of the two groups. In the right panel, the separation line (termed “diagnostic boundary”) is determined by an iterative optimization algorithm that minimizes an exponentially weighted sum of false-negatives and false-positives (4 false-negatives and 4 false-positives) and corresponds to a p-value of 0.0049. Since we do not know the actual underlying distributions of the two groups, we favor the latter selection (the Diagnostic boundary determined by the optimization algorithm), which also yields a decent p-value.
Another interesting question pertains to the correlation between the DVR indices (TCD-DVR or NIRS-DVR) and the scores of neuropsychiatric tests for the patients. Figure 12 shows the scatter-plots of the two types of indices versus the Delayed Logical Memory Recall scores.
DISCUSSION
The main thesis of our work on modeling cerebral hemodynamics is that there exists a rigorous, reliable and practical methodology to extract model-based “physiomarkers” of dynamic vasomotor reactivity (DVR) and dynamic cerebral autoregulation (DCA), with potential diagnostic/prognostic utility, using non-invasive beat-to-beat data that can be recorded reliably, safely and comfortably for the patient.
The continuously recorded data over 5-6 min typically include ABP, ETCO2, CBFV measured at the middle cerebral arteries via TCD, and TOI measured at the prefrontal cortex via NIRS. Initially, we explored the diagnostic utility of such model-based “physiomarkers” of DCA and DVR, extracted from ABP, ETCO2, and CBFV/TCD data that were collected for three pathologies (and age-matched controls): (1) early-stage AD [1], (2) amnestic MCI [2], and (3) hypertension-related executive dysfunction [57]. Our initial results have shown that the model-based physiomarker DVR indicates significant impairment of dynamic vasomotor reactivity in all three pathologies at different degrees of severity as quantified by the values of the DVR index, suggesting potential diagnostic utility [1, 2, 57]. Previous studies had shown that the progression of cognitive impairment in patients with AD (or other forms of dementia and neurodegenerative disease) is associated with impairment of cerebral vasomotor reactivity to hypercapnia [3–15].
The enabling methodological element of the proposed approach is the concept of PDMs that we have pioneered in order to obtain dual-input or triple-input dynamic models (linear or nonlinear) of cerebral hemodynamics (entailing the processes of dynamic cerebral flow autoregulation and CO2 vasomotor reactivity) in the practical context of relatively short data-records and low signal-to-noise ratio [1, 2, 49, 50, 53, 54]. In addition to offering the potential diagnostic value of model-based physiomarkers, this model can advance our quantitative understanding of the mechanisms subserving these physiological processes. This is pursued primarily through matching the observed dynamics of the PDMs with the specific dynamics of the mechanisms of interest (to the extent the latter are known). This task can be greatly assisted by specialized data collections from “subtractive experimentation” (i.e., the pharmacological blocking of a mechanism of interest) within the constraints of clinical practice.
The contribution of this paper is in presenting results obtained from amnestic MCI patients and age-matched controls that examine whether the use as output signal of the TCD-measured CBFV or the NIRS-measured TOI yield reliable and consistent results in terms of model-based physiomarkers of DVR that allow differentiation of MCI patients from age-matched healthy controls. This study is also motivated by the fact that NIRS measurements are easier to implement in a clinical setting than TCD measurements and, furthermore, can be combined concurrently with other modalities (MRI) in order to gain greater insight into the hemodynamics of various brain regions that are affected by the disease. The results of this study suggest that this may indeed be feasible. The key results are discussed below.
Impaired dynamic CO2 vasomotor reactivity in amnestic MCI patients is indicated by the model-based physiomarker DVR obtained from hemodynamic TCD or NIRS beat-to-beat output data
In previous studies using CBFV/TCD output signals, we found that the model-based DVR index is significantly smaller (p < 0.05) for AD, amnestic MCI, and executive-dysfunction patients relative to age-matched controls [1, 2, 57]. However, the model-based DCA index is not significantly different in those patients relative to age-matched controls (p > 0.05). In the present study, we found again that the model-based DVR index is significantly smaller for this larger cohort (46 patients versus 22 patients previously) of amnestic MCI patients relative to age-matched controls, whether the utilized output signal is CBFV/TCD (p = 0.0476) or TOI/NIRS (p = 0.0050), as reported in Tables 6 and 7. This key result is further demonstrated by the significant differences observed in the average 1st order kernels shown in Figs. 7 and 8. The observed differences in the kernels of the ETCO2 input are far more pronounced for short lags (<3 s for the TCD-output kernels and < 7 s for the NIRS-output kernels), which suggests that the biological mechanism more severely altered by MCI has fast dynamics – although some effects are seen for longer lags as well.
Comparison of estimated Gains of PDM contributions to the output prediction (CBFV or TOI) for controls and patients
It is informative to examine the estimated Gains of the various PDM contributions to the model-predicted output (CBFV or TOI). Of particular interest is the comparison of these Gains for statistically significant differences between patients and controls. As indicated in Tables 2 and 3 reporting the average (and standard deviation) values of the estimated Gains in the case of the CBFV output, the only PDM Gain that was found to have statistically significant difference between patients and controls is the 1st PDM of the ETCO2 input (p = 0.0210). The estimated Gains of this PDM contribution are much smaller for the MCI patients relative to controls (about half on the average, see Table 3). This is consistent with previously reported findings of reduced DVR in AD and MCI patients [1, 2]. For the TOI output, the only PDM Gains that have statistically significant differences between patients and controls are the 1st and the 4th PDM of the ETCO2 input (p = 0.0226 and p = 0.0358, respectively) as shown in Table 5. For both types of output signal (CBFV/TCD or TOI/NIRS), the 1st PDM of the ETCO2 input indicates a prolonged rise in output values following an increase of ETCO2 input. This is the expected response of CO2 vasomotor reactivity, which is found to be reduced in the MCI patients (as quantified by the respective DVR indices). We note that the 4th PDM of the ETCO2 input for TOI output exhibits a strong resonance around 0.05 Hz (see black trace in bottom-right panel of Fig. 4), which is also seen in the 4th PDM of the ETCO2 input for CBFV output (with a slight shift in frequency and phase). The physiological mechanisms that underlie these PDMs are not known at this time and represent an important objective for future studies, since their proper identification will allow potential therapeutic treatments of this aberrant condition associated with MCI.
The DCA and DVR indices for TCD or NIRS output contain different information, and the two DVR indices can be combined into a “composite DVR index” of greater diagnostic utility
In order to assess whether the TCD-based and NIRS-based indices of DCA and DVR contain different information about the cerebral hemodynamics, we show in Fig. 10 scatter-plots of the obtained indices for patients and controls using the two types of output measurement (left: TCD, right: NIRS). These scatter-plots show greater correlation between DCA and DVR for the TCD output. Since the DVR indices are the differentiating ones between patients and controls for both types of output (see Tables 6 and 7) and they do not contain identical information (since the TCD is measured in the middle cerebral arteries and the NIRS is measured in a local vascular bed composed of arterioles, venules, and capillary space of the prefrontal cortex (smaller vessels compared with the middle cerebrsal arteries) and probably different mechanisms of vasoresactivity), we explore in the scatter-plots of Fig. 11 whether a “composite DVR index” may allow greater delineation of controls from patients. Indeed, the scatter-plots of Fig. 11 indicate that the combinations corresponding to the putative dashed lines separating the two groups in the two panels would yield better delineation between patients and controls, because they are neither horizontal nor vertical. In the left panel, the separation line is the Fisher Linear Discriminant that yields the lowest p-value (p = 0.0044) under the Gaussian assumption for the underlying distributions of the two groups. In the right panel, the separation line (termed “diagnostic boundary”) is determined by an iterative optimization algorithm that minimizes an exponentially weighted sum of false-negatives and false-positives (3 false-negatives and 3 false-positives) yielding a p-value of 0.00495. Since we do not know whether the actual underlying distributions of the two groups are Gaussian, we favor the latter selection (the diagnostic boundary determined by the optimization algorithm), which also yields the best classification result (3 false-positives and 3 false-negatives).
It may be useful to comment on the distinction between the advocated approach and the autoregulation index (ARI) that has been used extensively in studies of cerebral autoregulation to date. The ARI is based on Tieck’s model, which is a second-order differential equation (properly discretized for practical application) between an arterial pressure forcing (input) and the resultant blood flow velocity (output). As such, it is an autoregressive model/equation that stands in contrast (mathematical, computational, and conceptual) to the kernel/PDM approach used in this paper that is not autoregressive. The ARI is derived from the best fit of the actual measurement (based on Tieck’s model) to one of ten template response functions. The model-based indices that are proposed in this paper result from a computation of the kernel-based (or, equivalently, the PDM-based) model prediction to a pressure-input pulse. Most importantly, the proposed indices result from the analysis of a two-input model that takes into account the concurrent effects of ETCO2 changes (during the kernel/PDM estimation process) and, consequently, leads to significantly different results.
In closing, we emphasize that, although the presented initial results are promising, a larger population of MCI patients and control subjects must be examined before any firm conclusions are drawn regarding the potential clinical utility of the proposed model-based physiomarkers. Of particular importance is the question of specificity versus sensitivity that will allow delineation among various cerebrovascular diseases using the model-based DVR and DCA indices. It is also important to explore whether the numerical values of the DVR index can offer reliable quantitative measures of the stage of the amnestic MCI disease in order to be used for assessing and monitoring the effects of treatment over time.
ACKNOWLEDGMENTS
This work was supported in part by the Biomedical Simulations Resource at the University of Southern California under NIH/NIBIB grant P41-EB001978 and NIA R01AG033106-01 grant to the UT-SWMC.
Authors’ disclosures available online (http://j-alz.com/manuscript-disclosures/16-1004).
Appendices
The supplementary material is available in the electronic version of this article: http://dx.doi.org/10.3233/JAD-161004.
REFERENCES
[1] | Marmarelis VZ , Shin DC , Orme ME , Zhang R ((2013) ) Model-based quantification of cerebral hemodynamics as a physiomarker for Alzheimer’s disease? Ann Biomed Eng 41: , 2296–2317. |
[2] | Marmarelis VZ , Shin DC , Orme ME , Zhang R ((2014) ) Model-based physiomarkers of cerebral hemodynamics in patients with mild cognitive impairment. Med Eng Phys 36: , 628–637. |
[3] | Sellke FW , Seshadri S , Chui HC , Higashida RT , Lindquist R , Nilsson PM , Roman GC , Petersen RC , Schneider JA , Tzourio C , Arnett DK , Bennett D , Iadecola C , Launer LJ , Laurent S , Lopez OL , Nyenhuis D , Gorelick PB , Scuteri A , Black SE , DeCarli C , Greenberg SM ((2011) ) Vascular contributions to cognitive impairment and dementia: A statement for healthcare professionals from the AHA/ASA. Stroke 42: , 2672–2713. |
[4] | Silvestrini M , Pasqualetti P , Baruffaldi R , Bartolini M , Handouk Y , Matteis M , Moffa F , Provinciali L , Vernieri F ((2006) ) Cerebrovascular reactivity and cognitive decline in patients with Alzheimer’s disease. Stroke 37: , 1010–1015. |
[5] | de la Torre JC ((2002) ) Alzheimer disease as a vascular disorder. Nosological evidence. Stroke 33: , 1152–1162. |
[6] | Iadecola C ((2003) ) Cerebrovascular effects of amyloid-beta peptides: Mechanisms and implications for Alzheimer’s dementia. Cell Mol Neurobiol 23: , 681–689. |
[7] | Iadecola C , Gorelick PB ((2003) ) Converging pathogenic mechanisms in vascular and neurodegenerative dementia. Stroke 34: , 335–337. |
[8] | Hachinski V , Iadecola C ((2004) ) Vascular cognitive impairment: Introduction. Stroke 35: , 2615. |
[9] | Bowler JV ((2003) ) Acetylcholinesterase inhibitors for vascular dementia and Alzheimer’s disease combined with cerebrovascular disease. Stroke 34: , 584–586. |
[10] | Kalaria RN ((2002) ) Small vessel disease and Alzheimer’s dementia: Pathological considerations. Cerebrovasc Dis 13: , 48–52. |
[11] | Murray IVJ , Proza JF , Sohrabji F , Lawler JM ((2011) ) Vascular and metabolic dysfunction in Alzheimer’s disease: A review. Exp Biol Med 236: , 772–782. |
[12] | Bell RD , Zlokovic BV ((2009) ) Neurovascular mechanisms and blood-brain barrier disorder in Alzheimer’s disease. Acta Neuropathol 118: , 103–113. |
[13] | Nicolakakis N , Hamel E ((2011) ) Neurovascular function in Alzheimer’s disease patients and experimental models. J Cereb Blood Flow Metab 31: , 1354–1370. |
[14] | Tong XK , Nicolakakis N , Kocharyan A , Hamel E ((2005) ) Vascular remodeling versus amyloid beta-induced oxidative stress in the cerebrovascular dysfunction associated with Alzheimer’s disease. J Neurosci 25: , 11165–11174. |
[15] | Gorelick PB ((2004) ) Risk factors for vascular dementia and Alzheimer disease. Stroke 35: , 2620–2622. |
[16] | Smith EE , Greenberg SM ((2009) ) Amyloid-beta, blood vessels and brain function. Stroke 40: , 2601–2606. |
[17] | Maeda H , Matsumoto M , Handa N , Hougaku H , Ogawa S , Itoh T , Tsukamoto Y , Kamada T ((1993) ) Reactivity of cerebral blood flow to carbon dioxide in various types of ischemic cerebrovascular disease: Evaluation by the transcranial Doppler method. Stroke 24: , 670–675. |
[18] | Tantucci C , Bottini P , Fiorani C , Dottorini ML , Santeusanio F , Provinciali L , Sorbini CA , Casucci G ((2001) ) Cerebrovascular reactivity and hypercapnic respiratory drive in diabetic autonomic neuropathy. J Appl Physiol 90: , 889–896. |
[19] | Cupini LM , Diomedi M , Placidi F , Silvestrini M , Giacomini P ((2001) ) Cerebrovascular reactivity and subcortical infarctions. Arch Neurol 58: , 577–581. |
[20] | Schneider JA , Wilson RS , Bienias JL , Evans DA , Bennett DA ((2004) ) Cerebral infarctions and the likelihood of dementia from Alzheimer disease pathology. Neurology 62: , 1148–1155. |
[21] | Aaslid R , Lindegaard KF , Sorteberg W , Nornes H ((1989) ) Cerebral autoregulation dynamics in humans. Stroke 20: , 45–52. |
[22] | Giller CA ((1990) ) The frequency-dependent behavior of cerebral autoregulation. Neurosurgery 27: , 362–368. |
[23] | Larsen FS , Olsen KS , Hansen BA , Paulson OB , Knudsen GM ((1994) ) Transcranial Doppler is valid for determination of the lower limit of cerebral blood flow autoregulation. Stroke 25: , 1985–1988. |
[24] | Newell DW , Aaslid R , Lam A , Mayberg TS , Winn HR ((1994) ) Comparison of flow and velocity during dynamic autoregulation testing in humans. Stroke 25: , 793–797. |
[25] | Tiecks FP , Lam AM , Aaslid R , Newell DW ((1995) ) Comparison of static and dynamic cerebral autoregulation measurements. Stroke 26: , 1014–1019. |
[26] | Czosnyka M , Piechnik S , Richards H , Kirkpatrick P , Smielewski P , Pickard J ((1997) ) Contribution of mathematical modeling to the interpretation of bedside tests of cerebrovascular autoregulation. J Neurol Neurosurg Psychiatry 63: , 721–731. |
[27] | Zhang R , Zuckerman JH , Giller CA , Levine BD ((1998) ) Transfer function analysis of dynamic cerebral autoregulation in humans. Am J Physiol 274: , 233–241. |
[28] | Panerai RB , Dawson SL , Potter JF ((1999) ) Linear and nonlinear analysis of human dynamic cerebral autoregulation. Am J Physiol 277: , H1089–H1099. |
[29] | Panerai RB , Simpson DM , Deverson ST , Mahony P , Hayes P , Evans DH ((2000) ) Multivariate dynamic analysis of cerebral blood flow regulation in humans. IEEE Trans Biomed Eng 47: , 419–423. |
[30] | Zhang R , Zuckerman JH , Iwasaki K , Wilson TE , Crandall CG , Levine BD ((2002) ) Autonomic neural control of dynamic cerebral autoregulation in humans. Circulation 106: , 1814–1820. |
[31] | Giller CA , Mueller M ((2003) ) Linearity and nonlinearity in cerebral hemodynamics. Med Eng Phys 25: , 633–646. |
[32] | Novak V , Yang AC , Lepicovsky L , Goldberger AL , Lipsitz LA , Peng CK ((2004) ) Multimodal pressure-flow method to assess dynamics of cerebral autoregulation in stroke and hypertension. Biomed Eng Online 3: , 39. |
[33] | Panerai RB ((2008) ) Cerebral autoregulation: From models to clinical applications. Cardiovasc Eng 8: , 42–59. |
[34] | van Beek AH , Claassen JA , Rikkert MG , Jansen RW ((2008) ) Cerebral autoregulation: Overview of current concepts and methodology with special focus on the elderly. J Cereb Blood Flow Metab 28: , 1071–1085. |
[35] | Czosnyka M , Brady K , Reinhard M , Smielewski P , Steiner L ((2009) ) Monitoring of cerebrovascular autoregulation: Facts, myths and missing links. Neurocrit Care 10: , 373–386. |
[36] | Gommer ED , Shijaku E , Mess WH , Reulen JP ((2010) ) Dynamic cerebral autoregulation: Different signal processing methods without influence on results and reproducibility. Med Biol Eng Comput 48: , 1243–1250. |
[37] | Tzeng YC , Ainslie PN , Cooke WH , Peebles KC , Willie CK , MacRae BA , Smirl JD , Horsman HM , Rickards CA ((2012) ) Assessment of cerebral autoregulation: The quandary of quantification. Am J Physiol Heart Circ Physiol 303: , H658–H671. |
[38] | van Beek AH , Lagro J , Olde-Rikkert MG , Zhang R , Claassen JA ((2012) ) Oscillations in cerebral blood flow and cortical oxygenation in Alzheimer’s disease. Neurobiol Aging 33: , 428.e21–31. |
[39] | Tan CO ((2012) ) Defining the characteristic relationship between arterial pressure and cerebral flow. J Appl Physiol 113: , 1194–1200. |
[40] | Tan CO , Hamner JW , Taylor JA ((2013) ) The role of myogenic mechanisms in human cerebrovascular regulation. J Physiol 591: , 5095–5105. |
[41] | Tan CO , Taylor JA ((2014) ) Integrative physiological and computational approaches to understand autonomic control of cerebral autoregulation. Exp Physiol 99: (1), 3–15. |
[42] | Kiyoshi N , Kazama K , Younkin L , Younkin SG , Carlson GA , Iadecola C ((2002) ) Cerebrovascular autoregulation is profoundly impaired in mice overexpressing amyloid precursor protein. Am J Physiol Heart Circ Physiol 283: , H315–H323. |
[43] | Claassen JA , Diaz-Arrastia R , Martin-Cook K , Levine BD , Zhang R ((2009) ) Altered cerebral hemodynamics in early Alzheimer disease: A pilot study using transcranial Doppler. J Alzheimers Dis 17: , 621–629. |
[44] | Claassen JA , Zhang R ((2011) ) Cerebral autoregulation in Alzheimer’s disease. J Cereb Blood Flow Metab 31: , 1572–1577. |
[45] | Mitsis GD , Zhang R , Levine BD , Marmarelis VZ ((2002) ) Modeling of nonlinear physiological systems with fast and slow dynamics II: Application to cerebral autoregulation. Ann Biomed Eng 30: , 555–565. |
[46] | Mitsis GD , Poulin MJ , Robbins PA , Marmarelis VZ ((2004) ) Nonlinear modeling of the dynamic effects of arterial pressure and CO2 variations on cerebral blood flow in healthy humans. IEEE Trans Biomed Eng 51: , 1932–1943. |
[47] | Mitsis GD , Zhang R , Levine BD , Marmarelis VZ ((2006) ) Cerebral hemodynamics during orthostatic stress assessed by nonlinear modeling. J Appl Physiol 101: , 354–366. |
[48] | Mitsis GD , Zhang R , Levine BD , Tzanalaridou E , Katritsis DG , Marmarelis VZ ((2009) ) Nonlinear analysis of autonomic control of cerebral hemodynamics. IEEE Eng Med Biol 28: , 54–62. |
[49] | Marmarelis VZ , Shin DC , Zhang R ((2012) ) Linear and nonlinear modeling of cerebral flow autoregulation using Principal Dynamic Modes. Open Biomed Eng J 6: , 42–55. |
[50] | Marmarelis VZ , Shin DC , Orme ME , Zhang R ((2013) ) Closed-loop dynamic modeling of cerebral hemodynamics. Ann Biomed Eng 41: , 1029–1048. |
[51] | Marmarelis VZ , Shin DC , Orme ME , Zhang R ((2014) ) Time-varying dynamic modeling of cerebral hemodynamics. IEEE Trans Biomed Eng 61: , 1–11. |
[52] | Lassen NA ((1959) ) Cerebral blood flow and oxygen consumption in man. Physiol Rev 39: , 183–238. |
[53] | Marmarelis VZ ((1997) ) Modeling methodology for nonlinear physiological systems. Ann Biomed Eng 25: , 239–251. |
[54] | Marmarelis VZ ((2004) ) Nonlinear Dynamic Modeling of Physiological Systems. Wiley-Interscience & IEEE Press. |
[55] | Petersen RC , Doody R , Kurz A , Mohs RC , Morris JC , Rabins PV , Ritchie K , Rossor M , Thal L , Winblad B ((2001) ) Current concepts in mild cognitive impairment. Arch Neurol 58: , 1985–1992. |
[56] | Marmarelis VZ ((1993) ) Identification of nonlinear biological systems using Laguerre expansions of kernels. Ann Biomed Eng 21: , 573–589. |
[57] | Hajjar I , Marmarelis VZ , Shin DC , Chui H ((2014) ) Assessment of cerebrovascular reactivity during resting state breathing and its correlation with cognitive function in hypertension. Vasc Dis 38: , 10–16. |
Figures and Tables
Fig.1
Illustrative time-series data over about 5 min for one control subject, representing beat-to-beat spontaneous variations of CBFV (top panel), TOI (2nd panel), ABP (3rd panel), and ETCO2 (bottom panel) before (left column) and after (right column) pre-processing. The units are: cm/s for CBFV, % for TOI, and mmHg for ABP and ETCO2.
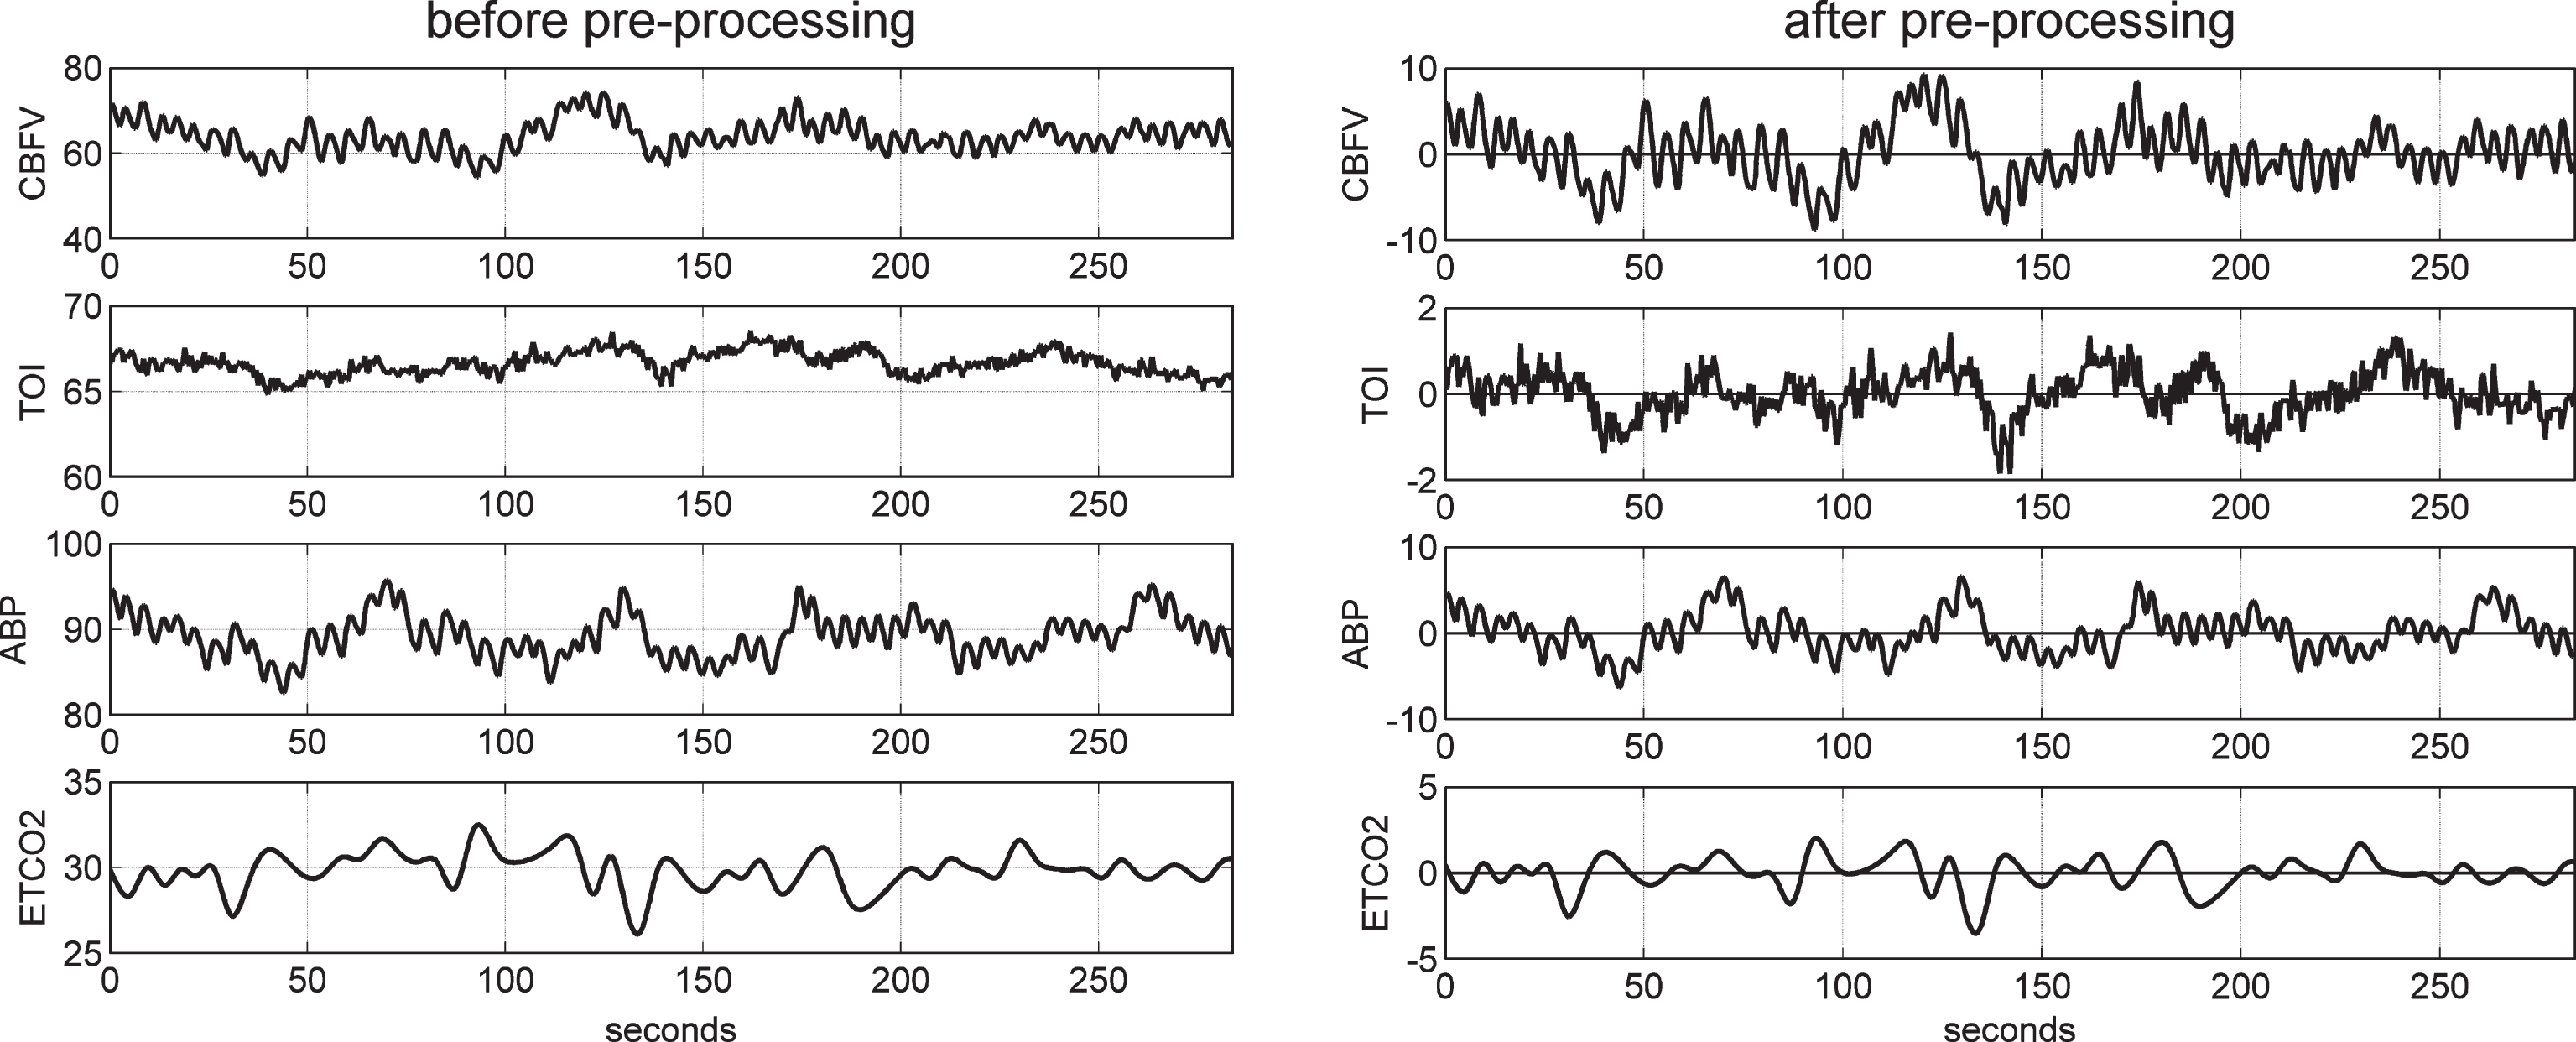
Fig.2
Illustrative example of the model prediction for the TCD-output model (left) and the NIRS-output model (right) in control subject #1. It is evident that the prediction for the TCD-output model is better (NMSE of 26.6% for the TCD-output model versus 54.5% for the NIRS-output model).
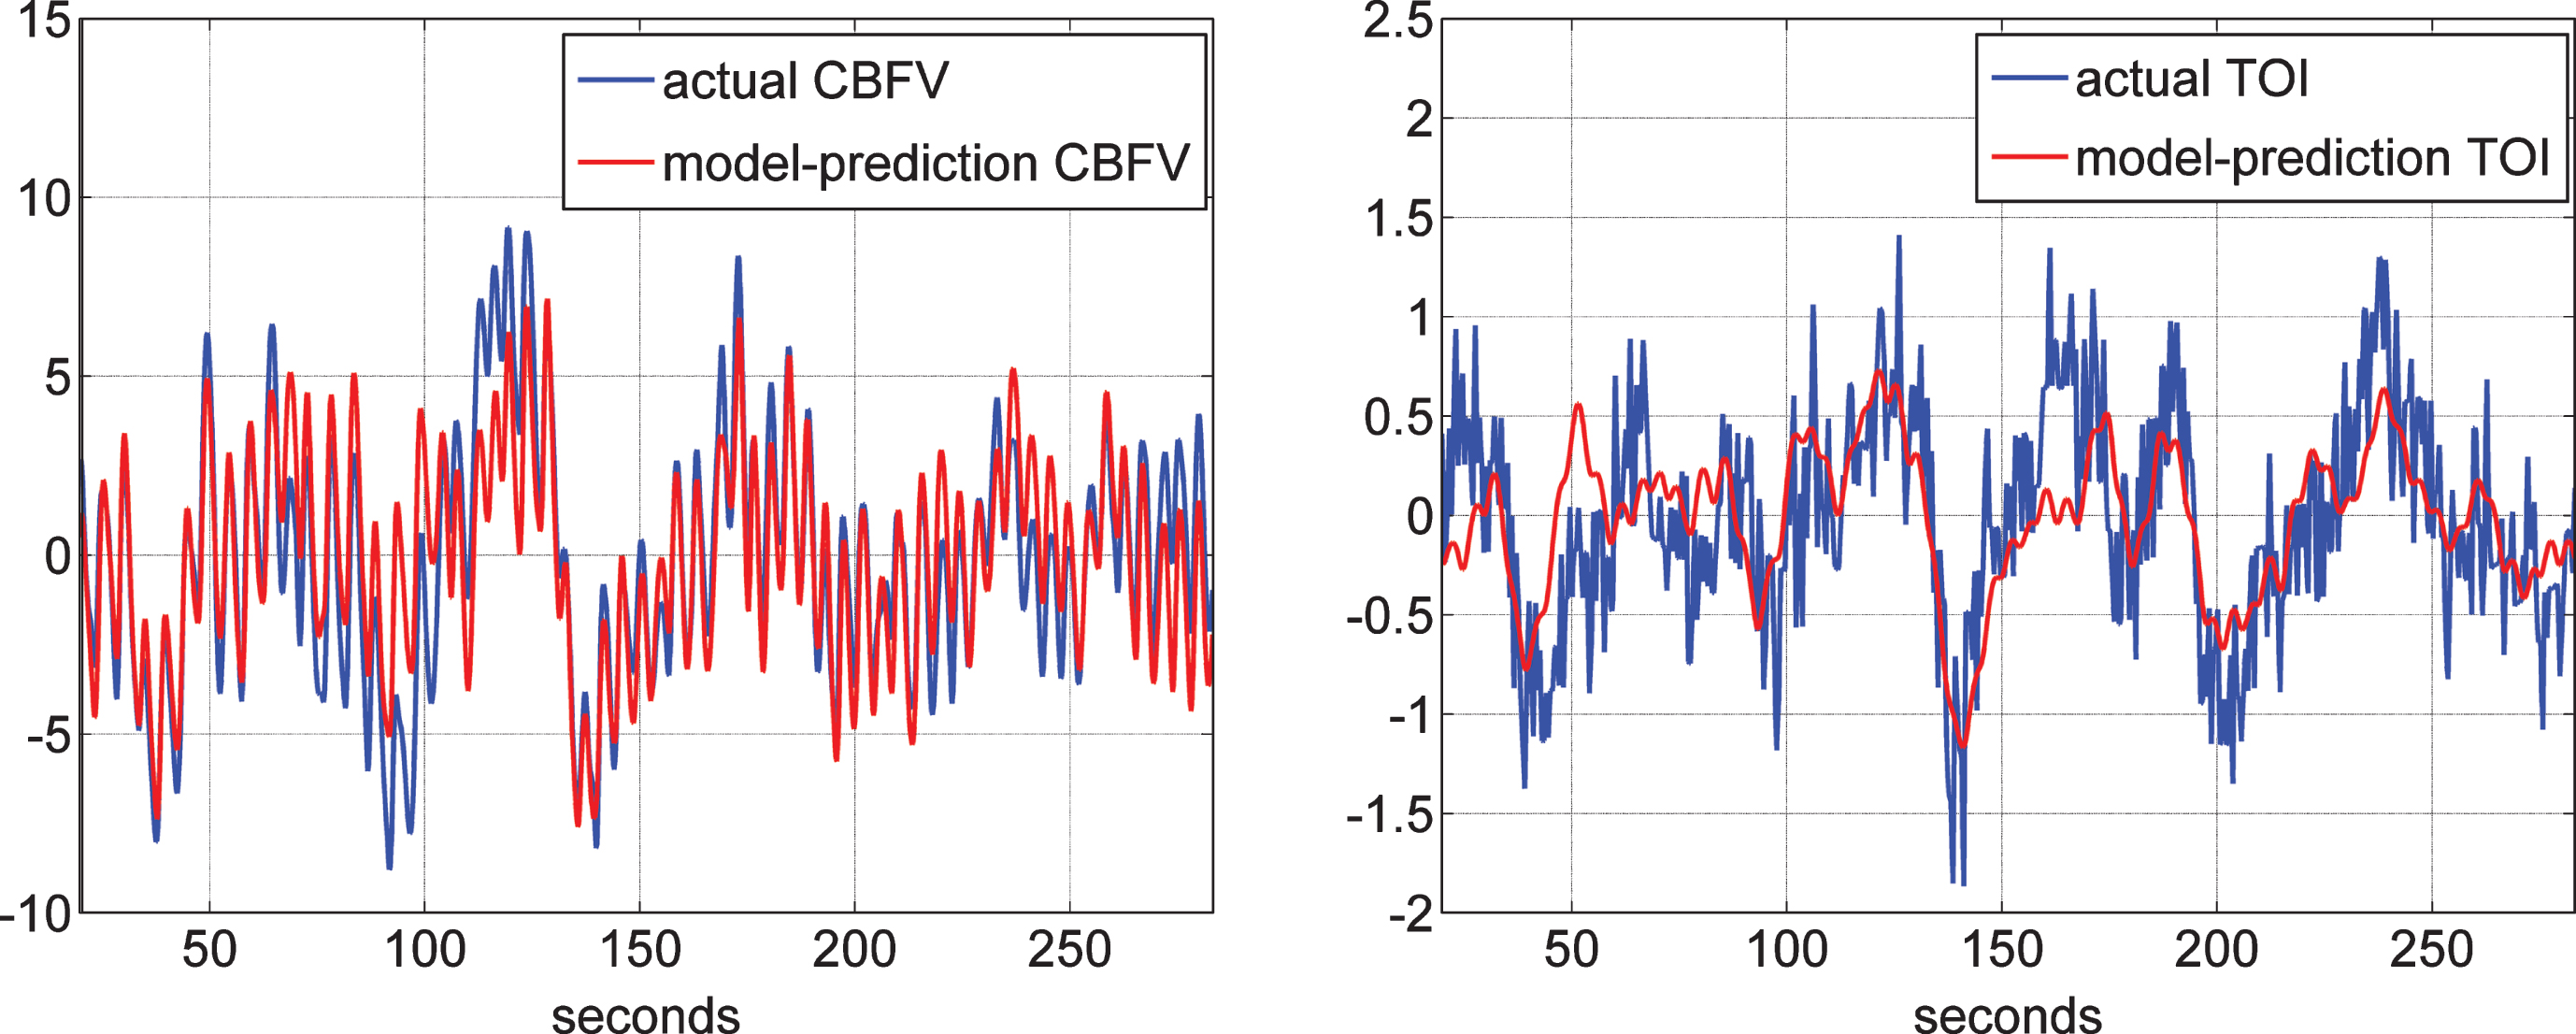
Fig.3
The four global PDMs for the ABP input obtained from the data of 20 control subjects (10 male and 10 female) for the CBFV output measured via TCD (top) and from the data of 22 control subjects (11 male and 11 female) for the TOI output measured via NIRS (bottom) in the time-domain (left) and frequency-domain (right).
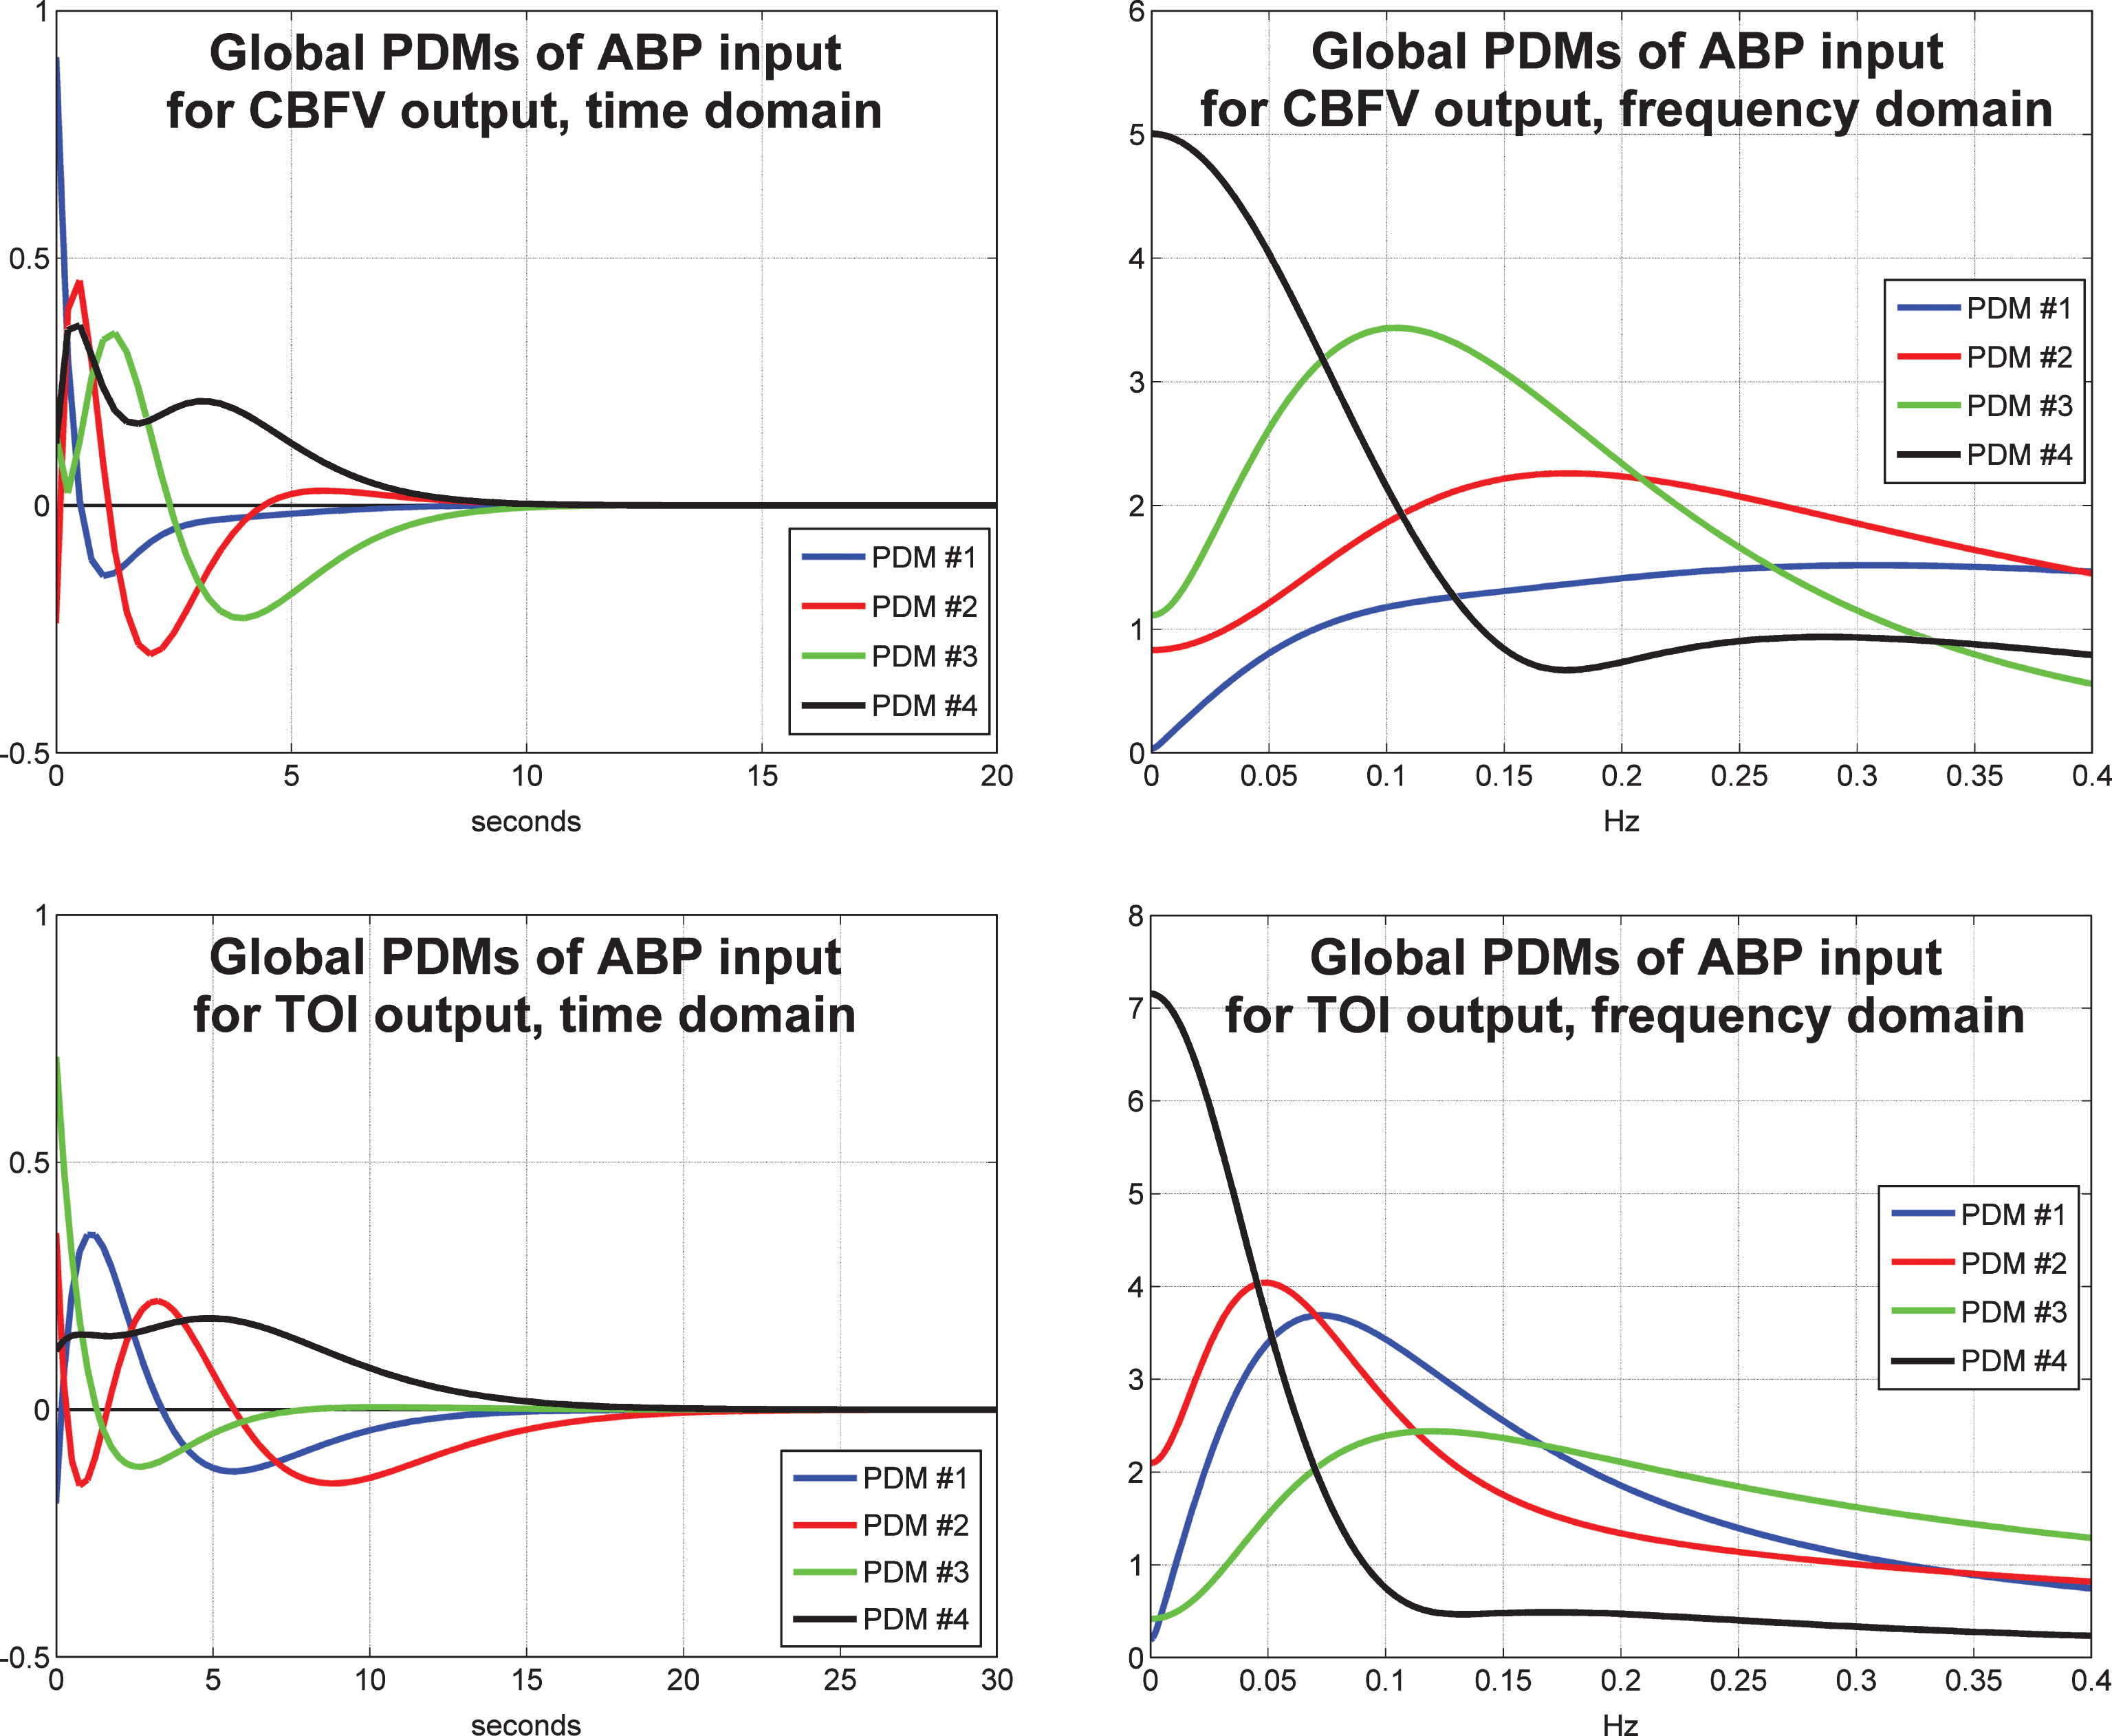
Fig.4
The four global PDMs for the ETCO2 input obtained from the data of 20 control subjects (10 male and 10 female) for the CBFV output measured via TCD (top) and from the data of 22 control subjects (11 male and 11 female) for the TOI output measured via NIRS (bottom) in the time-domain (left) and frequency-domain (right).
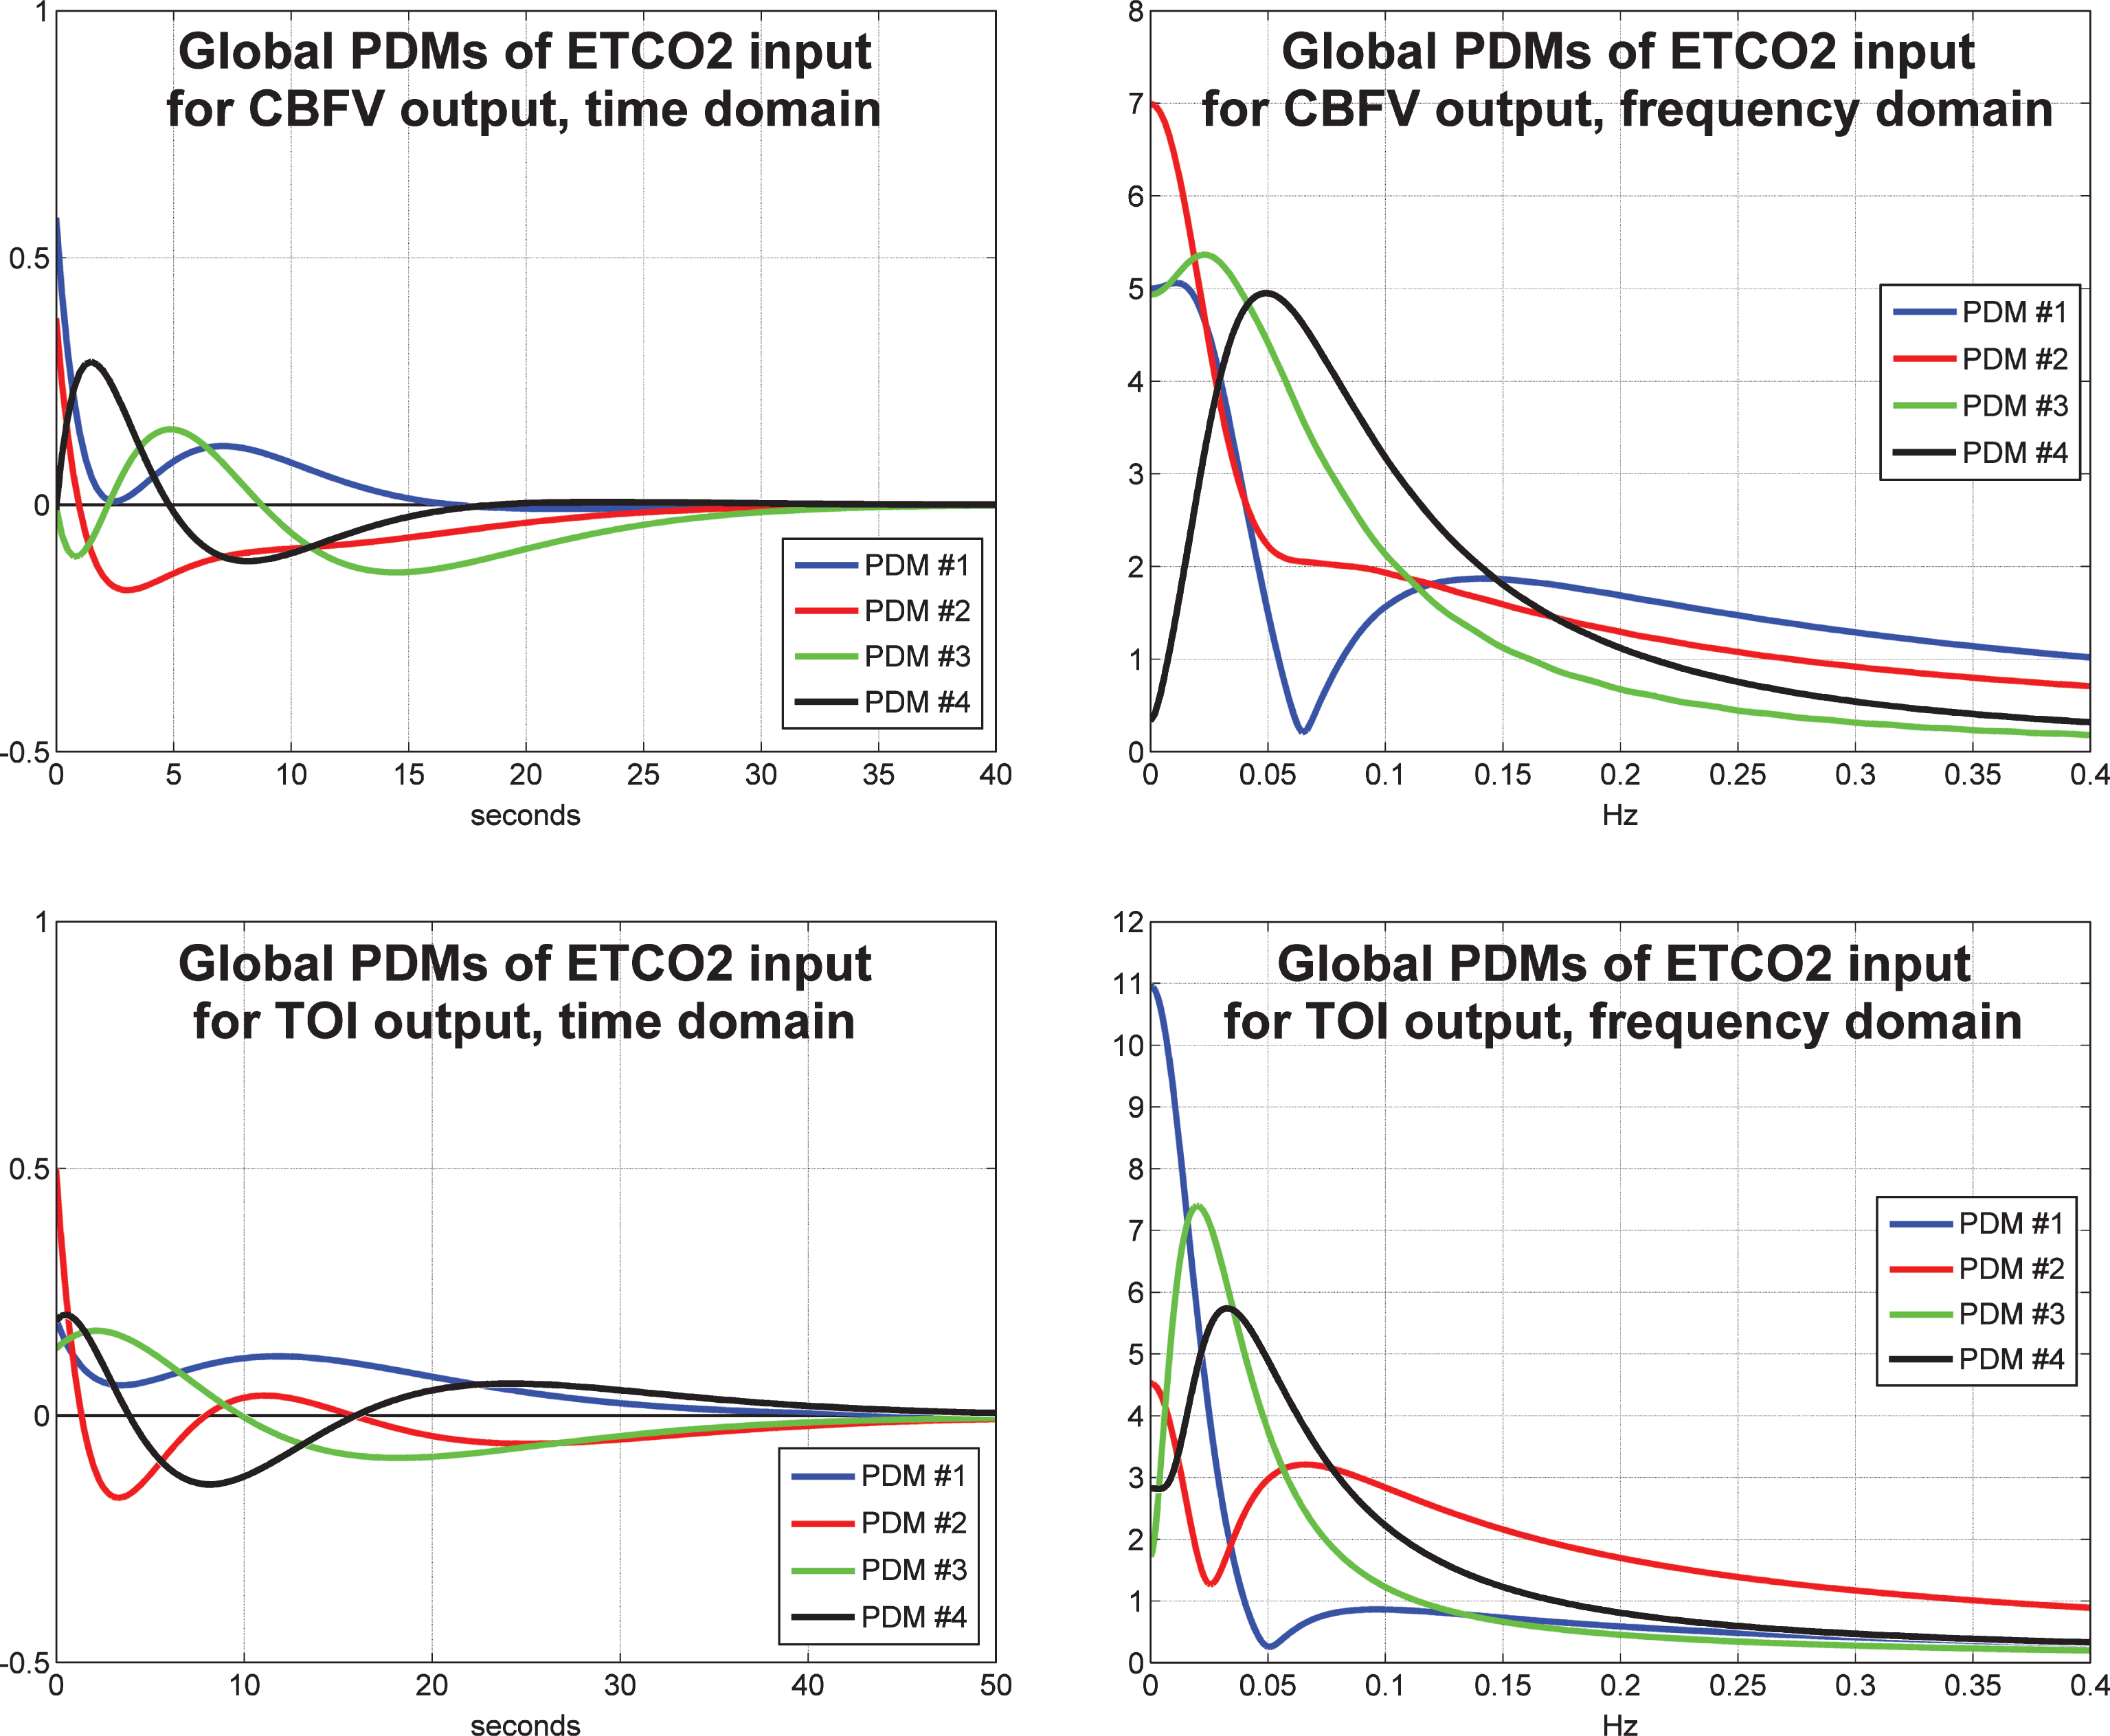
Fig.5
Average model-predicted CBFV/TCD responses for all control subjects (blue line) and for all MCI patients (red line) to a unit pulse change (dotted line) of the ABP input (left panel) and of the ETCO2 input (right panel), while the other input is kept at baseline.
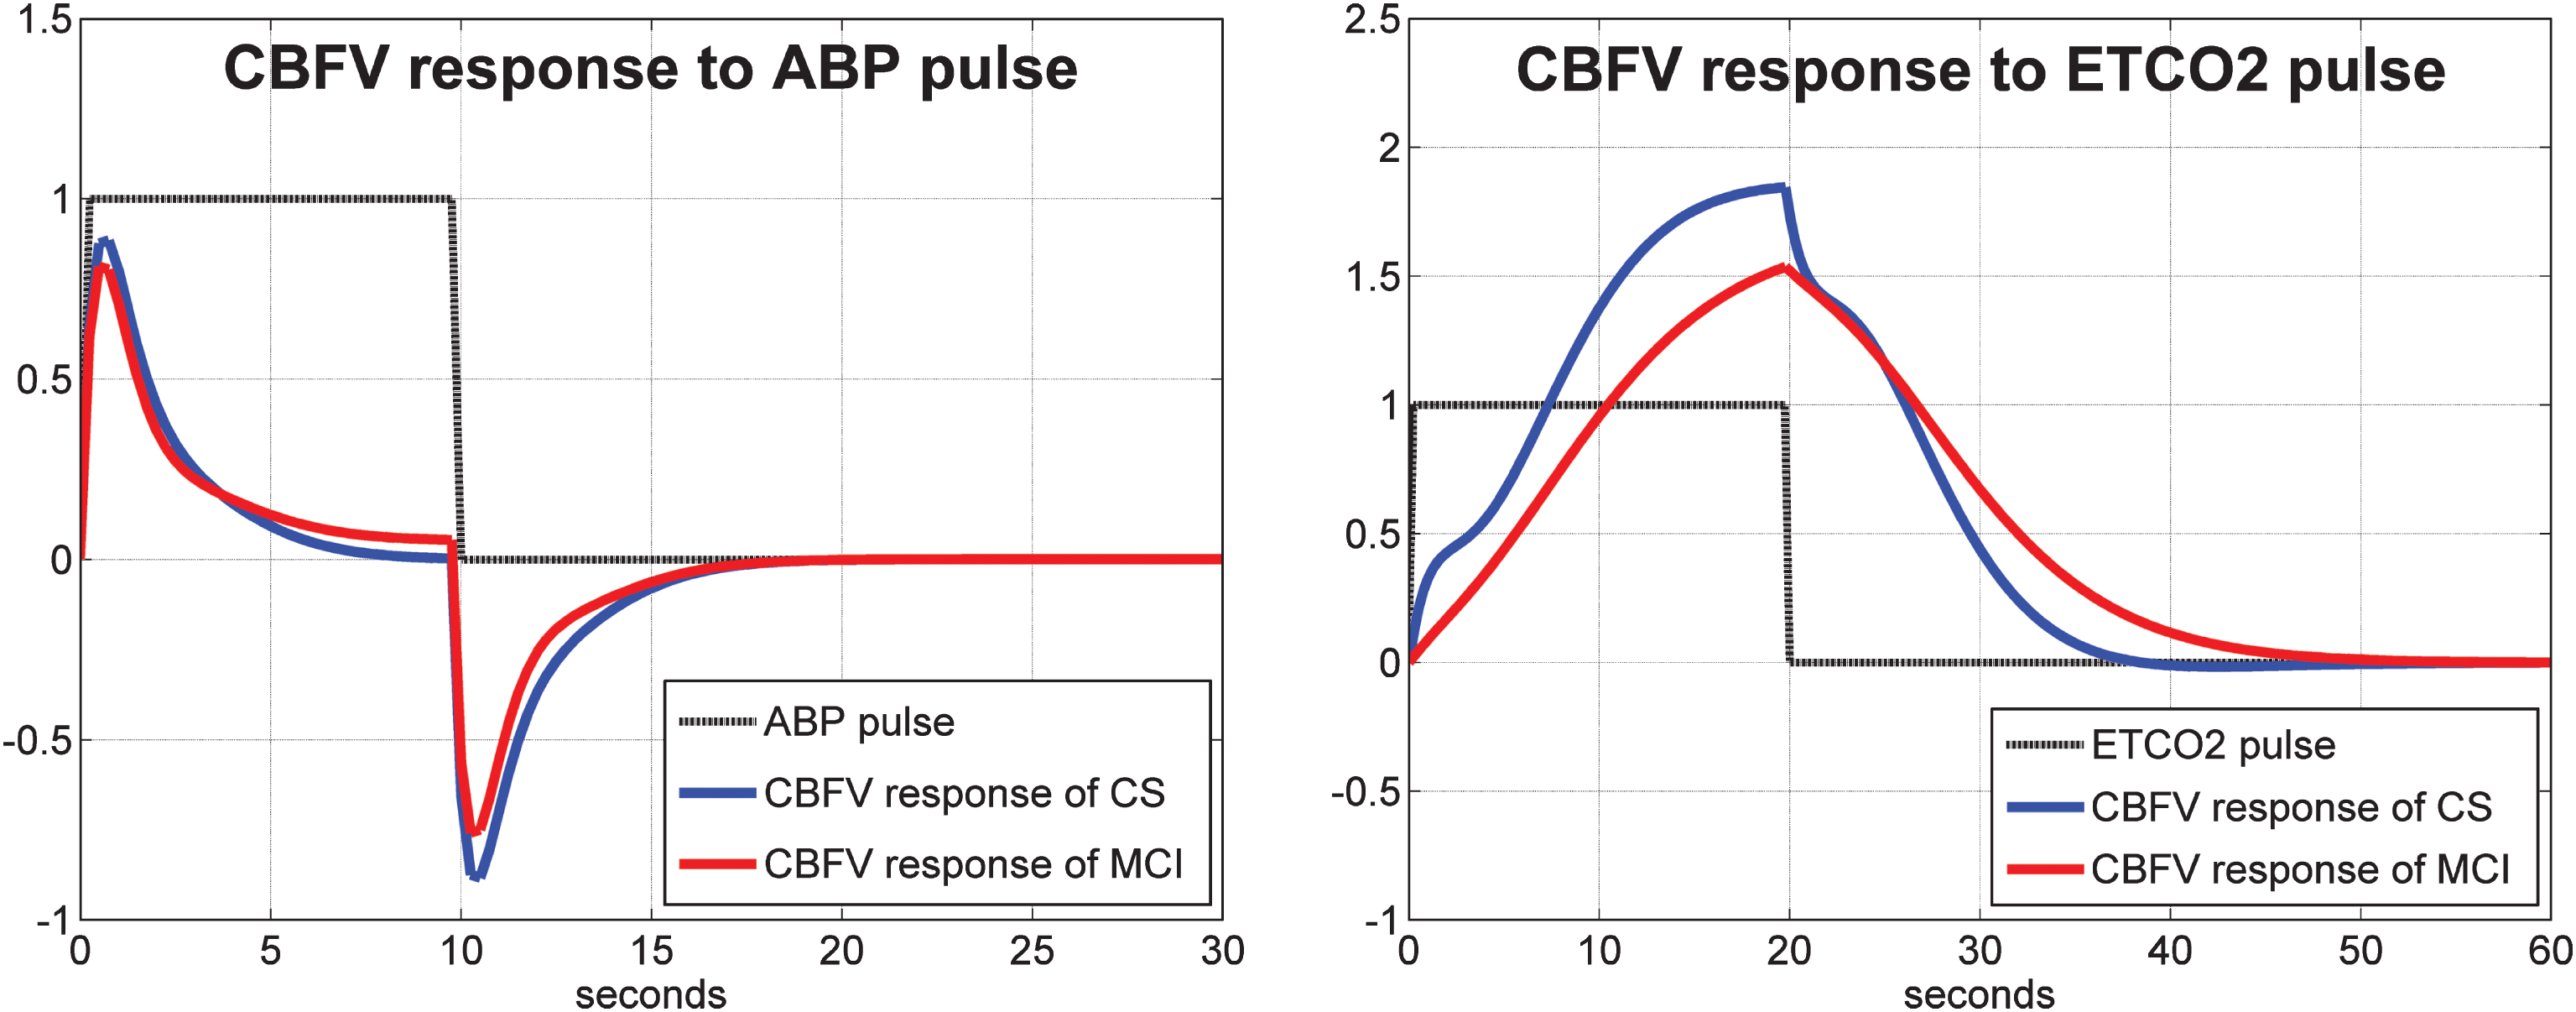
Fig.6
Average model-predicted TOI/NIRS responses for all control subjects (blue line) and for all MCI patients (red line) to a unit pulse change (dotted line) of the ABP input (left panel) and of the ETCO2 input (right panel), while the other input is kept at baseline.
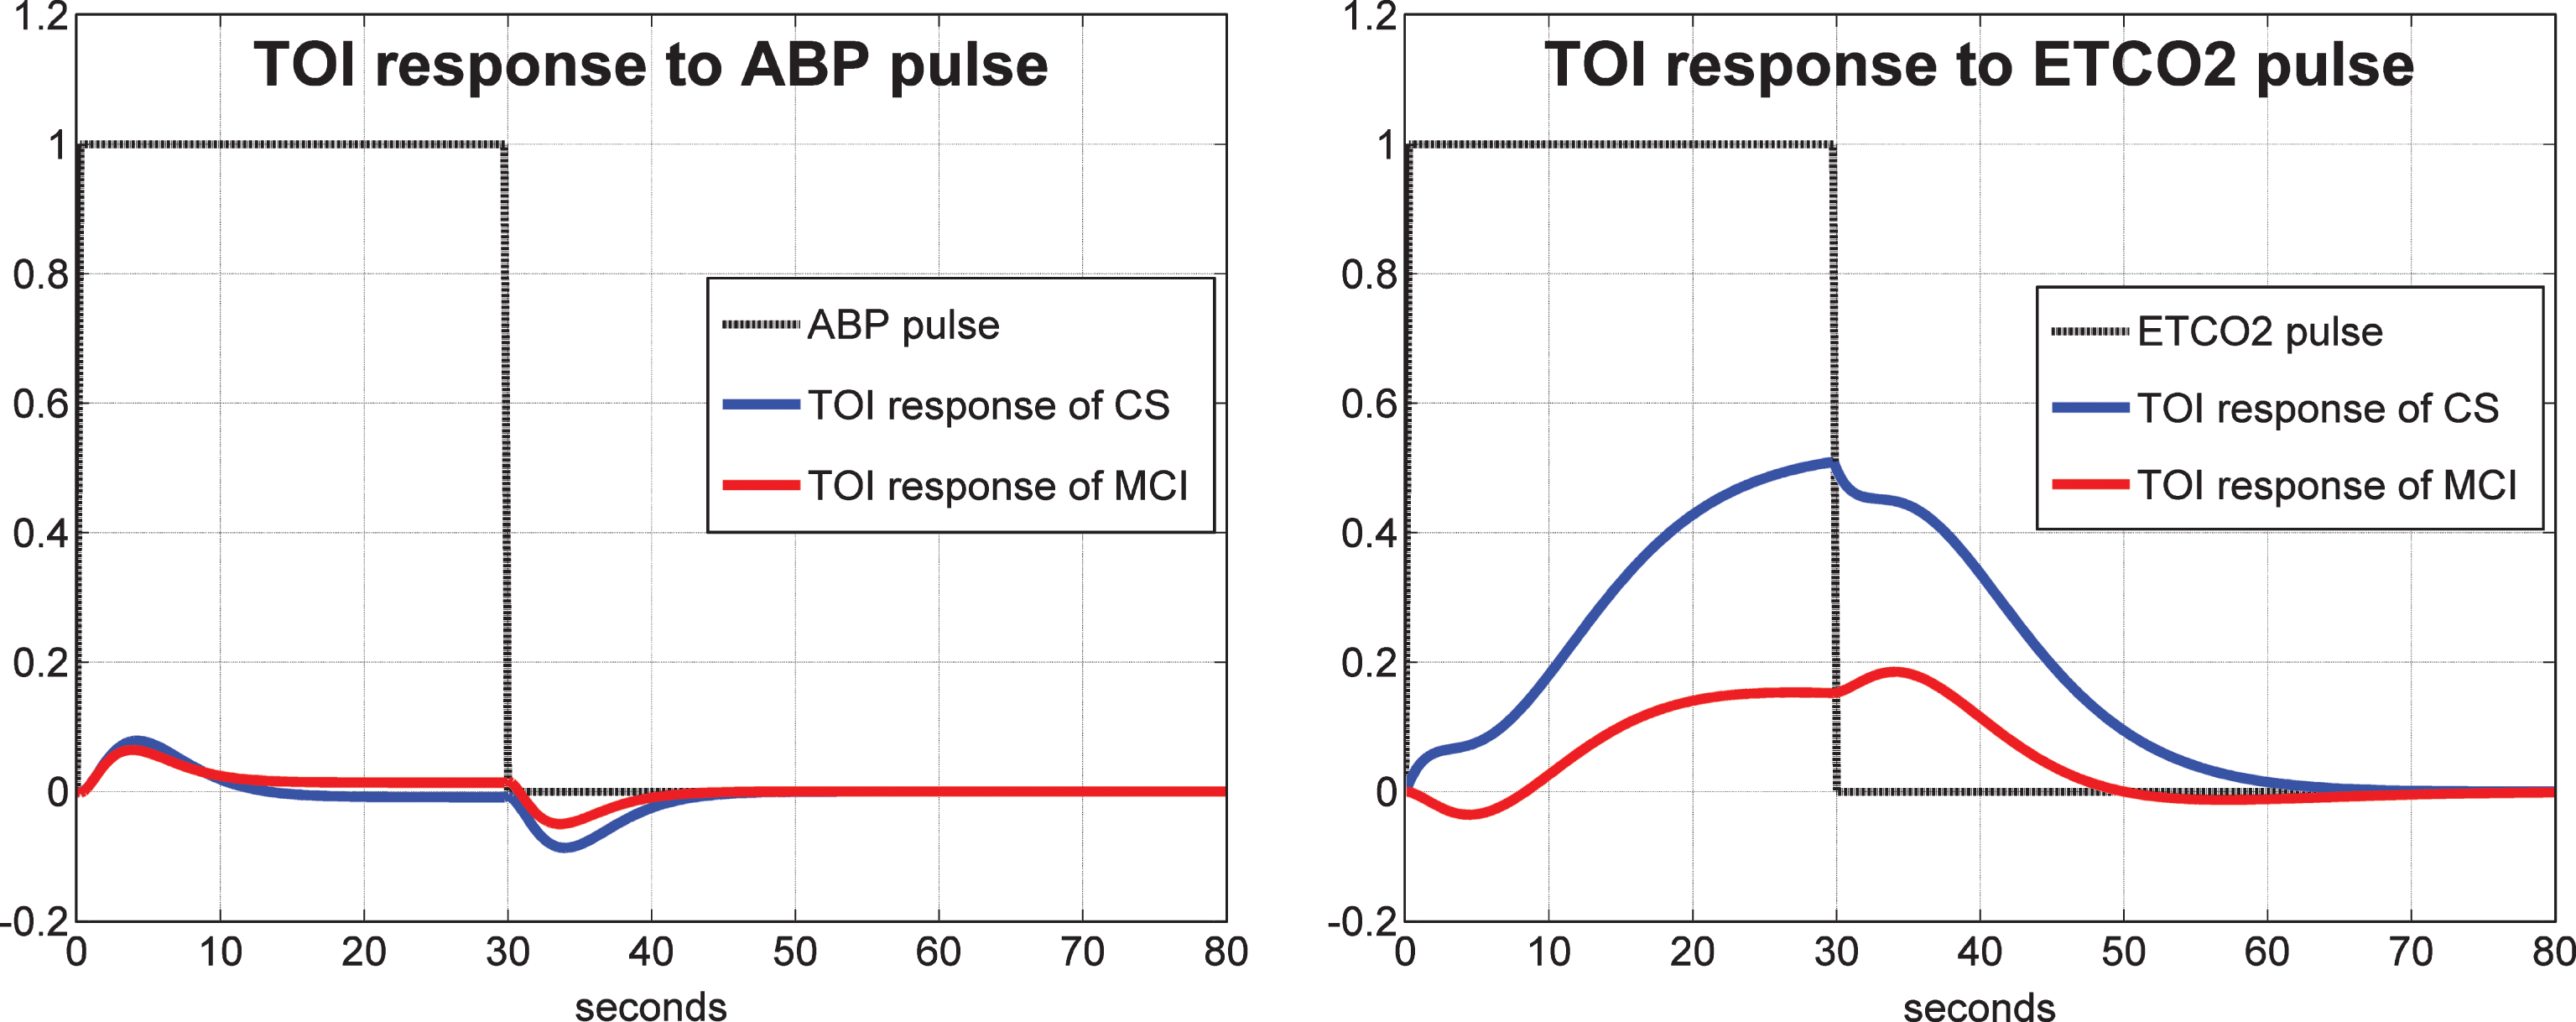
Fig.7
Average 1st order kernel estimates (± 1 SD bounds marked with dotted lines) over all controls (top panels) and MCI patients (bottom panels) for the ABP input (left panels) and ETCO2 input (right panels) when the output is CBFV/TCD.
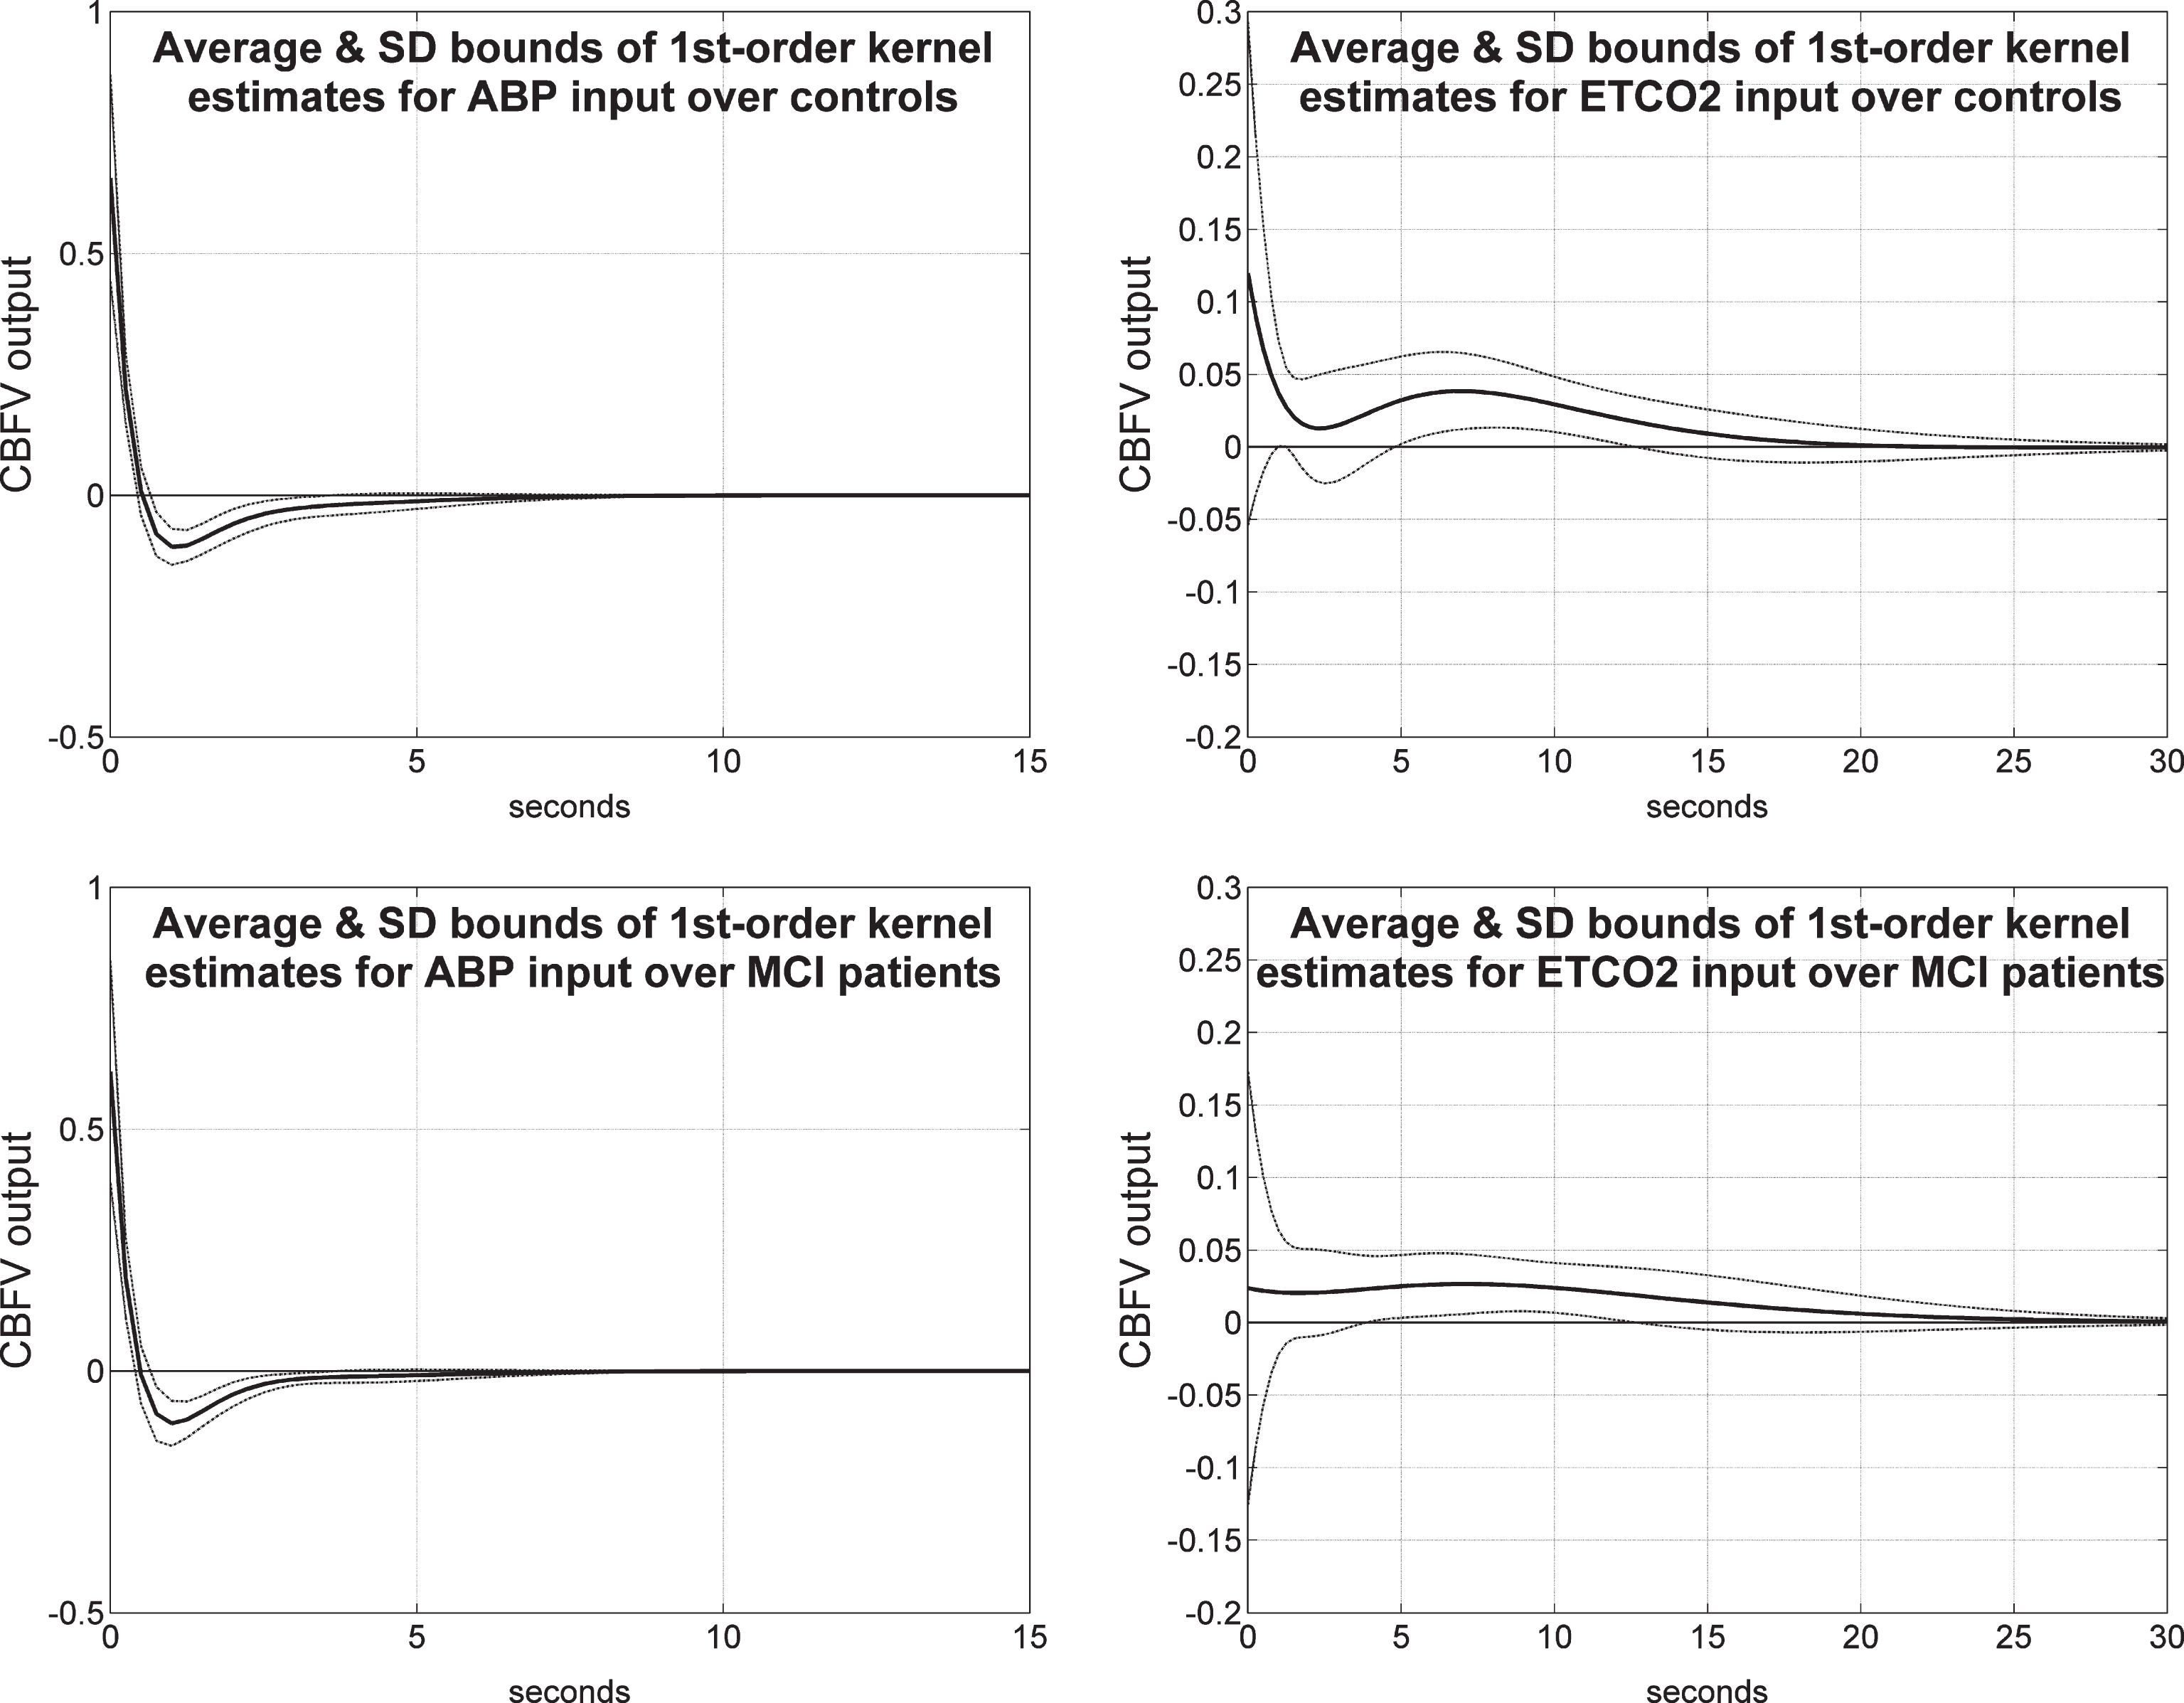
Fig.8
Average 1st order kernel estimates (± 1 SD bounds marked with dotted lines) over all controls (top panels) and MCI patients (bottom panels) for the ABP input (left panels) and ETCO2 input (right panels) when the output is TOI/NIRS.
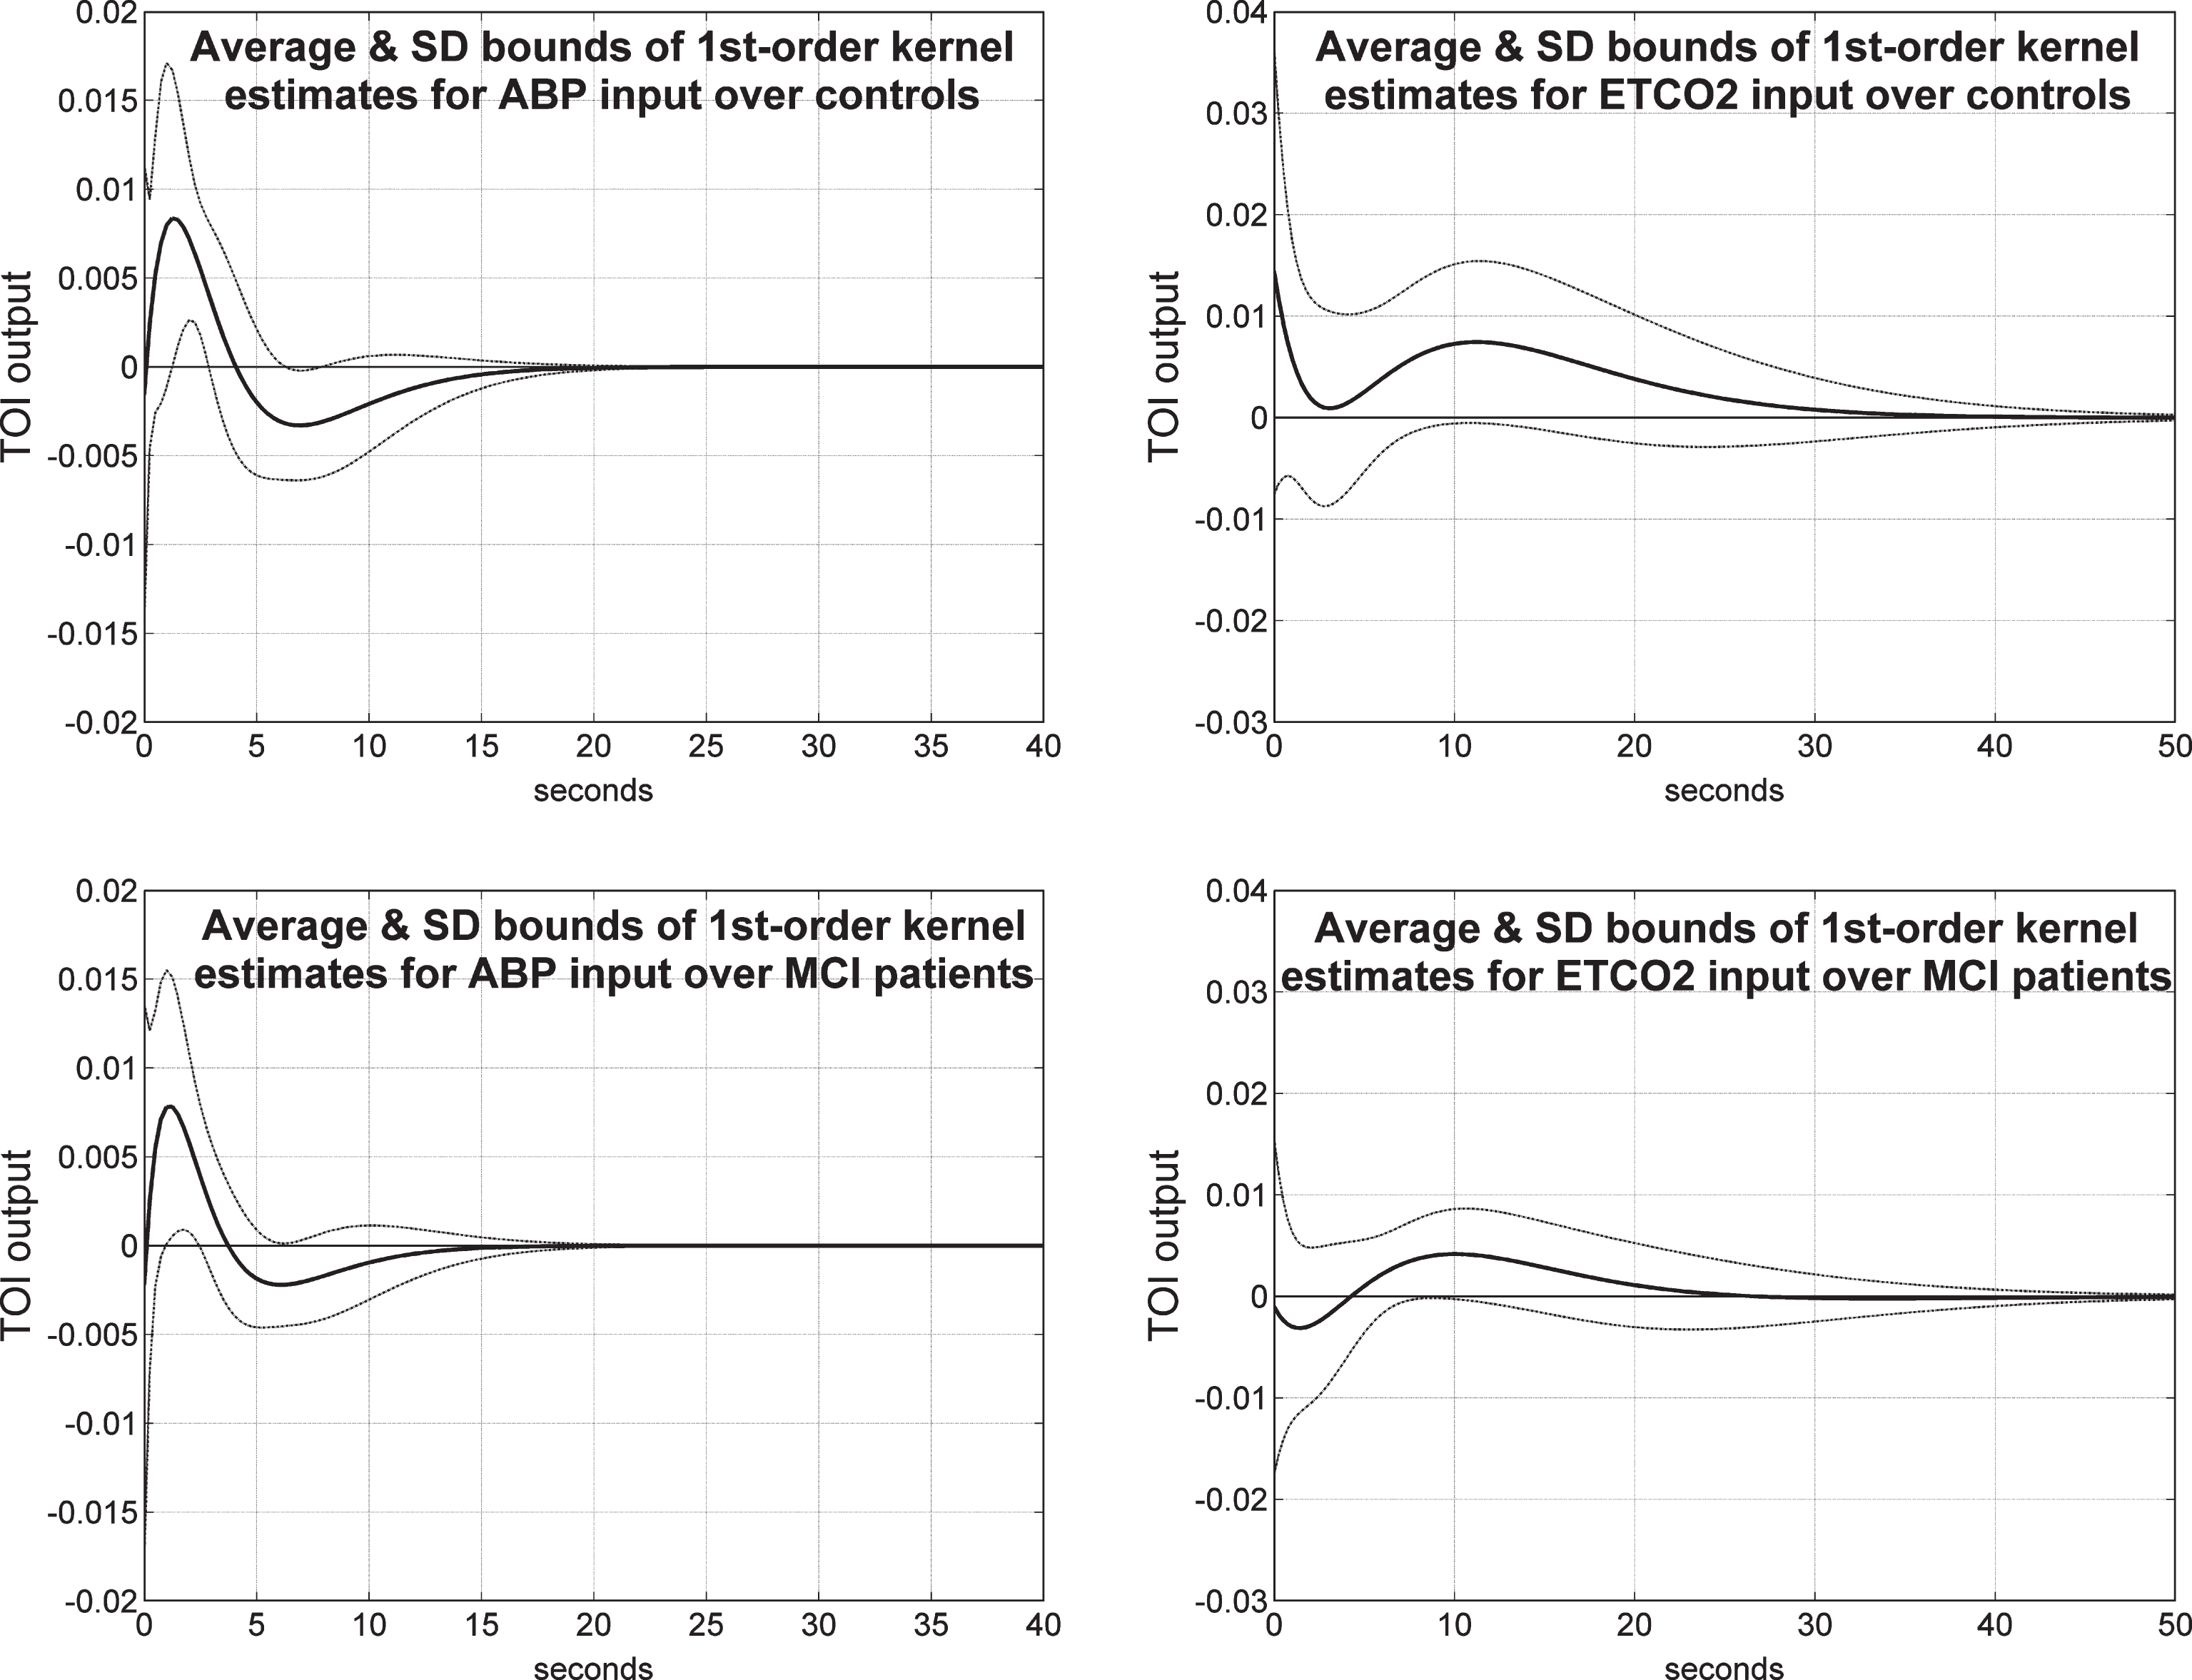
Fig.9
Schematic of the definition of the DCA index from the model-predicted TOI/NIRS response to a unit pulse change of the ABP input, while the ETCO2 input is kept at baseline (left panel), and of the DVR index from the model-predicted TOI/NIRS response to a unit pulse change of the ETCO2 input, while the ABP input is kept at baseline (right panel).
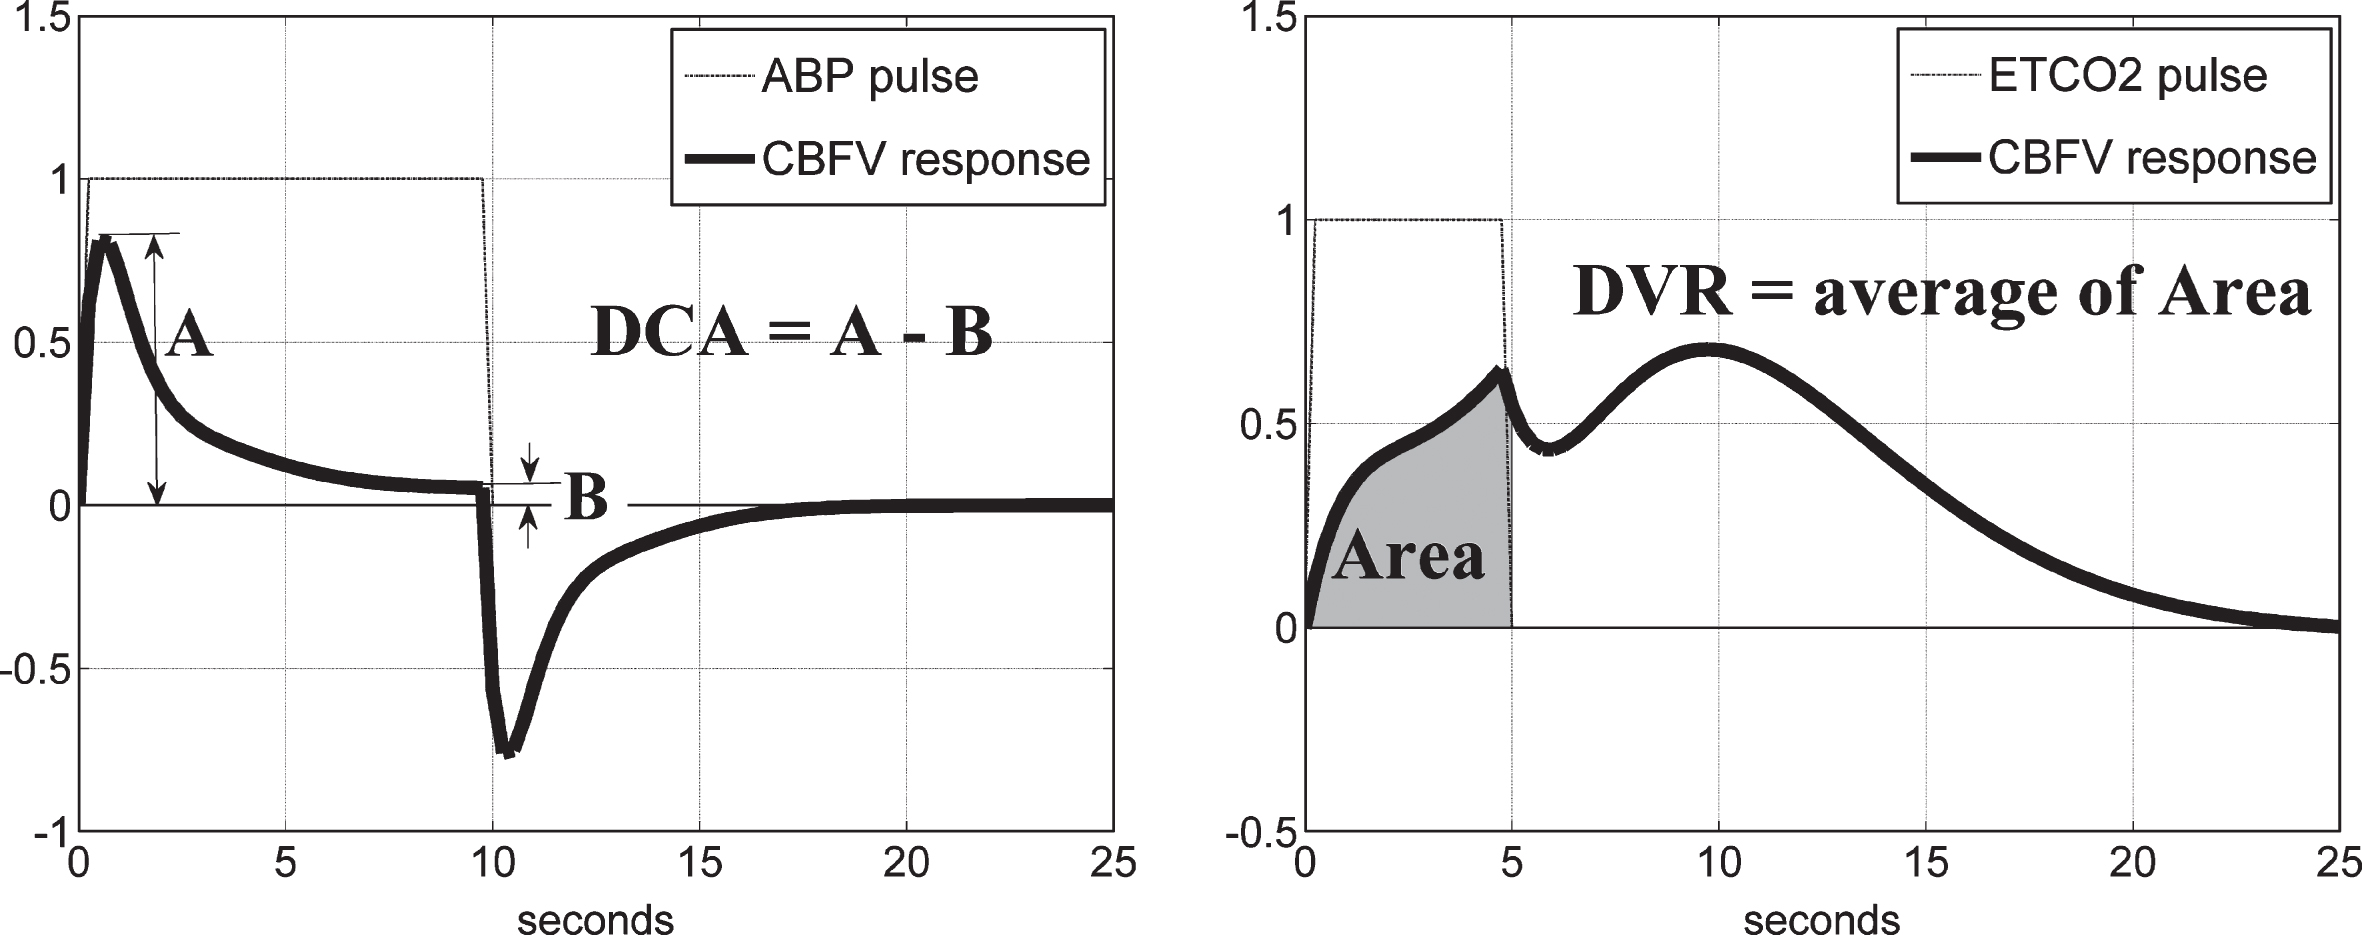
Fig.10
Scatter-plots of TCD-DCA versus TCD-DVR indices (left) and NIRS-DCA versus NIRS-DVR indices (right) for all controls (blue circles) and patients (red triangles) in each type of output recording. The regression lines correspond to correlation coefficients of 0.361 (p = 0.0028) and 0.028 (p = 0.8239) for the TCD and NIRS indices, respectively.
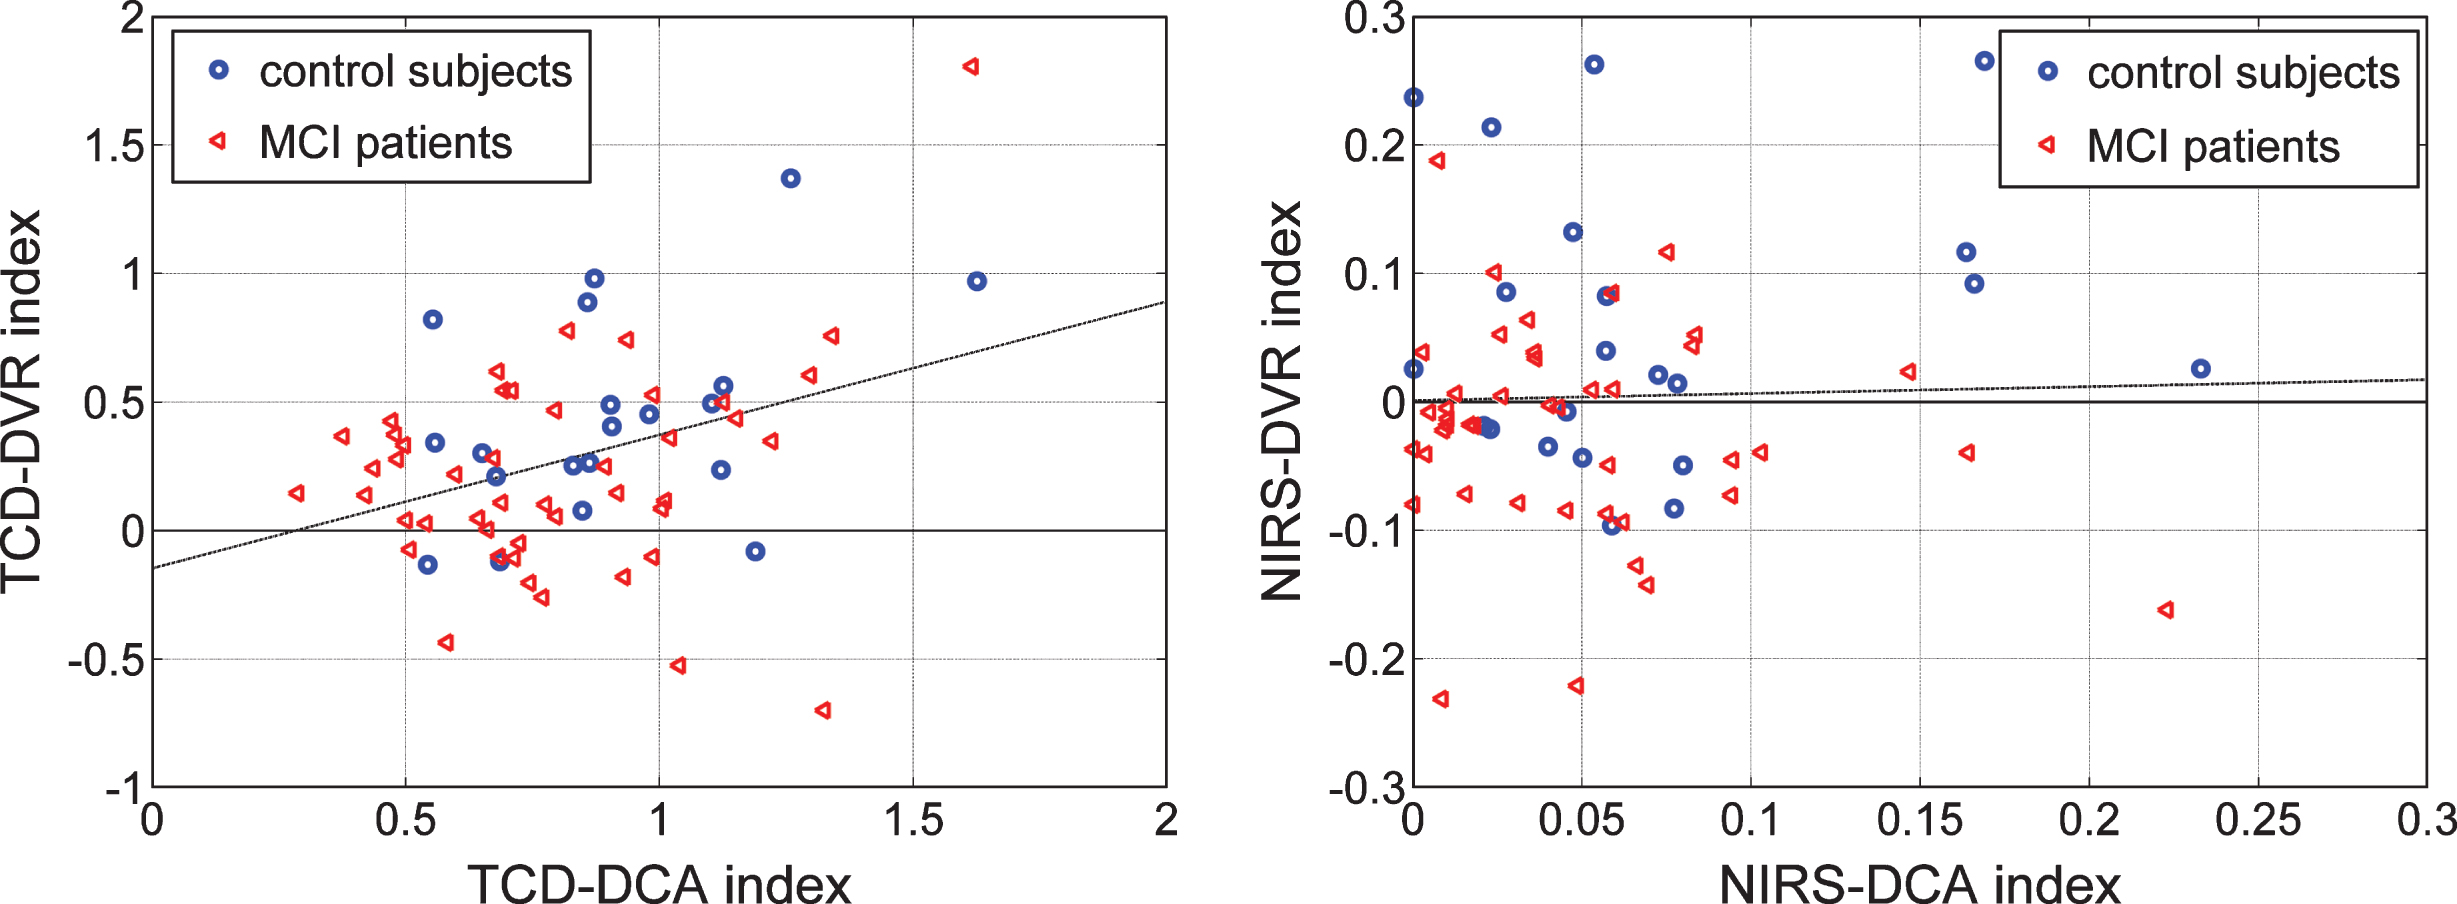
Fig.11
Scatter-plots of TCD-DVR versus NIRS-DVR indices for 14 controls (blue circles) and 38 patients (red triangle) who have both types of output recordings. The dashed line in each plot indicates a possible separation line between the two groups (Fisher’s Linear Discriminant in the left panel, and “diagnostic boundary” in the right panel determined by optimization algorithm) that corresponds to a composite index with p-value smaller than the separate p-values of each index shown in Tables 6 and 7—specifically, p = 0.0044 for Fisher’s Discriminant and p = 0.0049 for the “diagnostic boundary. The latter has a slightly higher p-value but yields better classification/diagnostic results.
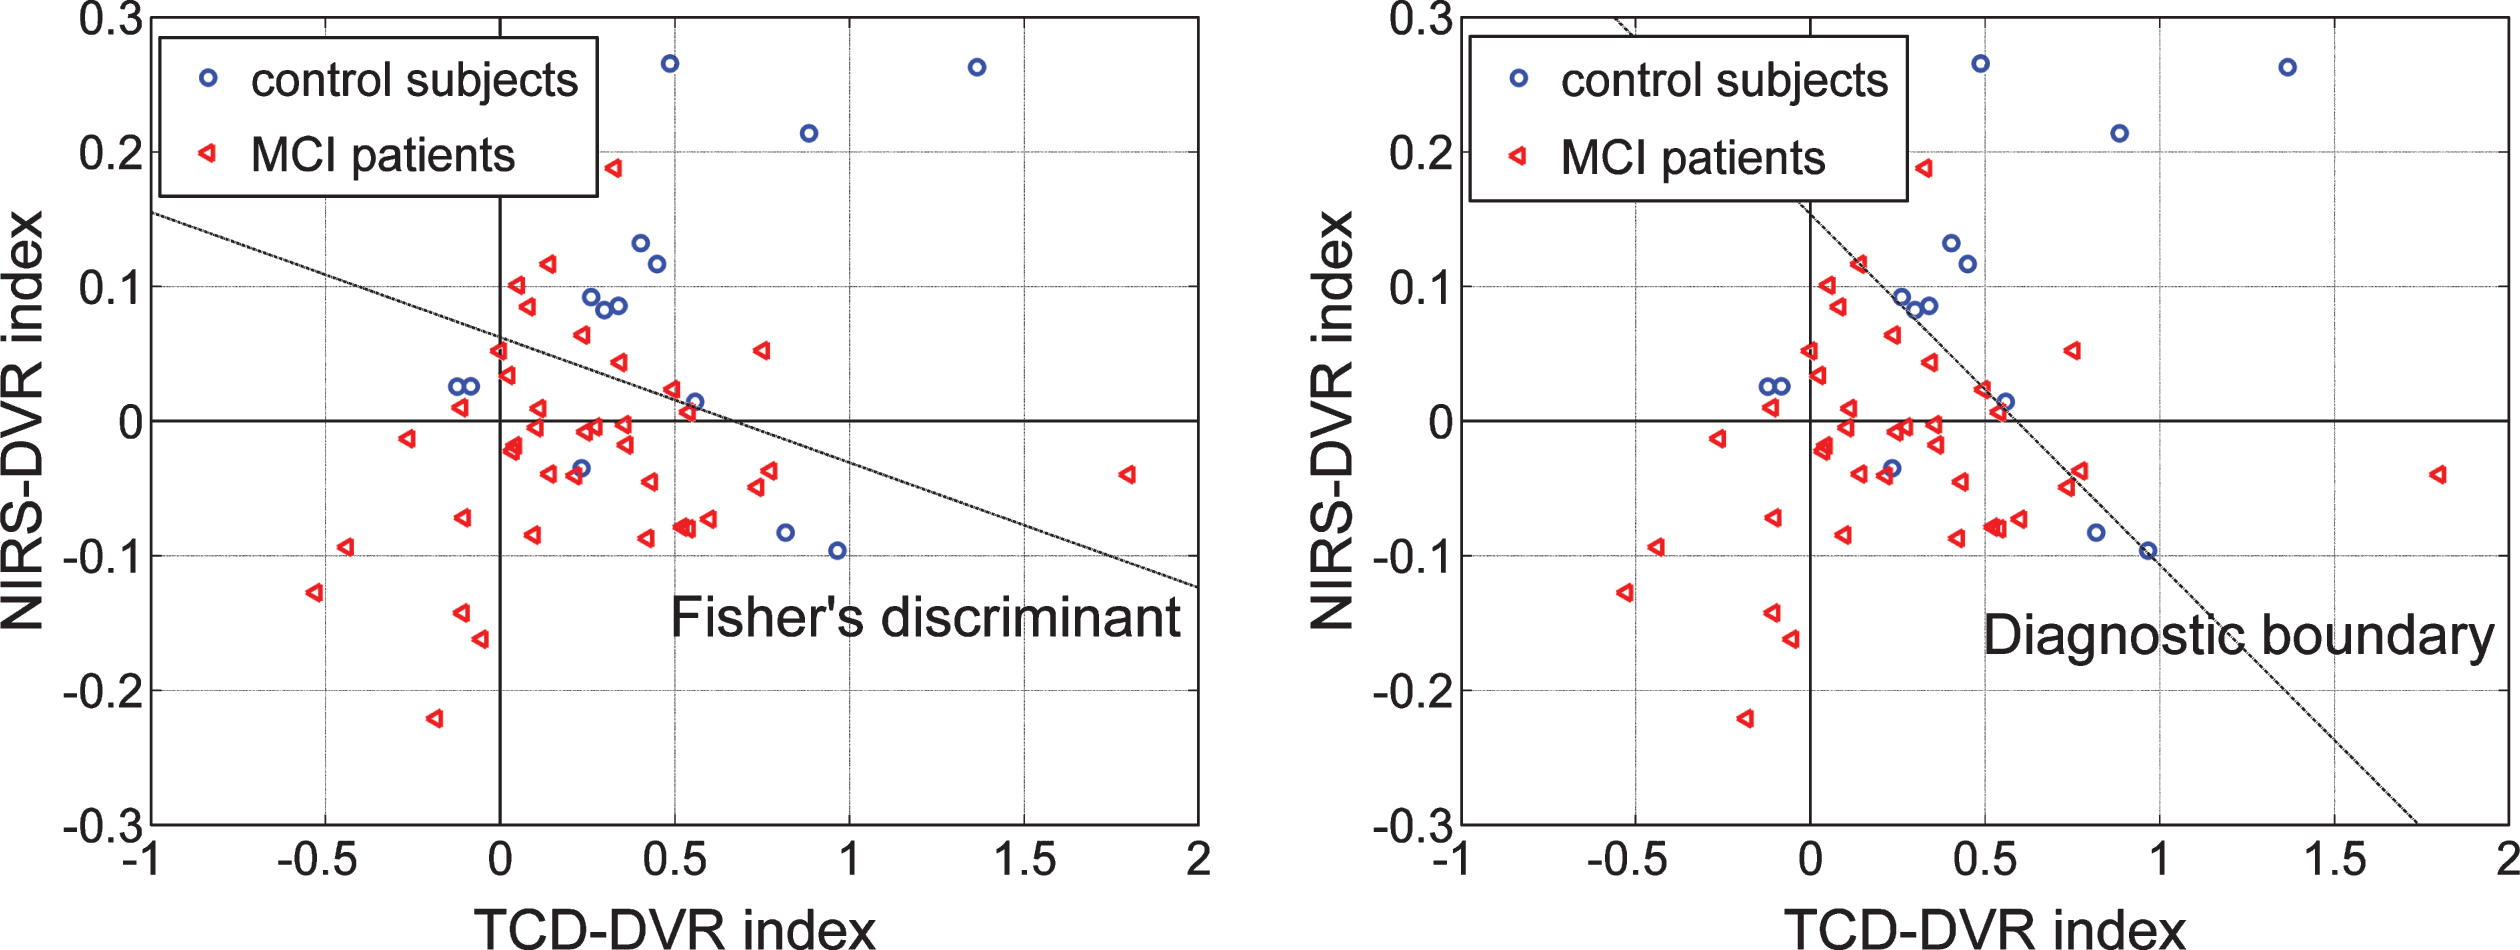
Fig.12
Scatter-plots of TCD-DVR versus Delayed Logical Memory Recall (DLMR) scores (left) for 18 controls (blue circles) and 45 patients (red triangles), and NIRS-DVR versus DLMR scores (right) for 22 controls (blue circles) and 42 patients (red triangles) for whom DLMR scores exist. The dashed lines suggest possible diagnostic indices that combine the DVR index with the DLMR score.
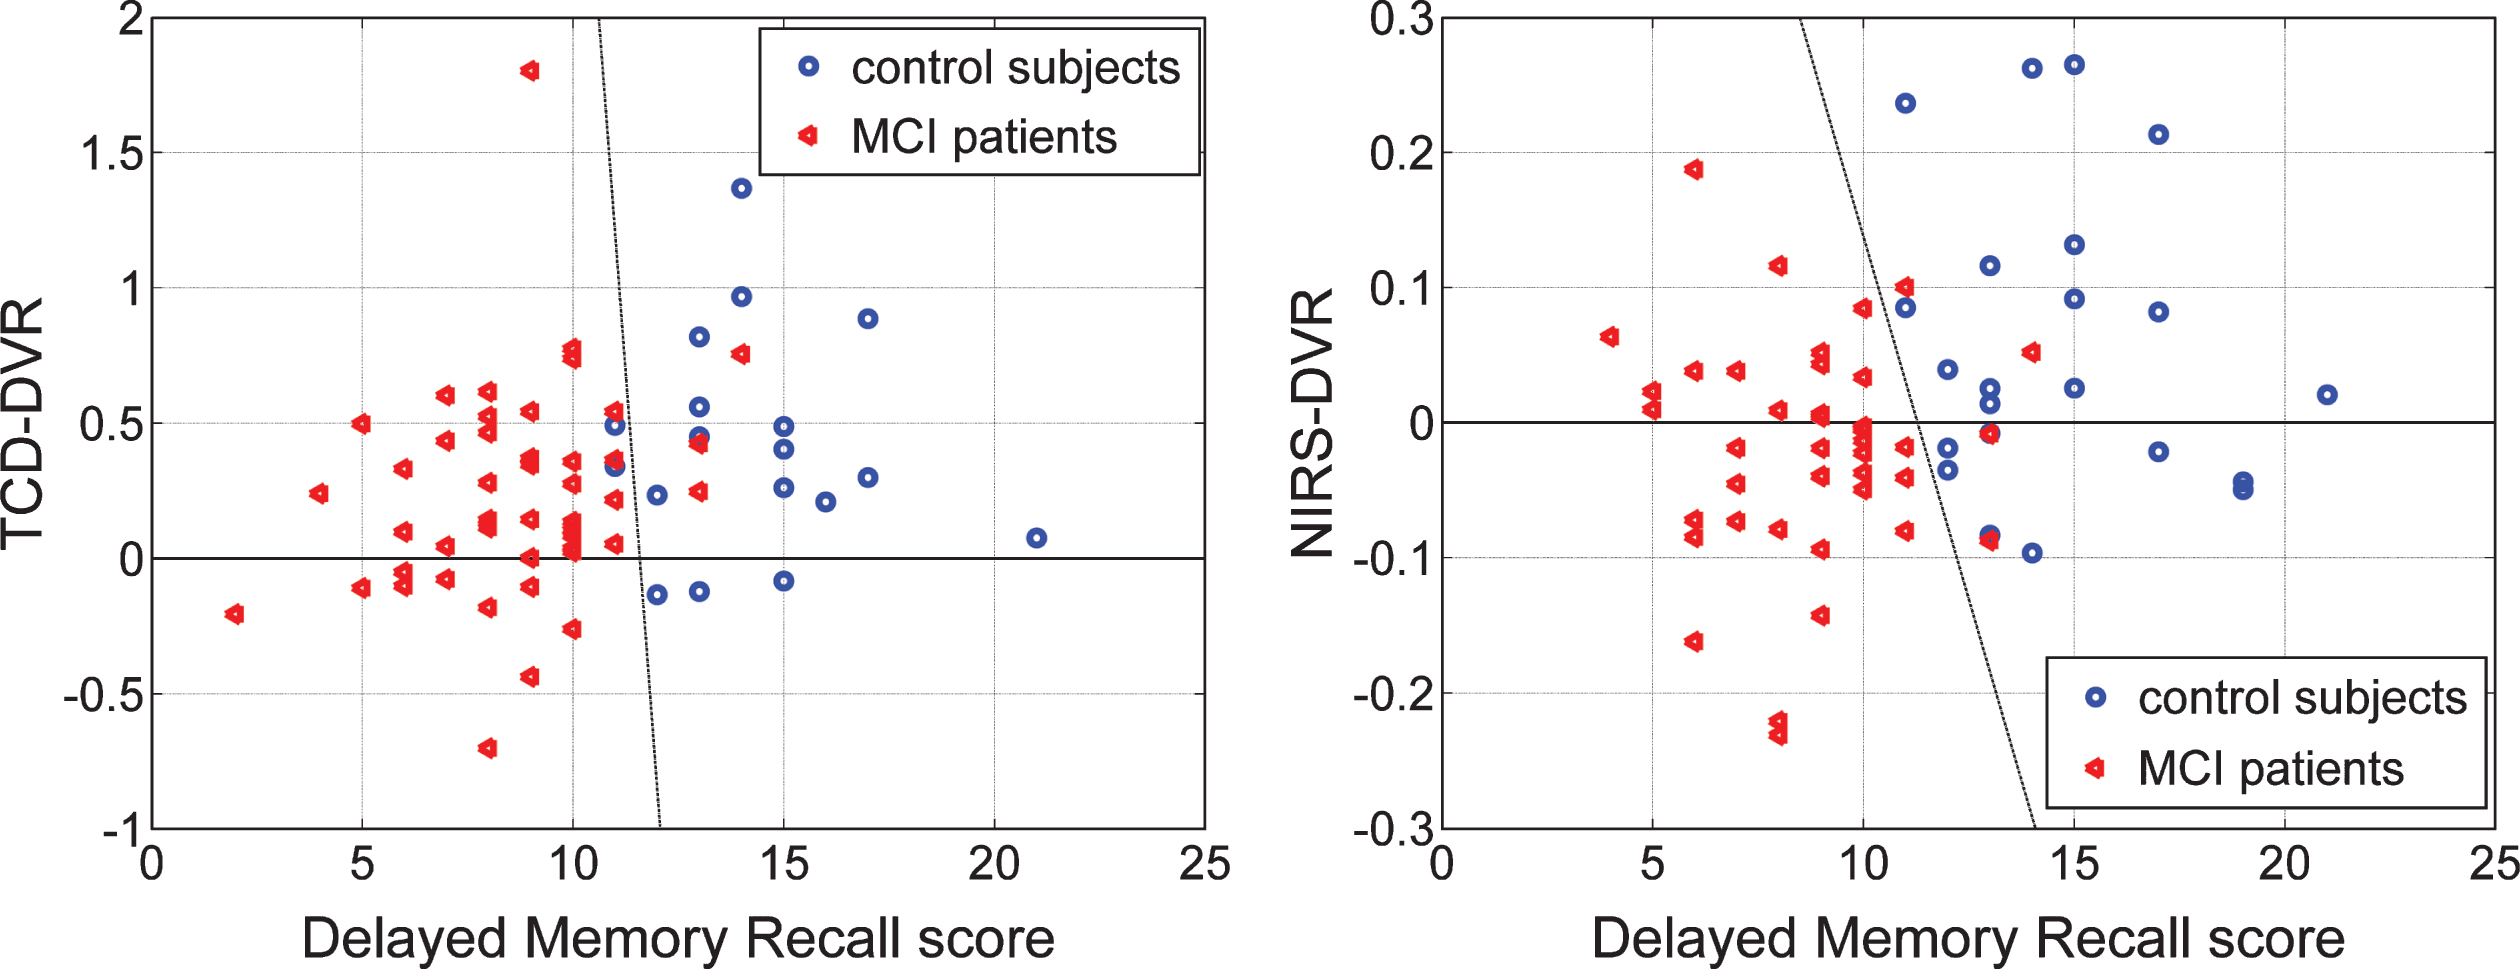
Table 1
Gender, age, and neuropsychological scores of controls and MCI patients with either TCD or NIRS data
| Subjects | Gender | Age Mean | MMSE | Delayed Logical |
| Composition | (SD) | score† | Memory Recall score†† | |
| 20 Controls | 10 male | 65.88 (6.27) | 29.17 (0.86) | 14.28 (2.47) |
| with TCD data | 10 female | |||
| 46 Patients | 17 male | 66.47 (6.61) | 29.09 (1.26) | 8.62 (2.35) |
| with TCD data | 29 female | |||
| 22 Controls | 11 male | 68.15 (6.24) | 29.23 (0.97) | 14.59 (2.74) |
| with NIRS data | 11 female | |||
| 43 Patients | 13 male | 66.79 (6.34) | 29.31 (0.90) | 8.74 (2.22) |
| with NIRS data | 30 female |
†Mini-Mental State Exam (MMSE) scores are not available for two controls and one MCI patient with TCD data, and for one MCI patient with NIRS data. ††Delayed Logical Memory Recall scores are not available for one control and one MCI patient with TCD data, and for one MCI patient with NIRS data.
Table 2
Mean (standard deviation) values of estimated Gains of the PDM outputs for the ABP input and CBFV output of 20 control subjects and 46 MCI patients, and the corresponding p-values for the two groups
| PDM #1 | PDM #2 | PDM #3 | PDM #4 | |||||
| Controls | Patients | Controls | Patients | Controls | Patients | Controls | Patients | |
| μ (σ) | 0.7298 | 0.6826 | 0.0095 | –0.0229 | –0.0056 | –0.0238 | –0.0036 | –0.0024 |
| (0.2217) | (0.2445) | (0.1052) | (0.0935) | (0.0772) | (0.0540) | (0.0330) | (0.0596) | |
| p | 0.4458 | 0.2438 | 0.3471 | 0.9137 | ||||
Table 3
Mean (standard deviation) values of estimated Gains of the PDM outputs for the ETCO2 input and CBFV output of 20 control subjects and 46 MCI patients, and the corresponding p-values for the two groups
| PDM #1 | PDM #2 | PDM #3 | PDM #4 | |||||
| Controls | Patients | Controls | Patients | Controls | Patients | Controls | Patients | |
| μ (σ) | 0.2558 | 0.1249 | –0.0761 | –0.1298 | –0.0054 | –0.0266 | –0.0058 | –0.0036 |
| (0.2098) | (0.1795) | (0.2115) | (0.1666) | (0.0813) | (0.1017) | (0.0599) | (0.0895) | |
| p | 0.0210 | 0.3218 | 0.3736 | 0.9074 | ||||
Table 4
Mean (standard deviation) of estimated Gains of the PDM outputs for the ABP input and TOI output of 22 control subjects and 43 MCI patients, and corresponding p-values for the two groups
| PDM #1 | PDM #2 | PDM #3 | PDM #4 | |||||
| Controls | Patients | Controls | Patients | Controls | Patients | Controls | Patients | |
| μ (σ) | 0.0253 | 0.0215 | 0.0086 | 0.0023 | –0.0001 | 0.0010 | 0.0019 | 0.0030 |
| (0.0213) | (0.0183) | (0.0196) | (0.0157) | (0.0137) | (0.0169) | (0.0092) | (0.0103) | |
| p | 0.4863 | 0.1956 | 0.7832 | 0.6551 | ||||
Table 5
Mean (standard deviation) of estimated Gains of the PDM outputs for the ETCO2 input and TOI output of 22 control subjects and 43 MCI patients, and corresponding p-values for the two groups
| PDM #1 | PDM #2 | PDM #3 | PDM #4 | |||||
| Controls | Patients | Controls | Patients | Controls | Patients | Controls | Patients | |
| μ (σ) | 0.0530 | 0.0162 | 0.0106 | 0.001018 | –0.0027 | –0.0093 | –0.0049 | –0.0178 |
| (0.0669) | (0.0348) | (0.0341) | (0.0253) | (0.0329) | (0.0262) | (0.0213) | (0.0255) | |
| p | 0.0226 | 0.2496 | 0.4208 | 0.0358 | ||||
Table 6
Mean (standard deviation) of TCD-DCA and TCD-DVR indices for 20 controls and 46 patients
| TCD-DCA index | TCD-DVR index | |||
| Controls | Patients | Controls | Patients | |
| μ (σ) | 0.8969 (0.2822) | 0.7751 (0.3022) | 0.4360 (0.3992) | 0.2157 (0.4061) |
| p | 0.1232 | 0.0476 | ||
Table 7
Mean (standard deviation) of NIRS-DCA and NIRS-DVR indices for 22 controls & 43 patients
| NIRS-DCA index | NIRS-DVR index | |||
| Controls | Patients | Controls | Patients | |
| μ (σ) | 0.0699 (0.0601) | 0.0480 (0.0467) | 0.0566 (0.1086) | –0.0226 (0.0823) |
| p | 0.1450 | 0.0050 | ||


