
A system for biomedical audio signal processing based on high performance computing techniques
Abstract
In this paper, a noninvasive portable prototype is presented for biomedical audio signal processing. The proposed prototype is suitable for monitoring the health of patients. The proposed hardware setup consists of a cost-effective microphone, multipurpose microcontroller and computing node that could be a mobile phone or general-purpose computer. Using parallel and high-performance techniques, this setup allows one to register and wirelessly multicast the recorded biomedical signals to computing nodes in real time. The developed prototype was used as a case study to estimate the heart rate (HR) from the captured biomedical audio signal. In this regard, the developed algorithm for estimating HR comprises three stages: preprocessing, separation, and HR estimation. In the first stage, the signal captured by the microphone is adapted for processing. Subsequently, a separation stage was proposed to alleviate the acoustic interference between the lungs and heart. The separation is performed by combining a non-negative matrix factorization algorithm, clustering approach, and soft-filter strategy. Finally, HR estimation was obtained using a novel and efficient method based on the autocorrelation function. The developed prototype could be used not only for the estimation of the HR, but also for the retrieval of other biomedical information related to the recording of cardiac or respiratory audio signals. The proposed method was evaluated using well-known datasets and compared with state-of-the-art algorithms for source-separation. The results showed that it is possible to obtain an accurate separation and reliable real-time estimation in terms of source separation metrics and relative error in the tested scenarios by combining multi-core architectures with parallel and high-performance techniques. Finally, the proposed prototype was validated in a real-world scenario.
1.Introduction
According to the World Health Organization (WHO),11 heart and lung diseases are among the leading causes of death in the world. In addition to the fact that suffering from these diseases reduces the well-being and quality of life of citizens, the medical treatment that must be applied increases the costs of the health systems. Consequently, one of the main challenges for current biomedicine is to develop new methodologies that allow monitoring and obtaining fast, reliable, and individualized biomedical information using noninvasive techniques as a strategy for sustainability and efficiency in health systems.
Over the last few decades, many biomedical signal processing techniques have been studied [1, 2, 3, 4, 5, 6]. In particular, the field of biomedical signal recording has had a major impact in modern societies, as most medical care is provided based on this information, especially in relation to heart and lung diseases [7, 8, 9, 6, 10]. However, in many cases, obtaining such signals involves invasive or semi-invasive techniques and, in others, especially expensive and cumbersome setups.
The primary access to heart diagnosis has been acoustic auscultation using classical stethoscopes, in use since 1816. This technique is yet to be used in modern clinical diagnosis since it has proven to provide crucial information about heart and lung diseases. As a special case, the analysis of the heart rate (HR) has been proven to predict diseases such as sepsis [11], hypotension [12], or arrhythmias [13], and variations in this parameter have been widely used as biomarkers of hypoxemia at birth [14] to depth anesthesia [15] or epilepsy [16] states, baro-oscillatory phenomenon frequency in diabetic patients [17], sport performance [18], etc. Moreover, there are also a huge number of short-term extrinsic factors related to HR variations, independent of the health baseline of the patient [19].
Auscultation is still a widely used and essential method applied to patients who come to a health center to assess their health status [20]. However, this method is very subjective because it is conditioned by the skill, experience, and training of each physician in the type of sounds heard. One of the drawbacks of audio signals obtained during auscultation is the acoustic interference produced between sounds emitted by the heart and lungs. Although both are produced by very different physiological processes, heart and lung sounds share important areas of the spectrum, and simple frequency filtering is not sufficient to obtain a proper and clean register [21, 22]. Specifically, this interference reduces the human cognitive ability of physicians when attempting to identify target sounds. This prevents the proper diagnosis of patients. Consequently, several methods have been developed in the last decade to separate or independently process heart and lung sounds from auscultation signals [22, 23, 24, 25, 26, 27, 28, 6, 29, 30, 31, 32].
Many recent works have focused on improving separation; however, there are still important challenges that need to be addressed to obtain optimal performance. First, the computational burden of these methods makes real-time processing of biomedical signals difficult and prevents their implementation in low-cost devices. Moreover, registering biomedical sounds involves adapted microphones capable of accurately capturing the sources of interest and ignoring other noise sources, such as tissue friction and voice.
In this sense, the scientific community is focused on the development of sensor devices to monitor biomedical signals. This can be observed in the huge number of smartwatches and activity bands currently available on the market. Together with the development of close-range wireless technologies, such as Bluetooth (and its power-sensitive LE version) and ANT+ (available mainly in sensors for sports and fitness applications), health monitoring has become mainstream, reducing the cost of these devices. In this regard, several solutions have been developed for measuring different biomedical signals, such as heart rate,22 periphery oxygen saturation33 blood pressure,44 etc. However, there is still room for researching in devices to monitor biomedical audio signals, as this field has not yet been widely exploited. The Voqx smart stethoscope [33] is one of the most relevant proposal on the market. This device was developed by the consortium Bat-Call. Currently, this consortium is developing an improved IA-based device, called PyXy [34]. These approaches, together with others, such as AliveCord [35], or the set of digital stethoscopes from Littmann [36], automatically detect HR and provide wireless connection with smartphones or other intelligent devices. However, the main drawback of these systems is their high cost for primary care diagnosis.
In this study, a low-cost portable prototype is proposed for biomedical audio signal processing. The proposed prototype consists of a cost-effective microphone and multipurpose microcontroller, both responsible for capturing and preprocessing audio signals, and some computing nodes (mobile phone or general-purpose computer), which receive the audio signal and process it for a specific task. As a case study, the developed prototype was used to estimate the HR from the captured audio signal, although many other parameters based on registered biomedical audio signals could have been used for this purpose. In this regard, HR estimation is performed based on previous stages in which the separation of respiratory and cardiac sounds from an input audio mixture is addressed. Similar to [28, 32], the separation was carried out by integrating a non-negative matrix factorization (NMF) algorithm, clustering approach, and soft-filter strategy. However, in this work, significant improvements in the separation stage have been made, which clearly differentiates it from these previous works. First, an initialization method based on singular value decomposition (SVD) was introduced to avoid dependence on the initial values of the NMF parameters owing to the existence of local minima. Then, the clustering procedure proposed in [28] was modified to address the new formal and theoretical processing aspects and reduce the computational burden of that stage. Finally, the NMF formulation was redesigned to reduce the size of its parameters and obtain fast and better parameter estimation.
It is important to highlight that the main proposal of this work lies in the design and development of a portable, noninvasive, and cost-effective prototype that is capable of monitoring and processing biomedical audio signals. This prototype separates the heart and lung signals in real time. This processing could be used for the retrieval of biomedical information related to the appearance of cardiac or respiratory risk factors, such as the detection of heart murmurs, estimation of the variability of the heart rate, or respiratory rate estimate. Note that, for proper estimation of all these biomedical features, the separation of heart and lung sounds is crucial. Therefore, this study is focused on the development of a low-cost device that can provide a high-quality separation of heart and lung signals in real time. As a case study, the development of an algorithm for HR estimation is proposed to show and validate the prototype applicability in real-world scenarios.
The proposed system has been evaluated on several state-of-the-art datasets created for several purposes, including the classification of heart-sound signals and separation of heart and lung sounds. For these databases, cardiologists are required to annotate all signals with ground-truth labels (i.e., heart rate), a process that demands medical expertise and is time-consuming. Finally, this work presents a new dataset for validating the proposed prototype. The results show that reliable real-time separation and HR estimation can be achieved using the proposed portable prototype.
The remainder of this paper is organized as follows. Section 2 presents the mathematical formulation of the signal model and baseline method for heart and lung sound separation using NMF. The proposed prototype is presented in Section 3. The experimental results are presented in Section 4, and validation of the proposed prototype is presented in Section 5. Finally, Section 6 concludes the paper and outlines future perspectives.
2.Background
This section presents a mathematical formulation of the signal model used in this study. This formulation serves as a reference for the mathematical description in the remainder of the paper. In addition, the baseline method used for the separation of heart and lung sounds using NMF is also described.
2.1Signal model
The problem considered in this study implies the separation of the lung and heart sounds from the auscultation signal recorded with a microphone placed on the chest wall of the subject. Thus, the captured signal
(1)
where the time-domain sample index is denoted by
Focusing on Eq. (1), the short-time Fourier transform (STFT) of
(2)
where
2.2Baseline method for heart and lung sound separation by NMF
To process heart and lung signals, it is necessary to acoustically cancel the interference between the lungs and heart. Note that both sources are simultaneously active in both time and frequency domains. In particular, the main problem generated by this interference is that heart sounds mask lung sounds and vice versa.
In [28], the separation of sounds generated by the lungs from sounds generated by the heart was performed using an NMF approach. Thus, the separation problem relies on the following factorization model:
(3)
where
The authors proposed dealing with the factorization in Eq. (3) by minimizing the Kullback-Leibler divergence [37] and the sparsity constraint [38]. Therefore, the update rules were computed as follows:
(4)
(5)
where
Canadas-Quesada et al. [28] proposed a clustering process to classify the activations
Finally, reconstruction of the target signals is performed using a generalized Wiener filtering strategy. This Wiener filtering strategy minimizes the mean-square error between the estimated and desired signals. The previously predicted parameters were used to estimate the magnitude spectrograms of the lung and heart signals by
(6)
Then, a generalized time-frequency mask over the STFT domain is used to obtain the source signals
3.Proposed prototype
In this study, a prototype is designed to process biomedical audio signals. The proposed hardware setup consists of a cost-effective microphone, multipurpose microcontroller and computing nodes. This setup allows us to register and wirelessly multicast the recorded cardiac and respiratory sounds to the computing nodes in real time. The proposed approach consists of three main stages: preprocessing, separation, and HR estimation.
In this section, the main contributions of the proposal from the perspective of signal processing and hardware prototypes are discussed. The prototype developed is described in Section 3.1, and the proposed method is presented in Section 3.2.
3.1Hardware prototype
One of the main goals of this study is to design a biomedical audio signal processing system that can be run on portable low-cost systems. Therefore, the main constraint of the development is that low-power microcontrollers do not provide sufficient computational resources, both memory and processing power [42, 43]. Therefore, additional hardware must be considered when computing the proposed method.
To address the target problem, the following requirements for the proposed prototype have been set: 1) low power consumption (suitable to be powered by a battery), 2) low cost (the total price of all components must be less than a few tens of euros), and 3) wireless connectivity, that is, Internet of Things enabled (embedded connectivity is essential to run part of the algorithm on the computing nodes). Based on these requirements, the following components were selected to develop the prototype.
One of the most popular devices for these types of applications is the well-known ESP32 [44] developed by Espressif Systems. This microcontroller offers a cost-effective solution with several GPIO (general-purpose input/output) pins and exposes different communication interfaces to attach peripherals: I
Figure 1.
Block diagram of the proposed approach.
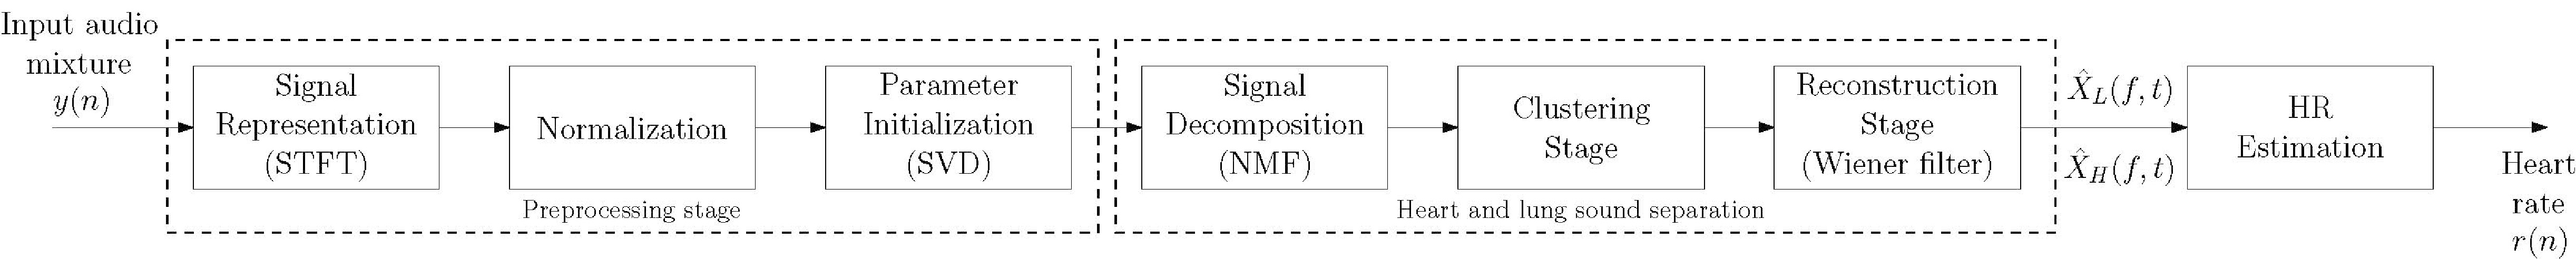
Figure 2.
INPM441 MEMS microphone.
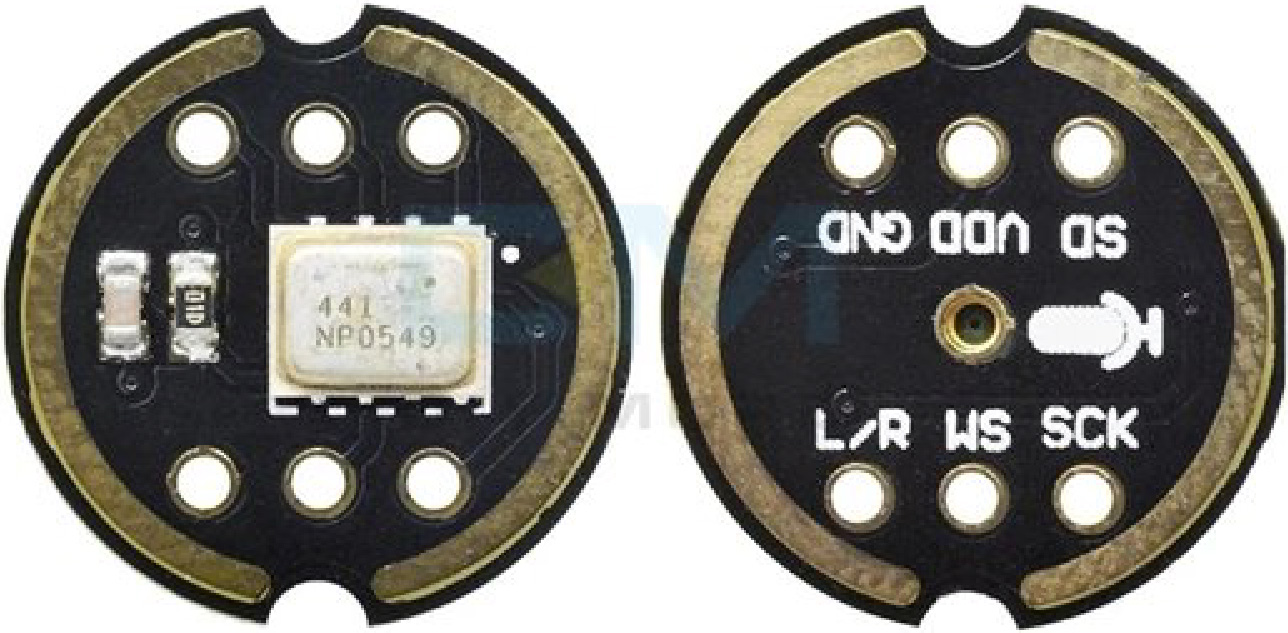
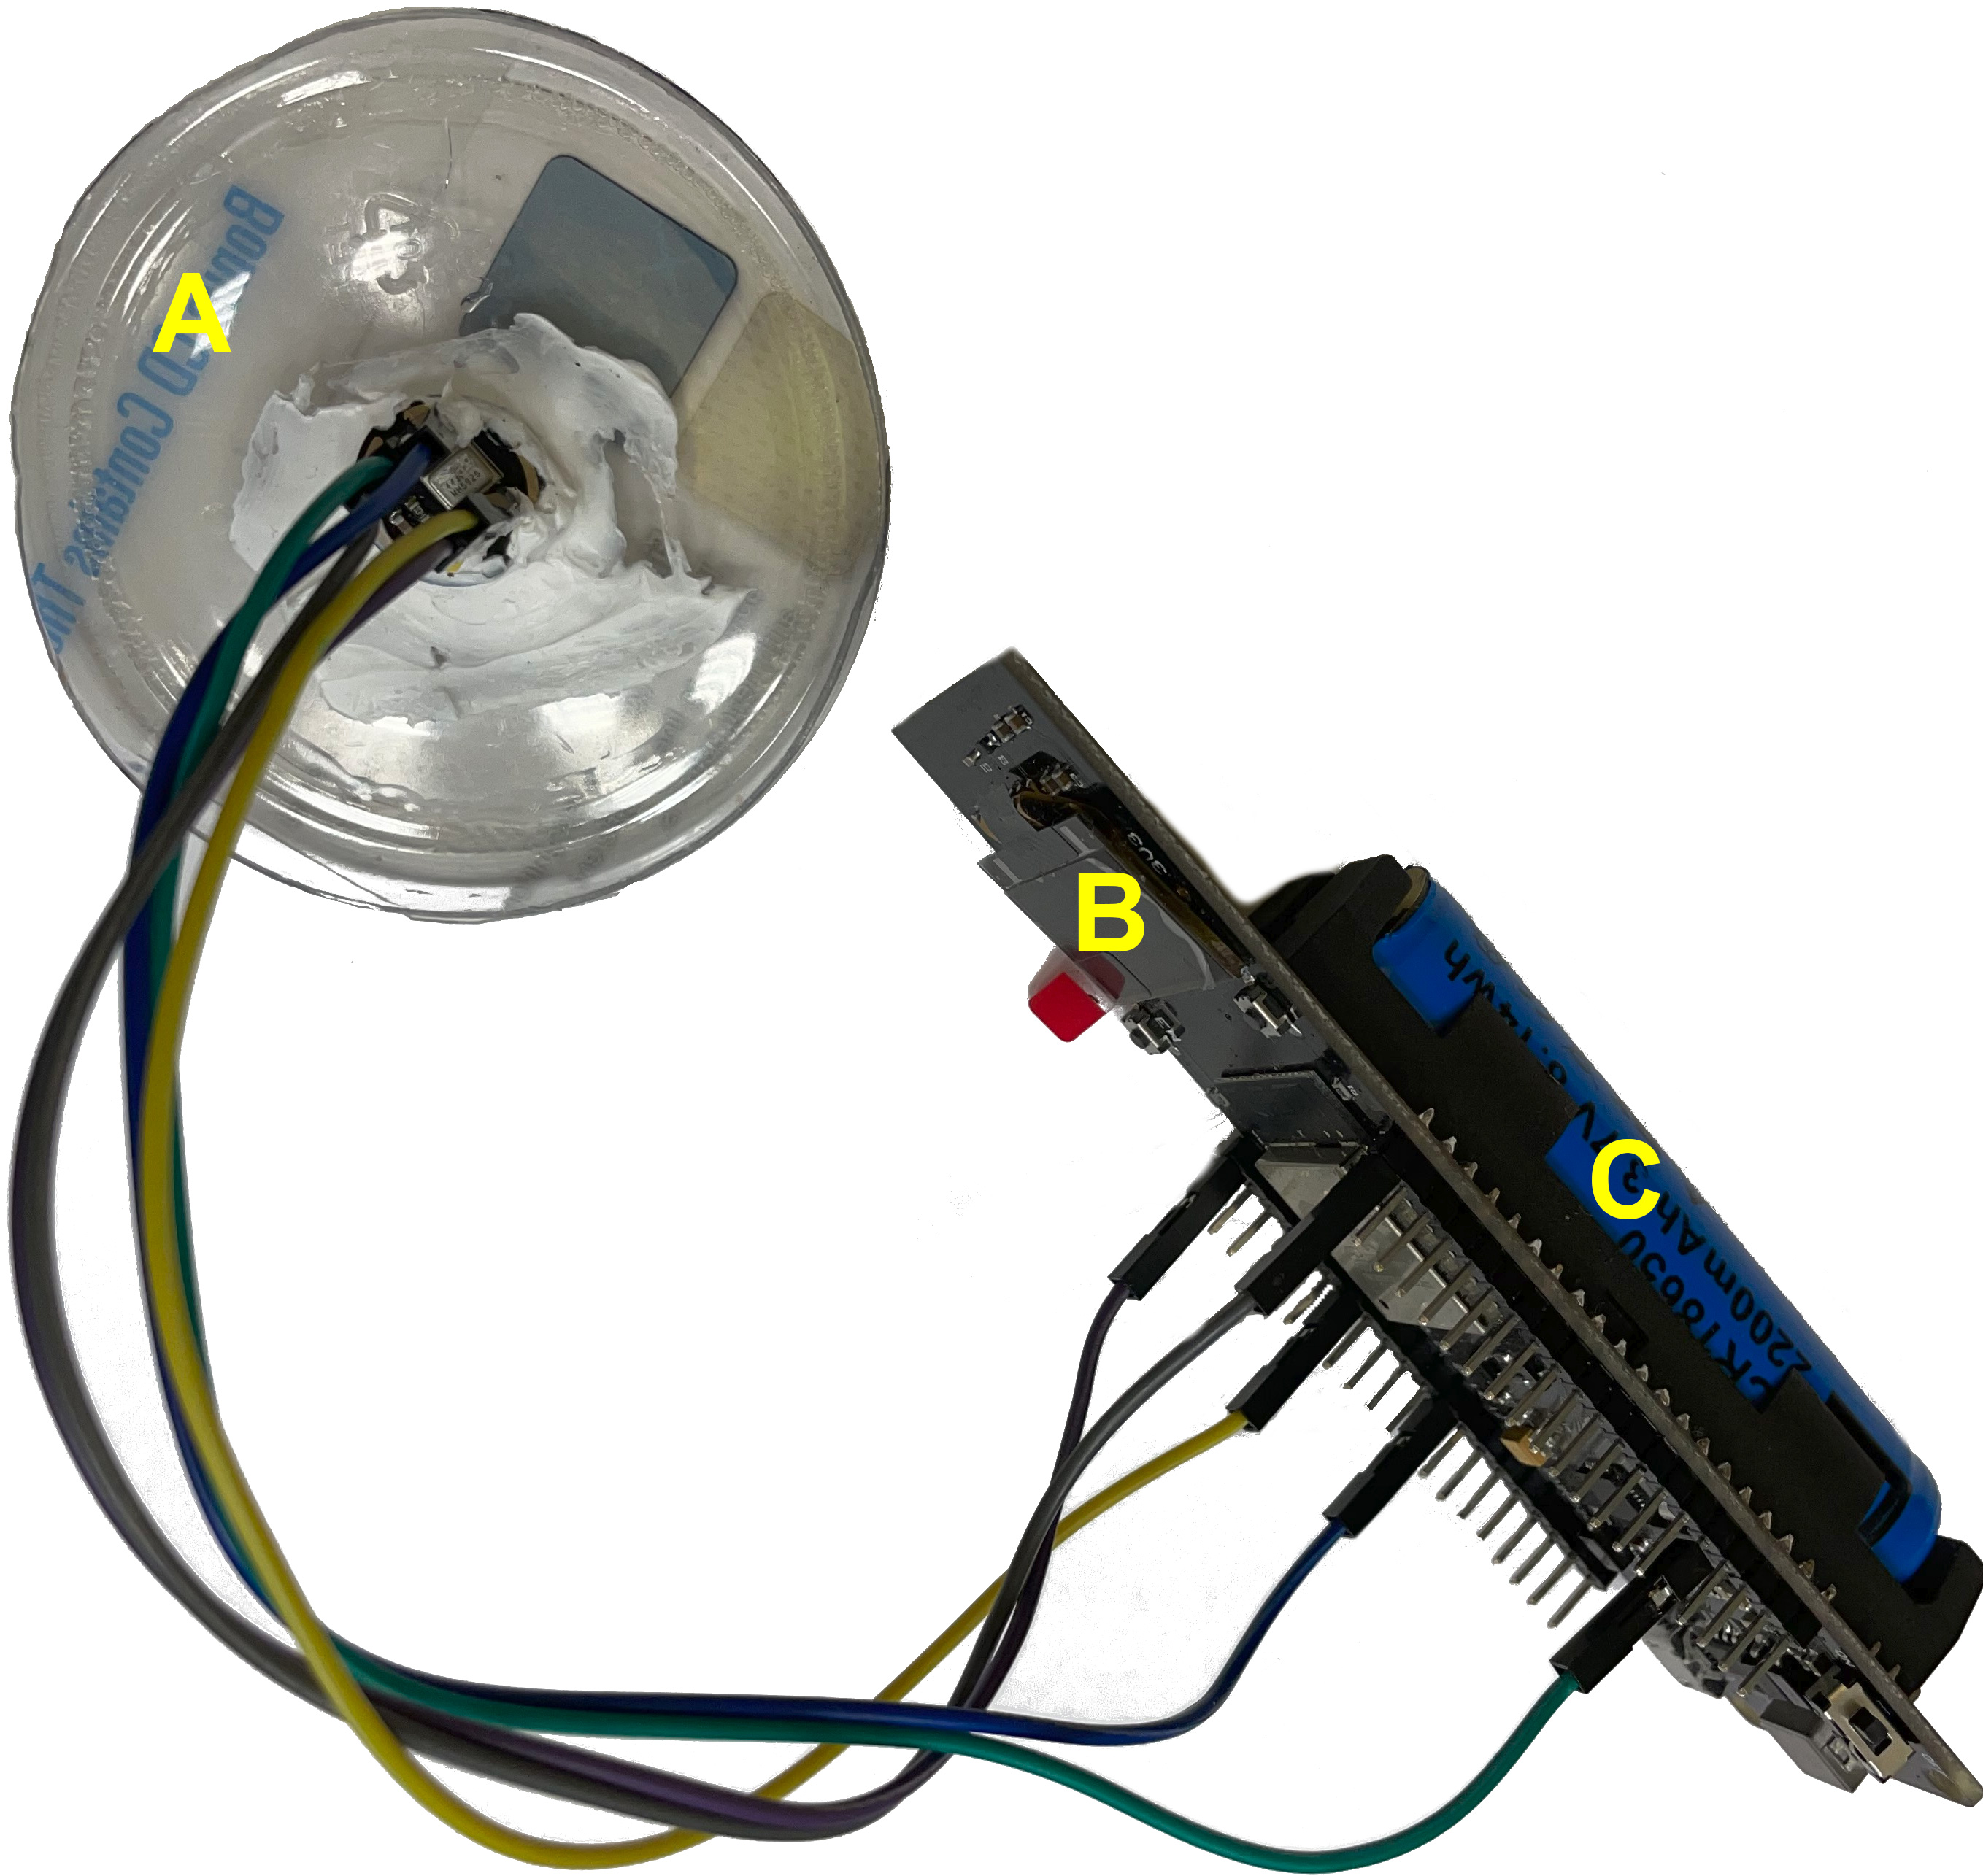
Figure 3.
Low-cost prototype for monitoring and estimating the HR and its main component: (A) INPM441 MEMS microphone, (B) ESP32-based microcontroller and (C) power battery.
Regarding the microphone, the choice was made based on a compromise between the suitability of the device for this application and its price. Although some microphones are specifically designed to capture biomedical signals [45], the main drawback of these devices is their high price, which makes them less attractive for use in the proposed prototype. For this reason, this research focused on finding a general-purpose and low-cost microphone that can be directly attached to the ESP32 using any of the available communication interfaces. A cost-effective option is the INMP441 omnidirectional microphone [46], as displayed in Fig. 2. The most relevant features of this microphone are summarized in Table 1. This microphone was also selected because of its bandwidth, from 60 Hz to 15 kHz. This frequency range guarantees proper performance of the proposed system. To capture the heart and lung signals, an adapter made of cone-shaped plastic was used along with a plastic film to place the microphone in contact with the skin. Note that this is how regular stethoscopes work to match the impedance of the skin to that of air.
As previously mentioned, the ESP32-based microcontroller does not have sufficient computational resources to process the audio stream and to separate the target sounds. Therefore, it serves as an acquisition device that sends captured audio to an external agent. Thus, data from the microphone are digitally sent to ESP32 using an I
The prototype is shown in Fig. 3. The total weight of the prototype was 110 g with a battery and 65 g without a battery. Finally, the total cost of the hardware involved (phone and computer devices excluded) is less than 15 euros, which results in a low-cost solution and places it well below current solutions on the market.
Table 1
INMP441 features
| Interface | Digital I |
|---|---|
| Signal-to-noise ratio | 61 dBA |
| Sensitivity | |
| Frequency response | 60-15000 Hz |
| Power consumption | 1.4 mA |
| Power supply rejection (PSR) |
3.2Proposed method
The system takes as input the cardiac and respiratory sounds captured by a microphone attached to the surface of the chest wall using previously described hardware. The output of the system is the separation of the lung and heart sounds. As a case study, a final stage for the heart rate prediction has been also designed.
A block diagram of the proposed method is shown in Fig. 1. The framework consists of three main stages: preprocessing, separation, and HR estimation. In the following subsections, the main functions of each stage are described in detail.
3.2.1Preprocessing stage
As can be seen in Fig. 1, the preprocessing stage must be computed beforehand, and it consists of three successive steps: signal representation, normalization, and parameter initialization.
First, considering the mixing problem in Eq. (1), the STFT of the audio mixture
(7)
where the
Then, an effective initialization step is proposed for the NMF approach with the aim of reducing the computational complexity and improving separation. NMF is a powerful unsupervised learning method that extracts meaningful non-negative features from an observed non-negative data matrix. However, the result obtained by this algorithm always depends on the initial values of the NMF parameters owing to the existence of local minima. To solve this problem, this study proposes a unique initialization for NMF parameters based on singular value decomposition (SVD) [47]. It has been proven that this initialization helps select the lowest meaningful rank of the factorized matrices [48, 47, 49]. Thus, no random values or hyperparameters were required. The main feature of this approach is that the NMF algorithm converges to the same solution while rapidly providing an approximation with an error that is almost as good as that obtained via the deployment of alternative initialization schemes [47].
In this study, the bases
(8)
where
(9)
In this regard, a primitive initialization for
(10)
where
(11)
Finally, the optimal initialization for
As can be observed, the computational complexity of the preprocessing stage is primarily determined by STFT and SVD computations. The FFTW package [51] was used for STFT implementation. Thus, the overall complexity of the sequential version for computing the magnitude spectrogram of the input is given as
(12)
where
(13)
where
Regarding the parameter initialization step, the SVD algorithm was implemented using the LAPACK implementation based on the blocked Householder transformations presented in [53]. Thus, the SVD of a matrix
3.2.2Separation stage
The goal of this stage is to extract heart-sound signals from the input audio mixture. For this purpose, the same framework presented in [28, 32] is followed. This framework is based on an NMF method and clustering process in combination with soft-masking filtering (see Section 2.2). However, significant changes have been made to adapt this stage to the target problem, that is, real-time estimation of health parameters on low-cost devices. In this way, the main constraint imposed by this problem is based on alleviating the computational burden for two main reasons: 1) achieving real-time behavior and 2) reducing the power consumption of the computing nodes to respect the use of batteries.
To satisfy this requirement, the size of the NMF matrices was reduced because of the new initialization described previously. Moreover, this initialization strategy results in faster convergence and better overall error at convergence [50]. Therefore, the number of iterations of the NMF algorithm was reduced to obtain a faster performance.
Finally, the clustering strategy was modified by considering only the energy distribution of the lung and heart sounds in different frequency bands. The power spectral density (PSD) of the lung and heart signals is scattered in different frequency bands [39, 54, 55].
The energy of heart sounds is largely condensed in the frequency range [0–260] Hz, whereas the energy of lung sounds is largely located in the frequency range [260
(14)
where
(15)
(16)
with
Note that this clustering approach has been simplified compared to [28] because it does not require neither pretrained of the heart bases or temporal correlation of NMF activations.
The implementation of (5) and (4) was carried out using two parallelization techniques: (1) calling BLAS [56], and (2) using OpenMP directives. Both multiplicative update rules result in two matrix-matrix products (calculated by calling BLAS subroutine dgemm), along with other less computationally intensive auxiliary operations. Thus, the computational complexity of the parallel version is given by:
(17)
where
For the parallel implementation of the clustering process, a coarse-grained parallelism strategy was chosen using BLAS routines and OpenMP directives. Thus, the computational complexity of this stage is given by:
(18)
Then, fine-grain parallelism is considered for the source signal reconstruction to compute the Wiener masks. The computational complexity can be expressed as:
(19)
3.2.3HR estimation stage
Herein, a simple and efficient method designed for HR estimation is presented. Note that this method takes as input the magnitude spectrogram of the heart signal
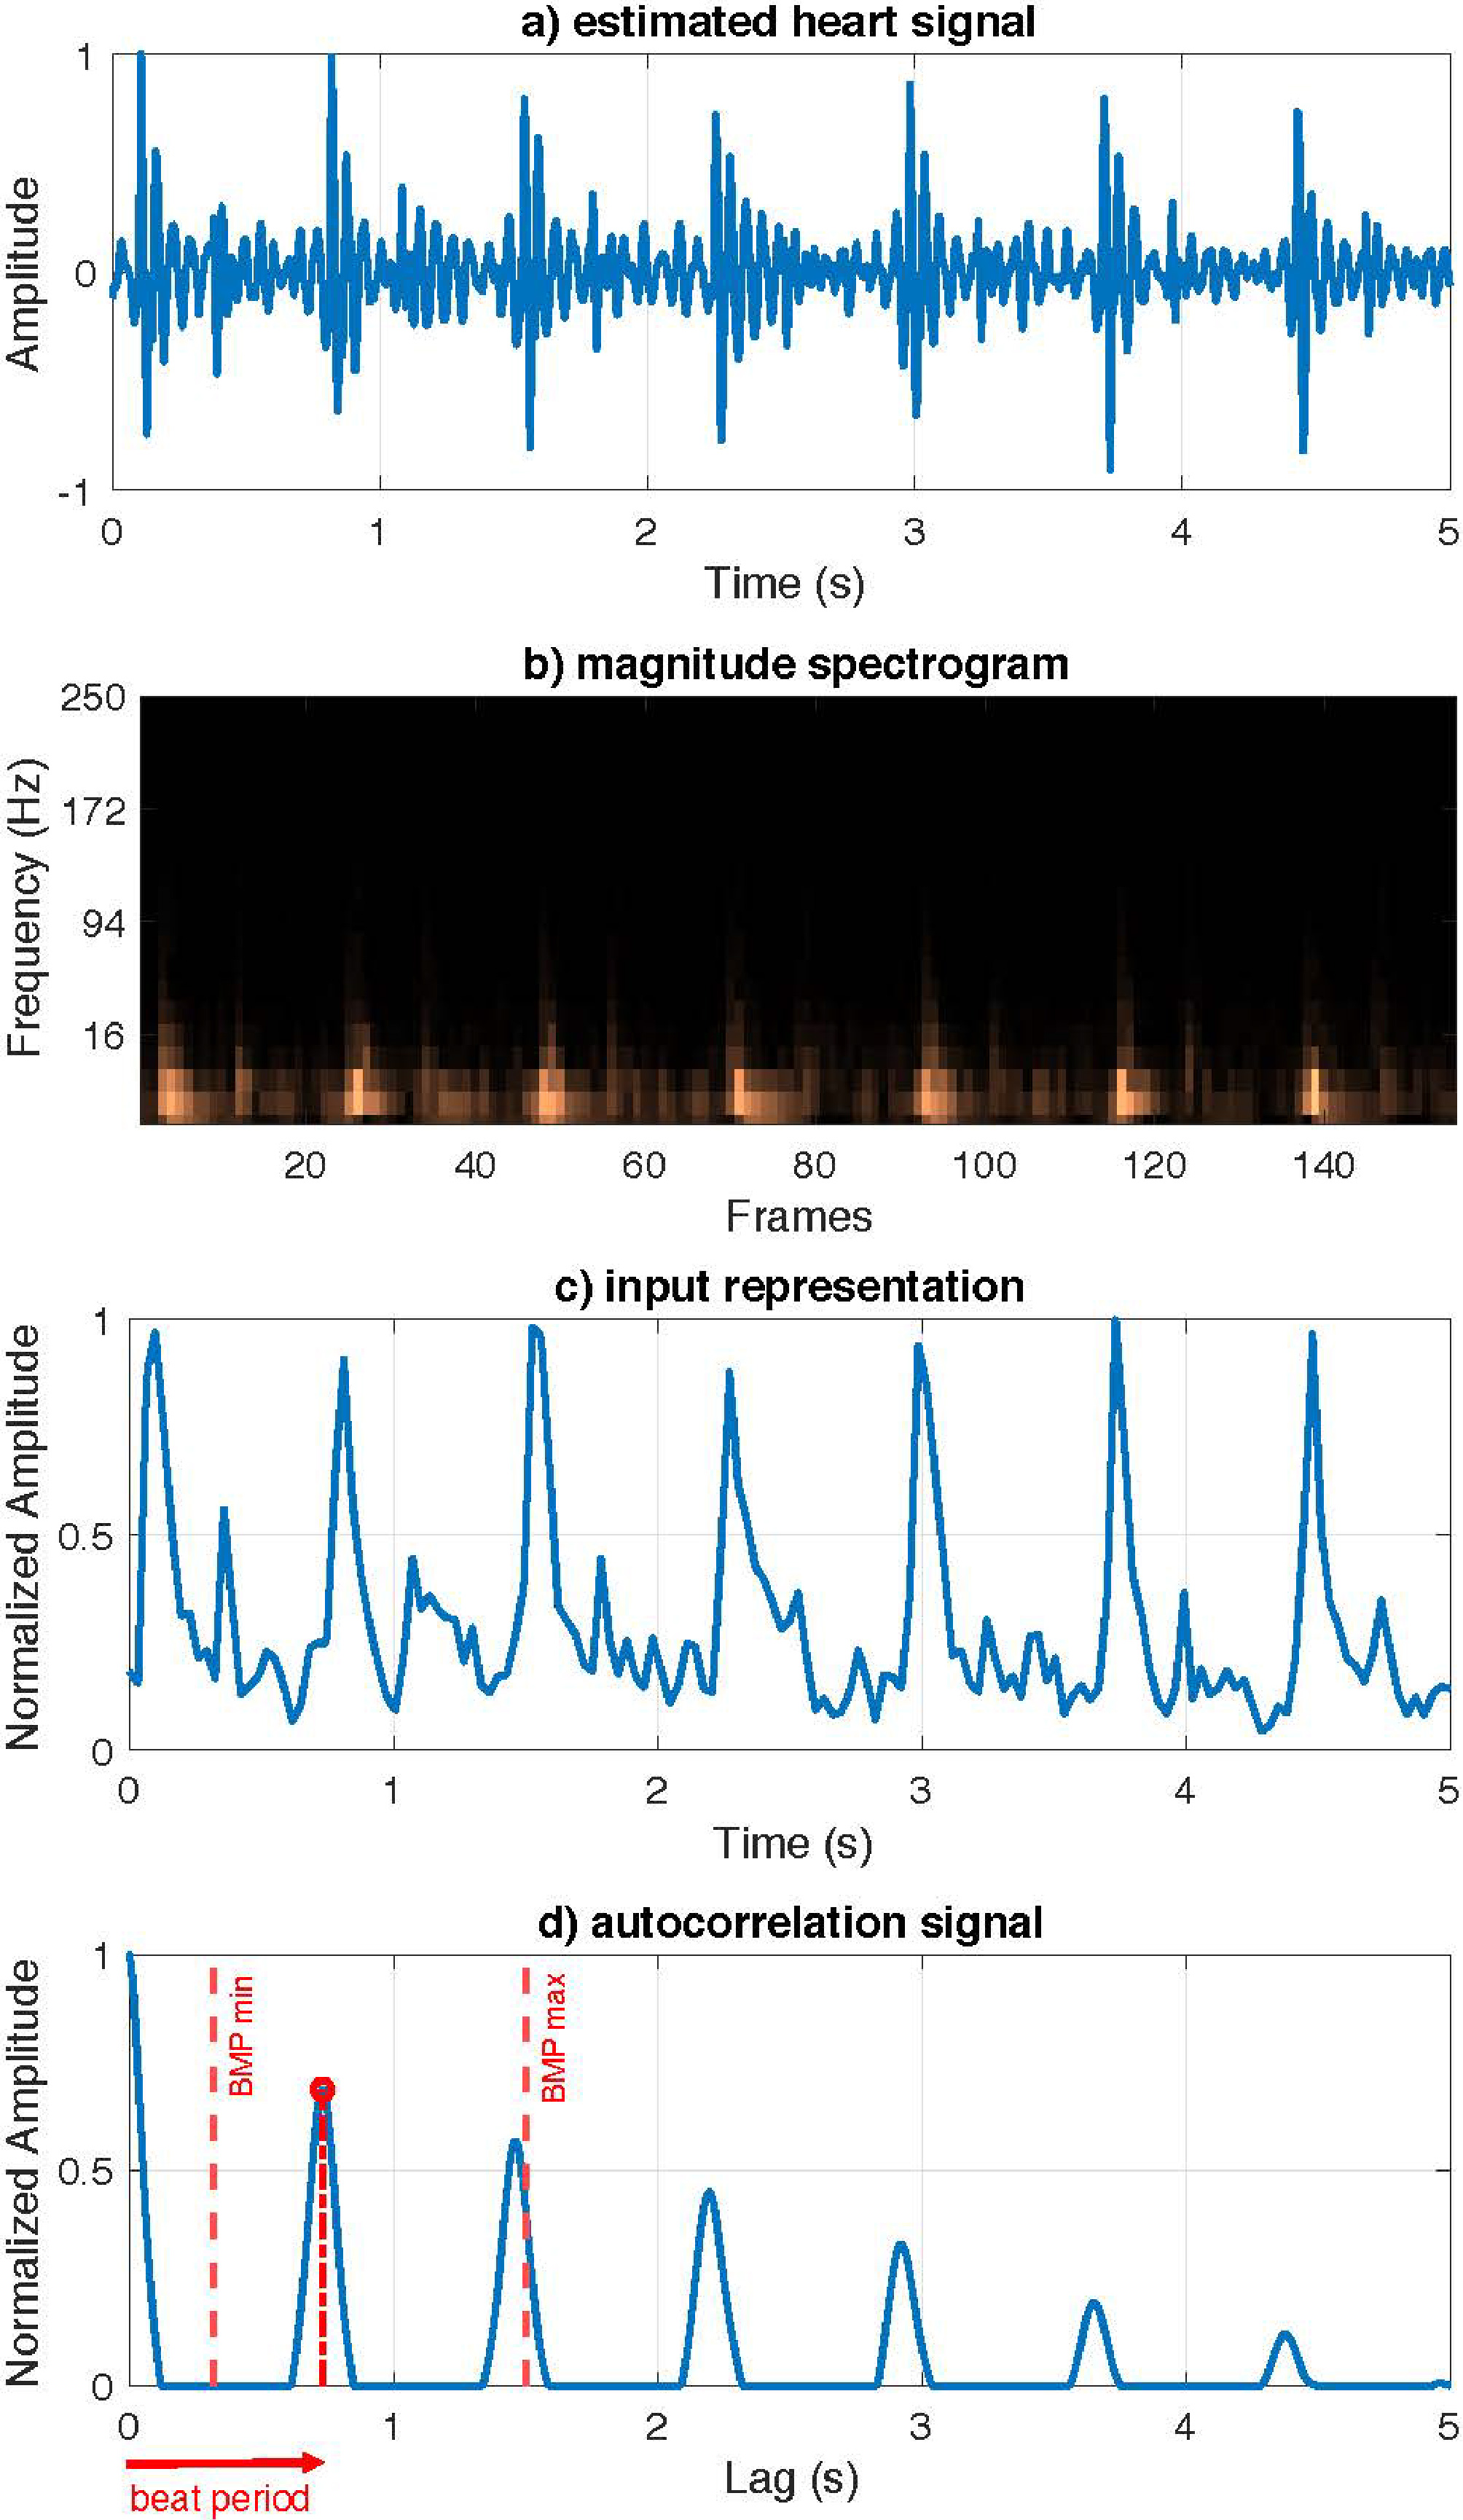
To estimate the HR, the first step consists of transforming this input spectrogram into a more meaningful compact representation from which to infer the heartbeats. The new representation is computed by the Euclidean norm of the estimated spectrum of the heart signal for all temporal frames, as follows:
(20)
Then, a linear interpolation process is performed over
To estimate the HR, the autocorrelation function of the current representation was used to determine the periodicity of the signal obscured by noise. Thus, to achieve an autocorrelation function with clear and well-defined peaks, the values of
(21)
where
Finally, the strongest peak within the range of possible heart rates for a healthy heart must be selected, that is,
(22)
where
Figure 4.
Proposed HR estimation model. a) Input estimated heart signal. b) Magnitude spectrogram of the estimated heart signal. c) Euclidean norm of magnitude spectrogram. d) Autocorrelation function with the beat period.
The proposed method for HR estimation is summarized in Algorithm 4.
: HR estimation algorithm[1] Inputs: Mixture audio signal
Concerning the computational complexity of the HR estimation stage, note that the implementation was performed using BLAS routines and OpenMP directives. Thus, the theoretical computational complexity of the parallel version can be computed by considering the property of the sum of the Big O notation as:
(23)
4.Experimental results
In this section, the proposed algorithm is evaluated for the heart and lung separation and real-time HR estimation. Two types of experiments were conducted. First, the reliability of the proposed system was tested using well-known datasets. Next, an analysis of the obtained results in terms of execution times was performed in a second experiment.
Table 2
NVPModel mode definition
| NVPModel configuration | ||||
|---|---|---|---|---|
| Mode | No. CPUs | Power budget (W) | Max. frequency (MHz) | 1st Equiv. architecture |
| 0 | 8 | n/a* | 2266 | ARMv8 (2016) |
| 1 | 2 | 10 | 1200 | ARMv7 (2011) |
| 2 | 4 | 15 | 1200 | ARMv7 (2012) |
| 3 | 8 | 30 | 1200 | ARMv8 (2015) |
| 4 | 6 | 30 | 1450 | ARMv8 (2016) |
| 5 | 4 | 30 | 1780 | ARMv8 (2013) |
| 6 | 2 | 30 | 2100 | ARMv8 (2016) |
*NVIDIA does not provide the power budget value for Mode 0. Some experimental measurements under different configurations and load conditions were conducted to infer that this value is 40 W.
4.1Datasets
The performance of the proposed HR estimation approach was assessed using three different databases. The database developed by Yaseen et al. [57] was used first. This database consists of a normal and abnormal set of heart sounds, classified into five categories: normal, aortic stenosis, mitral stenosis, mitral regurgitation, and mitral valve prolapse. For the evaluation of the proposal, a subset of normal heart sounds was used, consisting of 200 audio samples with a duration between 2 and 3 s with an 8 kHz sampling frequency. Because this dataset does not include lung sounds, it was only used for validating the proposed HR estimation method.
Second, a public dataset of heart sounds released in the Classifying Heart Sounds Pascal Challenge competition [58] was used. This competition provides two datasets, Dataset A and Dataset B. Here, Dataset A was used because it was generated in conditions similar to those pursued by the proposal, unlike Dataset B, which is a set collected in a hospital environment. Dataset A was obtained from volunteers and recorded with the iStethoscope (i.e., a mobile application) in real-world conditions. The dataset contains 176 audio samples with a duration between 5 and 10 s in wav format with 44.1 kHz sampling frequency, and is organized as four categories: normal, murmur, extra heart sound, and artifact. Once again, 21 audio samples categorized as normal sounds were selected for the validation of the proposal.
Finally, the database collected by Canadas-Quesada et al. [28] (APAC) is used. This database consists of a selection of 72 audio samples with a duration of 7 s in wav format with 8000 Hz sampling frequency. Audio files were generated using real-world heart and lung sound signals. Therefore, this database is suitable for demonstrating the need to first separate heart and lung sounds before estimating the HR.
These previously described datasets were created for several purposes, including the classification of heart-sound signals and separation of lungs and heart-sounds. However, in this study, the aim was to evaluate the proposed HR estimation task. Hence, cardiologists are required to label all audio files with the ground-truth heart rate. It is important to note that some samples were discarded by specialists because the heartbeat was not distinguishable. However, it was decided to test the proposed algorithm using all audio files.
4.2Experimental setup
In this study, the time-frequency representation is obtained using a 512-point STFT and half overlap between adjacent frames. The sampling rate is 8 kHz. With regard to the signal model, convergence of the NMF decomposition was empirically observed after 100 iterations. Thus, this value was chosen as the number of iterations required for the factorization process. Moreover, it was found that the optimal value of
For experimentation, the NVIDIA Jetson AGX Xavier development kit was used as testbed. This kit consists of a system-on-chip (SoC) with an eight-core ARM v8.2 CPU that operates at 2.26 GHz. This testbed supports several operating modes configured using the NVPModel command tool. This enables simulation of a wide range of mobile devices and embedded systems. The details of all operating modes are listed in Table 2. For each mode, the first equivalent ARM architecture with its market release year is also included. Seven operation modes and four power envelopes were defined. The possible numbers of running cores are eight, six, four, and two with different CPU frequencies.
4.3Evaluation metric
The source-separation performance of the proposal was objectively evaluated using the objective measures provided by the BSS_Eval toolbox [59]. These metrics are commonly accepted and represent a standard approach in the specialized scientific community for testing the quality of separated signals, allowing fair comparison with other state-of-the-art methods. BSS_EVAL provides the following metrics based on the energy ratios for each separated signal: the source to distortion ratio (SDR), the source to interference ratio (SIR) and the source to artifacts ratio (SAR) [59]. SDR reports on the overall quality of the separation process, SIR provides a measure of the presence of lungs in heart sources and vice versa, and SAR reports on the artifacts in the separated signal due to separation and/or resynthesis.
For quantitative evaluation of the reliability of the proposed HR estimator, the relative error metric was chosen. Thus, the estimated heart rate from the audio signal is denoted as HR
(24)
4.4Algorithms for comparison
To demonstrate the benefits of the proposed method, its separation performance is compared with that of other state-of-the-art algorithms. The different approaches compared here are as follows:
Figure 5.
Heart sound separation results using the BBS_Eval metrics averaged over the APAC dataset [28]. The error bars represent 95% confidence intervals.
![Heart sound separation results using the BBS_Eval metrics averaged over the APAC dataset [28]. The error bars represent 95% confidence intervals.](https://content.iospress.com:443/media/ica/2023/30-1/ica-30-1-ica220686/ica-30-ica220686-g005.jpg)
Figure 6.
Lung sound separation results using the BBS_Eval metrics averaged over the APAC dataset [28]. The error bars represent 95% confidence intervals.
![Lung sound separation results using the BBS_Eval metrics averaged over the APAC dataset [28]. The error bars represent 95% confidence intervals.](https://content.iospress.com:443/media/ica/2023/30-1/ica-30-1-ica220686/ica-30-ica220686-g006.jpg)
• SSA [60]. This method uses singular spectrum analysis (SSA) to separate heart and lung sounds. This is based on the fact that despite the frequency overlap of the heart and lung sound components, two different trends can be recognized in the eigenvalue spectra, which leads to finding a subspace containing more information about the underlying heart sound.
• AFT [61]. This algorithm is based on adaptive Fourier decomposition (AFD) to separate heart and lung sounds. First, a segmentation method based on the energy distribution in the time domain and a low-pass filter were applied to protect the heart sounds and reduce the lung sound energy. Then, an AFD-based extraction method was applied to reconstruct the heart-sounds. Finally, based on this extraction and the original mixed signal, the lung sounds can be extracted.
• EMD [62]. This method is based on the empirical mode decomposition (EMD) technique for demixing heart and lung sound signals. In this study, the mixed signal was split into several components without any prior information about the data to be analyzed.
• NMF [27]. This method performs blind recovery of the original cardiac and respiratory sounds from a single observation mixture in the NMF framework. The method learns the basis spectra of the mixing sources in an unsupervised or semi supervised fashion depending upon the application. Subsequently, a clustering approach was applied to the learned basis spectra to obtain the target signals.
• NMCF [31]. This approach is based on non-negative matrix co-factorization (NMCF) to separate heart and lung components. This method achieves separation by training with high-quality heart and lung sounds and factorizing the sounds of the input recording in parallel.
• Baseline [28]. The method described in Section 2.2 is also incorporated to the comparison.
4.5Results and discussion
This section presents the results obtainedfrom the evaluation of the proposed method in terms of source separation. The proposed HR estimation algorithm was then evaluated using the datasets presented in Section 4.1. Finally, the results in terms of execution times are presented to demonstrate the feasibility of the proposed algorithm in real-time.
4.5.1Heart and lung separation results
The separation performance of the proposed method is shown in Figs 5 and 6. Both show a comparison of state-of-the-art methods presented in Section 4.4, and the proposed method without considering SVD initialization (Proposal) and considering it (Proposal-SVD).
Regarding the proposed variants, Proposal-SVD achieves better results than Proposal, regardless of the metric and target signal (i.e., heart or lung signal). This is because of the robustness of SVD initialization, which avoids the problem of the existence of local minima in the NMF model [47].
Proposal-SVD obtains competitive results in terms of SDR, outperforming state-of-the-art methods, except Baseline. The slight underperforming with respect to Baseline is mainly due to the clustering strategy. Note that Baseline combines three clustering approaches at the expense of increasing algorithm complexity. In addition, Baseline only achieves optimal results when the entire audio signal is available because it is an offline algorithm (i.e., a non-causal algorithm that prevents its implementation in real time).
On the other hand, the proposed system outperformed all other methods in terms of added artifacts for both heart and lung sounds, as demonstrated by the SAR score. This is a key point of the proposal because the addition of artifacts in the separate signals degrades the performance of subsequent stages (such as HR estimation).
Finally, NMCF achieved the best results in terms of the SIR score for heart-sounds. This was expected because this method uses clean heart and lung signals to guide the factorization. This provides better isolation at the expense of artifact addition. With regard to lung sounds, the proposed method clearly obtained the best results in terms of SIR, resulting in a very good isolation of the lung signal.
4.5.2HR estimation results
The results obtained for each dataset presented in Section 4.1 are shown in Fig. 7. First, the performance of the proposed HR estimation method (see Section 3.2.3) is analyzed. As can be observed, the results obtained for the Yanseen dataset reveal a reliable performance of the HR estimation stage, as the maximum error in the 200 samples that compose the dataset is less than 5%. Note that the separation stage was not required because lung sounds were not included in the dataset. Therefore, this measure informs us about the best estimation that can be achieved in the absence of noise-masking heart sounds, that is, using clean heart sound signals.
Figure 7.
Averaged relative errors in HR estimation results over the datasets described in Section 4.1.
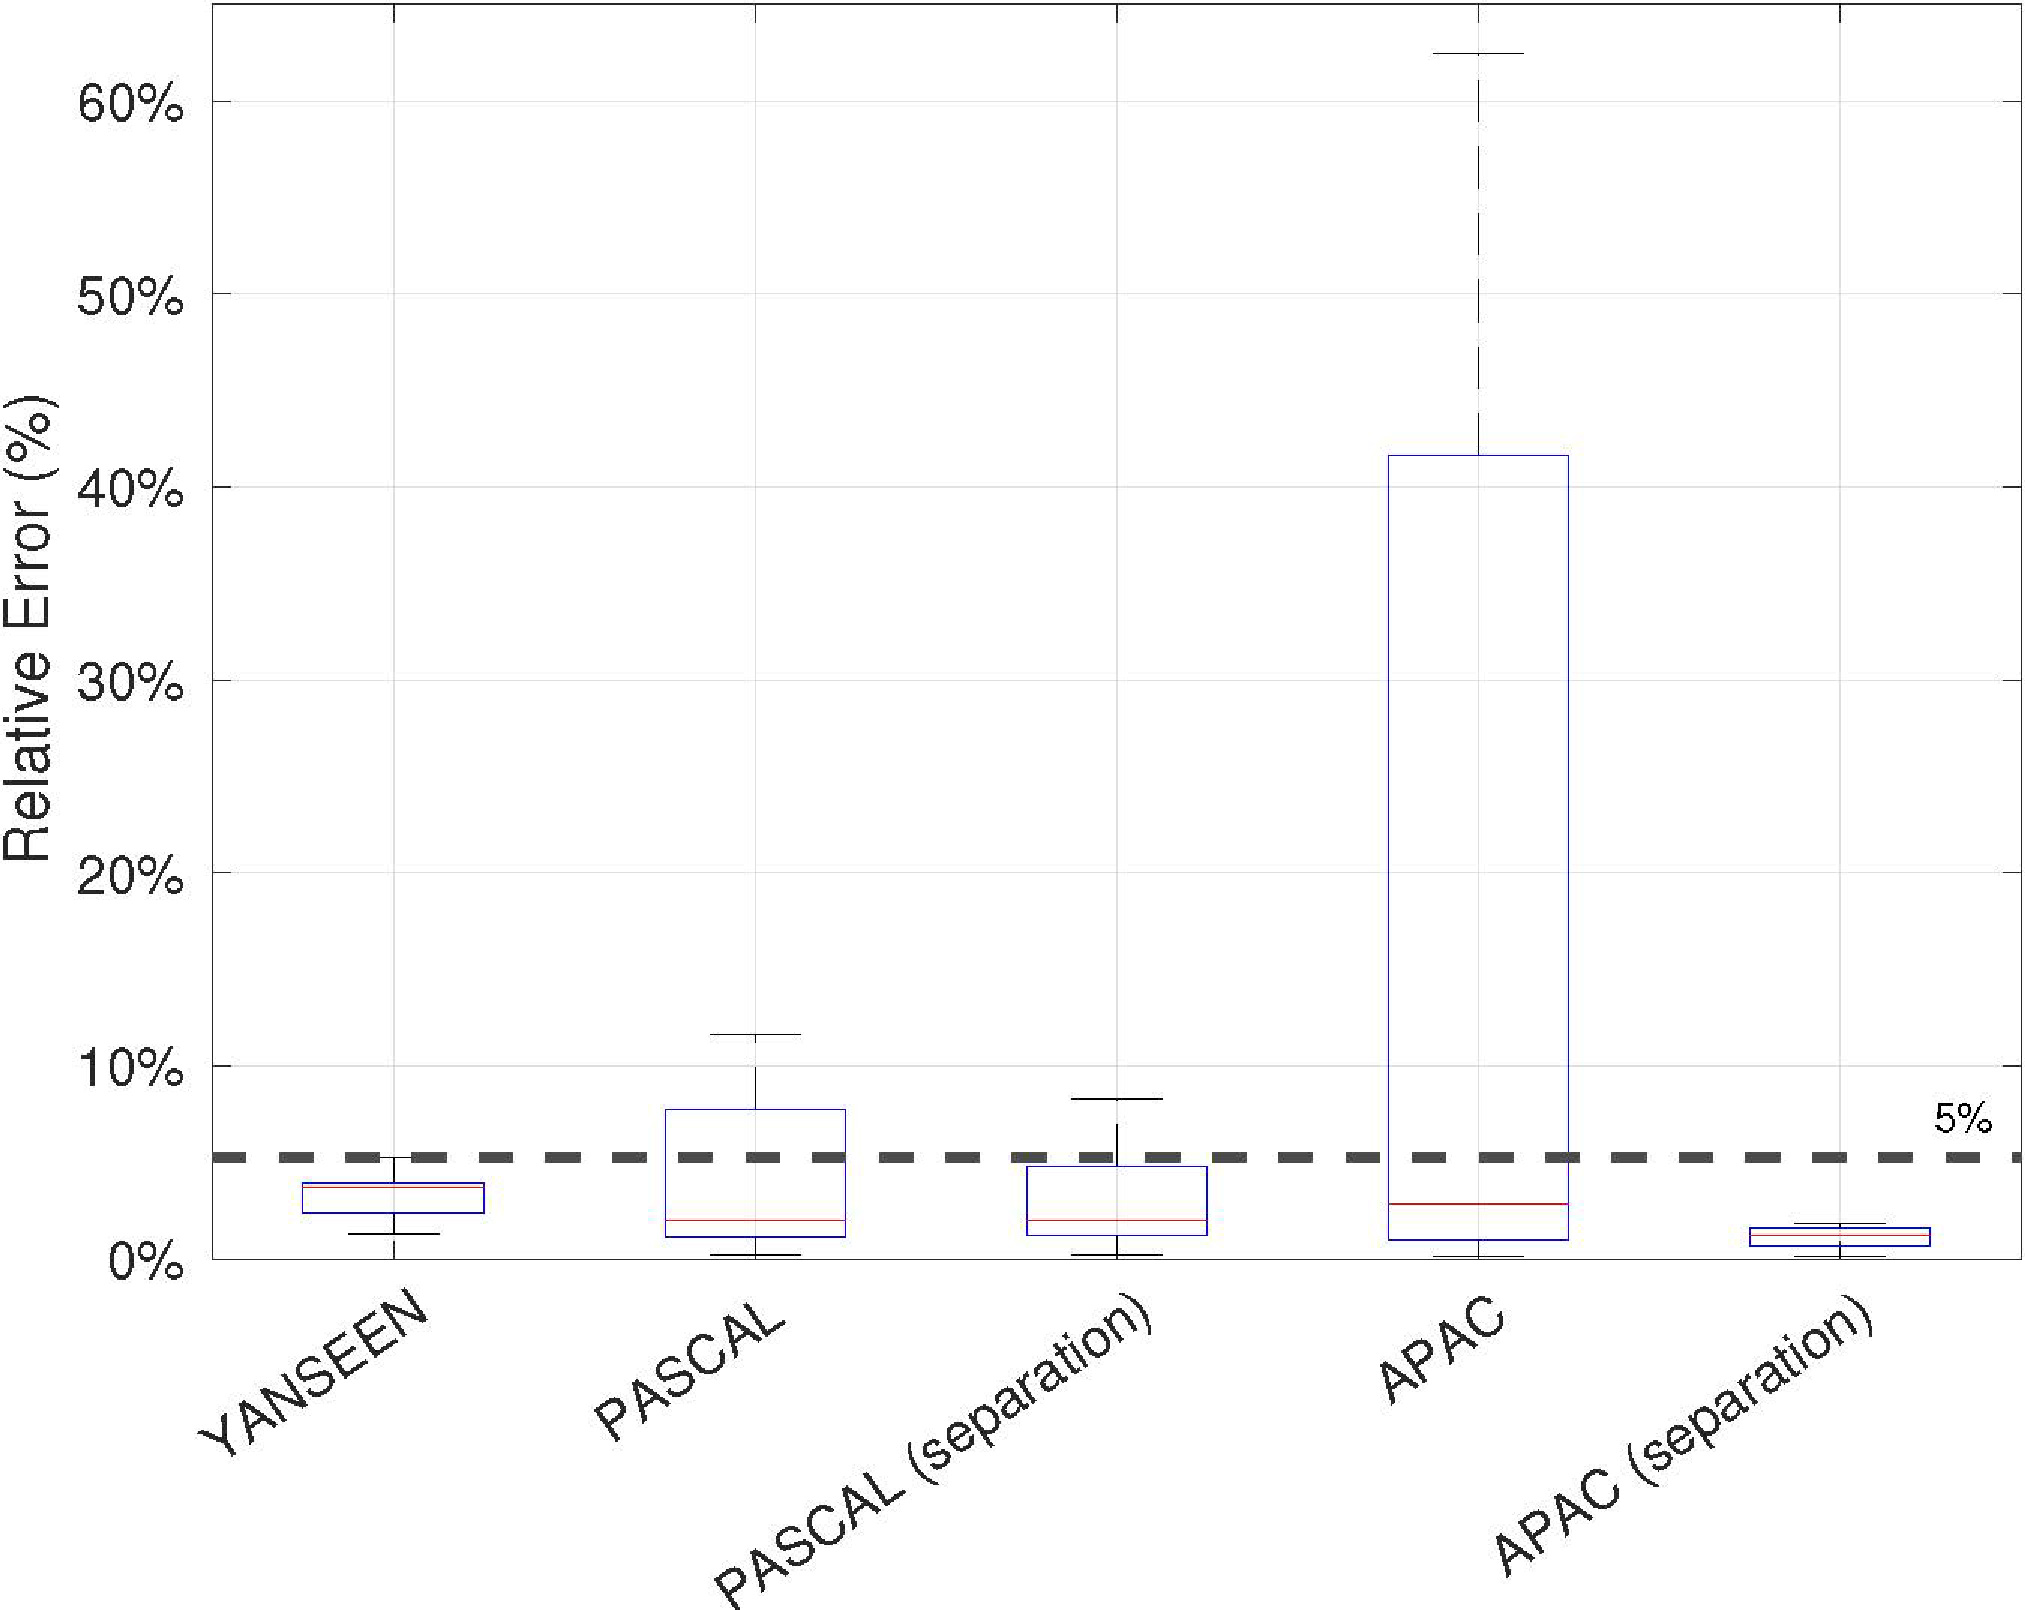
The results for the Pascal and APAC datasets showed the important role of the separation stage in the HR estimation task. As can be seen, the results significantly improve when the separation process is included in the algorithm for both datasets. In the case of the Pascal dataset, 9 of the 21 audio samples obtained a relative error greater than 5% when the separation was not performed. However, when the separation was applied, only 4 audio samples obtained a relative error greater than 5%, and the improvement was not more significant because the audio samples were recorded under highly noisy conditions. Note that the demanding 5% threshold was chosen as a benchmark to validate the reliability of the estimator. In the APAC case, 32 audio samples obtained a relative error greater than 5% when the separation was not performed. On the other hand, the relative error for the 72 audio samples is less than 3% when the separation of lung and heart sounds is performed.
4.5.3Execution time
To assess the possibility of estimating the HR in real time using the developed prototype (i.e., low-cost devices), the execution time of the proposed algorithm was measured over NVIDIA AGX Xavier. As the objective is to measure a subject’s heart rate periodically in real time, it is assumed that the algorithm should provide an estimate at least every second. Moreover, for proper estimation of the HR, an audio sample of approximately ten seconds long was considered in this experiment. Therefore, the HR was estimated every second using the previous ten seconds. Thus, the algorithm will be able to respond in real time if it is able to process ten seconds of audio in less than a second. The choice of this window is justified by the criterion of lower estimation error (the longer the window, the lower the error).
Figure 8.
Experimental results in terms of execution times measured in seconds as a function of the operating mode of the NVIDIA AGX Xavier.
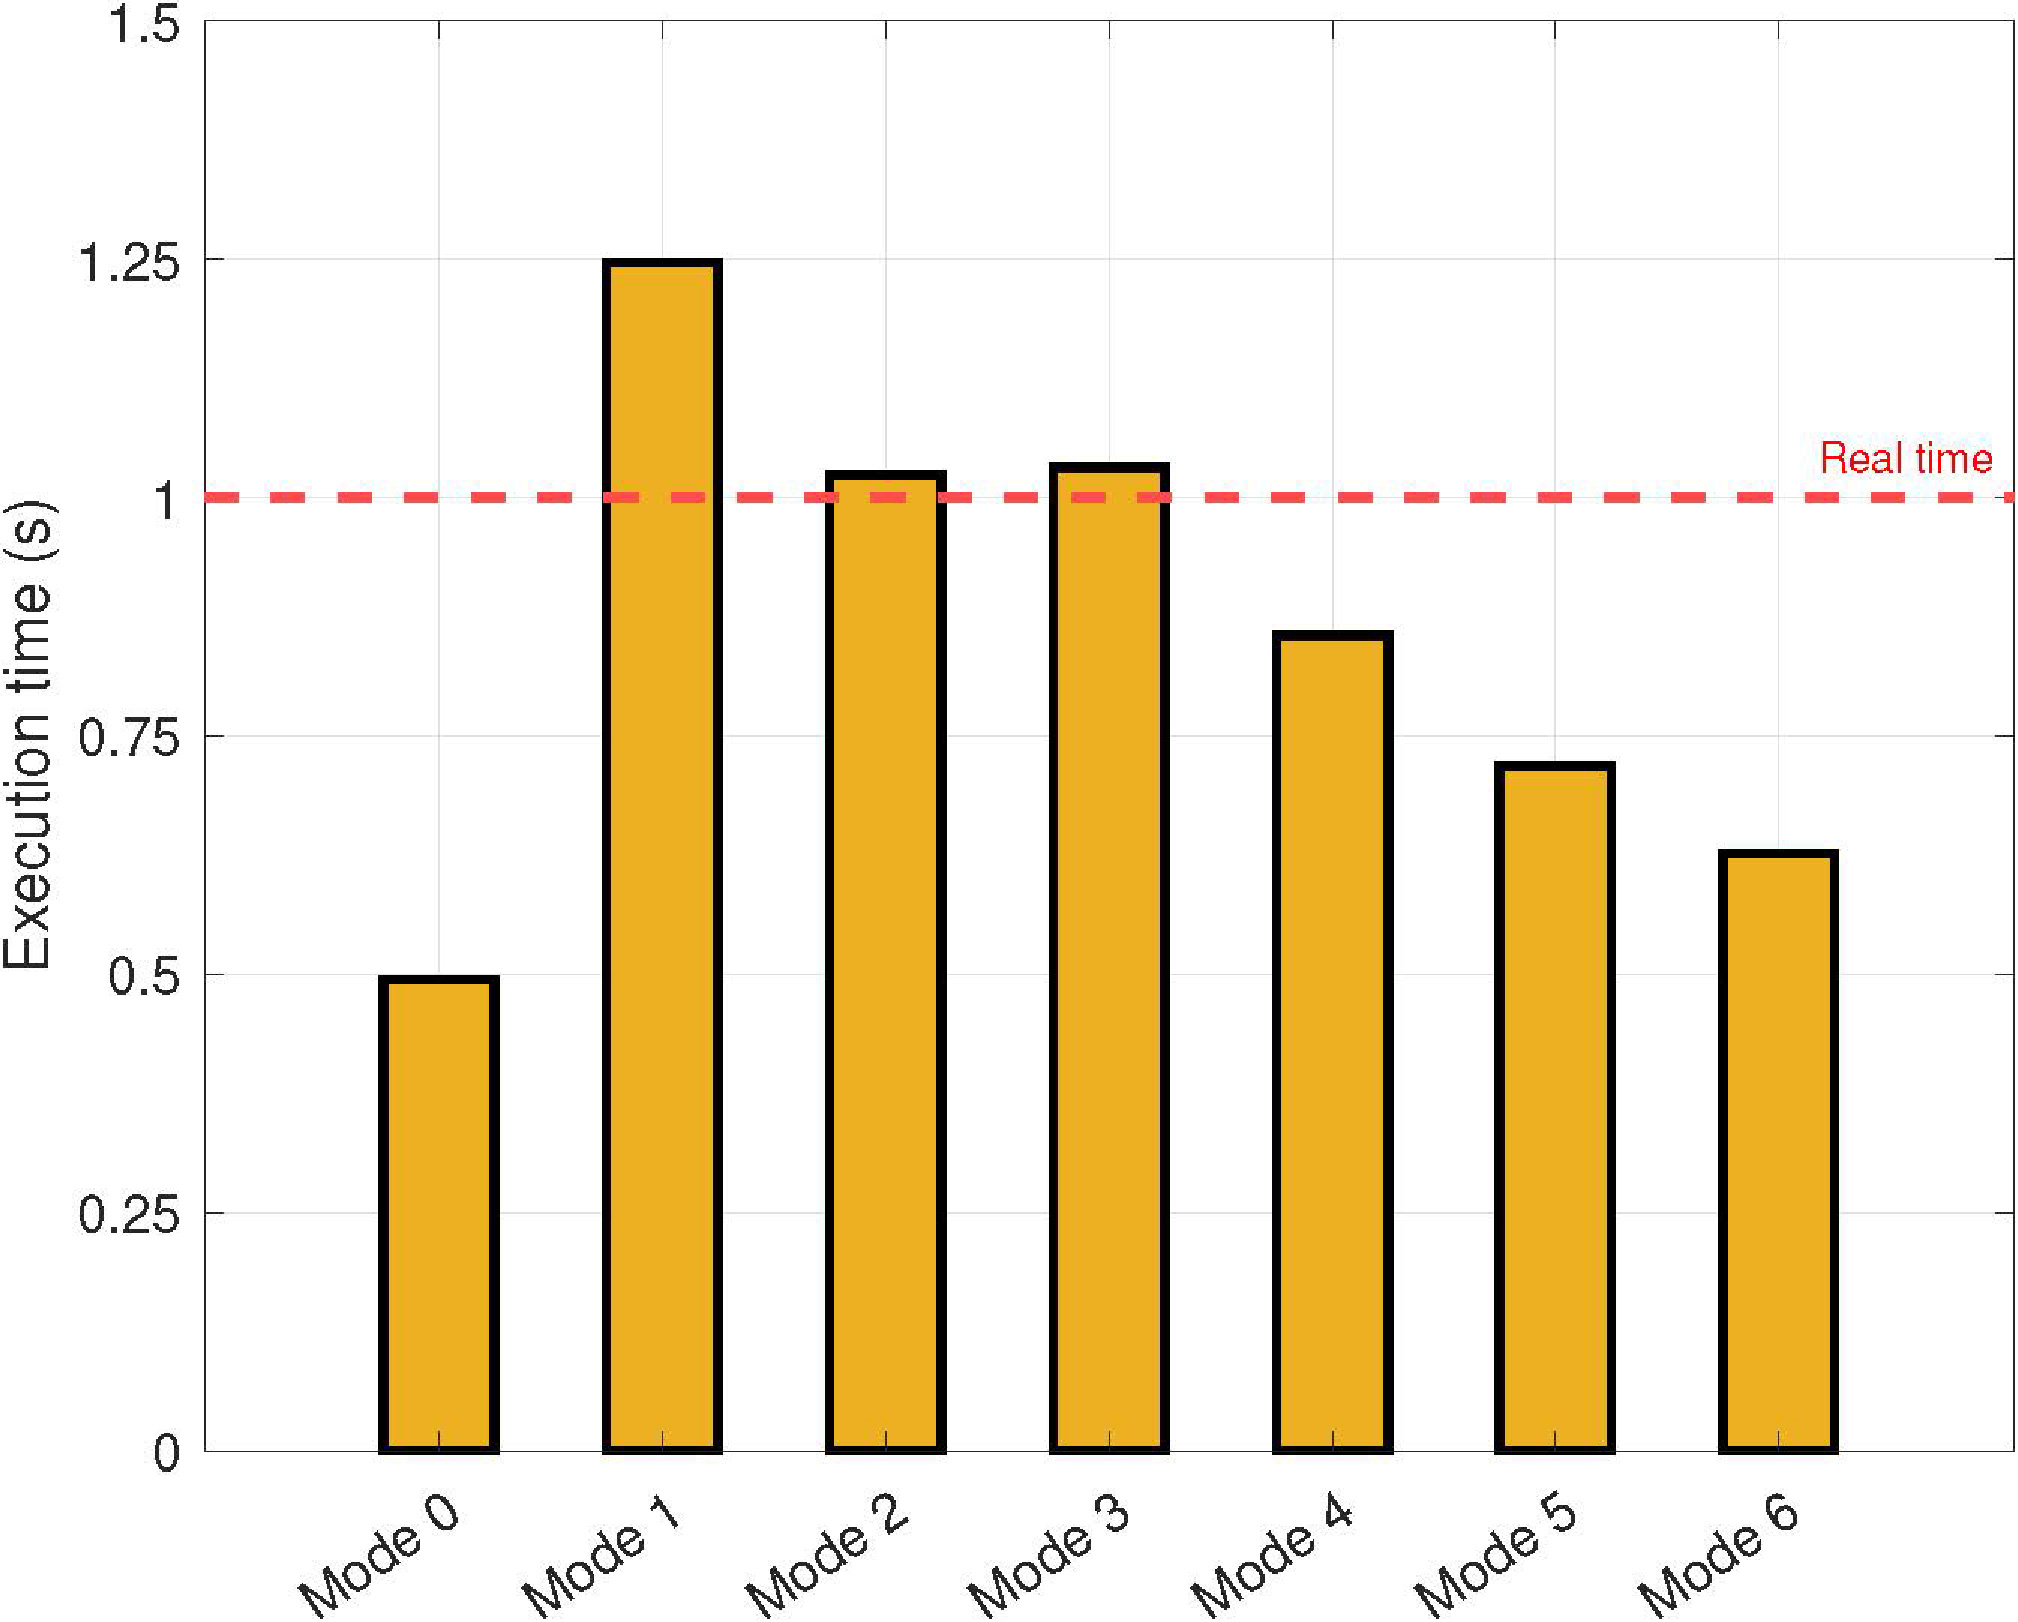
The results obtained in terms of the execution times are summarized in Fig. 8. These results are presented as functions of the operation mode of the NVIDIA AGX Xavier (see Table 2). As expected, the execution time increases as the CPU frequency and the number of cores decrease. Note that real-time is reached for CPU frequencies higher than 1200 MHz, regardless of the number of cores and power budget.
For low-cost devices with four available cores (i.e., Mode 5), the proposed parallel approach allows the execution of the application in real time. It is important to note this configuration because most current mobile devices satisfy this requirement.
5.Prototype validation
In this section, experiments conducted to evaluate the proposed prototype in a real-world scenario are presented. Moreover, the performance of the proposed prototype was compared with that of a commercial HR estimator based on ECG.
Table 3
Average HR measured for each power zone and subject in terms of BPM
| Power zones | ||||
|---|---|---|---|---|
| Subject | 1 (0 W) | 2 (50 W) | 3 (100 W) | 4 (200 W) |
| 1 | 72 | 92 | 130 | 147 |
| 2 | 66 | 83 | 99 | 113 |
| 3 | 62 | 79 | 102 | 127 |
| 4 | 82 | 108 | 124 | 140 |
Figure 9.
Diagram of the prototype validation setup.
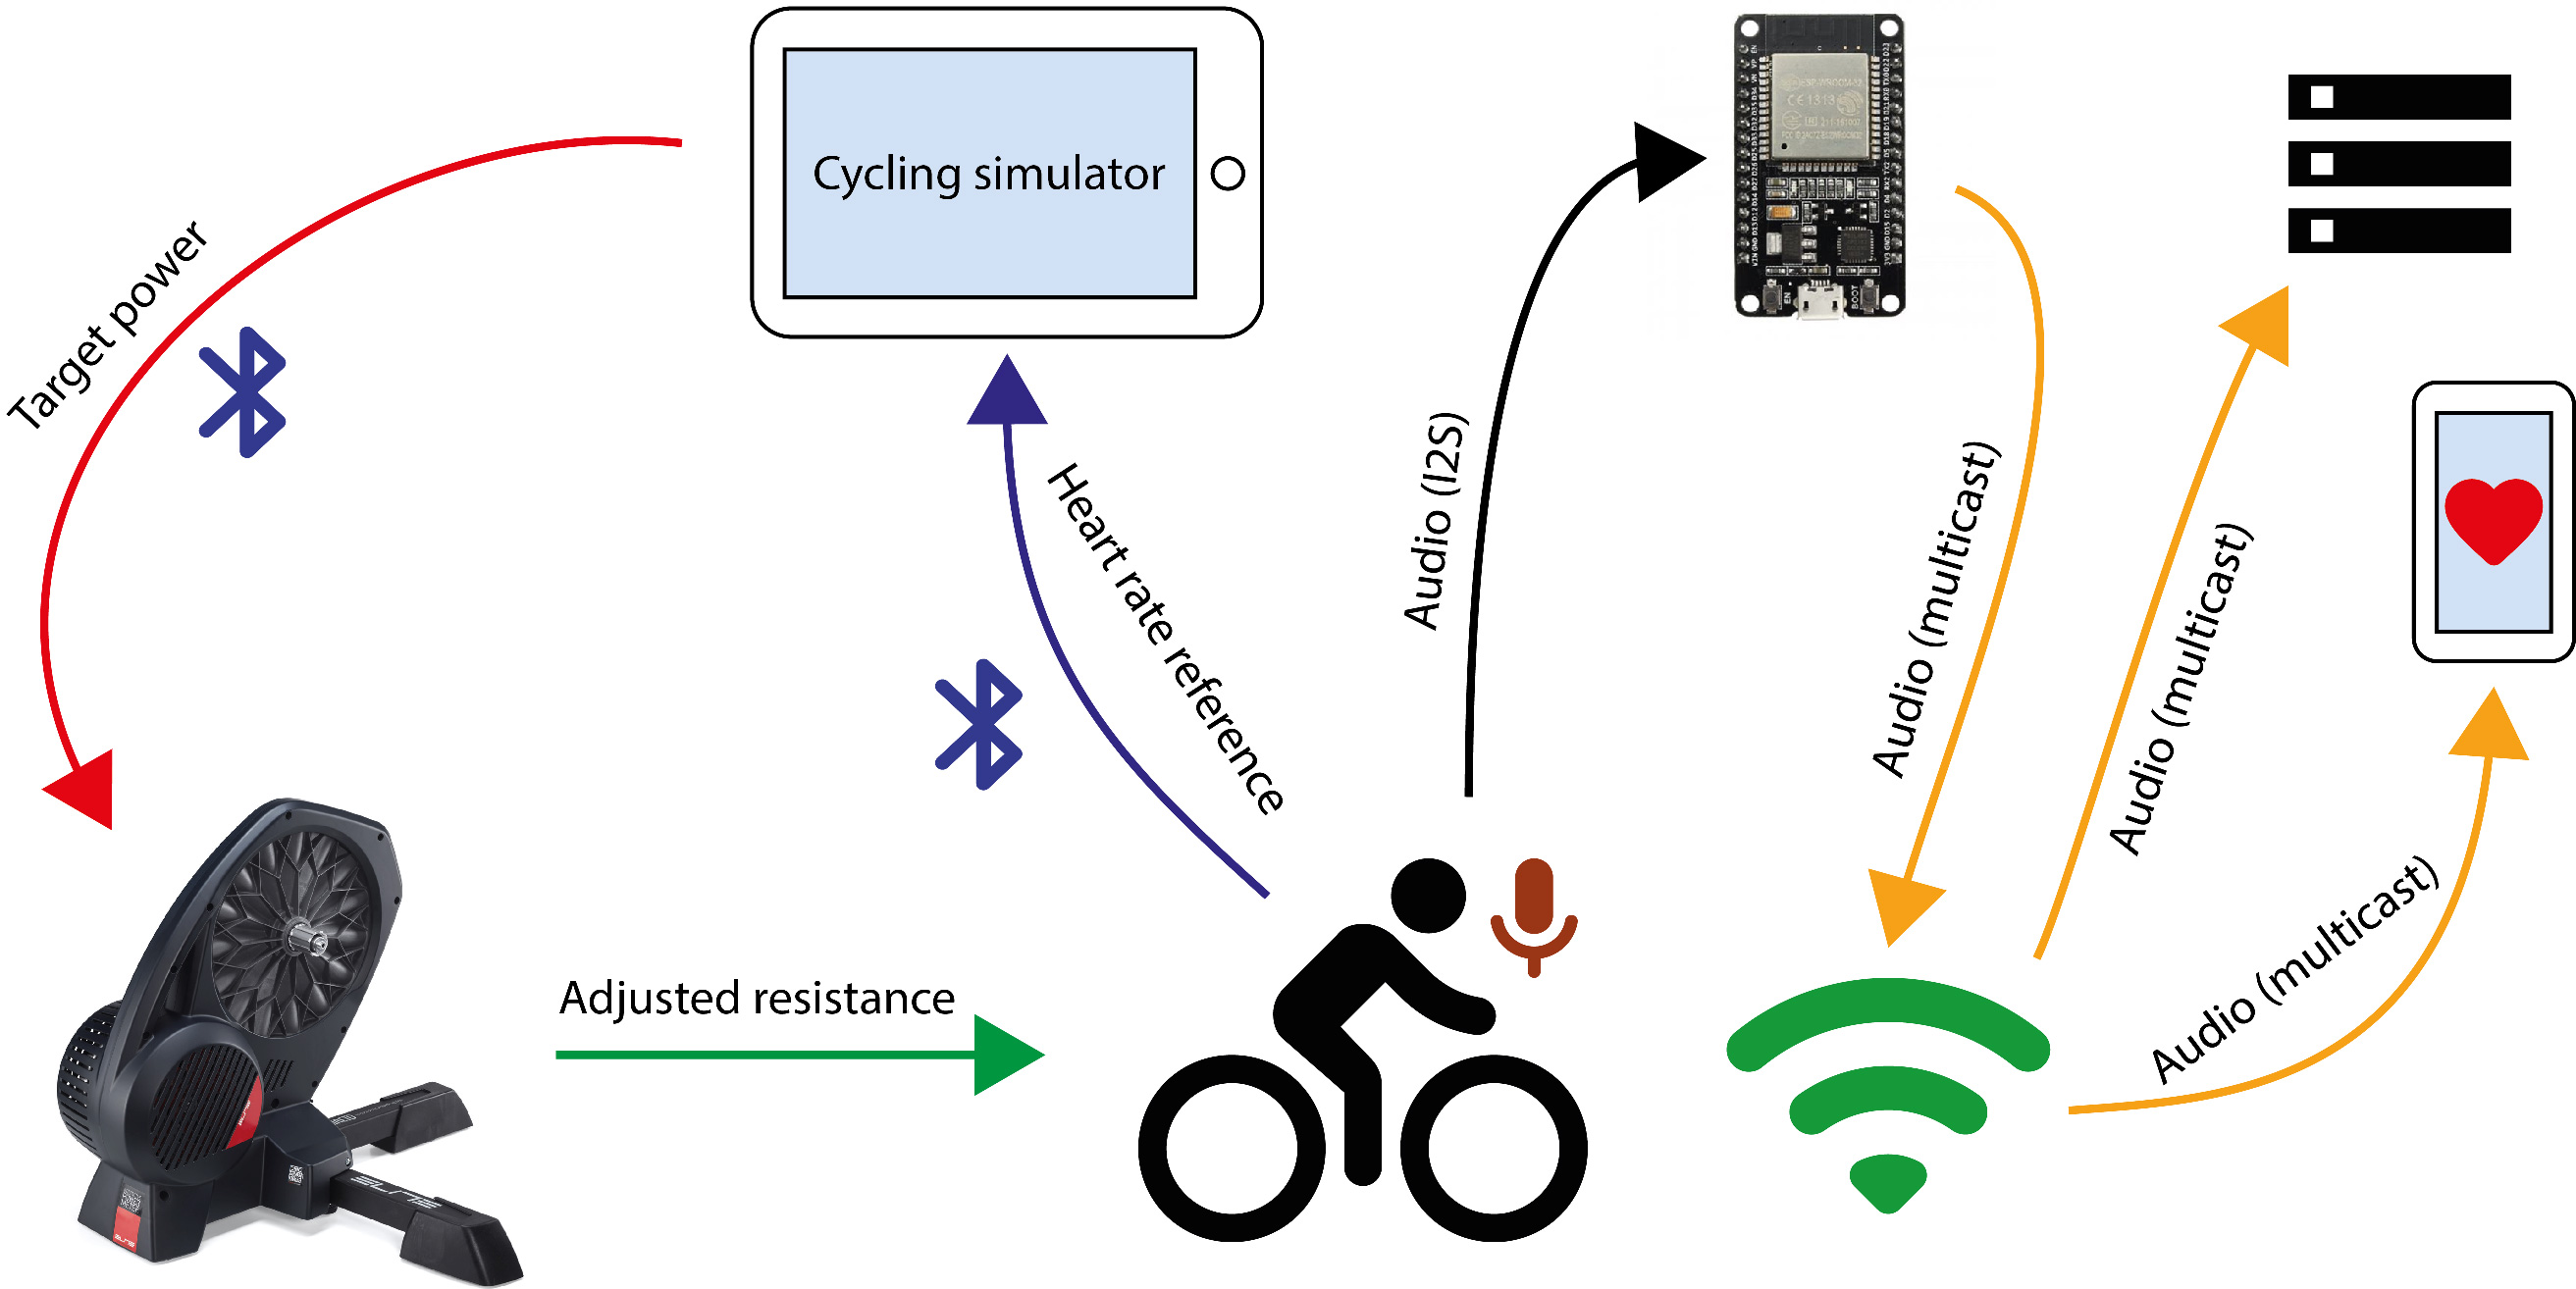
Figure 10.
Averaged HR estimation results for each power zone and subject in terms of relative error taking the ECG-based estimator as reference.
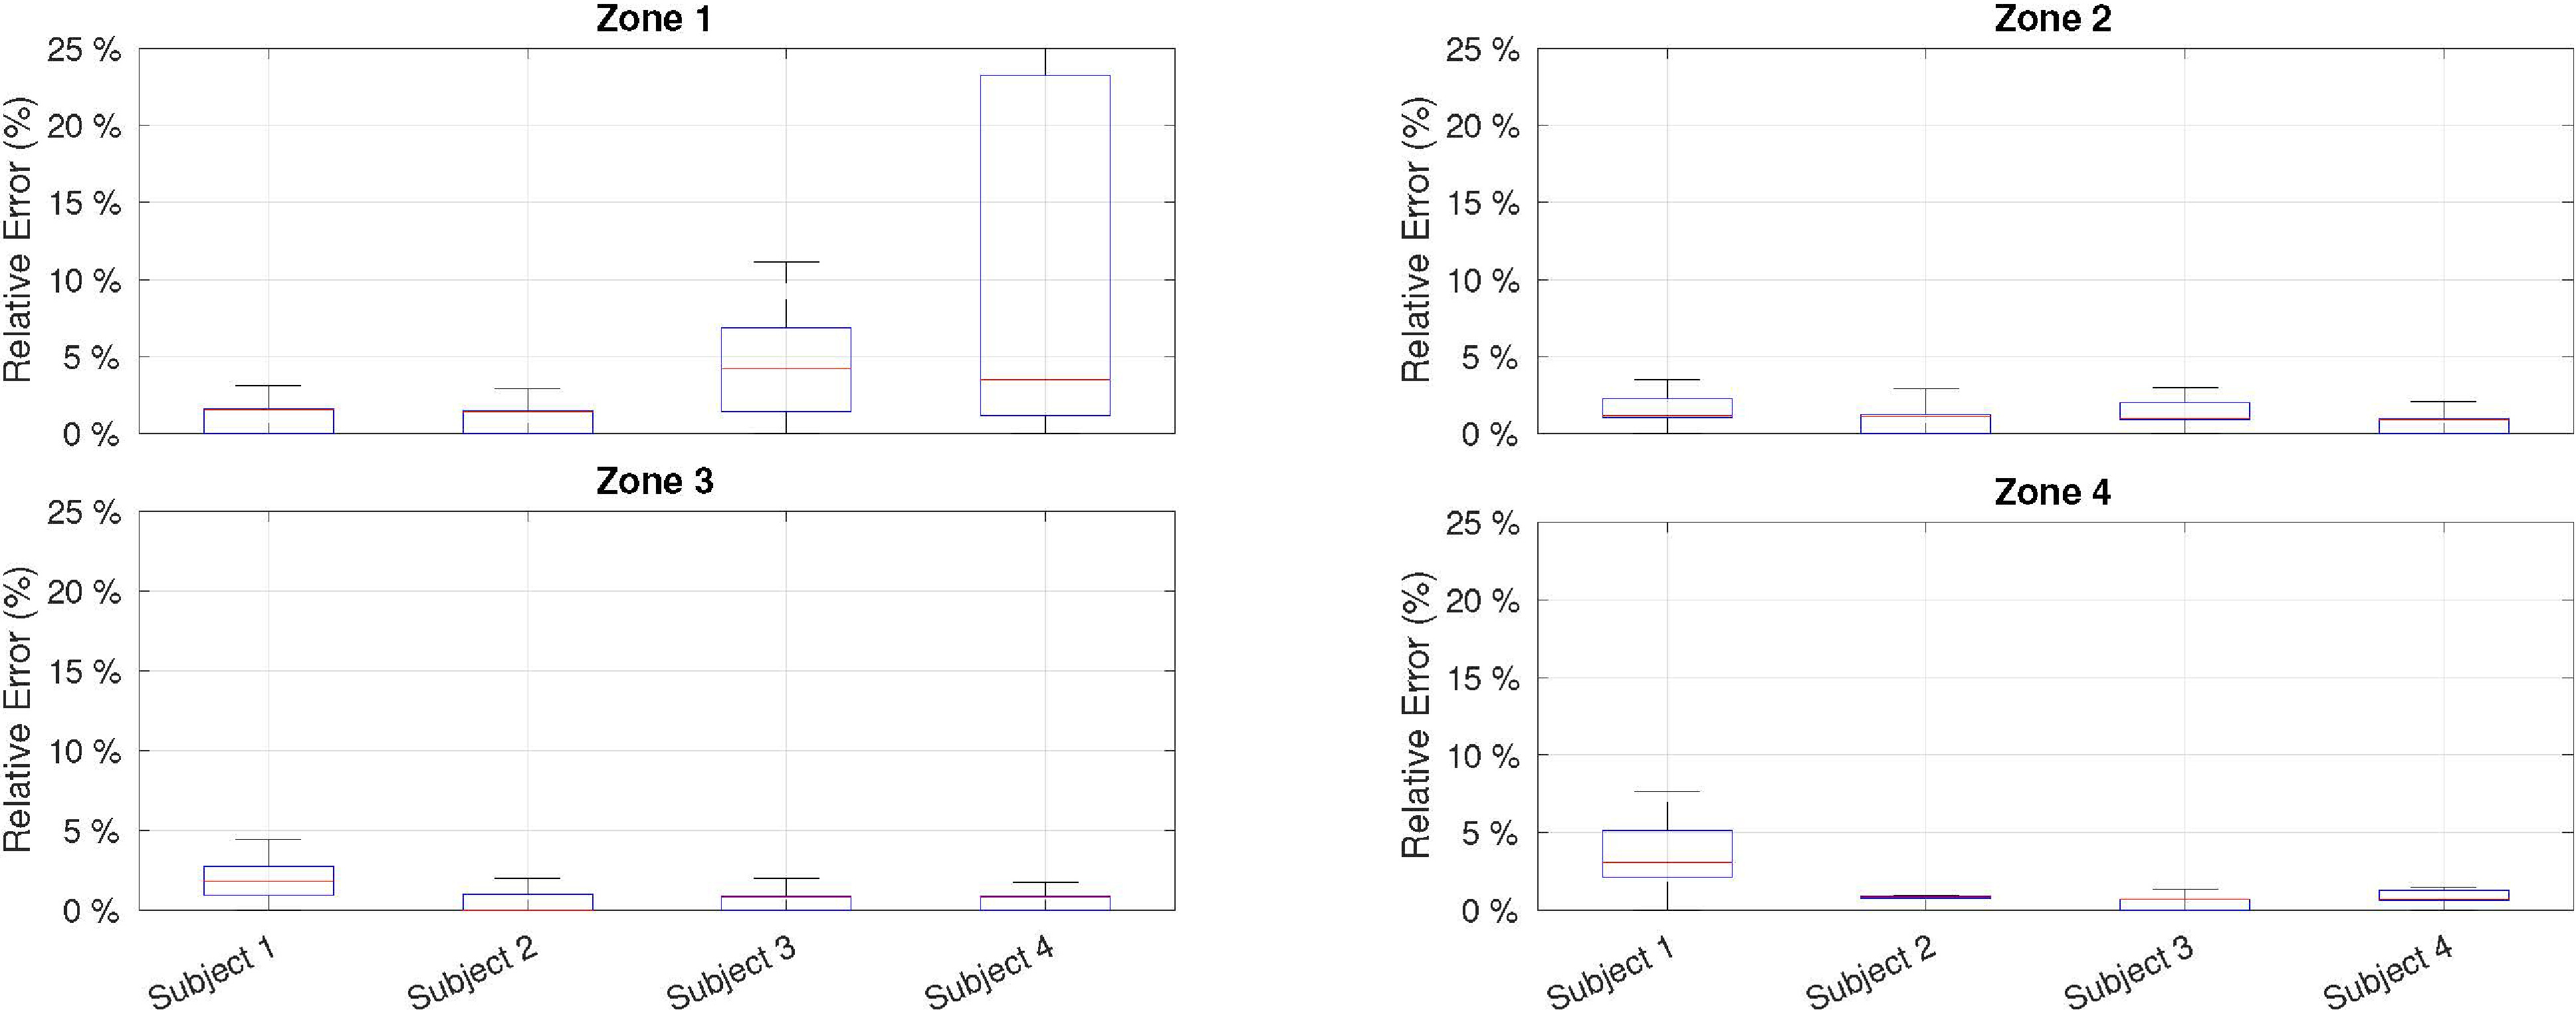
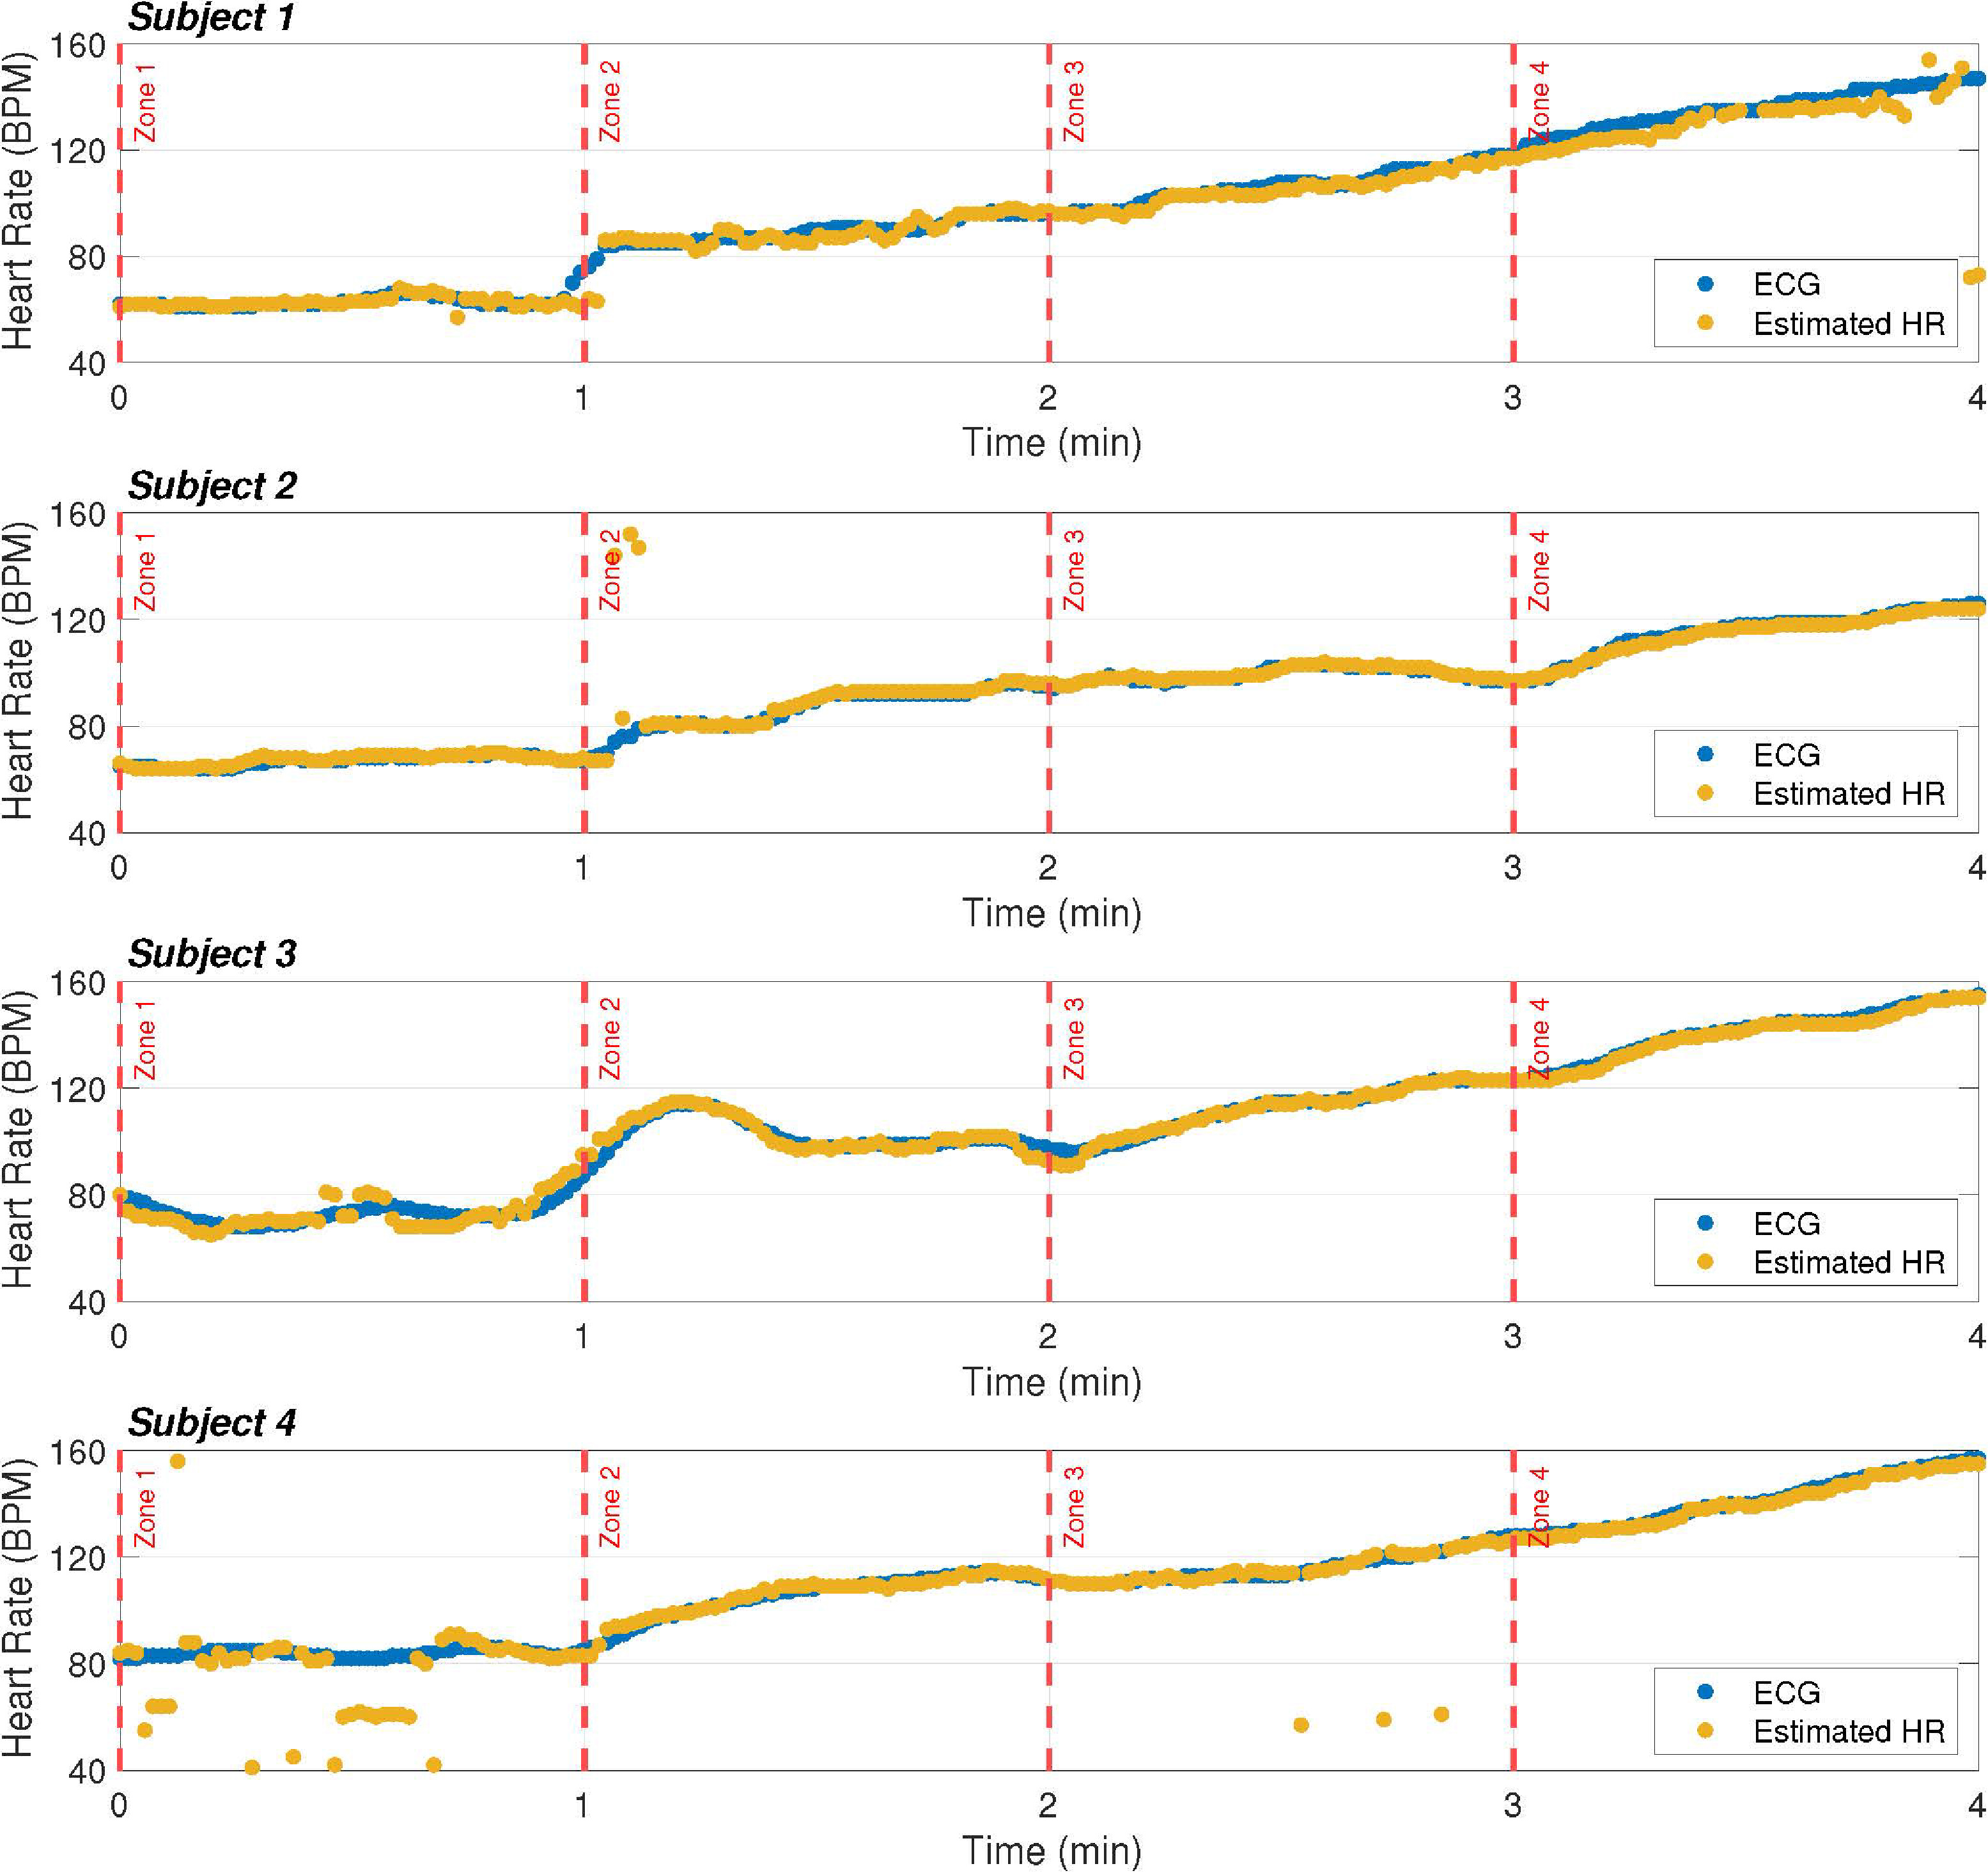
Figure 11.
HR estimation of our prototype compared to the ECG-based estimator. The HR is estimated every second and represented by a dot.
5.1Experimental setup
To evaluate the prototype, a real-world scenario was designed in which a subject performed a stress test on a bicycle while his or her HR was estimated. Thus, a setup was defined to adjust the physical strain and consequently modulate the cardiac response. This setup consists of a smart home trainer (Elite Direto) and a conventional bicycle. The main advantage of this trainer is that it is fully software controlled, which means that the resistance to a pedal stroke can be tuned and adjusted to achieve the desired power development and keep it steady over a period of time. The experiment was carried out with four healthy male subjects (authors of this work), aged between 25 and 48 years. It consisted of cycling for four minutes under different levels of pedal resistance (i.e., power zones). Four different power zones were defined and set using trainer software by means of a feature known as the ERG mode [63]. The first power zone (idle or 0 W) was introduced to measure the heart rate of subjects in the absence of physical activity. The other three zones were established at 50 W, 100 W, and 200 W. The duration of each zone was set as one minute.
As a reference, the HR was measured by a standard bluetooth low energy (BLE) HR monitor based on ECG and attached to the chest. These data were recorded, along with the estimation provided by the proposed prototype. Table 3 shows the average HR measured for each power zone and subject in terms of BPM.
The overall setup is illustrated in Fig. 9 and explained as follows: a cycling simulator (Bkool) [64] was installed on a tablet and wirelessly connected to the smart trainer and the BLE HR monitor. The simulator was in charge of displaying the reference HR and controlling the resistance of the smart trainer in response to the provided target power. On the other hand, the microphone of the proposed prototype was attached to the subject’s chest and the ESP32 microcontroller (connected to the network by Wi-Fi) sent the audio stream to the chosen multicast address. Then, an Android phone and/or a computer were also connected to the same network to receive the data and estimate the HR using Algorithm 4.
5.2Results
Figures 10 and 11 summarize the results obtained from the experiment described in Section 5.1. As shown in Fig. 10, the relative error compared with the ECG-based estimator depends on two main factors. First, worse performance was obtained for the first power zone (or idle) because the heart beats with less energy and are masked by external noise. However, for zones of physical activity (i.e., power zones 2, 3, and 4), the deviation from the ECG was well below 5%. Second, it was found that the physical shape of the subjects affected the HR estimation. This can be observed in the estimations of subjects 3 and 4 for zone 1, where the error is higher. Both subjects had a higher body mass, which made it difficult to determine the optimal point for microphone location. Even so, the median error for both subjects is close to 5%, which is acceptable for low-cost devices. Regarding gender bias, previous studies on auscultation signals showed no statistically significant differences between the male and female test groups [65]; therefore, similar results are expected to be obtained with a broader and more diverse sample.
Figure 11 shows the HR estimation of the proposed prototype compared with that of the ECG-based estimator. In general, the results obtained using the proposed method are in line with the ECG-based estimation, and discrepancies are only observed for a few instants of time. It should be noted that this is a strong point of the proposal, as it achieves similar results to commercial proposals, but at a much lower cost.
Finally, to measure the power consumption of the prototype, a 18650 battery (3.7 V) was used (see Fig. 3). The system was then operated uninterrupted at 2200 mAh for 16 h and 36 min until the battery charge was completely depleted.
6.Conclusion
In this paper, In this paper, a noninvasive system that can be used to monitor patient health is presented. The proposed prototype consists of a cost-effective microphone and a multipurpose microcontroller, both responsible for capturing and preprocessing audio signals, and some computing nodes (mobile phone or general-purpose computer), which receive the preprocessed audio signal and deal with the post-processing stages. In this manner, the recorded heart sounds are registered and wirelessly multicast to the computing nodes in real time. In particular, as a case study, an algorithm for estimating the HR is proposed, which is composed of three stages: preprocessing, separation, and HR estimation. In this regard, the separation stage consists of combining an NMF method and a clustering strategy, together with a generalized Wiener filter. The HR estimation was then obtained using a novel method based on the autocorrelation function.
The proposed method was evaluated over well-known datasets obtaining relative error rates below 5% compared to ground-truth annotation. Moreover, experimentation showed that reaching real-time behaviour is possible by combining multi-core architectures with parallel and high-performance techniques. Finally, the proposed prototype was validated in a real-world scenario, in which subjects performed a stress test on a bicycle. To the best of our knowledge, this is the first low-cost prototype that uses auscultation signals and can be implemented in real time to obtain reliable results in real-world scenarios.
For future work, the current framework will be extended by incorporating multichannel processing to make the method more robust to noisy environments.
Notes
2 Mi™ Smart Band 6.
3 Fitbit Charge 5™.
4 Omron heartguide™ blood pressure monitor bp8000-M.
Acknowledgments
This work has been financially supported by MCIN/AEI/10.13039/501100011033 under the projects grant PID2020-119082RB-{C21,C22}, by Gobierno del Principado de Asturias under grant AYUD/2021/50994 and by the Ministry of Economic Affairs and Digital Transformation of the Spanish Government through the QUANTUM ENIA project call – QUANTUM SPAIN project, and by the European Union through the Recovery, Transformation and Resilience Plan – NextGenerationEU within the framework of the Digital Spain 2025 Agenda.
The authors are grateful to José Ramón Gutiérrez-Martínez, a specialist physician at the Central University Hospital of Asturias (HUCA), Spain, for his support in annotating all signals with ground-truth labels.
References
[1] | Sankari Z, Adeli H. HeartSaver: A mobile cardiac monitoring system for auto-detection of atrial fibrillation, myocardial infarction, and atrio-ventricular block. Computers in Biology and Medicine. (2011) ; 41: (4): 211-20. |
[2] | Mozaffarilegha M, Adeli H. Visibility graph analysis of speech evoked auditory brainstem response in persistent developmental stuttering. Neuroscience Letters. (2019) ; 696: : 28-32. |
[3] | Mondéjar-Guerra V, Novo J, Rouco J, Penedo MG, Ortega M. Heartbeat classification fusing temporal and morphological information of ECGs via ensemble of classifiers. Biomedical Signal Processing and Control. (2019) ; 47: : 41-8. |
[4] | Burns A, Adeli H, Buford JA. Brain – computer interface after nervous system injury. The Neuroscientist. (2014) ; 20: (6): 639- 51. |
[5] | Burns A, Adeli H, Buford JA. Upper limb movement classification via electromyographic signals and an enhanced probabilistic network. Journal of Medical Systems. (2020) ; 44: (10): 1-12. |
[6] | Shi L, Du W, Li Z. A two stage recognition method of lung sounds based on multiple features. Journal of Intelligent and Fuzzy Systems. (2019) ; 37: (3): 3581-92. |
[7] | Hsu WY. Automatic atrium contour tracking in ultrasound imaging. Integrated Computer-Aided Engineering. (2016) ; 23: (4): 401-11. |
[8] | Deng SW, Han JQ. Towards heart sound classification without segmentation via autocorrelation feature and diffusion maps. Future Generation Computer Systems. (2016) ; 60: : 13-21. https//www.sciencedirect.com/science/article/pii/S0167739X16000121. |
[9] | Dia N, Fontecave-Jallon J, Guméry PY, Rivet B. Heart rate estimation from phonocardiogram signals using non-negative matrix factorization. In: ICASSP 2019-2019 IEEE International Conference on Acoustics, Speech and Signal Processing (ICASSP). IEEE; (2019) . pp. 1293-7. |
[10] | Mukhin A, Kilbas I, Paringer R, Ilyasova NY, Kupriyanov A. A method for balancing a multi-labeled biomedical dataset. Integrated Computer-Aided Engineering. (2022) ; (Preprint): 1-17. |
[11] | Cuestas E, Rizzotti A, Aguero G. Heart rate predicts sepsis. Journal of Pediatrics. (2012) ; 161: (4): 770-0. |
[12] | Hanss R, Bein B, Weseloh H, Bauer M, Cavus E, Steinfath M, et al. Heart rate variability predicts severe hypotension after spinal anesthesia. Anesthesiology. (2006) ; 104: (3): 537-45. |
[13] | Iwasa A, Hwa M, Hassankhani A, Liu T, Narayan S. Abnormal heart rate turbulence predicts the initiation of ventricular arrhythmias. Pace-Pacing and Clinical Electrophysiology. (2005) ; 28: (11): 1189-97. |
[14] | Bekedam D, Visser G, Mulder E, Poelmann-Weesjes G. Heart rate variation and movement incidence in growth-retarded fetuses: the significance of antenatal late heart rate decelerations. American Journal of Obstetrics and Gynecology. (1987) ; 157: (1): 126-33. |
[15] | Hynynen K, Noksokoivisto V, Mattila M, Patomaki L. Heart-rate variation as indicator of depth of anesthesia. vol. 25; (1980) . |
[16] | Persson H, Kumlien E, Ericson M, Tomson T. Circadian variation in heart-rate variability in localization-related epilepsy. Epilepsia. (2007) ; 48: (5): 917-22. |
[17] | Lanting P, Faes TJ, Heimans J, Ten Voorde B, Nauta J, Rompelman O. Spectral analysis of spontaneous heart rate variation in diabetic patients. Diabetic Medicine. (1990) ; 7: (8): 705-10. |
[18] | Lamberts R, Lemmink K, Durandt J, Lambert M. Variation in heart rate during submaximal exercise: Implications for monitoring training. Journal of Strength and Conditioning Research. (2004) ; 18: (3): 641-5. |
[19] | Siche J. Factors of variation of heart rate. Annales De Cardiologie Et D Angeiologie. (1998) ; 47: (6): 415-9. |
[20] | Ray A. Auscultation of the respiratory system – Some additional points. Annals of Thoracic Medicine. (2015) ; 10: ; 10. |
[21] | Gavriely N, Palti Y, Alroy G. Spectral characteristics of normal breath sounds. Journal of Applied Physiology. (1981) ; 50: (2): 307-14. |
[22] | Charbonneau G, Racineux J, Sudraud M, Tuchais E. An accurate recording system and its use in breath sounds spectral analysis. Journal of Applied Physiology. (1983) ; 55: (4): 1120-7. |
[23] | Hossain I, Moussavi Z. An overview of heart-noise reduction of lung sound using wavelet transform based filter. In: Proceedings of the 25th Annual International Conference of the IEEE Engineering in Medicine and Biology Society (IEEE Cat. No. 03CH37439). vol. 1. IEEE; (2003) . pp. 458-61. |
[24] | Tracey BH, Miller EL. Nonlocal means denoising of ECG signals. IEEE Transactions on Biomedical Engineering. (2012) ; 59: (9): 2383-6. |
[25] | Rudnitskii A. Using nonlocal means to separate cardiac and respiration sounds. Acoustical Physics. (2014) ; 60: (6): 719-26. |
[26] | Sathesh K, Muniraj N. Real time heart and lung sound separation using adaptive line enhancer with NLMS. Journal of Theoretical & Applied Information Technology. (2014) ; 65: (2). |
[27] | Shah G, Koch P, Papadias CB. On the blind recovery of cardiac and respiratory sounds. IEEE Journal of Biomedical and Health Informatics. (2014) ; 19: (1): 151-7. |
[28] | Canadas-Quesada F, Ruiz-Reyes N, Carabias-Orti J, Vera-Candeas P, Fuertes-Garcia J. A non-negative matrix factorization approach based on spectro-temporal clustering to extract heart sounds. Applied Acoustics. (2017) ; 125: : 7-19. |
[29] | Tsai KH, Wang WC, Cheng CH, Tsai CY, Wang JK, Lin TH, et al. Blind monaural source separation on heart and lung sounds based on periodic-coded deep autoencoder. IEEE Journal of Biomedical and Health Informatics. (2020) ; 24: (11): 3203-14. |
[30] | Saeedi A, Moridani MK, Azizi A. An innovative method for cardiovascular disease detection based on nonlinear geometric features and feature reduction combination. Intelligent Decision Technologies. (2021) ; 15: (1): 45-57. |
[31] | Grooby E, He J, Fattahi D, Zhou L, King A, Ramanathan A, et al. A New Non-Negative Matrix Co-Factorisation Approach for Noisy Neonatal Chest Sound Separation. In: 2021 43rd Annual International Conference of the IEEE Engineering in Medicine & Biology Society (EMBC). IEEE; (2021) . pp. 5668-73. |
[32] | Muñoz-Montoro A, Suarez-Dou D, Cortina R, Canadas-Quesada F, Combarro E. Parallel source separation system for heart and lung sounds. The Journal of Supercomputing. (2021) ; 1-16. |
[33] | Bat-Call. Voqx; (2022) . [Accessed 8-April-2022]. https//sanolla.com/. |
[34] | Bat-Call. PyXy; (2022) . [Accessed 8-April-2022]. https//pyxy.ai/technology. |
[35] | Alive. AliveCord; (2022) . [Accessed 8-April-2022]. https//www.alivecor.es/. |
[36] | Littmann. CORE stethoscope; (2022) . [Accessed 8-April-2022]. https//www.littmann.com/3M/en_US/littmann-stethoscopes/advantages/core-digital-stethoscope. |
[37] | Févotte C, Bertin N, Durrieu JL. Nonnegative Matrix Factorization with the Itakura-Saito Divergence: With Application to Music Analysis. Neural Computation. (2009) Mar; 21: (3): 793-830. |
[38] | Virtanen T. Monaural Sound Source Separation by Nonnegative Matrix Factorization With Temporal Continuity and Sparseness Criteria. IEEE Transactions on Audio, Speech and Language Processing. (2007) Mar; 15: (3): 1066-74. |
[39] | Charleston-Villalobos S, Dominguez-Robert LF, Gonzalez-Camarena R, Aljama-Corrales AT. Heart Sounds Interference Cancellation in Lung Sounds. In: 2006 International Conference of the IEEE Engineering in Medicine and Biology Society. IEEE; (2006) . pp. 1694-7. |
[40] | Grooby E, Sitaula C, Fattahi D, Sameni R, Tan K, Zhou L, et al. Noisy Neonatal Chest Sound Separation for High-Quality Heart and Lung Sounds. arXiv preprint arXiv: 220103211. (2022) . |
[41] | Grais EM, Erdogan H. Single channel speech music separation using nonnegative matrix factorization and spectral masks. In: 2011 17th International Conference on Digital Signal Processing (DSP). IEEE; (2011) . pp. 1-6. |
[42] | del Riego R, Otero J, Ranilla J. A low-cost 3D human interface device using GPU-based optical flow algorithms. Integrated Computer-Aided Engineering. (2011) ; 18: (4): 391-400. |
[43] | Foresti GL, Scagnetto I. An integrated low-cost system for object detection in underwater environments. Integrated Computer-Aided Engineering. (2022) ; (Preprint): 1-17. |
[44] | Espressif. ESP32; (2022) . [Accessed 8-April-2022]. https//www.espressif.com/en/products/socs/esp32/overview. |
[45] | CM-01B. CM-01B; (2022) . [Online; accessed 8-April-2022]. https//es.farnell.com/sensor-solutions-te-connectivity/cm-01b/micr-fono-contacto-100ua-5khz/dp/2771919. |
[46] | TDK. INMP441; (2022) . [Accessed 8-April-2022]. https//invensense.tdk.com/products/digital/inmp441/. |
[47] | Boutsidis C, Gallopoulos E. SVD based initialization: A head start for nonnegative matrix factorization. Pattern Recognition. (2008) ; 41: (4): 1350-62. |
[48] | Atif SM, Qazi S, Gillis N. Improved SVD-based initialization for nonnegative matrix factorization using low-rank correction. Pattern Recognition Letters. (2019) ; 122: : 53-9. |
[49] | Qiao H. New SVD based initialization strategy for non-negative matrix factorization. Pattern Recognition Letters. (2015) ; 63: : 71-7. |
[50] | Stewart GW. Perturbation theory for the singular value decomposition; (1998) . |
[51] | Frigo M, Johnson SG. The design and implementation of FFTW3. Proceedings of the IEEE. (2005) ; 93: (2): 216-31. |
[52] | Dagum L, Menon R. OpenMP: an industry standard API for shared-memory programming. IEEE Computational Science and Engineering. (1998) ; 5: (1): 46-55. |
[53] | Dongarra J, Gates M, Haidar A, Kurzak J, Luszczek P, Tomov S, et al. The singular value decomposition: Anatomy of optimizing an algorithm for extreme scale. SIAM Review. (2018) ; 60: (4): 808-65. |
[54] | Salazar AJ, Alvarado C, Lozano FE. System of heart and lung sounds separation for store-and-forward telemedicine applications. Revista Facultad de Ingenieria. (2012) ; (64): 175-81. |
[55] | Lin C, Hasting E. Blind source separation of heart and lung sounds based on nonnegative matrix factorization. In: 2013 International Symposium on Intelligent Signal Processing and Communication Systems; (2013) . pp. 731-6. |
[56] | Blackford LS, Demmel J, Dongarra J, Duff I, Hammarling S, Henry G, et al. An Updated Set of Basic Linear Algebra Subprograms (BLAS). ACM Transactions on Mathematical Software. (2001) ; 28: : 135-51. |
[57] | Yaseen, Son GY, Kwon S. Classification of Heart Sound Signal Using Multiple Features. Applied Sciences. (2018) ; 8: (12). |
[58] | Bentley P, Nordehn G, Coimbra M, Mannor S, Getz R. Classifying Heart Sounds Challenge; (2011) . [Accessed 16-January-2021]. |
[59] | Vincent E, Gribonval R, Fevotte C. Performance measurement in blind audio source separation. IEEE Transactions on Audio, Speech and Language Processing. (2006) Jul; 14: (4): 1462-9. http//ieeexplore.ieee.org/document/1643671/. |
[60] | Ghaderi F, Mohseni HR, Sanei S. Localizing heart sounds in respiratory signals using singular spectrum analysis. IEEE Transactions on Biomedical Engineering. (2011) ; 58: (12): 3360-7. |
[61] | Wang Z, da Cruz JN, Wan F. Adaptive Fourier decomposition approach for lung-heart sound separation. In: 2015 IEEE International Conference on Computational Intelligence and Virtual Environments for Measurement Systems and Applications (CIVEMSA). IEEE; (2015) . pp. 1-5. |
[62] | Mondal A, Bhattacharya PS, Saha G. Reduction of heart sound interference from lung sound signals using empirical mode decomposition technique. Journal of Medical Engineering & Technology. (2011) ; 35: (6-7): 344-53. doi: 10.3109/03091902.. |
[63] | Bkool. ERG mode; (2022) . [Accessed 8-April-2022]. https//support.bkool.com/hc/en-us/articles/360024888231-What-is-ERG-mode-. |
[64] | Bkool. Bkool; (2022) . [Accessed 8-April-2022]. https//www.bkool.com/en. |
[65] | Nedoma J, Fajkus M, Martinek R, Kepak S, Cubik J, Zabka S, et al. Comparison of BCG, PCG and ECG signals in application of heart rate monitoring of the human body. In: 2017 40th International Conference on Telecommunications and Signal Processing (TSP). IEEE; (2017) . pp. 420-4. |


