
LDCT image biomarkers that matter most for the deep learning classification of indeterminate pulmonary nodules
Abstract
BACKGROUND:
Continued improvement in deep learning methodologies has increased the rate at which deep neural networks are being evaluated for medical applications, including diagnosis of lung cancer. However, there has been limited exploration of the underlying radiological characteristics that the network relies on to identify lung cancer in computed tomography (CT) images.
OBJECTIVE:
In this study, we used a combination of image masking and saliency activation maps to systematically explore the contributions of both parenchymal and tumor regions in a CT image to the classification of indeterminate lung nodules.
METHODS:
We selected individuals from the National Lung Screening Trial (NLST) with solid pulmonary nodules 4–20 mm in diameter. Segmentation masks were used to generate three distinct datasets; 1) an Original Dataset containing the complete low-dose CT scans from the NLST, 2) a Parenchyma-Only Dataset in which the tumor regions were covered by a mask, and 3) a Tumor-Only Dataset in which only the tumor regions were included.
RESULTS:
The Original Dataset significantly outperformed the Parenchyma-Only Dataset and the Tumor-Only Dataset with an AUC of 80.80
CONCLUSION:
We conclude that network performance is linked to textural features of nodules such as kurtosis, entropy and intensity, as well as morphological features such as sphericity and diameter. Furthermore, textural features are more positively associated with malignancy than morphological features.
1.Introduction
The ability of deep neural networks (DNNs) to extract high-level features from images has allowed them to garner widespread attention and adoption in various real-world tasks [1, 2, 3]. In the case of lung cancer, DNNs have achieved comparable and sometimes even better performance than trained radiologists [4]. DNNs evaluate voxel intensity relationships and construct features that are subsequently used to address a classification problem. However, since these features are not predefined, and their attribution to the endpoint is rapidly convoluted within the network layers, it is difficult to know what image characteristics contribute most heavily to the classification [5, 6, 7, 8]. This intrinsic black-box nature of DNNs mitigates against trust in their diagnoses, especially when they do not agree with physician opinion.
Various methodologies have been created to address network interpretability, including saliency activation maps and feature perturbation. The saliency activation map is a visualization technique that highlights the regions or features in an image that a DNN pays most attention to when making its classification decisions [9, 10, 11]. However, this leaves the interpretation of which features are being identified as important to the human observer, making it open to confirmation bias. Alternatively, perturbation of the individual features identified by a CNN can show the relative contributions that each feature makes to network performance [12, 13, 14], but it is often difficult to interpret these features in terms of meaningful human notions. It thus remains challenging to determine if a DNN is capturing known biologic relationships such as, for example, the link between parenchymal lung disease and lung cancer [15, 16, 17, 18, 19]. The roles of such known relationships have been studied in support vector machines, random forests, and multi-layer perceptrons [20], but in these cases the features were manually extracted. Their roles in CNNs, which extract features automatically, remain uncertain.
Accordingly, in this present study we perturbed images by masking segmented regions, and combined this with saliency activation maps to systematically explore the contribution of parenchymal and tumor regions in CT images to the classification of indeterminate lung nodules. In particular, we investigated the nodule characteristics associated with false-negatives and false-positives in order to gain insight into the failure modes of CNNs.
2.Methods
2.1Dataset
We selected a subset of images containing indeterminate lung nodules from the National Lung Screening Trial (NLST) dataset (2). The University of Vermont Institutional Review Board determined the use of NLST data to be human subject exempt following the National Cancer Institute Data Agreement (NLST-163). Individuals screened in the NLST had a smoking history of greater than 30 pack-years and had quit smoking less than 15 years prior. Using the low dose computed tomography (LDCT) branch of the NLST, we selected individuals with nodules less than 20 mm in diameter. This reduced the influence of diameter on the likelihood of malignancy, since solitary nodules with diameters between 20 and 30 mm are known to be associated with an approximately
Table 1
Demographic and scanning parameters of study cohorts
| Malignant | Benign | ||
|---|---|---|---|
| Subjects | 336 | 3197 | |
| Sex (Female:Male) | 152:184 | 1263:1934 | |
| Age, yrs (mean | 63.065 ( | 61.562 ( | 0.001 |
| Pack-years, yrs (mean | 65.021 ( | 56.466 ( | 0.001 |
| Kilovoltage, kVP (range, mean) | 121.084 ( | 121.252 ( | 0.646 |
| Tube current, mA (range, mean) | 63.196 ( | 63.839 ( | 0.813 |
| Slice thickness, mm (range, mean) | 25.083 ( | 16.278 ( | 0.0368 |
Figure 1.
Flow diagram showing the inclusion and exclusion criteria for final dataset using the National Lung Screening Trial dataset (NLST).
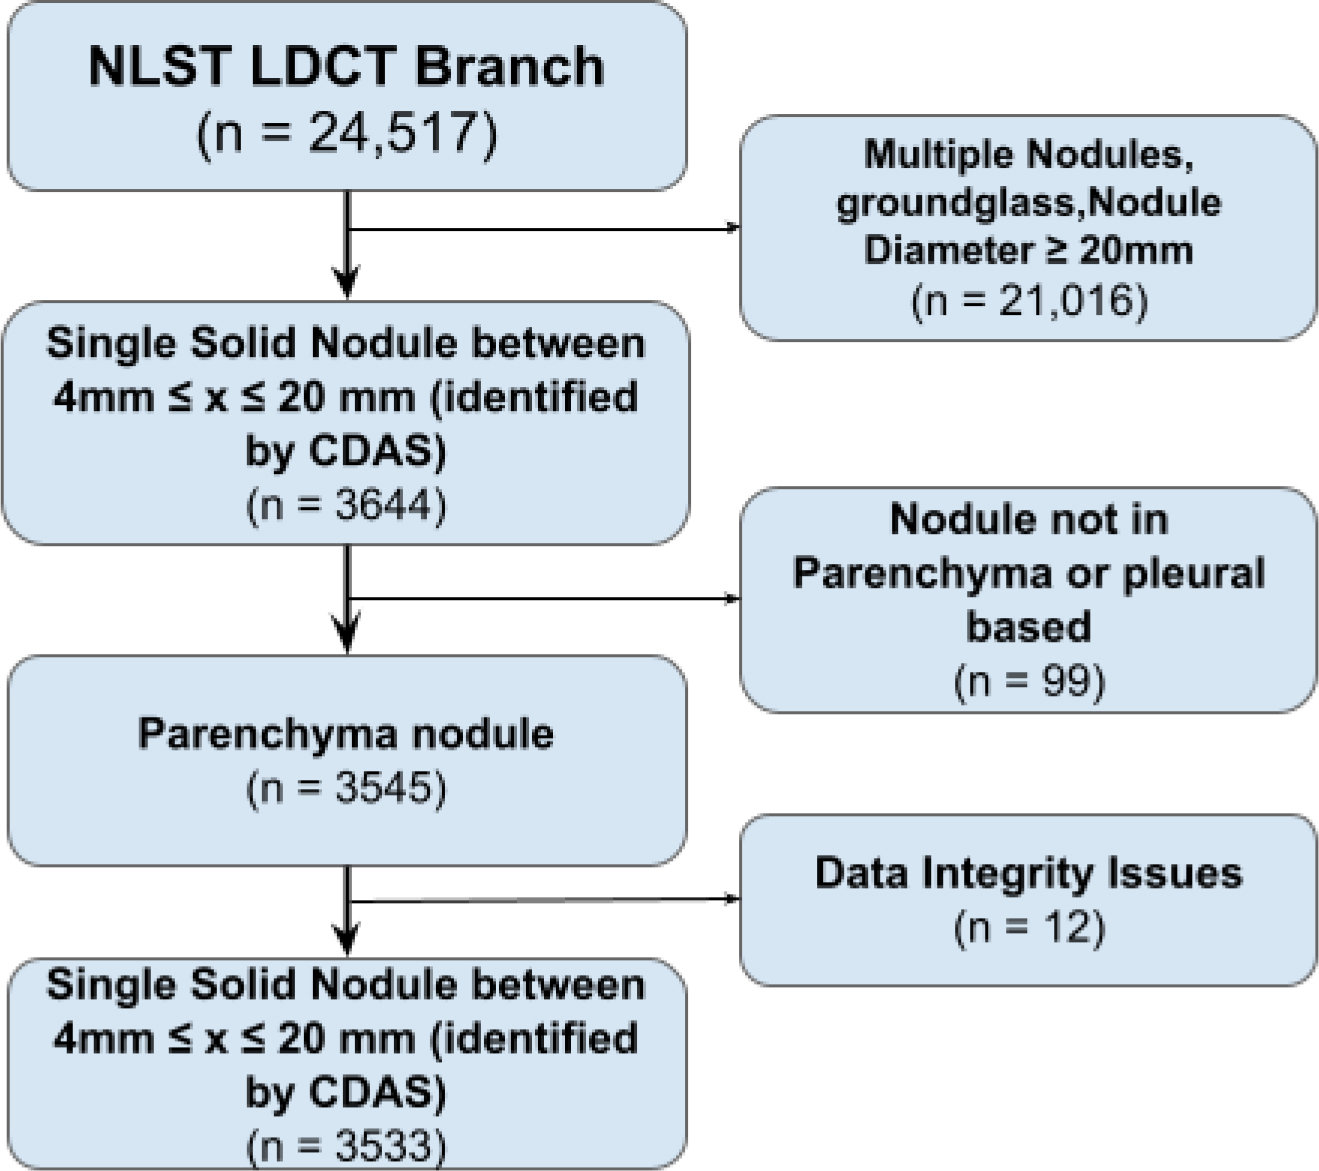
Of the 3,533 patients in the final dataset, 354 were found to have positive diagnoses for lung cancer (Table 1). To balance the dataset for training, 354 patients were randomly selected from those with benign nodules, giving a total of 708 nodule. A 64
2.2Nodule segmentation and radiomics extraction
Nodules were segmented semi-automatically from regions of interest (ROI) using the Chest Imaging Platform (CIP) [22, 23]. Nodule boundaries were automatically detected by the CIP followed by manual adjustments based on secondary visual inspection by a trained radiologist. First-order radiomics, such as energy, entropy, and skewness, along with morphologic radiomics, such as nodule sphericity and maximal diameter, were extracted from the tumor regions in each image. Low attenuation areas below
2.3Training and testing
Normalization was applied to all images prior to being processed by our miniaturized Inception module [24, 25]. This architecture was selected to allow for multiscale features to be extracted and concatenated together to minimize information loss. To train the model, a cross-entropy loss function was utilized alongside an ADAM optimizer. Stratified K-fold cross validation was utilized to generate 10 unique training/validation/testing dataset combinations. Training and testing were repeated 10 times on the 10 unique combinations of images. Specificity and sensitivity were extracted from each training-testing instance along with a receiver operating characteristic curve (ROC). The general performance of each approach was evaluated using the area under the curve (AUC) of the ROC.
Lastly, we selected the network with the lowest least-absolute-square error by calculating the average AUC. This network was utilized to evaluated how much attention the CNN placed on each pixel in each image from its gradient-weighted class activation map (Grad-CAM) [9, 10]. All Grad-CAMs were separated into classification groups (true-positives, false-positives, true-negatives, and false-negatives) in order to determine those traits that most impacted network performance for each group.
2.4Statistical analysis
A two-sample
Figure 2.
Axial slice from a Low Dose Computed Tomography (LDCT) image showing the (a) the original LDCT scan, (b) the segmented tumor map, (c) the parenchyma-only image, (d) the tumor-only image.
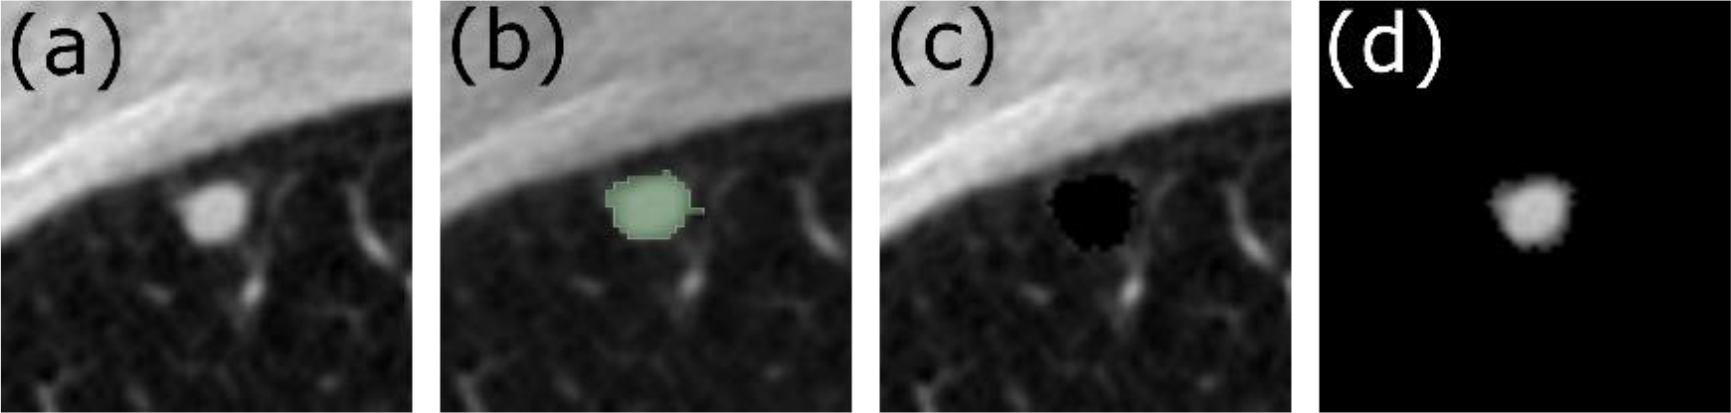
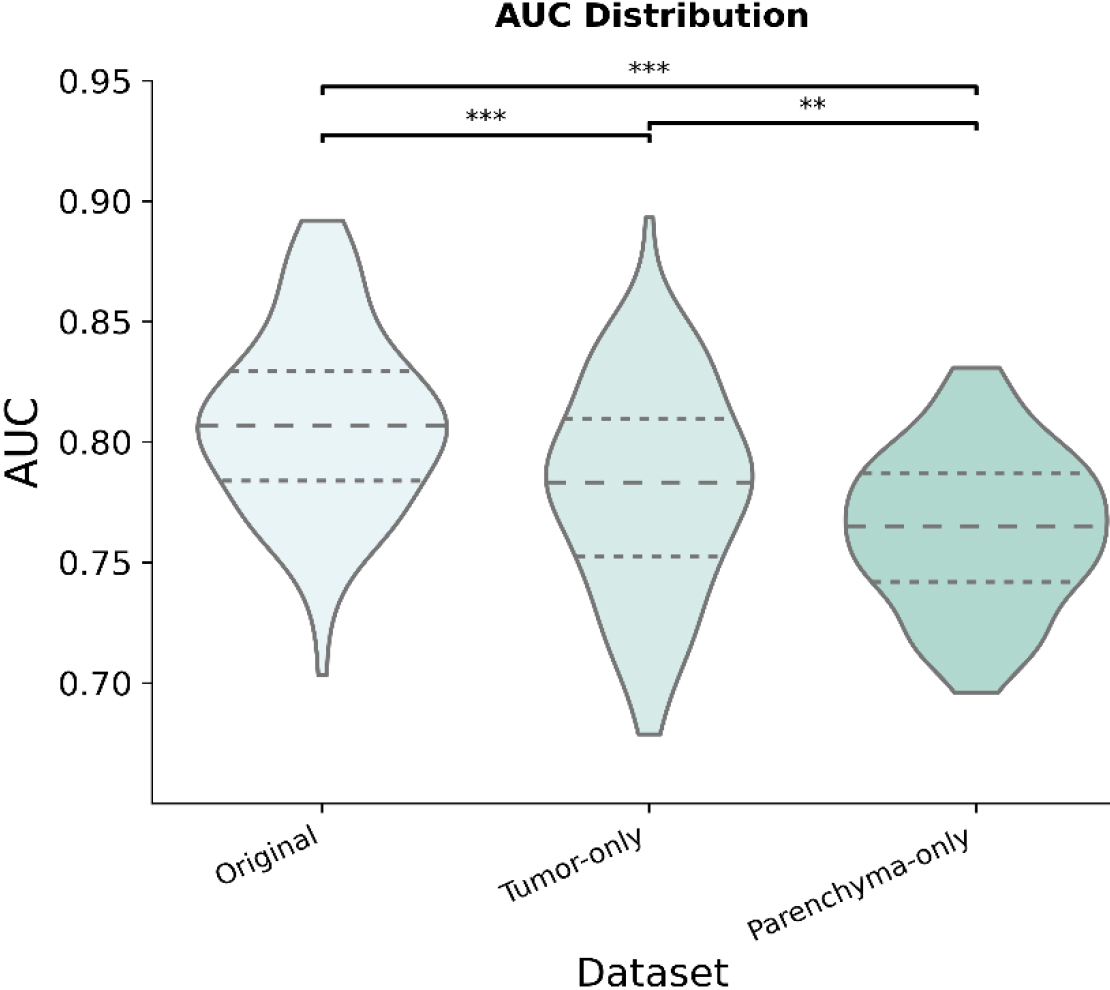
Figure 3.
Distribution of the area under the curve (AUC) across datasets for 100 iterations.
3.Results
Figure 3 compares the testing diagnostic performances of the Original Dataset, the Parenchyma-Only Dataset, and the Nodule-Only Dataset. The mean AUC for each dataset was 80.80
Table 2
Number of individuals in each classification group for a given approach using the same testing dataset (
| Approach | True positive | False negative | True negative | False positive |
|---|---|---|---|---|
| Original | 62 | 11 | 18 | 46 |
| Parenchyma-Only | 57 | 16 | 24 | 40 |
| Tumor-Only | 59 | 14 | 16 | 48 |
The classification results from the best performing network comprised four distinct groups using the maximum probability of the networks output – true positives, false positives, false negatives, and true negatives. Table 2 shows the number of individuals in each group for the Original Dataset, the Parenchyma-Only Dataset, and the Tumor-Only Dataset using the same testing data. Consistent true positives can be observed across all datasets, with the primary difference between the datasets being false classification.
Figure 4.
Grad-CAM images from the original dataset and parenchyma-only dataset showing network attention for malignant and benign nodules based on class label.
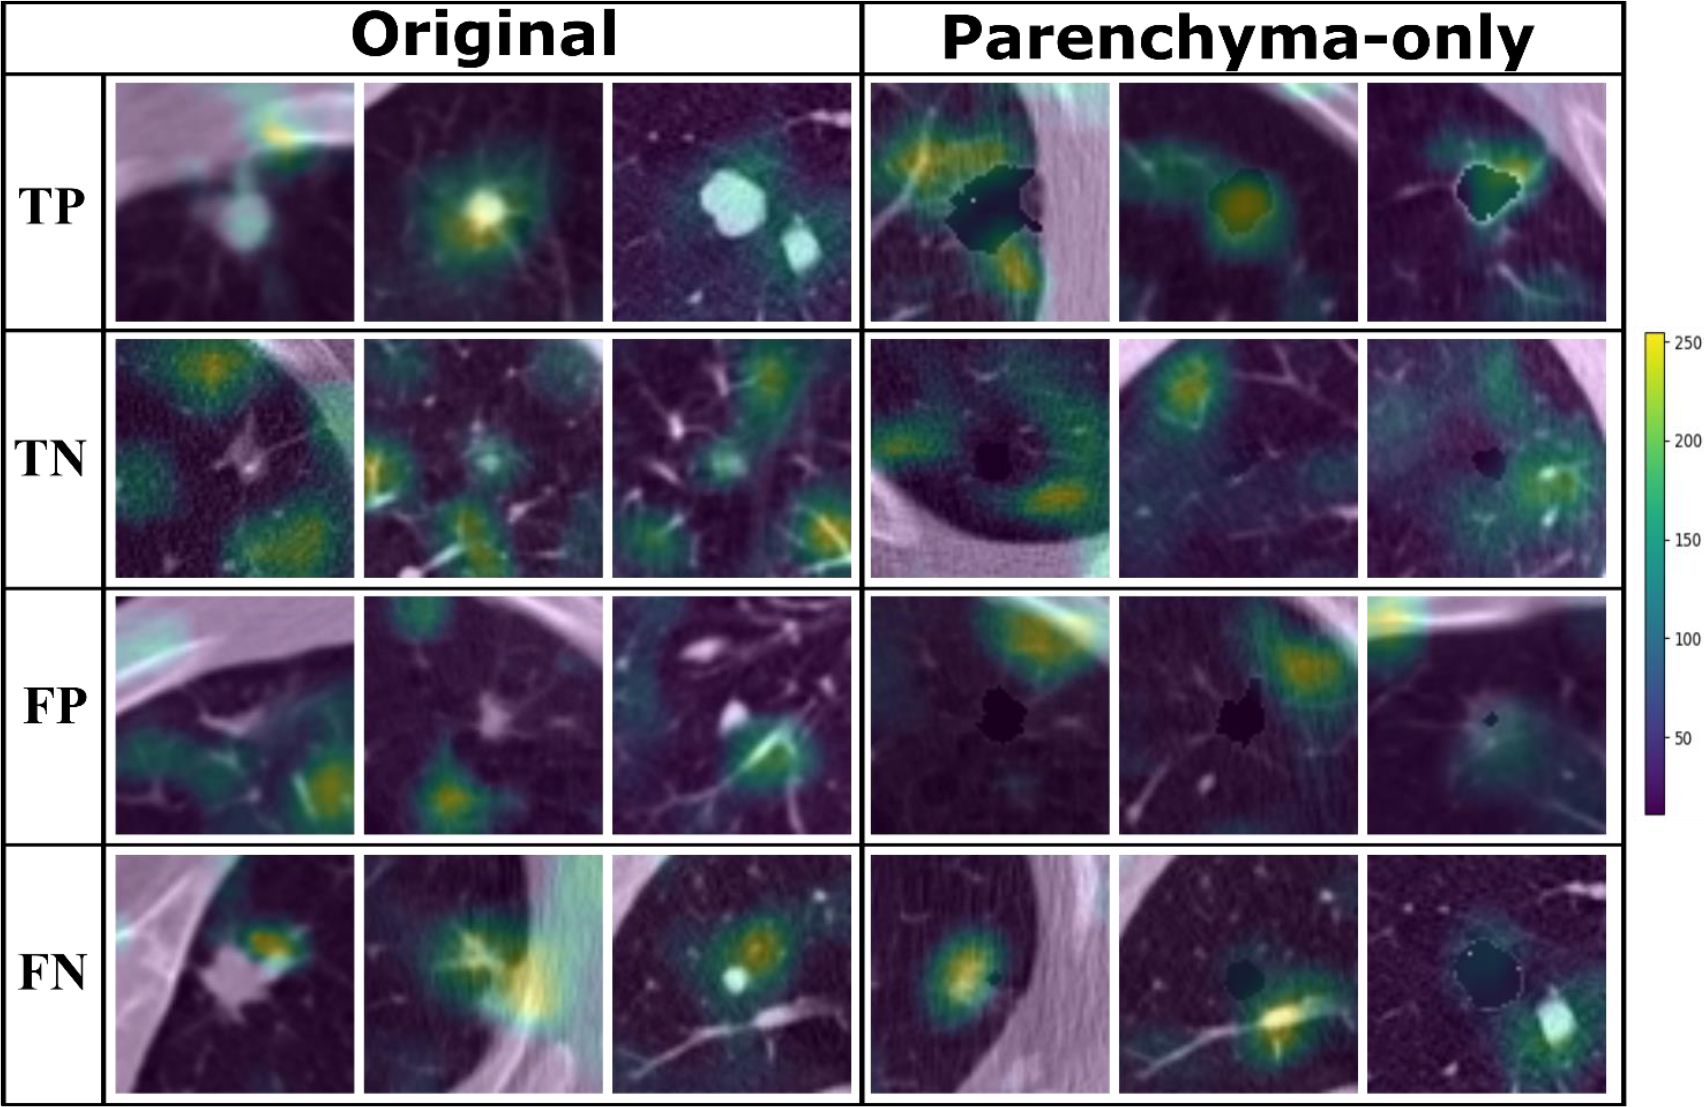
Grad-CAM images from the Original Dataset show that the attention of the CNN was focused on the nodule when malignancy was diagnosed and moved to the parenchyma when nodules were considered benign (Fig. 4). Grad-CAM images from the Parenchyma-Only Dataset shows a similar shift in attention from adjacent regions of the parenchyma to the border of the masked tumor in cases of malignancy versus more distant parenchyma in the case of benign nodules.
Nodule diameter, sphericity, intensity, entropy, skewness, kurtosis, gray levels, y-position, and z-position with relation to the carina were significantly different between true positives and true negative (see Supplement A for
Table 3
Mean and standard error across the demographic and first order radiomics features extracted from the original image for classification groups (true positive, false negatives, false positives, and true negatives)
| True positives | False negatives | False positives | True negatives | |
|---|---|---|---|---|
| Nodule Maximum 3d Diameter | ||||
| Original | 23.98 ( | 12.48 ( | 14.00 ( | 12.00 ( |
| Parenchyma-Only | 24.17 ( | 15.37 ( | 12.49 ( | 12.61 ( |
| Tumor-Only | 24.52 ( | 12.63 ( | 19.38 ( | 10.29 ( |
| Laa950 percentage (Parenchyma -Only) | ||||
| Original | 7.82 ( | 18.278 ( | 6.78 ( | 7.80 ( |
| Parenchyma-Only | 8.54 ( | 12.44 ( | 7.19 ( | 7.71 ( |
| Tumor-Only | 8.03 ( | 15.13 ( | 8.,54 ( | 7.17 ( |
| Nodule sphericity | ||||
| Original | 0.44 ( | 0.50 ( | 0.53 ( | 0.53 ( |
| Parenchyma-Only | 0.43 ( | 0.528 ( | 0.52 ( | 0.53 ( |
| Tumor-Only | 0.43 ( | 0.53 ( | 0.42 ( | 0.56 ( |
| Nodule mean intensity | ||||
| Original | ||||
| Parenchyma-Only | ||||
| Tumor-Only | ||||
| Nodule energy | ||||
| Original | 1.66e8 ( | 1.07e8 ( | 1.54e8 ( | 1.71e8 ( |
| Parenchyma-Only | 1.73e8 ( | 1.01e8 ( | 7.86e7 ( | 2.20e8 ( |
| Tumor-Only | 1.70E8 ( | 1.04e8 ( | 1.62e8 ( | 1.69e8 ( |
| Nodule entropy | ||||
| Original | 6.5e3 ( | 411.91 ( | 4.95e3 ( | 656.88 ( |
| Parenchyma-Only | 6.62e3 ( | 1.92e3 ( | 7.59e2 ( | 2.53e3 ( |
| Tumor-Only | 6.75e3 ( | 6.63e2 ( | 5.91e3 ( | 5.16e2 ( |
| Nodule skewness | ||||
| Original | 0.37 ( | 0.023 ( | 0.64 ( | |
| Parenchyma-Only | 0.131 ( | 0.20 ( | 0.63 ( | |
| Tumor-Only | 0.42 ( | 0.44 ( | 0.48 ( | |
| Nodule kurtosis | ||||
| Original | 1.03 ( | |||
| Parenchyma-Only | 1.19 ( | |||
| Tumor-Only | 0.01 ( | 0.98 ( |
4.Discussion
Deep neural networks and the growing availability of big data have allowed for rapid improvements in the accuracy of computed aided diagnostic tools (CADx) at the cost of interpretability [26, 27]. Various methods for model interpretability have been proposed in order to address their black-box nature. Approaches such as concept vectors [5, 8, 28, 29] and attention based, perturbation based, and expert knowledge methodologies [27, 30] have been explored to improve trust in classification results produced by DNNs. From a clinician perspective, confidence in a classification result is bolstered by model interpretability that provides a clear reason for a decision. Model interpretability can also be useful for improving the performance of DNNs. For example, we showed in the present study that a combination of image perturbation via masking together with attention-based methodologies provides insight into the features associated with early signs of malignancy that may not be considered in the Lung-RADS guidelines.
Comparing the results shown in Table 3 to published data such as that of Zhu P. and Ogino M., we found that nodule diameter remains positively correlated with nodule malignancy [27, 31, 32]. This is best illustrated when comparing the size of true-positive and true-negative nodules. Interestingly, true-positive nodules were found to be significantly larger than false-positive and false-negative nodules in the Original Dataset (Supplement A). However, in the Tumor-Only Dataset, nodule diameter was not significantly different between true-positive and false-positives. This suggest that excluding parenchymal features increases the attention of the network on nodule diameter, allowing for larger benign nodules to be misclassified as malignant nodules.
Comparing the results shown in Table 3, to published literature such as Zhu P. and Ogino M., we found that nodule diameter remains positively correlated with nodule malignancy [31, 32]. This is best illustrated when comparing the nodule size of true-positive and true-negative nodules. Interestingly, true positive nodules were found to be significantly larger than false positive and false negative nodules in the original dataset (Supplement A). However, in the case of the tumor-only dataset nodule diameter was not significantly different when comparing true positive and false positives. This suggest that the exclusion of the parenchymal features increased network attention to nodule diameter, allowing for larger benign nodules.
Characteristics of nodule morphology such as shape and spiculation have been shown to provide clues to its likelihood of malignancy [33]. In our analysis, morphological features were significantly different in true-positive nodules compared to false-positives, false-negatives, and true-negatives in both the Original Dataset and the Parenchyma-Only Dataset (Table 3 & Supplement Table A). In these datasets, true-positives were less spherical in nature than other classification groups. This differs from findings by Zhu P. and Ogino M., suggesting an additional CT biomarker of interest [27]. This significant difference disappears when comparing true-negatives to false-positives and false-negatives, suggesting that nodule morphology plays an important role in nodule classification and contributes substantially to nodule misclassification in the Original and Parenchyma-Only datasets (Supplement A). Furthermore, the true-positives in Fig. 4 suggest that attention of the DNN was focused primarily on the tumor-parenchyma border, ignoring distant features of emphysematous or fibrotic tissue.
The presence of chronic inflammatory lung diseases such as emphysema or pulmonary fibrosis have been associated with an increased risk of nodule malignancy [18]. Interestingly, the DNN does not seem to weigh the presence of emphysema as a significant CT biomarker for malignancy. For the Original Dataset, low attenuation areas below
Similarities in the regions of attention in the GradCAM images between the Original Dataset and Paren- chyma-Only Dataset shows that the DNN paid considerable attention to the tumor-parenchyma interface, as seen in Fig. 4, suggesting that it relied not only on diameter but also morphologic image biomarkers such as nodule sphericity. Therefore, the difference in performance between the Tumor-Only Dataset and the Original Dataset (Fig. 3) may be attributable to significant additional information present at the local interface between the nodule and the parenchyma.
Density and textural features such as nodule entropy, skewness, and kurtosis were significantly different between true-positive and true-negative nodules in the Original and Tumor-Only datasets. This supports findings by the GaX model where nodule roughness was positively associated with malignancy [27]. Our findings therefore suggest that textural and density features should be considered as potential image biomarkers in addition to the nodule diameter in screening guidelines such as the Lung-RADS [34].
We found significant differences in performance between the Original Dataset and both the Tumor-Only and Parenchyma-Only datasets. The significant drop in performance of the Parenchyma-Only Dataset can be attributed to the exclusion of tumor textural and density features. These features are important as demonstrated by the Tumor-Only Dataset performance versus that of the Parenchyma-Only Dataset. However, the performance of the Parenchyma-Only Dataset demonstrates that morphologic and parenchymal features contain critical information related to nodule malignancy that are not currently included in the Lung-RADS assessment. Prior studies have explored the relative importances of parenchymal and nodular features for nodule classification achieved by various machine learning approaches, including artificial neural networks [20, 35, 36]. There has been limited study of the characteristics associated with solid pulmonary nodule classification in DNNs, and how modifications to the training set lead to changes in these characteristics [37, 38]. Current research focuses on minimizing false-positives with limited consideration given to which image biomarkers present within a training dataset could be influencing outcomes.
The findings of this study, although confirming existing work, suffer from several limitations. First, the results presented herein are based on the selective population within the NLST dataset, which consists primarily of heavy smokers. A more comprehensive understanding of why features related to emphysema (laa950) were not selected could be achieved by investigating a cohort of subjects with a higher prevalence of emphysema. In particular, this could elucidate whether this behavior is specific to the dataset we used in the present study or if it is due to lower signal intensity from emphysematous regions that fail to capture the attention of the network. At the same time, nodule characteristics should not be ignored, as significant differences between true-positives and false-negatives demonstrate that the network tends to flag larger, higher intensity, and less spherical nodules as malignant. Additionally, the networks were provided with the central slices of the nodules and not the complete 3D region of interest (ROI), potentially missing critical information in nearby slices. It is also important to note that this study exclusively addresses solid nodules and does not address the influence of ground-glass opacities and part-solid nodules on the identified textural CT biomarkers. Inclusion of ground-glass opacities or part-solid nodules could reduce the influence of textural features related to malignancy classification. To combat this, curriculum and transfer learning approaches could be utilized to teach a network to recognize specific pulmonary structures such as local vasculature as well as definable disease states [39, 40]. Furthermore, a selection bias could be impacting the performance of the network as the study focuses on solitary pulmonary nodules and does not evaluate instances where multiple nodules appear in close proximity to one another. Lastly, the performance of the parenchyma-only datasets is likely inflated as masking the nodule still preserved characteristics of the nodules shape and size. Therefore, the overall contribution of nodule diameter and shape cannot be properly evaluated. It is therefore unlikely that the networks we investigated would be able to evaluate the likelihood of future malignancy from pre-cancerous parenchymal features arising prior to the development of an actual nodule, in contrast to recent results using SYBIL [41]. An important distinction between our work and SYBIL is that the task of our model is to predict the likelihood of malignancy for an existing nodule and to evaluate the differential effect of the nodule versus the surrounding parenchyma, while SYBIL provides a prediction regarding the likelihood of future cancers and the development of existing nodules in a holistic fashion.
5.Conclusion
Using a combination of GradCAM, image perturbation via masking, and radiomics, we have demonstrated where in an image the attention of a DNN is focused depending on which regions of an image are removed. Unsurprisingly, nodule maximum diameter remained a highly selected image biomarker for nodule classification across all datasets. Textural and density features were highly selected in the Original and Tumor-Only datasets, while morphologic features were more commonly selected in the Parenchyma-Only Dataset. The results of this investigation thus imply that network performance is tied to textural features such as nodule kurtosis, entropy, and intensity, and morphologic features such as nodule sphericity, and diameter. Our findings imply that current screening guidelines may be improved through incorporation of additional image biomarkers related to malignancy [34]. Our findings also suggest that the majority of the information selected for malignant nodule classification is to be found at the tumor-parenchyma interface. Nevertheless, the features selected by CNNs for nodule classification are likely dependent on the dataset [27], hence mixing data from multiple sources could improve model generalizability[42].
Author contributions
AHM, CMK, NC, RSJE and JHTB conceived the study. AHM interpretated and analyzed the data. AHM prepared the manuscript. All authors reviewed, revised, and approved the manuscript.
Funding
NIH K23 HL133476, NCI F31 CA268908, NCI F99 CA274713.
Ethics approval
Not applicable.
Consent to participate
Not applicable.
Consent for publication
Not applicable.
Availability of data and material
Data generated or analyzed during the study are available from the corresponding author by request.
Code availability
Supplementary data
The supplementary files are available to download from http://dx.doi.org/10.3233/CBM-230444.
Acknowledgments
This work was supported by the NIH K23 HL133476, NCI grant F31 CA268908, and NCI grant F99 CA274713. The content is solely the responsibility of the author and does not represent the official view of the National Cancer Institute.
Conflict of interest
AHM is a consultant and equity holder for Predictive Wear LLC. JHTB consults for Johnson & Johnson on approaches to treating lung cancer. CMK is a consultant for Olympus America, Nanology, Johnson and Johnson, and consultant and equity holder for Quantitative Imaging Solutions. He reports grants from the NIH, the DECAMP Consortium (funded by Johnson and Johnson through Boston University), and a patent pending for “Bates JM and Kinsey CM. Methods for Computational Modeling to Guide Intratumoral Therapy.” RJSE is consultant and equity holder for Quantitative Imaging Solutions.
References
[1] | Y. Wu et al., Google’s Neural Machine Translation System: Bridging the Gap between Human and Machine Translation, ArXiv160908144 Cs ((2016) ). http://arxiv.org/abs/1609.08144 (accessed November 2, 2021). |
[2] | K. He et al., Deep Residual Learning for Image Recognition, in: 2016 IEEE Conf. Comput. Vis. Pattern Recognit. CVPR, (2016) , pp. 770–778. doi: 10.1109/CVPR.2016.90. |
[3] | G. Hinton et al., Deep Neural Networks for Acoustic Modeling in Speech Recognition: The Shared Views of Four Research Groups, IEEE Signal Process. Mag. 29: ((2012) ), 82–97. doi: 10.1109/MSP.2012.2205597. |
[4] | D. Ardila et al., End-to-end lung cancer screening with three-dimensional deep learning on low-dose chest computed tomography, Nat. Med. 25: ((2019) ), 954–961. doi: 10.1038/s41591-019-0447-x. |
[5] | B. Kim et al., Interpretability Beyond Feature Attribution: Quantitative Testing with Concept Activation Vectors (TCAV), ArXiv171111279 Stat. ((2018) ). http://arxiv.org/abs/1711.11279 (accessed May 13, 2021). |
[6] | Y. Zhang et al., A Survey on Neural Network Interpretability, ArXiv201214261Cs. ((2021) ). http://arxiv.org/abs/2012.14261 (accessed November 2, 2021). |
[7] | S. Hooker et al., A Benchmark for Interpretability Methods in Deep Neural Networks, ArXiv180610758 Cs Stat. ((2019) ). http://arxiv.org/abs/1806.10758 (accessed October 21, 2021). |
[8] | A. Ghorbani et al., Towards Automatic Concept-based Explanations, ArXiv190203129 Cs Stat. ((2019) ). http://arxiv.org/abs/1902.03129 (accessed October 21, 2021). |
[9] | R.R. Selvaraju et al., Grad-CAM: Visual Explanations from Deep Networks via Gradient-based Localization, Int. J. Comput. Vis. 128: ((2020) ), 336–359. doi: 10.1007/s11263-019-01228-7. |
[10] | A. Chattopadhyay et al., Grad-CAM++: Improved Visual Explanations for Deep Convolutional Networks, 2018 IEEE Winter Conf. Appl. Comput. Vis. WACV. ((2018) ), 839–847. doi: 10.1109/WACV.2018.00097. |
[11] | S. Desai and H.G. Ramaswamy, Ablation-CAM: Visual Explanations for Deep Convolutional Network via Gradient-free Localization, in: 2020 IEEE Winter Conf. Appl. Comput. Vis. WACV, (2020) , pp. 972–980. doi: 10.1109/WACV45572.2020.9093360. |
[12] | R. Fu et al., Axiom-based Grad-CAM: Towards Accurate Visualization and Explanation of CNNs, ArXiv200802312 Cs Eess. ((2020) ). http://arxiv.org/abs/2008.02312 (accessed April 20, 2021). |
[13] | M. Sundararajan et al., Axiomatic Attribution for Deep Networks, ArXiv170301365 Cs. ((2017) ). http://arxiv.org/abs/1703.01365 (accessed November 2, 2021). |
[14] | D. Smilkov et al., SmoothGrad: removing noise by adding noise, ArXiv170603825 Cs Stat. ((2017) ). http://arxiv.org/abs/1706.03825 (accessed November 2, 2021). |
[15] | J.P. de Torres et al., Assessing the Relationship Between Lung Cancer Risk and Emphysema Detected on Low-Dose CT of the Chest, Chest. 132: ((2007) ), 1932–1938. doi: 10.1378/chest.07-1490. |
[16] | B.M. Smith et al., Lung cancer histologies associated with emphysema on computed tomography, Lung Cancer. 76: ((2012) ), 61–66. doi: 10.1016/j.lungcan.2011.09.003. |
[17] | C.M. Kinsey et al., Regional Emphysema of a Non-Small Cell Tumor Is Associated with Larger Tumors and Decreased Survival, Ann. Am. Thorac. Soc. ((2015) ), 150603140911000. doi: 10.1513/AnnalsATS.201411-539OC. |
[18] | S.W. Moon et al., Combined pulmonary fibrosis and emphysema and idiopathic pulmonary fibrosis in non-small cell lung cancer: impact on survival and acute exacerbation, BMC Pulm. Med. 19: ((2019) ), 177. doi: 10.1186/s12890-019-0951-2. |
[19] | M.M. Hammer et al., Factors Influencing the False Positive Rate in CT Lung Cancer Screening, Acad. Radiol. 29: (Suppl 2) ((2022) ), S18–S22. doi: 10.1016/j.acra.2020.07.040. |
[20] | S. Wu et al., Can Peritumoral Radiomics Improve the Prediction of Malignancy of Solid Pulmonary Nodule Smaller Than 2 cm, Acad. Radiol. 29: (Suppl 2) ((2022) ), S47–S52. doi: 10.1016/j.acra.2020.10.029. |
[21] | D.E. Ost and M.K. Gould, Decision Making in Patients with Pulmonary Nodules, Am. J. Respir. Crit. Care Med. 185: ((2012) ), 363–372. doi: 10.1164/rccm.201104-0679CI. |
[22] | R. San Jose Estepar et al., Chest Imaging Platform: An Open-Source Library and Workstation for Quantitative Chest Imaging, in: C66 LUNG IMAGING II NEW PROBES Emerg. Technol, American Thoracic Society, (2015) : pp. A4975–A4975. doi: 10.1164/ajrccm-conference.2015.191.1_MeetingAbstracts.A4975. |
[23] | S.S.F. Yip et al., Application of the 3D slicer chest imaging platform segmentation algorithm for large lung nodule delineation, PLOS ONE. 12: ((2017) ), e0178944. doi: 10.1371/journal.pone.0178944. |
[24] | C. Szegedy et al., Rethinking the Inception Architecture for Computer Vision, ArXiv151200567 Cs. ((2015) ). http://arxiv.org/abs/1512.00567 (accessed December 13, 2021). |
[25] | A. Paszke et al., PyTorch: An Imperative Style, High-Performance Deep Learning Library, (n.d.) 12. |
[26] | A. Singh et al., Explainable Deep Learning Models in Medical Image Analysis, J. Imaging. 6: ((2020) ), 52. doi: 10.3390/jimaging6060052. |
[27] | P. Zhu and M. Ogino, Guideline-Based Additive Explanation for Computer-Aided Diagnosis of Lung Nodules, in: K. Suzuki et al. (Eds.), Interpret. Mach. Intell. Med. Image Comput. Multimodal Learn. Clin. Decis. Support, Springer International Publishing, Cham, (2019) : pp. 39–47. doi: 10.1007/978-3-030-33850-3_5. |
[28] | H. Yeche et al., UBS: A Dimension-Agnostic Metric for Concept Vector Interpretability Applied to Radiomics, in: K. Suzuki et al. (Eds.), Interpret. Mach. Intell. Med. Image Comput. Multimodal Learn. Clin. Decis. Support, Springer International Publishing, Cham, (2019) : pp. 12–20. doi: 10.1007/978-3-030-33850-3_2. |
[29] | M. Graziani et al., Regression Concept Vectors for Bidirectional Explanations in Histopathology, ((2019) ). doi: 10.48550/arXiv.1904.04520. |
[30] | M. Pisov et al., Incorporating Task-Specific Structural Knowledge into CNNs for Brain Midline Shift Detection, ((2019) ). doi: 10.48550/arXiv.1908.04568. |
[31] | M. Sánchez et al., Management of incidental lung nodules < 8 mm in diameter, J. Thorac. Dis. 10: ((2018) ), S2611–S2627. doi: 10.21037/jtd.2018.05.86. |
[32] | B. Chen et al., Malignancy risk stratification for solitary pulmonary nodule: A clinical practice guideline, J. Evid.-Based Med. 15: ((2022) ), 142–151. doi: 10.1111/jebm.12476. |
[33] | H. MacMahon et al., Guidelines for Management of Incidental Pulmonary Nodules Detected on CT Images: From the Fleischner Society 2017, Radiology. 284: ((2017) ), 228–243. doi: 10.1148/radiol.2017161659. |
[34] | Lung Rads, (n.d.). https://www.acr.org/Clinical-Resources/Reporting-and-Data-Systems/Lung-Rads (accessed September 1, (2023) ). |
[35] | J. Uthoff et al., Machine learning approach for distinguishing malignant and benign lung nodules utilizing standardized perinodular parenchymal features from CT, Med. Phys. 46: ((2019) ), 3207–3216. doi: 10.1002/mp.13592. |
[36] | A.H. Masquelin et al., Perinodular Parenchymal Features Improve Indeterminate Lung Nodule Classification, Acad. Radiol. ((2022) ). doi: 10.1016/j.acra.2022.07.001. |
[37] | J. Liang et al., Reducing False-Positives in Lung Nodules Detection Using Balanced Datasets, Front. Public Health. 9: ((2021) ). https://www.frontiersin.org/articles/10.3389/fpubh.2021.671070 (accessed June 6 (2023) ). |
[38] | C. Li et al., False-Positive Reduction on Lung Nodules Detection in Chest Radiographs by Ensemble of Convolutional Neural Networks, IEEE Access. 6: ((2018) ), 16060–16067. doi: 10.1109/ACCESS.2018.2817023. |
[39] | A. Nibali et al., Pulmonary nodule classification with deep residual networks, Int. J. Comput. Assist. Radiol. Surg. 12: ((2017) ), 1799–1808. doi: 10.1007/s11548-017-1605-6. |
[40] | A.J. Synn et al., Relative Loss of Small Pulmonary Vessels on Imaging and Risk of Recurrence of Resected Lung Adenocarcinoma, Ann. Am. Thorac. Soc. 20: ((2023) ), 1673–1676. doi: 10.1513/AnnalsATS.202303-191RL. |
[41] | P.G. Mikhael et al., Sybil: A Validated Deep Learning Model to Predict Future Lung Cancer Risk From a Single Low-Dose Chest Computed Tomography, J. Clin. Oncol. 41: ((2023) ), 2191–2200. doi: 10.1200/JCO.22.01345. |
[42] | M. Raghu et al., Transfusion: Understanding Transfer Learning for Medical Imaging, in: Adv. Neural Inf. Process. Syst., Curran Associates, Inc., (2019) . https://proceedings.neurips.cc/paper_files/paper/2019/hash/eb1e78328c46506b46a4ac4a1e378b91-Abstract.html. (accessed July 11 (2023) ). |


