
Volume doubling time and radiomic features predict tumor behavior of screen-detected lung cancers
Abstract
BACKGROUND:
Image-based biomarkers could have translational implications by characterizing tumor behavior of lung cancers diagnosed during lung cancer screening. In this study, peritumoral and intratumoral radiomics and volume doubling time (VDT) were used to identify high-risk subsets of lung patients diagnosed in lung cancer screening that are associated with poor survival outcomes.
METHODS:
Data and images were acquired from the National Lung Screening Trial. VDT was calculated between two consequent screening intervals approximately 1 year apart; peritumoral and intratumoral radiomics were extracted from the baseline screen. Overall survival (OS) was the main endpoint. Classification and Regression Tree analyses identified the most predictive covariates to classify patient outcomes.
RESULTS:
Decision tree analysis stratified patients into three risk-groups (low, intermediate, and high) based on VDT and one radiomic feature (compactness). High-risk patients had extremely poor survival outcomes (hazard ratio [HR]
CONCLUSION:
We utilized peritumoral and intratumoral radiomic features and VDT to generate a model that identify a high-risk group of screen-detected lung cancers associated with poor survival outcomes. These vulnerable subset of screen-detected lung cancers may be candidates for more aggressive surveillance/follow-up and treatment, such as adjuvant therapy.
1.Introduction
Four randomized clinical trials demonstrated that screening and early detection of lung cancer by low-dose helical computed tomography (LDCT) reduces overall and lung cancer-specific mortality [1, 2, 6, 11, 33]. However, despite the benefits of early detection, cancer screening can result in overdiagnosis which is the detection of asymptomatic cancers that are non-growing or slow-growing and unlikely fatal if left untreated [10]. Overdiagnosis of pulmonary nodules can result in unnecessary diagnostic procedures that are often invasive, associated with increased costs, and associated with added stress for patients and their families [52]. In the US National Lung Screening Trial (NLST), 10 to 27% lung cancers were overdiagnosed in the LDCT arm of the study [27, 34, 41, 42, 43]. As such, biomarkers that can discriminate between the variability in growth rates and lethal potential [42] of lung cancers diagnosed in lung cancer screening would have important clinical translational implications.
Radiomics is the conversion of medical images into structured, mineable data that can subsequently be utilized for statistical analysis and modeling [9, 12, 13, 17, 25, 28, 29, 44]. Radiomic features have shown to provide rapid and accurate noninvasive biomarkers for lung cancer risk prediction, diagnostics, prognosis, treatment response monitoring, and tumor biology [15, 45, 47]. Radiomics have many advantages over tissue-based biomarkers as they are generated from standard-of-care imaging and they reflect the pathophysiology of the entire imaged tumor or region-of-interest (e.g., screen-detected nodule) and not just the portion of the tumor that was assayed in the case for tissue-based biomarkers.
Volume doubling time (VDT) of a pulmonary nodule, defined as the number of days in which the nodule doubles in volume, is a clinically relevant metric in lung cancer screening. VDT has clinical utility in discriminating between nodules that are infectious/inflammatory, malignant, and benign [30, 46, 51]. Generally, nodules that are of an infectious or inflammatory pathophysiology have a VDT of less than 20 days, a VDT of less than 400 days (and greater than 20 days) represents a high likelihood of malignancy, and a VDT above 500 days is likely a benign nodule [23, 24]. To date, there have been few studies analyzing VDT, a delta-radiomic, as a potential biomarker to evaluate lethal potential of lung cancers diagnosed in lung cancer screening. Thus, using publicly available data and LDCT images from the NLST, we generated radiomic features to determine if we can discriminate between indolent, slow, and aggressive incidentally diagnosed lung cancers. Radiomic features describing size, shape, volume, growth rate (i.e., VDT), and textural characteristics were calculated from the intratumoral region (area within the tumor) and from the peritumoral region (area surrounding the tumor parenchyma). The overarching goal of this study was to utilize radiomics biomarkers to generate parsimonious models to predict lung cancer outcomes in the lung cancer screening setting.
2.Materials and methods
2.1NLST study population
Deidentified LDCT images and data were obtained from the National Cancer Institute (NCI) Cancer Data Access System (CDAS) [14]. The NLST study design and main findings have been described previously [1, 2]. NLST eligibility criteria included current and former smokers aged 55–74 years with a minimum 30 pack-years smoking history and former smokers had to have quit within the past 15 years.
The present study used a subset of lung cancers diagnosed in the LDCT-arm of the NLST and has been described elsewhere [38]. Briefly, we identified 314 screen-detected, incident lung cancer patients who were not diagnosed with lung cancer at baseline screening (T0) but were subsequently diagnosed with lung cancer either at the first follow-up screening (T1) or second follow-up screening (T2). However, participants were excluded due to several reasons: unavailable complete volumetric images sets, nodules at baseline that could not be identified, and nodules where it was difficult to contour the tumor. Lung cancer patients who had multiple nodules at time of their diagnosis were excluded (
The final analytical cohort included 94 participants who had a negative or positive baseline LDCT screening. Based on NLST criteria, positive screens were defined as abnormalities on baseline screens or at follow-up screens that were new, stable or evolved that resulted as one or more non-calcified masses measuring
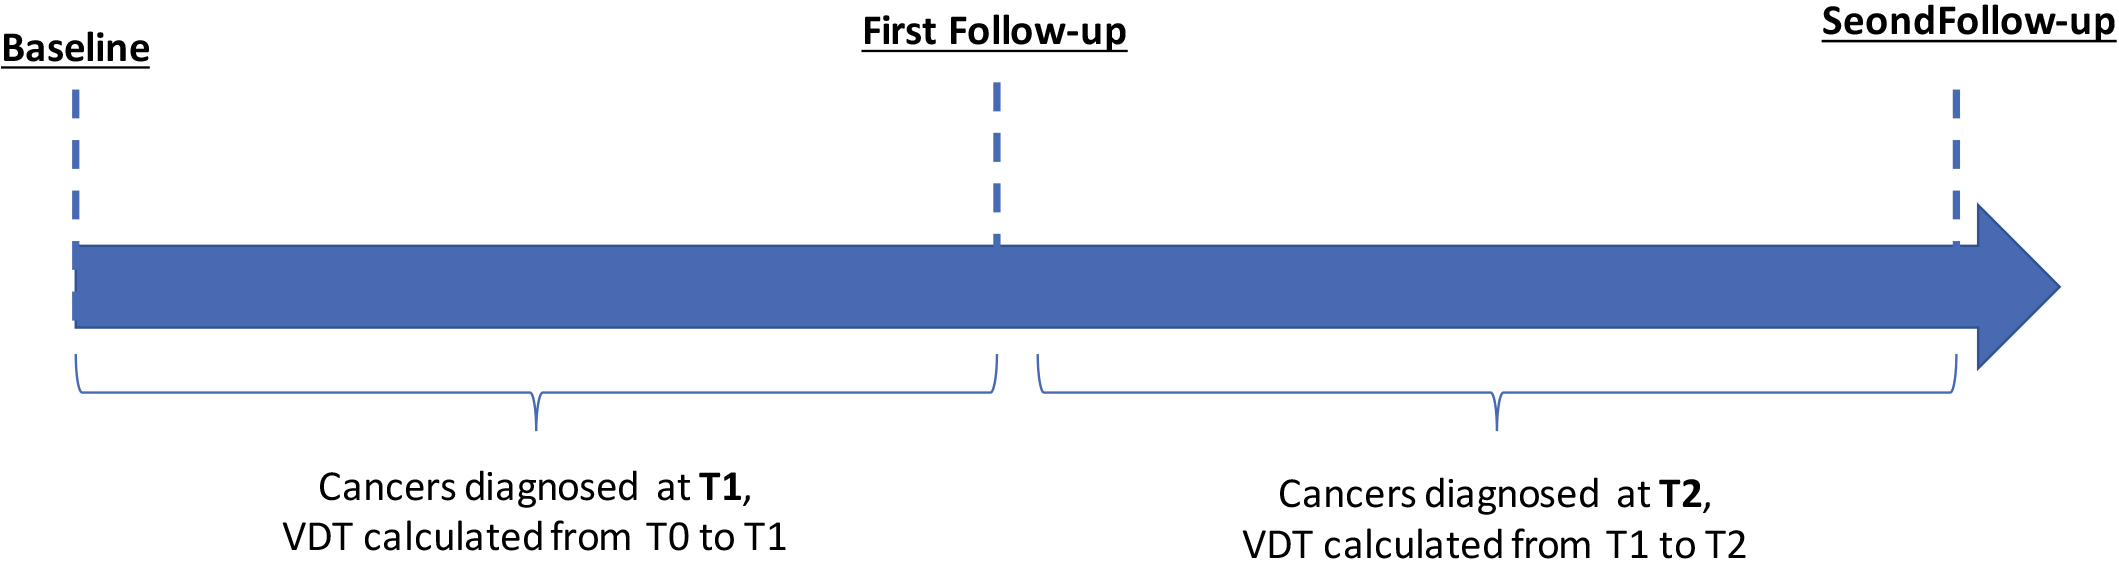
Figure 1.
Schema for identification of patients diagnosed with cancer at two different timepoints in the NLST.
2.2Radiomics
Nodule identification and tumor segmentation has been described in detail elsewhere [17]. Briefly, the tumor mask images (i.e., tumor delineations) were imported into in-house radiomic feature extraction toolboxes created in MATLAB
Using standardized radiomic algorithms from the Image Biomarker Standardization Initiative (IBSI) v5 [56], a total of 264 radiomic features were extracted from the semi-automatically segmented intratumoral region (
Volume doubling time was calculated for the screening interval from T0 to T1 and for the screening interval from T1 to T2 (Fig. 1). Below is the equation for VDT where Ti is the time interval between two LDCT imaging studies,
2.3Radiogenomics analysis
A previously described dataset [39] of surgically resected adenocarcinoma lung cancers who had pre-surgery CTs and gene expression data was used to identify potential biological underpinnings of the most informative radiomic features identified in our analyses. The gene probesets were filtered and determined as significant using the following criteria based on a Student’s
2.4Statistical analysis
Statistical analyses were performed using Stata/MP 14.2 (StataCorp LP, College Station TX), R Project for Statistical Computing (version 3.5.2), and R Studio (version 1.1.463).
Overall survival (OS) and progression-free survival (PFS) were the main endpoints and were assessed from date of lung cancer diagnosis to the date of an event or last follow up. For OS, an event was defined as death and for PFS an event was established as death or progression of cancer. All survival data were right censored at 5-years.
To generate a parsimonious model, the 65 stable radiomic features and VDT were subjected to Classification and Regression Tree (CART) analysis, adapted for survival analysis, to stratify patients into risk groups. The risk groups were analyzed by Cox regression models, Kaplan-Meier survival curves, and log-rank tests. The most informative radiomic features identified in the CART analysis were internally cross-validated using R package “rms” [16]. The Harrell’s concordance index (C-index) was used to evaluate the performance of the multivariable Cox regression models. Backward logistic regression model was used to identify radiomics features significantly associated with VDT dichotomized.
3.Results
3.1Patient characteristics
The demographics of the lung cancer patients are provided in Table 1. Mean age of enrollment into the NLST was 64.3 years, 58.5% participants were male, 58.5% were current smokers, 55.3% were diagnosed with adenocarcinoma, and 80.8% had an early-stage lung cancer (stage I or II).
Table 1
Patient characteristics
| Characteristics | All patients ( | |
|---|---|---|
| Age, mean(sd) | 64.3 | (5.4) |
| Sex | ||
| Female | 39 | (41.5%) |
| Male | 55 | (58.5%) |
| Smoking status | ||
| Former | 39 | (41.5%) |
| Current | 55 | (58.5%) |
| Pack-years smoked mean (sd) | 63.4 | (23.9) |
| Self-reported COPD | ||
| No | 81 | (86.2%) |
| Yes | 13 | (13.8%) |
| Family history of lung cancer | ||
| No | 72 | (76.6%) |
| Yes | 22 | (23.4%) |
| Histology | ||
| Adenocarcinoma-BAC | 52 | (55.3%) |
| Small cell | 3 | (3.2%) |
| Squamous | 18 | (19.2%) |
| Other NOS | 21 | (22.3%) |
| Stage | ||
| I and II | 76 | (80.8%) |
| III and IV | 18 | (19.2%) |
| Treatment | ||
| Surgical | 74 | (78.7%) |
| Chemotherapy/other | 6 | (6.4%) |
| Radiation | 14 | (14.9%) |
| Baseline screening (T0) | ||
| Positive (T0 | 40 | (42.6%) |
| Negative (T0 | 54 | (57.4%) |
Abbreviations: sd
Figure 2.
Risk-groups associated with overall survival for all patients and among early-stage patients diagnosed in the screening interval T0 to T1. (A) Schema identifying patients diagnosed in the screening interval T0 to T1. (B) The tree structure from the classification and regression tree (CART) analysis identified four risk groups based on two radiomics features and VDT. VDT was statistically significant different between very-high, high, and intermediate when compared to low-risk group. (C) Overall survival for VDT dichotomized by 234 days. Overall survival for the risk patient risk groups among all patients (D) and for early-stage (E), and for late-stage patients (F).
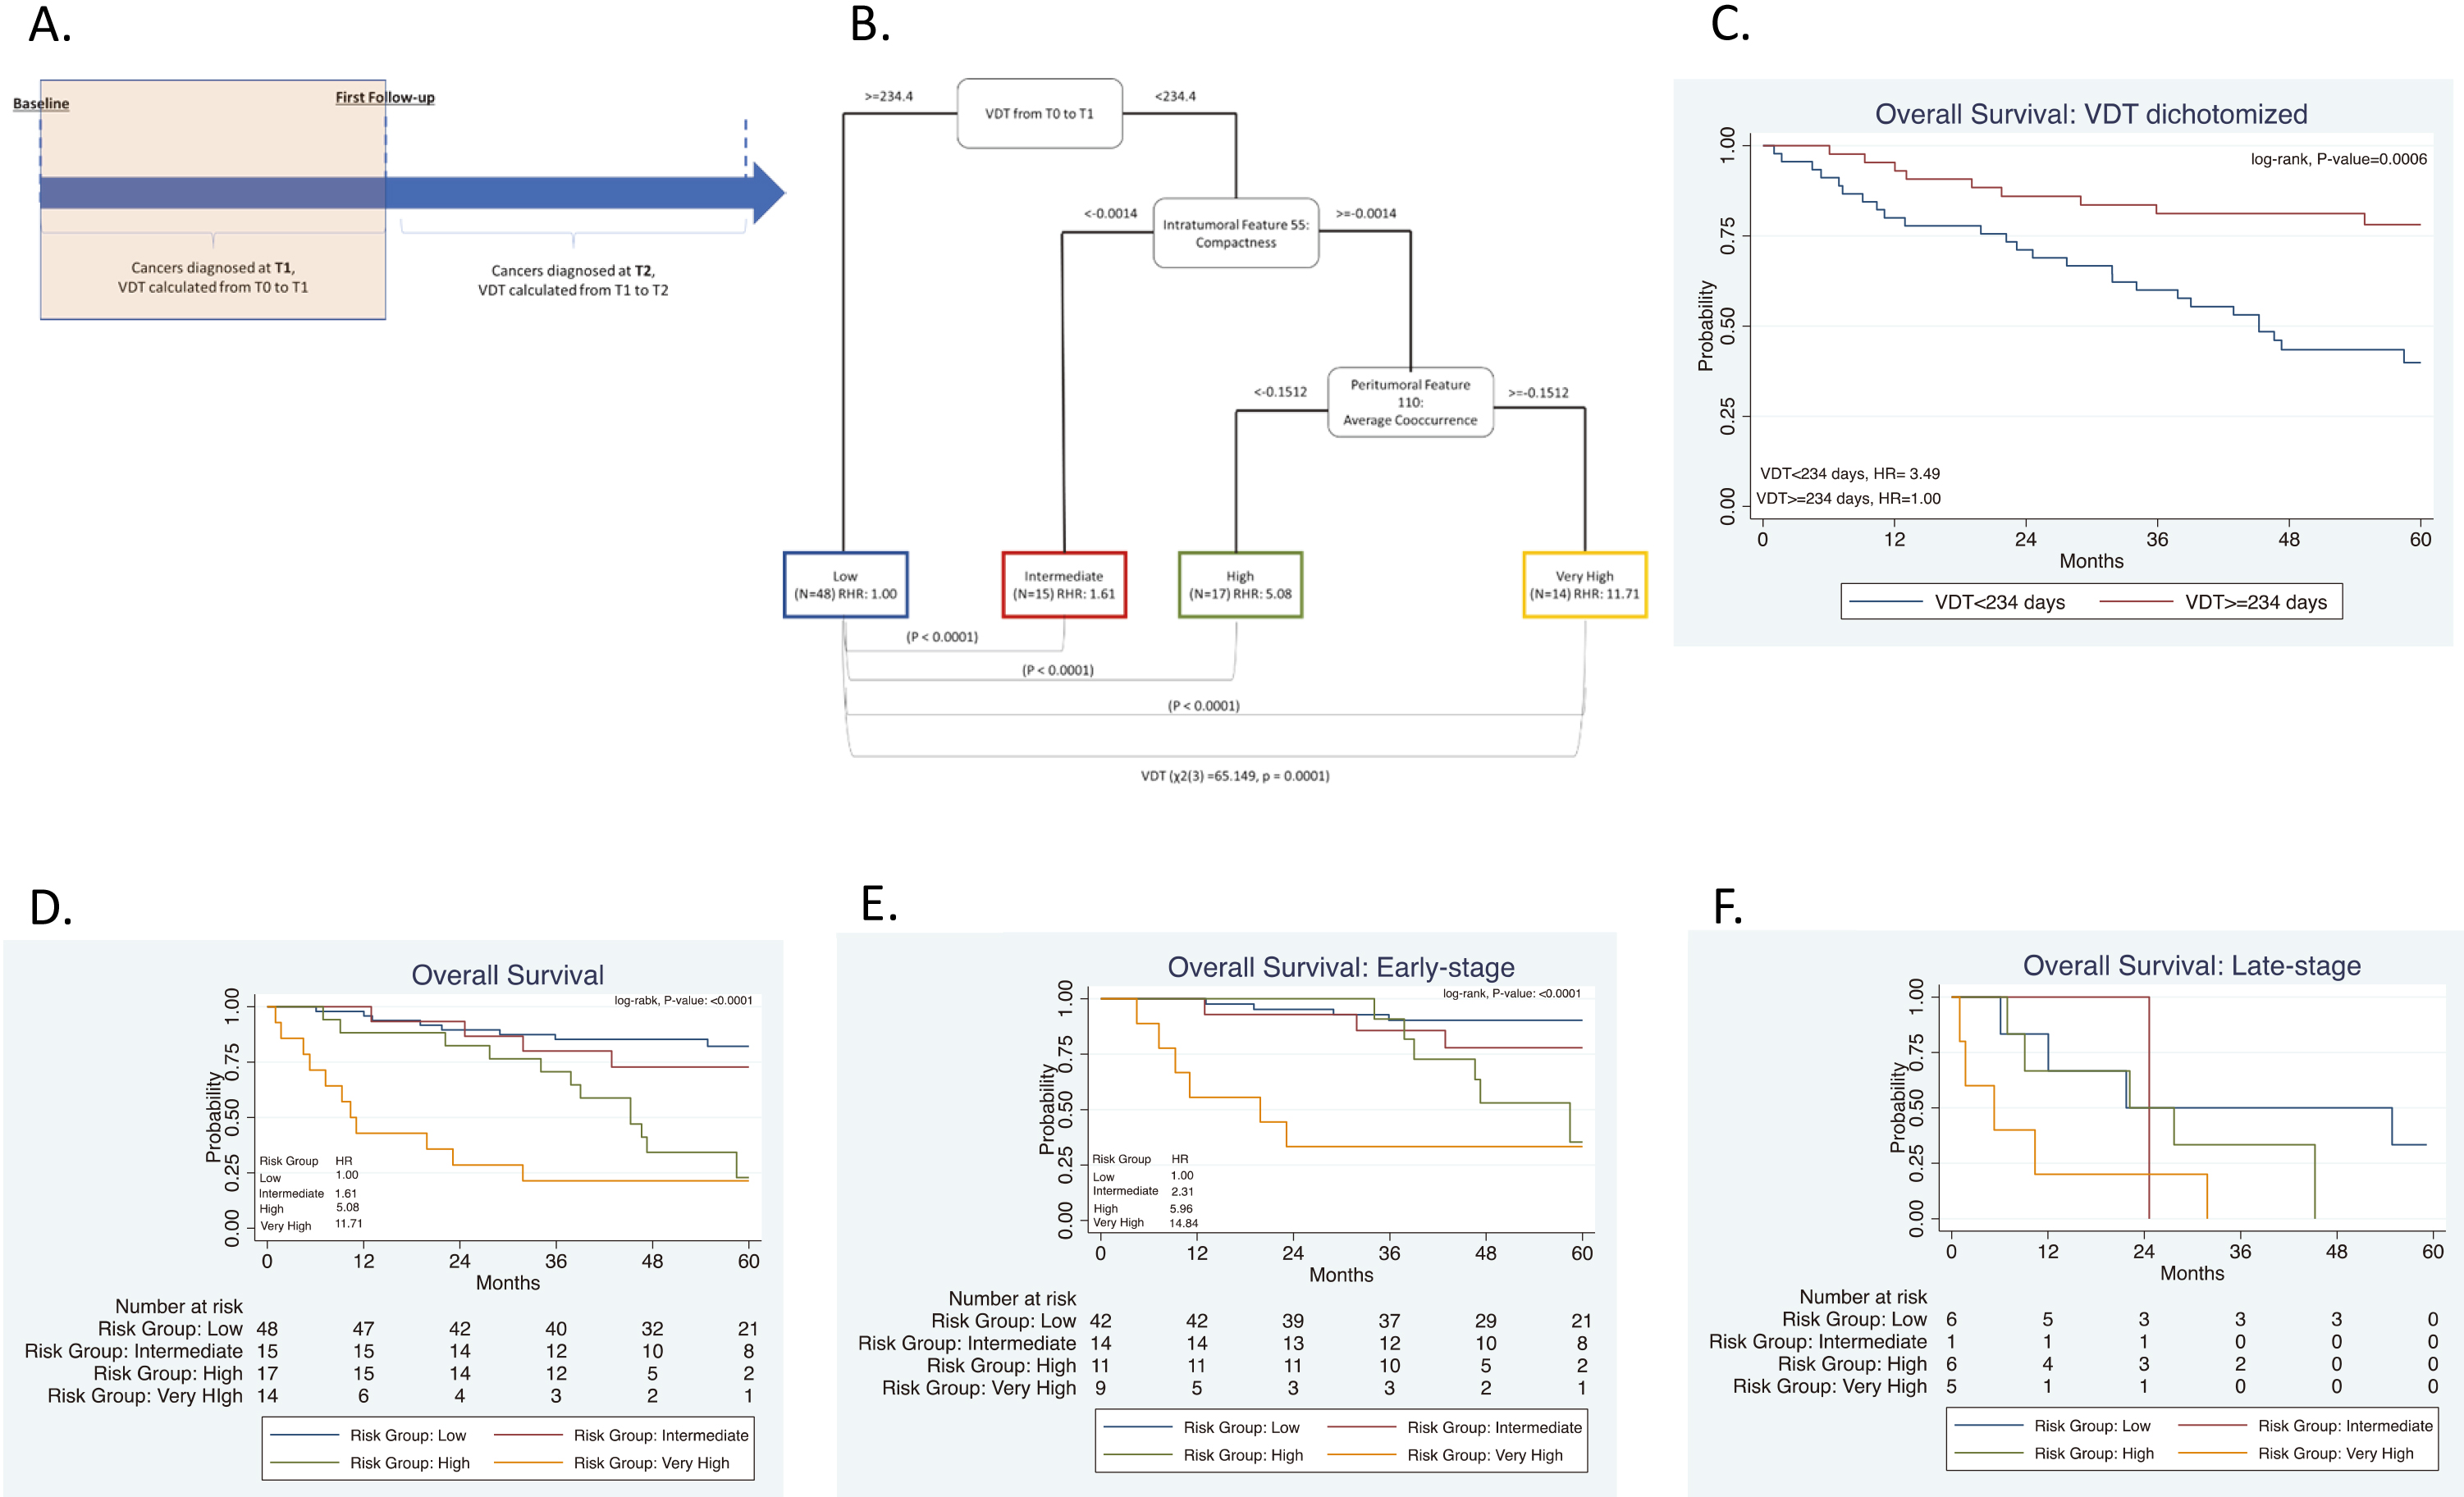
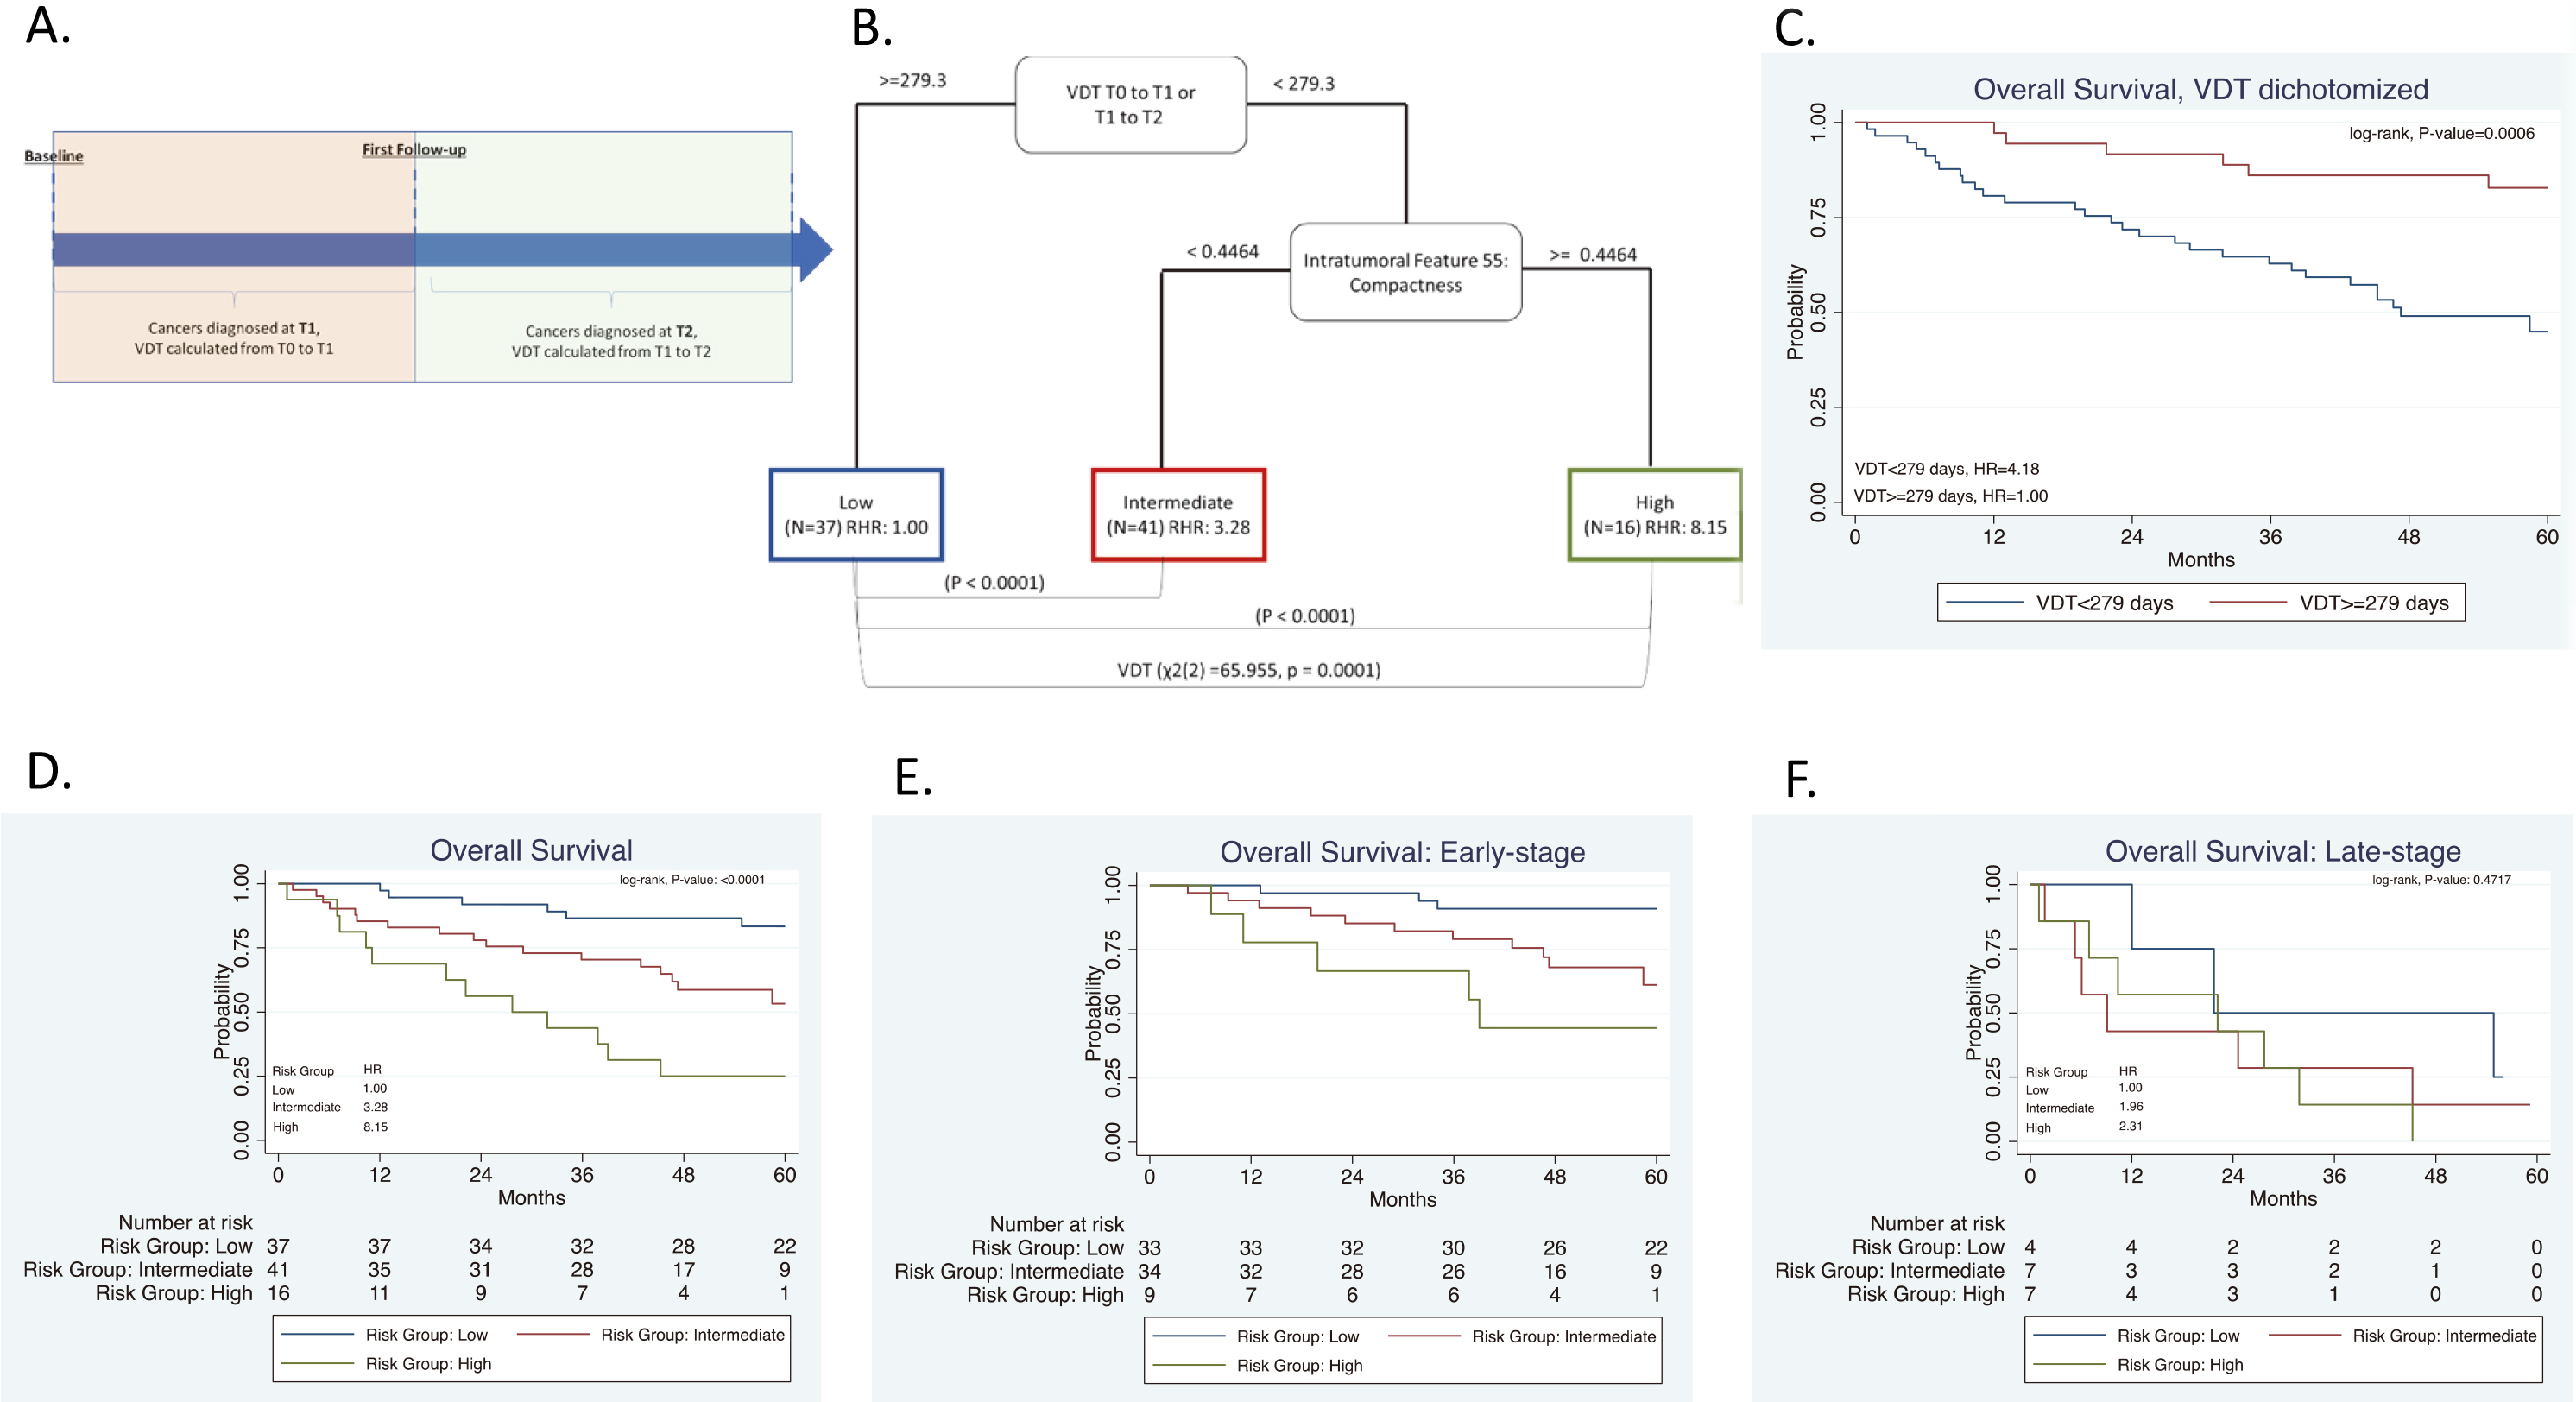
Figure 3.
Risk-groups associated with overall survival for all patients and among early-stage patients diagnosed in the screening interval T0 to T1 or T1 to T2. (A) Schema including patients diagnosed in the screening interval T1 to T2. (B) The tree structure from the classification and regression tree analysis (CART) identified three risk groups based on one radiomics feature and VDT. VDT was statistically significant different between high- and intermediate risk groups when compared to low-risk group. (C) Overall survival for VDT dichotomized by 279 days. Overall survival for the risk patient risk groups among all patients (D) and for early-stage (E), and for late-stage patients (F).
3.2Screening interval from T0 to T1
Radiomics were calculated from LDCT images at T0 and VDT was calculated from T0 to T1 as seen in Fig. 2A. The mean number of days between T0 and T1 was 369 days (range: 282 to 620 days). VDT was not significantly correlated to intratumoral or peritumoral features. VDT and the 65 radiomic features that we identified as stable and reproducible were included as inputs into CART analysis and subsequent decision tree revealed four risk groups as terminal nodes: low-risk, intermediate-risk, high-risk, and very-high-risk (Fig. 2B). The decision tree structure included VDT and two radiomic features (intratumoral feature compactness and peritumoral feature average co-occurrence). There are differences in VDT across the four risk-groups. The very-high risk group has a lower VDT (median VDT: 108.56) between T0 to T1 when compared to the high, intermediate, and low risk group (median VDT: 114.6, 143.2, and 499.2, respectively). From T0 to T1, Kruskal-Wallis test revealed that there is a statistically significant difference in VDT between the four risk groups (
There were no statistically significant differences between the four risk groups by age, smoking status, number of pack-years smoked, baseline screening, and family history of lung cancer (Table 2). However, there were statistically significant differences across the risk groups for sex (
3.3Screening intervals from T0 to T1 and T1 to T2
For this analysis, we utilized the data from Section 3.2 above and included participants who were diagnosed with lung cancer at T2. Radiomics were calculated from T0 and VDT was calculated from T0 to T1 and between T1 to T2, as seen in Fig. 3A. The mean number of days between T1 and T2 was 370 days (range: 287 to 480 days). The same stable radiomic features were combined with VDT and subjected to CART analysis and revealed three risk groups: low-risk, intermediate-risk, high-risk (Fig. 3B). Due to the addition of participants who were diagnosed with lung cancer at T2, a new decision tree structure was identified. The decision tree structure included one radiomic feature (intratumoral feature compactness) and VDT. There are differences in VDT across the three risk-groups. The high-risk group has a lower VDT (median VDT: 104.58) between T0 to T1 and from T1 to T2 when compared to the intermediate, and low risk group (median VDT: 132.53 and 459.23, respectively) (
There were no statistically significant differences between the three risk groups by age, smoking status, number of pack-years smoked, treatment, baseline screening, and family history of lung cancer (Table 2). However, there were statistically significant differences across the risk groups for sex (
3.4Predicting VDT using T0 radiomics features
When dichotomizing VDT by the novel threshold of 279 days, backward logistic regression identified the intratumoral radiomic feature compactness as the most informative radiomic feature (OR: 2.54; 95% CI 0.91, 7.12]). Compactness 2, a morphological feature, is a measure of how compact the shape of the region-of-interest is relative to a sphere (most compact) [3]. Compactness 2 was extracted from the semi-automatically segmented intratumoral region and peritumoral 3 mm outside of tumor boundary. Intratumoral Compactness 2 was identified as a stable and reproducible radiomic feature [48].
Table 2
Patient characteristics by risk group
| Screening interval from T0 to T1 | Screening interval from T0 to T1 or T1 to T2 | |||||||||||||||
| Characteristics | Low risk group ( | Intermediate risk group ( | High risk group ( | Very high risk group ( | Low risk group ( | Intermediate risk group ( | High risk group ( | |||||||||
| Age, mean (sd) | 62.6 | (5.2) | 64.4 | (5.0) | 65.2 | (6.1) | 68.3 | (3.4) | 0.13 | 63.7 | (5.3) | 63.8 | (5.4) | 66.6 | (5.0) | 0.93 |
| Sex, N (%) | 0.02 | 0.0003 | ||||||||||||||
| Female | 27 | (56.3%) | 4 | (26.7%) | 5 | (29.4%) | 3 | (21.4%) | 23 | (62.2%) | 10 | (24.4%) | 6 | (37.5%) | ||
| Male | 21 | (43.7%) | 11 | (73.3%) | 12 | (70.6%) | 11 | (78.6%) | 14 | (37.8%) | 31 | (75.6%) | 10 | (62.5%) | ||
| Smoking status, | 0.60 | 0.93 | ||||||||||||||
| No | 20 | (41.7%) | 8 | (53.3%) | 5 | (29.4%) | 6 | (42.9%) | 16 | (43.2%) | 17 | (41.5%) | 6 | (37.5%) | ||
| Yes | 28 | (58.3%) | 7 | (46.7%) | 12 | (70.6%) | 8 | (57.1%) | 21 | (56.8%) | 24 | (58.5%) | 10 | (62.5%) | ||
| Pack-years, mean (sd) | 60.1 | (19.5) | 72.4 | (33.3) | 66.7 | (25.2) | 63.9 | (24.7) | 0.06 | 62.7 | (19.8) | 62.8 | (26.9) | 66.7 | (26.2) | 0.16 |
| FH of lung cancer, | 0.15 | 0.39 | ||||||||||||||
| No | 40 | (83.3%) | 10 | (66.7%) | 14 | (82.4%) | 8 | (57.1%) | 31 | (83.8%) | 30 | (73.2%) | 11 | (68.8%) | ||
| Yes | 8 | (16.7%) | 5 | (33.3%) | 3 | (17.6%) | 6 | (42.9%) | 6 | (16.2%) | 11 | (26.8%) | 5 | (31.3%) | ||
| Self-reported history of COPD, | 0.003 | 0.003 | ||||||||||||||
| No | 45 | (93.8%) | 14 | (93.3%) | 10 | (58.8%) | 12 | (85.7%) | 36 | (97.3%) | 35 | (85.4%) | 10 | (62.5%) | ||
| Yes | 3 | (6.2%) | 1 | (6.7%) | 7 | (41.2%) | 2 | (14.3%) | 1 | (2.7%) | 6 | (14.6%) | 6 | (37.3%) | ||
| Histology, | 0.007 |
| ||||||||||||||
| Adenocarcinoma-BAC | 30 | (62.5%) | 7 | (46.7%) | 7 | (41.2%) | 8 | (57.1%) | 29 | (78.4%) | 18 | (43.9%) | 5 | (31.3%) | ||
| Squamous | 6 | (12.5%) | 7 | (46.7%) | 2 | (11.8%) | 3 | (21.4%) | 3 | (8.1%) | 12 | (29.3%) | 3 | (18.8%) | ||
| Small cell | 0 | (0%) | 0 | (0%) | 1 | (5.9%) | 2 | (14.3%) | 0 | (0%) | 0 | (0%) | 3 | (18.8%) | ||
| Other NOS | 12 | (25%) | 1 | (6.7%) | 7 | (41.2%) | 1 | (7.1%) | 5 | (13.5%) | 11 | (26.8%) | 5 | (31.3%) | ||
| Treatment, | 0.038 | 0.19 | ||||||||||||||
| Surgical | 42 | (87.5%) | 13 | (86.7%) | 11 | (64.7%) | 8 | (14.3%) | 33 | (89.2%) | 31 | (75.6%) | 10 | (62.5%) | ||
| Chemotherapy/other | 4 | (8.33%) | 0 | (0%) | 1 | (5.9%) | 1 | (7.1%) | 2 | (5.4%) | 2 | (4.9%) | 2 | (12.5%) | ||
| Radiation therapy | 2 | (4.17%) | 2 | (13.3%) | 5 | (29.4%) | 5 | (35.7%) | 2 | (5.4%) | 8 | (19.5%) | 4 | (25.0%) | ||
| Staging, | 0.04 | 0.02 | ||||||||||||||
| Early stage (I and II) | 42 | (87.5%) | 14 | (93.3%) | 11 | (64.7%) | 9 | (64.3%) | 33 | (89.2%) | 34 | (82.9%) | 9 | (56.3%) | ||
| Late stage (III and IV) | 6 | (12.5%) | 1 | (6.7%) | 6 | (35.3%) | 5 | (35.7%) | 4 | (10.8%) | 7 | (17.1%) | 7 | (43.8%) | ||
| Baseline screening, | 0.11 | 0.12 | ||||||||||||||
| Positive (T0 | 26 | (54.2%) | 5 | (33.3%) | 4 | (23.5%) | 5 | (35.7%) | 20 | (54.1%) | 16 | (39.0%) | 4 | (25.0%) | ||
| Negative (T0 | 22 | (45.8%) | 10 | (66.7%) | 13 | (76.5%) | 9 | (64.3%) | 17 | (45.9%) | 25 | (61.0%) | 12 | (75.0%) | ||
Abbreviations: sd
Table 3
Multivariable Cox proportional hazards models for overall survival
| Screening interval from T0 to T1 | Screening interval from T0 to T1 or T1 to T2 | |||||||
| Characteristic | All patients | Early-stage patients HR (95% CI) | All patients | Early-stage patients HR (95% CI) | ||||
| Risk group | ||||||||
| Low | 1.00 | (Reference) | 1.00 | (Reference) | 1.00 | (Reference) | 1.00 | (Reference) |
| Intermediate | 1.12 | (0.30, 4.13) | 2.28 | (0.37, 14.08) | 2.38 | (0.85, 6.61) | 3.38 | (0.85, 13.45) |
| High | 3.12 | (1.11, 8.75) | 9.66 | (1.37, 67.99) | 3.62 | (1.12, 11.69) | 7.82 | (1.44, 42.43) |
| Very high | 10.90 | (3.98,29.85) | 21.36 | (3.70, 123.60) | n/a | n/a | ||
| Sex | ||||||||
| Female | 1.00 | (Reference) | 1.00 | (Reference) | 1.00 | (Reference) | 1.00 | (Reference) |
| Male | 1.61 | (0.68, 3.85) | 2.96 | (0.55, 15.97) | 1.46 | (0.62, 3.43) | 1.96 | (0.60, 6.40) |
| Stage | ||||||||
| I and II | 1.00 | (Reference) | 1.00 | (Reference) | 1.00 | (Reference) | 1.00 | (Reference) |
| III and IV | 8.25 | (3.42, 19.90) | n/a | 7.03 | (3.10, 15.93) | n/a | ||
| Histology | ||||||||
| Adenocarcinoma-BAC | 1.00 | (Reference) | 1.00 | (Reference) | 1.00 | (Reference) | 1.00 | (Reference) |
| Squamous | 2.84 | (1.01. 7.97) | 3.05 | (0.73, 12.78) | 1.38 | (0.55, 3.47) | 1.08 | (0.35, 3.35) |
| Small cell | 1.45 | (0.33, 6.42) | n/a | 1.52 | (0.32, 7.23) | n/a | ||
| Other NOS | 0.84 | (0.28, 2.53) | 0.31 | (0.04, 2.11) | 0.66 | (0.26, 1.65) | 0.69 | (0.19, 2.53) |
| Self-reported COPD | ||||||||
| No | 1.00 | (Reference) | 1.00 | (Reference) | 1.00 | (Reference) | 1.00 | (Reference) |
| Yes | 2.49 | (0.91, 6.81) | 2.45 | (0.61, 9.77) | 2.10 | (0.76, 5.81) | 1.07 | (0.29, 3.99) |
| Treatment | ||||||||
| Surgical | 1.00 | (Reference) | 1.00 | (Reference) | n/a | n/a | ||
| Chemotherapy/other | 6.58 | (1.48, 29.36) | 372.88 | (12.99, 10707.83) | n/a | n/a | ||
| Radiotherapy | 3.61 | (1.43, 9.11) | 2.13 | (0.53, 8.51) | n/a | n/a | ||
| Harrell’s C-index | 0.85 | 0.84 | 0.80 | 0.72 | ||||
| Abbreviations: COPD | ||||||||
According to Aerts et al. [3] the formula is:
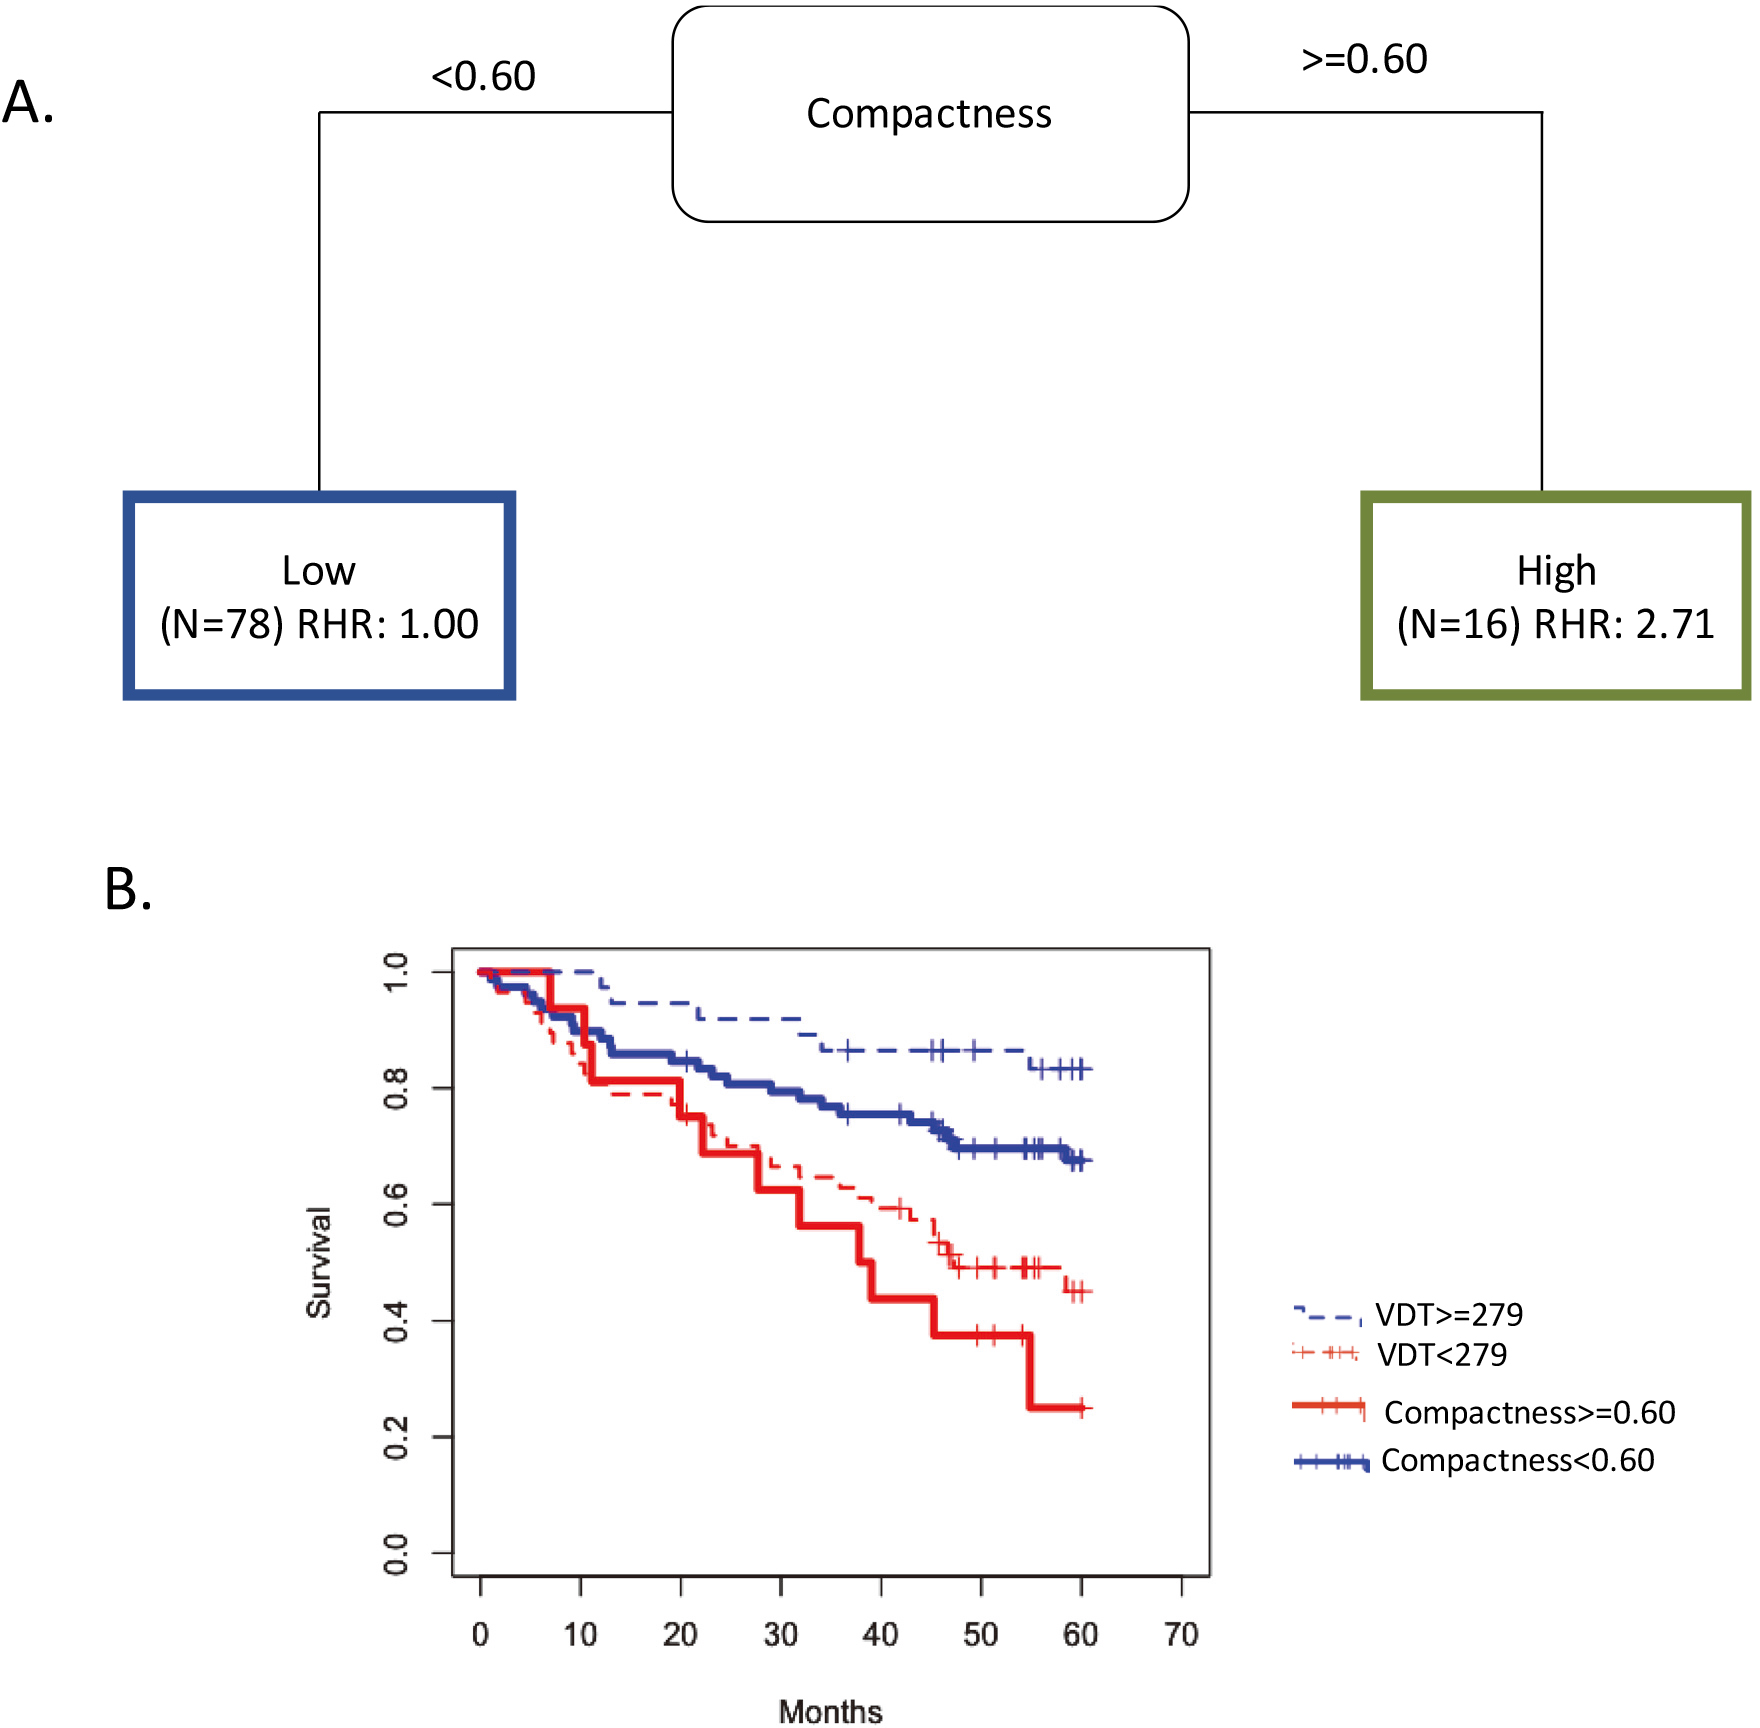
To identify a potential prognostic threshold, compactness was included into CART to identify the most informative cutpoint associated with OS (Fig. 4A). A VDT
Figure 4.
Intratumoral feature Compactness and VDT have similar prognosis capabilities. (A) The tree structure of the classification and regression tree analysis (CART) which identified the survival cutpoint of compactness. (B) Overall Survival for VDT dichotomized at 279 days and Compactness dichotomized at 0.60. Abbreviations: RHR
3.5Radiogenomics analysis
To reduce false positives in the radiogenomics analysis, we utilized a very high
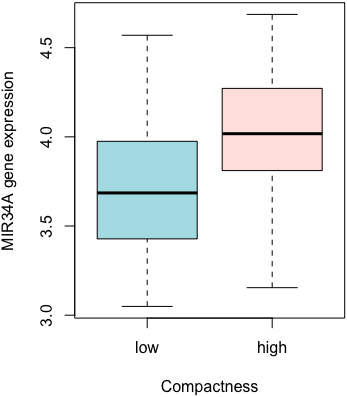
Figure 5.
Association between radiomics and gene expression. MIR34A expression by dichotomizing Compactness at the median.
4.Discussion
Overdiagnosis is a serious adverse effect of cancer screening and early detection. A recent meta-analysis of randomized trials on overdiagnosis of lung cancer with LDCT [7] estimated that 49% of the LDCT screen-detected cancers may be overdiagnosed. Though the authors conclude, “there is great uncertainty about the degree of overdiagnosis in lung cancer screening due to the heterogeneity” of screening trials, there is substantial evidence [7, 11, 18, 35, 42] that overdiagnosis is a real world problem and robust biomarkers such as radiomics could have translational implications by risk stratifying screen-detected lung cancer. To that end, we utilized VDT and peritumoral and intratumoral radiomic features to identify high-risk screen-detected lung cancers associated with poor survival outcomes. Among patients diagnosed with lung cancer at the first screening interval (T1), very-high risk patients had extremely poor survival outcomes (HR
VDT has been largely utilized as a diagnostic biomarker to discriminate malignant and benign nodules [8, 31, 53]; however, the thresholds to discriminate between malignant and benign pulmonary nodules are inconsistent. Additionally, prior studies utilized VDT as a biomarker to differentiate between indolent and aggressive lung cancers diagnosed [5, 21, 36, 50, 51] and have also utilized VDT as a prognostic factor [32, 40, 49]. For example, a VDT of less than 400 days was found to be an independent risk factor for poor disease-free survival [32]. In a study based on chest x-rays, the 5-year survival rate of fast-growing nodules with a VDT of
While prior studies by group have utilized radiomic features only [37] and the combination of radiomics and an a priori VDT threshold [29] (i.e.,
We acknowledge some limitations of this study. First, the sample size is modest because we utilized lung cancer cases with specific inclusion and exclusion criteria from the NLST. However, we utilized bootstrapping for internal validation which revealed the models were well calibrated. Hopefully other lung cancer screening trials, such as NELSON [11], LUSI [6], and MILD [33], will make their images and data public so that independent validation analyses can be performed. Additional research is also needed to validate the biological underpinnings of the gene identified in the radiogenomics analysis.
The results from our analyses revealed that radiomics combined with VDT can identify a vulnerable subset of screen-detected lung cancers that are associated with poor survival outcome suggesting such patients may need more aggressive treatment, such as adjuvant therapies, and more aggressive surveillance/follow-up. Further research is needed to validate these findings in other lung cancer screening trials and programs and to fully elucidate the biological underpinnings of these radiomic features and VDT.
Author contributions
Conception: J.P-M, R.J.G, M.B.S
Interpretation or analysis of data: J.P-M, H.L, W.M, I.T,T.K, S.A.E, M.B.S
Preparation of the manuscript: J.P-M, H.L, W.M, I.T, T.K, S.A.E, Y.B, R.J.G, M.B.S
Revision for important intellectual content: J.P-M, H.L, W.M, I.T, T.K, S.A.E, Y.B, R.J.G, M.B.S
Supervision: M.B.S and R.J.G
Supplementary data
The supplementary files are available to download from http://dx.doi.org/10.3233/CBM-210194.
Acknowledgments
Funding support from U54-CA163068, U54-CA1630 71, P20 CA202920, U01-CA143062, and U01-CA2004 64. None of the authors are affiliated with the National Cancer Institute. The authors thank the NCI for access to NCI’s data collected by the National Lung Screening Trial. The statements contained herein are solely those of the authors and do not represent or imply concurrence or endorsement by the NCI.
Conflict of interest
R.J.G is a consultant for HealthMyne Imaging Systems. J.P-M, H.L, W.M, I.T, T.K, S.A.E, Y.B, R.J.G, and M.B.S. declare no competing interests.
References
[1] | D.R. Aberle, A.M. Adams, C.D. Berg, W.C. Black, J.D. Clapp, R.M. Fagerstrom, I.F. Gareen, C. Gatsonis, P.M. Marcus and J.D. Sicks, Reduced lung-cancer mortality with low-dose computed tomographic screening, N Engl J Med 365: ((2011) ), 395–409. |
[2] | D.R. Aberle, C.D. Berg, W.C. Black, T.R. Church, R.M. Fagerstrom, B. Galen, I.F. Gareen, C. Gatsonis, J. Goldin, J.K. Gohagan, B. Hillman, C. Jaffe, B.S. Kramer, D. Lynch, P.M. Marcus, M. Schnall, D.C. Sullivan, D. Sullivan and C.J. Zylak, The National Lung Screening Trial: Overview and study design, Radiology 258: ((2011) ), 243–253. |
[3] | H.J.W.L. Aerts, E.R. Velazquez, R.T.H. Leijenaar, C. Parmar, P. Grossmann, S. Carvalho, J. Bussink, R. Monshouwer, B. Haibe-Kains, D. Rietveld, F. Hoebers, M.M. Rietbergen, C.R. Leemans, A. Dekker, J. Quackenbush, R.J. Gillies and P. Lambin, Decoding tumour phenotype by noninvasive imaging using a quantitative radiomics approach, Nature Communications 5: ((2014) ), 4006. |
[4] | S.T. Aherne, S.F. Madden, D.J. Hughes, B. Pardini, A. Naccarati, M. Levy, P. Vodicka, P. Neary, P. Dowling and M. Clynes, Circulating miRNAs miR-34a and miR-150 associated with colorectal cancer progression, BMC Cancer 15: ((2015) ), 329. |
[5] | D.R. Baldwin, S.W. Duffy, N.J. Wald, R. Page, D.M. Hansell and J.K. Field, UK Lung Screen (UKLS) nodule management protocol: Modelling of a single screen randomised controlled trial of low-dose CT screening for lung cancer, Thorax 66: ((2011) ), 308–313. |
[6] | N. Becker, E. Motsch, A. Trotter, C.P. Heussel, H. Dienemann, P.A. Schnabel, H.U. Kauczor, S.G. Maldonado, A.B. Miller, R. Kaaks and S. Delorme, Lung cancer mortality reduction by LDCT screening-Results from the randomized German LUSI trial, Int J Cancer 146: ((2020) ), 1503–1513. |
[7] | J. Brodersen, T. Voss, F. Martiny, V. Siersma, A. Barratt and B. Heleno, Overdiagnosis of lung cancer with low-dose computed tomography screening: Meta-analysis of the randomised clinical trials, Breathe (Sheff) 16: ((2020) ), 200013. |
[8] | M.E. Callister, D.R. Baldwin, A.R. Akram, S. Barnard, P. Cane, J. Draffan, K. Franks, F. Gleeson, R. Graham, P. Malhotra, M. Prokop, K. Rodger, M. Subesinghe, D. Waller and I. Woolhouse, British Thoracic Society guidelines for the investigation and management of pulmonary nodules, Thorax 70: (Suppl 2) ((2015) ), ii1–ii54. |
[9] | D. Cherezov, S.H. Hawkins, D.B. Goldgof, L.O. Hall, Y. Liu, Q. Li, Y. Balagurunathan, R.J. Gillies and M.B. Schabath, Delta radiomic features improve prediction for lung cancer incidence: A nested case-control analysis of the National Lung Screening Trial, Cancer Med 7: ((2018) ), 6340–6356. |
[10] | R. Clay, S. Rajagopalan, R. Karwoski, F. Maldonado, T. Peikert and B. Bartholmai, Computer Aided Nodule Analysis and Risk Yield (CANARY) characterization of adenocarcinoma: radiologic biopsy, risk stratification and future directions, Transl Lung Cancer Res 7: ((2018) ), 313–326. |
[11] | H.J. de Koning, C.M. van der Aalst, P.A. de Jong, E.T. Scholten, K. Nackaerts, M.A. Heuvelmans, J.-W.J. Lammers, C. Weenink, U. Yousaf-Khan and N.J.N.E.j.o.m. Horeweg, Reduced lung-cancer mortality with volume CT screening in a randomized trial, 382: ((2020) ), 503–513. |
[12] | B. Dreno, J.F. Thompson, B.M. Smithers, M. Santinami, T. Jouary, R. Gutzmer, E. Levchenko, P. Rutkowski, J.J. Grob, S. Korovin, K. Drucis, F. Grange, L. Machet, P. Hersey, I. Krajsova, A. Testori, R. Conry, B. Guillot, W.H.J. Kruit, L. Demidov, J.A. Thompson, I. Bondarenko, J. Jaroszek, S. Puig, G. Cinat, A. Hauschild, J.J. Goeman, H.C. van Houwelingen, F. Ulloa-Montoya, A. Callegaro, B. Dizier, B. Spiessens, M. Debois, V.G. Brichard, J. Louahed, P. Therasse, C. Debruyne and J.M. Kirkwood, MAGE-A3 immunotherapeutic as adjuvant therapy for patients with resected, MAGE-A3-positive, stage III melanoma (DERMA): A double-blind, randomised, placebo-controlled, phase 3 trial, Lancet Oncol 19: ((2018) ), 916–929. |
[13] | X. Fave, L. Zhang, J. Yang, D. Mackin, P. Balter, D. Gomez, D. Followill, A.K. Jones, F. Stingo, Z. Liao, R. Mohan and L. Court, Delta-radiomics features for the prediction of patient outcomes in non-small cell lung cancer, Sci Rep 7: ((2017) ), 588. |
[14] | D.S. Gierada, P. Pinsky, H. Nath, C. Chiles, F. Duan and D.R. Aberle, Projected outcomes using different nodule sizes to define a positive CT lung cancer screening examination, J Natl Cancer Inst 106: ((2014) ). |
[15] | R.J. Gillies and M.B. Schabath, Radiomics improves cancer screening and early detection, Cancer Epidemiol Biomarkers Prev 29: ((2020) ), 2556–2567. |
[16] | F. Harrell, Regression Modeling Strategies version 6.1-1, (2021) . |
[17] | S. Hawkins, H. Wang, Y. Liu, A. Garcia, O. Stringfield, H. Krewer, Q. Li, D. Cherezov, R.A. Gatenby, Y. Balagurunathan, D. Goldgof, M.B. Schabath, L. Hall and R.J. Gillies, Predicting Malignant Nodules from Screening CT Scans, J Thorac Oncol 11: ((2016) ), 2120–2128. |
[18] | B. Heleno, V. Siersma and J. Brodersen, Estimation of overdiagnosis of lung cancer in low-dose computed tomography screening: A secondary analysis of the danish lung cancer screening trial, JAMA Intern Med 178: ((2018) ), 1420–1422. |
[19] | H. Hermeking, The miR-34 family in cancer and apoptosis, Cell Death & Differentiation 17: ((2010) ), 193–199. |
[20] | H. Hermeking, MicroRNAs in the p53 network: micromanagement of tumour suppression, Nat Rev Cancer 12: ((2012) ), 613–626. |
[21] | M.A. Heuvelmans, M. Oudkerk, G.H. de Bock, H.J. de Koning, X. Xie, P.M. van Ooijen, M.J. Greuter, P.A. de Jong, H.J. Groen and R. Vliegenthart, Optimisation of volume-doubling time cutoff for fast-growing lung nodules in CT lung cancer screening reduces false-positive referrals, Eur Radiol 23: ((2013) ), 1836–1845. |
[22] | W. Jun, L. Xia, D. Di, S. Jiangdian, X. Min, Z. Yali and T. Jie, Prediction of malignant and benign of lung tumor using a quantitative radiomic method, Annu Int Conf IEEE Eng Med Biol Soc 2016: ((2016) ), 1272–1275. |
[23] | M. Kanashiki, T. Tomizawa, I. Yamaguchi, K. Kurishima, N. Hizawa, H. Ishikawa, K. Kagohashi and H. Satoh, Volume doubling time of lung cancers detected in a chest radiograph mass screening program: Comparison with CT screening, Oncol Lett 4: ((2012) ), 513–516. |
[24] | J.P. Ko, E.J. Berman, M. Kaur, J.S. Babb, E. Bomsztyk, A.K. Greenberg, D.P. Naidich and H. Rusinek, Pulmonary Nodules: Growth rate assessment in patients by using serial CT and three-dimensional volumetry, Radiology 262: ((2012) ), 662–671. |
[25] | P. Lambin, E. Rios-Velazquez, R. Leijenaar, S. Carvalho, R.G. van Stiphout, P. Granton, C.M. Zegers, R. Gillies, R. Boellard, A. Dekker and H.J. Aerts, Radiomics: Extracting more information from medical images using advanced feature analysis, Eur J Cancer 48: ((2012) ), 441–446. |
[26] | E.J. Limkin, S. Reuzé, A. Carré, R. Sun, A. Schernberg, A. Alexis, E. Deutsch, C. Ferté and C. Robert, The complexity of tumor shape, spiculatedness, correlates with tumor radiomic shape features, Scientific Reports 9: ((2019) ), 4329. |
[27] | R.M. Lindell, T.E. Hartman, S.J. Swensen, J.R. Jett, D.E. Midthun, H.D. Tazelaar and J.N. Mandrekar, Five-year lung cancer screening experience: CT appearance, growth rate, location, and histologic features of 61 lung cancers, Radiology 242: ((2007) ), 555–562. |
[28] | Y. Liu, H. Wang, Q. Li, M.J. McGettigan, Y. Balagurunathan, A.L. Garcia, Z.J. Thompson, J.J. Heine, Z. Ye, R.J. Gillies and M.B. Schabath, Radiologic features of small pulmonary nodules and lung cancer risk in the national lung screening trial: A nested case-control study, Radiology 286: ((2017) ), 298–306. |
[29] | H. Lu, W. Mu, Y. Balagurunathan, J. Qi, M.A. Abdalah, A.L. Garcia, Z. Ye, R.J. Gillies and M.B. Schabath, Multi-window CT based Radiomic signatures in differentiating indolent versus aggressive lung cancers in the National Lung Screening Trial: A retrospective study, Cancer Imaging 19: ((2019) ), 45. |
[30] | P. Maisonneuve, V. Bagnardi, M. Bellomi, L. Spaggiari, G. Pelosi, C. Rampinelli, R. Bertolotti, N. Rotmensz, J.K. Field, A. Decensi and G. Veronesi, Lung cancer risk prediction to select smokers for screening CT – a model based on the Italian COSMOS trial, Cancer Prev Res (Phila) 4: ((2011) ), 1778–1789. |
[31] | A. Nair, A. Devaraj, M.E.J. Callister and D.R. Baldwin, The Fleischner Society 2017 and British Thoracic Society 2015 guidelines for managing pulmonary nodules: Keep calm and carry on, Thorax 73: ((2018) ), 806. |
[32] | S. Park, S.M. Lee, S. Kim, J.G. Lee, S. Choi, K.H. Do and J.B. Seo, Volume doubling times of lung adenocarcinomas: Correlation with predominant histologic subtypes and prognosis, Radiology 295: ((2020) ), 703–712. |
[33] | U. Pastorino, M. Silva, S. Sestini, F. Sabia, M. Boeri, A. Cantarutti, N. Sverzellati, G. Sozzi, G. Corrao and A. Marchianò, Prolonged lung cancer screening reduced 10-year mortality in the MILD trial: New confirmation of lung cancer screening efficacy, Ann Oncol 30: ((2019) ), 1162–1169. |
[34] | E.F. Patz, Jr, P. Pinsky and B.S. Kramer, Estimating Overdiagnosis in Lung Cancer Screening – ReplyLetters, JAMA Internal Medicine 174: ((2014) ), 1198–1199. |
[35] | E.F. Patz, Jr, P. Pinsky, C. Gatsonis, J.D. Sicks, B.S. Kramer, M.C. Tammemägi, C. Chiles, W.C. Black and D.R. Aberle, Overdiagnosis in low-dose computed tomography screening for lung cancer, JAMA Intern Med 174: ((2014) ), 269–274. |
[36] | J.H. Pedersen, H. Ashraf, A. Dirksen, K. Bach, H. Hansen, P. Toennesen, H. Thorsen, J. Brodersen, B.G. Skov, M. Døssing, J. Mortensen, K. Richter, P. Clementsen and N. Seersholm, The Danish randomized lung cancer CT screening trial-overall design and results of the prevalence round, J Thorac Oncol 4: ((2009) ), 608–614. |
[37] | J. Pérez-Morales, I. Tunali, O. Stringfield, S.A. Eschrich, Y. Balagurunathan, R.J. Gillies and M.B. Schabath, Peritumoral and intratumoral radiomic features predict survival outcomes among patients diagnosed in lung cancer screening, Sci Rep 10: ((2020) ), 10528. |
[38] | M.B. Schabath, P.P. Massion, Z.J. Thompson, S.A. Eschrich, Y. Balagurunathan, D. Goldof, D.R. Aberle and R.J. Gillies, Differences in Patient Outcomes of Prevalence, Interval, and Screen-Detected Lung Cancers in the CT Arm of the National Lung Screening Trial, PLoS One 11: ((2016) ), e0159880. |
[39] | M.B. Schabath, E.A. Welsh, W.J. Fulp, L. Chen, J.K. Teer, Z.J. Thompson, B.E. Engel, M. Xie, A.E. Berglund, B.C. Creelan, S.J. Antonia, J.E. Gray, S.A. Eschrich, D.T. Chen, W.D. Cress, E.B. Haura and A.A. Beg, Differential association of STK11 and TP53 with KRAS mutation-associated gene expression, proliferation and immune surveillance in lung adenocarcinoma, Oncogene 35: ((2016) ), 3209–3216. |
[40] | Y. Setojima, Y. Shimada, T. Tanaka, S. Shigefuku, Y. Makino, S. Maehara, M. Hagiwara, R. Masuno, T. Yamada, M. Kakihana, N. Kajiwara, T. Ohira, and N. Ikeda, Prognostic impact of solid-part tumour volume doubling time in patients with radiological part-solid or solid lung cancer, Eur J Cardiothorac Surg 57: ((2020) ), 763–770. |
[41] | S. Sone, T. Nakayama, T. Honda, K. Tsushima, F. Li, M. Haniuda, Y. Takahashi, T. Suzuki, T. Yamanda, R. Kondo, T. Hanaoka, F. Takayama, K. Kubo and H. Fushimi, Long-term follow-up study of a population-based 1996–1998 mass screening programme for lung cancer using mobile low-dose spiral computed tomography, Lung Cancer 58: ((2007) ), 329–341. |
[42] | S. Srivastava, E.J. Koay, A.D. Borowsky, A.M. De Marzo, S. Ghosh, P.D. Wagner and B.S. Kramer, Cancer overdiagnosis: A biological challenge and clinical dilemma, Nat Rev Cancer 19: ((2019) ), 349–358. |
[43] | K. Ten Haaf and H.J. de Koning, Overdiagnosis in lung cancer screening: Why modelling is essential, J Epidemiol Community Health 69: ((2015) ), 1035–1039. |
[44] | K. Ten Haaf, J. Jeon, M.C. Tammemägi, S.S. Han, C.Y. Kong, S.K. Plevritis, E.J. Feuer, H.J. de Koning, E.W. Steyerberg and R. Meza, Risk prediction models for selection of lung cancer screening candidates: A retrospective validation study, PLoS Med 14: ((2017) ), e1002277. |
[45] | R. Thawani, M. McLane, N. Beig, S. Ghose, P. Prasanna, V. Velcheti and A. Madabhushi, Radiomics and radiogenomics in lung cancer: A review for the clinician, Lung Cancer 115: ((2018) ), 34–41. |
[46] | M. Treskova, I. Aumann, H. Golpon, J. Vogel-Claussen, T. Welte and A. Kuhlmann, Trade-off between benefits, harms and economic efficiency of low-dose CT lung cancer screening: A microsimulation analysis of nodule management strategies in a population-based setting, BMC medicine 15: ((2017) ), 162–162. |
[47] | I. Tunali, R.J. Gillies and M.B. Schabath, Application of radiomics and artificial intelligence for lung cancer precision medicine, Cold Spring Harb Perspect Med ((2021) ). |
[48] | I. Tunali, L.O. Hall, S. Napel, D. Cherezov, A. Guvenis, R.J. Gillies and M.B. Schabath, Stability and reproducibility of computed tomography radiomic features extracted from peritumoral regions of lung cancer lesions, Med Phys 46: ((2019) ), 5075–5085. |
[49] | K. Usuda, Y. Saito, M. Sagawa, M. Sato, K. Kanma, S. Takahashi, C. Endo, Y. Chen, A. Sakurada and S. Fujimura, Tumor doubling time and prognostic assessment of patients with primary lung cancer, Cancer 74: ((1994) ), 2239–2244. |
[50] | R.J. van Klaveren, M. Oudkerk, M. Prokop, E.T. Scholten, K. Nackaerts, R. Vernhout, C.A. van Iersel, K.A. van den Bergh, S. van ’t Westeinde, C. van der Aalst, E. Thunnissen, D.M. Xu, Y. Wang, Y. Zhao, H.A. Gietema, B.J. de Hoop, H.J. Groen, G.H. de Bock, P. van Ooijen, C. Weenink, J. Verschakelen, J.W. Lammers, W. Timens, D. Willebrand, A. Vink, W. Mali and H.J. de Koning, Management of lung nodules detected by volume CT scanning, N Engl J Med 361: ((2009) ), 2221–2229. |
[51] | G. Veronesi, P. Maisonneuve, M. Bellomi, C. Rampinelli, I. Durli, R. Bertolotti and L. Spaggiari, Estimating overdiagnosis in low-dose computed tomography screening for lung cancer: A cohort study, Ann Intern Med 157: ((2012) ), 776–784. |
[52] | H.G. Welch and W.C. Black, Overdiagnosis in cancer, J Natl Cancer Inst 102: ((2010) ), 605–613. |
[53] | D.F. Yankelevitz and C.I. Henschke, Does 2-year stability imply that pulmonary nodules are benign? AJR Am J Roentgenol 168: ((1997) ), 325–328. |
[54] | L. Zhang, Y. Liao and L. Tang, MicroRNA-34 family: A potential tumor suppressor and therapeutic candidate in cancer, J Exp Clin Cancer Res 38: ((2019) ), 53. |
[55] | K. Zhao, J. Cheng, B. Chen, Q. Liu, D. Xu and Y. Zhang, Circulating microRNA-34 family low expression correlates with poor prognosis in patients with non-small cell lung cancer, Journal of Thoracic Disease 9: ((2017) ), 3735–3746. |
[56] | A. Zwanenburg, M. Vallières, M.A. Abdalah, H.J.W.L. Aerts, V. Andrearczyk, A. Apte, S. Ashrafinia, S. Bakas, R.J. Beukinga, R. Boellaard, M. Bogowicz, L. Boldrini, I. Buvat, G.J.R. Cook, C. Davatzikos, A. Depeursinge, M.-C. Desseroit, N. Dinapoli, C.V. Dinh, S. Echegaray, I. El Naqa, A.Y. Fedorov, R. Gatta, R.J. Gillies, V. Goh, M. Götz, M. Guckenberger, S.M. Ha, M. Hatt, F. Isensee, P. Lambin, S. Leger, R.T.H. Leijenaar, J. Lenkowicz, F. Lippert, A. Losnegård, K.H. Maier-Hein, O. Morin, H. Müller, S. Napel, C. Nioche, F. Orlhac, S. Pati, E.A.G. Pfaehler, A. Rahmim, A.U.K. Rao, J. Scherer, M.M. Siddique, N.M. Sijtsema, J. Socarras Fernandez, E. Spezi, R.J.H.M. Steenbakkers, S. Tanadini-Lang, D. Thorwarth, E.G.C. Troost, T. Upadhaya, V. Valentini, L.V. van Dijk, J. van Griethuysen, F.H.P. van Velden, P. Whybra, C. Richter and S. Löck, The image biomarker standardization initiative: Standardized quantitative radiomics for high-throughput image-based phenotyping, Radiology 295: ((2020) ), 328–338. |

