
miRNAs expression pattern and machine learning models elucidate risk for gastric GIST
Abstract
BACKGROUND:
Gatrointestinal stromal tumors (GISTs) are the main mesenchymal tumors found in the gastrointestinal system. GISTs clinical phenotypes differ significantly and their molecular basis is not yet completely known. microRNAs (miRNAs) have been involved in carcinogenesis pathways by regulating gene expression at post-transcriptional level.
OBJECTIVE:
The aim of the present study was to elucidate the expression profiles of miRNAs relevant to gastric GIST carcinogenesis, and to identify miRNA signatures that can discriminate the GIST from normal cases.
METHODS:
miRNA expression was tested by miScript™miRNA PCR Array Human Cancer PathwayFinder kit and then we used machine learning in order to find a miRNA profile that can predict the risk for GIST development.
RESULTS:
A number of miRNAs were found to be differentially expressed in GIST cases compared to healthy controls. Among them the hsa-miR-218-5p was found to be the best predictor for GIST development in our cohort. Additionally, hsa-miR-146a-5p, hsa-miR-222-3p, and hsa-miR-126-3p exhibit significantly lower expression in GIST cases compared to controls and were among the top predictors in all our predictive models.
CONCLUSIONS:
A machine learning classification approach may be accurate in determining the risk for GIST development in patients. Our findings indicate that a small number of miRNAs, with hsa-miR218-5p as a focus, may strongly affect the prognosis of GISTs.
Table 1
Clinical and histopathological characteristics of GIST cases
| Characteristics |
| % | Characteristics |
| % |
|---|---|---|---|---|---|
| Gender | Ckit | ||||
| Male | 14 | 70 | Negative | 4 | 20 |
| Female | 6 | 30 | Positive | 16 | 80 |
| Clinic | Cd34 | ||||
| University | 17 | 85 | Negative | 5 | 25 |
| NHS | 3 | 15 | Positive | 15 | 75 |
| Location | Dog1 | ||||
| Stomach | 20 | 100 | Negative | 2 | 10 |
| Other | 0 | 0 | Positive | 18 | 90 |
| Grade | Subtype | ||||
| Very low | 2 | 10 | Spindle cell | 9 | 45 |
| Low | 7 | 35 | Epithilioid | 2 | 10 |
| Mild | 2 | 10 | Mixed | 9 | 45 |
| High | 9 | 45 | Mitotic index (mitosis per 50HPF) | ||
| Surgical margins | | 10 | 50 | ||
| Evolved | No | 5–10 | 5 | 25 | |
| Free | Yes | | 5 | 25 | |
| Dimensions | |||||
| Tumor necrosis | | 6 | 30 | ||
| Yes | 10 | 50 | 2–5 | 4 | 20 |
| No | 10 | 50 | 5–10 | 7 | 35 |
| | 3 | 15 |
1.Introduction
Gastrointestinal stromal tumours (GISTs) are some of the most frequent mesenchymal tumours of the gastrointestinal tract. The major initial event in GIST pathogenesis is linked with gain-of-function mutations of the receptor tyrosine kinase genes (KIT) or that of the platelet-derived growth factor gene (PDGFRA) [1]. GISTs may be developed in any part of the gastrointestinal tract, but are mainly found in the stomach [2]. These tumours present asymptomatically in 18% of cases, especially as small tumours (
Recently non-coding RNAs have been studied for their involvement in post-transcriptional regulation of gene expression and have attracted scientific interest for the identification of their role in carcinogenesis. Among them it has been suggested that micro-RNA (miRNA) expression is related to carcinogenesis and the phenotypic expression of several tumors including GISTs [8]. Regarding the latter, specific miRNA expression profiles are associated with chromosome 14q loss [9, 10], GISTs anatomical site [11], KIT and/or PDGFRA mutation [10], GIST development risk [9] and overall survival [11]. Additionally, expression of specific miRNAs is related to imatinib resistance in GIST [12, 13]. Thus, a number of studies support that miRNAs can be used as diagnostic, prognostic and/or predictive biomarkers or have therapeutic potential and this increasing recognition on their role in GISTs opens the way for additional studies in the field that could improve the clinical practice. In the present work we study the expression profiles of miRNAs relevant to carcinogenesis, in a cohort study of 20 patients with stomach GIST and we employ machine learning approaches to help us not only understand the clinical features of GIST, but also to evaluate this approach for future personalized medicine applications.
2.Material and methods
2.1Patients and tissue samples
Tissue from twenty gastric GISTs and twenty healthy gastric biopsies were included in the study. All tumors were sporadic, as assessed by personal and family histories. The criteria used to collect the samples were: 1) only gastric GISTs included in the study, 2) all the neoplasms were primary tumors and resectable according to the preoperative evaluation, and 3) no neoadjuvant therapy had been performed. Healthy gastric biopsies were received from patients suspected of non-malignant diseases (i.e. gastritis). All cases were identified in the 1st Propaedeutic Department of Surgery of Hippocration General Hospital, National and Kapodistrian University of Athens between March 2015 and November 2018. Authorization for the use of these tissues for research purposes was obtained from the Hospital Review Board and all the samples were obtained with informed consent from the participants. The clinical and histopathological details of all cases are presented in Table 1.
2.2MiRNA expression
MiRNA isolation was performed using the NucleoSpin miRNA kit (Machnery-Nagel, Germany). Reverse transcription of 500 ng of RNA was performed with the miScript II RT Kit (Qiagen), and the expression of a panel which tests for 84 miRNAs, was performed using the miScript™miRNA PCR Array Human Cancer PathwayFinder (MIHS-102Z, Qiagen) and miScript SYBR Green PCR Kit (Qiagen). This panel includes miRNAs that have been correlated with the diagnosis, staging, progression, or prognosis of various tumors. Each array contains six different snoRNA/snRNA as a normalization control for the array data (SNORD61, SNORD68, SNORD72, SNORD95, SNORD96A, RNU6-6P), miRNA reverse transcription control (RTC) and positive PCR control (PPC). Samples were grouped into two categories: Normal and Cancer. The miRNA relative expression was calculated by the 2
2.3Machine learning modeling approach
To further assess the value of our expression results and refine it by identifying the most important miRNAs, which might be able to distinguish between our groups, we employed several classification and regression models using the caret package [14] in R [15] on the entire miRNA panel regardless of previous differential expression results. This allowed for wider approach which didn’t preclude several features (miRNAs). We used the previously calculated relative expression per miRNA per sample, after preprocessing with “scale” and “center”, to train and validate the accuracy of six models using the appropriate algorithms: two Classification And Regression Trees (rpart2 and bagtree), one Random Forest implementations (ranger), a k-Nearest Neighbors (knn), a Support Vector Machine (svm) and a C5.0 classification tree (C5.0). All training models used a leave-group-out cross-validation (LGOCV) approach with a 70%–30% partitioning and 100 iterations. Because of the large differences of the number and identity of predictors each model used, we also employed a Recursive Feature Extraction method to identify the best set of predictor miRNAs [16, 17].
2.4miRNA target identification and functional analysis
miRNA target identification was performed using the multimir R package [18]. Two different sets of gene targets were identified: one based on validated miRNA-target interactions from 3 databases (“mirecords” [19], “mirtarbase” [20], and “tarbase” [21]) and one using predicted miRNA-target interactions from 8 databases (“diana_microt”, “elmmo”, “microcosm”, “miranda”, “mirdb”, “pictar”, “pita”, and “targetscan”) [22]. Both gene lists were used as input to the clusterprofiler package [23] to be enriched using Gene Ontology [24] terms (both from GO-Biological Process and GO-Molecular Function). We also validated the target genes using Disease Ontology [25] and the DisGeNet database [26] for their associations with specific phenotypes (e.g. neoplasms). The
3.Results
3.1Differential MiRNA expression
The analysis of the two sample groups (Normal and Cancer) showed, in total, 56 differentially expressed miRNAs with a
Table 2
Differentially expressed miRNAs in GIST. Fold regulation is based on the 2
| miRNA | miRNA family | Fold regulation | FDR | |
|---|---|---|---|---|
| hsa-miR-196a-5p | mir-196 | 24.61 | 0.00163 | 0.005995 |
| hsa-miR-148a-3p | mir-148 | 11.84 | 0.00461 | 0.007874 |
| hsa-miR-125a-5p | mir-10 | 10.94 | 0.00394 | 0.007874 |
| hsa-miR-7-5p | mir-7 | 0.01173 | 0.012632 | |
| hsa-miR-181c-5p | mir-181 | 0.02348 | 0.02348 | |
| hsa-miR-372-3p | mir-290 | 0.00726 | 0.009423 | |
| hsa-miR-19a-3p | mir-19 | 0.00655 | 0.009226 | |
| hsa-miR-15a-5p | mir-15 | 0.00822 | 0.00959 | |
| hsa-miR-127-5p | mir-127 | 0.01100 | 0.012078 | |
| hsa-miR-181d-5p | mir-181 | 0.00484 | 0.007972 | |
| hsa-miR-133b | mir-133 | 0.00752 | 0.009423 | |
| hsa-miR-122-5p | mir-122 | 0.00749 | 0.009423 | |
| hsa-miR-214-3p | mir-214 | 0.00067 | 0.005995 | |
| hsa-miR-184 | mir-184 | 0.00133 | 0.005995 | |
| hsa-miR-378a-3p | mir-378 | 0.00095 | 0.005995 | |
| hsa-miR-10a-5p | mir-10 | 0.00299 | 0.007163 | |
| hsa-miR-301a-3p | mir-130 | 0.00937 | 0.010709 | |
| hsa-miR-150-5p | mir-150 | 0.00563 | 0.008627 | |
| hsa-let-7a-5p | let-7 | 0.00659 | 0.009226 | |
| hsa-miR-132-3p | mir-132 | 0.00570 | 0.008627 | |
| hsa-miR-16-5p | mir-15 | 0.01926 | 0.01961 | |
| hsa-miR-191-5p | mir-191 | 0.00276 | 0.007025 | |
| hsa-miR-373-3p | mir-373 | 0.00143 | 0.005995 | |
| hsa-miR-215-5p | mir-192 | 0.00264 | 0.007025 | |
| hsa-miR-32-5p | mir-32 | 0.00447 | 0.007874 | |
| hsa-miR-135b-5p | mir-135 | 0.00377 | 0.007874 | |
| hsa-miR-21-5p | mir-21 | 0.01480 | 0.015638 | |
| hsa-miR-1-3p | mir-1 | 0.00394 | 0.007874 | |
| hsa-miR-29b-3p | mir-29 | 0.00069 | 0.005995 | |
| hsa-miR-100-5p | mir-10 | 0.00047 | 0.005995 | |
| hsa-miR-23b-3p | mir-23 | 0.00178 | 0.005995 | |
| hsa-miR-142-5p | mir-142 | 0.00811 | 0.00959 | |
| hsa-miR-27a-3p | mir-27 | 0.00451 | 0.007874 | |
| hsa-miR-335-5p | mir-335 | 0.00214 | 0.006658 | |
| hsa-miR-200c-3p | mir-8 | 0.00522 | 0.008352 | |
| hsa-miR-20b-5p | mir-17 | 0.00070 | 0.005995 | |
| hsa-miR-155-5p | mir-155 | 0.01092 | 0.012078 | |
| hsa-miR-27b-3p | mir-27 | 0.00696 | 0.009423 | |
| hsa-miR-96-5p | mir-96 | 0.00149 | 0.005995 | |
| hsa-miR-181b-5p | mir-181 | 0.00464 | 0.007874 | |
| hsa-miR-20a-5p | mir-17 | 0.00182 | 0.005995 | |
| hsa-miR-17-5p | mir-17 | 0.00774 | 0.009423 | |
| hsa-miR-149-5p | mir-149 | 0.00155 | 0.005995 | |
| hsa-miR-18a-5p | mir-17 | 0.00273 | 0.007025 | |
| hsa-miR-128-3p | mir-128 | 0.00251 | 0.007025 | |
| hsa-miR-193b-3p | mir-193 | 0.00760 | 0.009423 | |
| hsa-miR-205-5p | mir-205 | 0.00376 | 0.007874 | |
| hsa-let-7c-5p | let-7 | 0.00048 | 0.005995 | |
| hsa-miR-134-5p | mir-134 | 0.00179 | 0.005995 | |
| hsa-miR-25-3p | mir-25 | 0.00592 | 0.008724 | |
| hsa-miR-148b-3p | mir-148 | 0.00307 | 0.007163 | |
| hsa-let-7f-5p | let-7 | 0.01581 | 0.016396 | |
| hsa-miR-126-3p | mir-126 | 0.00075 | 0.005995 | |
| hsa-miR-222-3p | mir-221 | 0.00451 | 0.007874 | |
| hsa-miR-146a-5p | mir-146 | 0.00121 | 0.005995 | |
| hsa-miR-218-5p | mir-218 | 0.00078 | 0.005995 |
Figure 1.
Volcano plot of all 84 miRNAs in our assay. Red dots represent miRNAs with a
Figure 2.
Overall Accuracy and Kappa for the seven models trained and validated on our miRNA dataset.
Figure 3.
Top 20 predictors for each model ranked by importance.
Figure 4.
Validation of the miRNA predictors using Disease Ontology and the DisGeNet database. Lists of validated and predicted target interactions were used and the top 30 results are represented ranked by adjusted
3.2Machine learning models
As described in our methodology, we trained and validated seven classification models on the normalized miRNA expression data. For each one the mean Accuracy and Kappa was calculated along with their percent of false negative hits. The Random Forest (rforest), Classification And Regression Trees (rpart) and Bootstrap Aggregating of Classification And Regression Trees (CARTbag) models performed similarly having mean accuracies of 99.58%, 99.5% and 9933% respectively. These were followed by the C5.0 (C50), k-nearest neighbors (KNN), and support vector machine (SVM) models which had mean accuracies of 95.91%, 89.58%, and 86.67% respectively. All models were applied without individual tuning, which might increase their performance. Figure 2 shows the total Accuracy and Kappa for each model. What was more important for us, was to see which miRNAs each model picked as predictors for distinguishing sample groups. Figure 3 shows the top 20 preferred predictors (miRNAs which can predict if a sample belongs to the normal or GIST group) along with their percent importance for each model. Unfortunately the models could provide a consensus only on hsa-mir-218-5p and most of them agreed on some subsets. For example the C5.0 model only accounted for hsa-mir-218-5p as the sole predictor. For this reason we applied a Recursive Feature Extraction (RFE) algorithm to identify a subset of our miRNAs which can best explain our sample groupings. The RFE algorithm reported 100% accuracy and Kappa when using groupings of 1, 4, 5, 6, 9 and 10 miRNAs. We wanted our downstream analysis to be as broad as possible, so we selected the grouping of ten miRNAs which included hsa-miR-218-5p, hsa-miR-222-3p, hsa-miR-196a-5p, hsa-let-7c-5p, hsa-miR-125a-5p, hsa-miR-126-3p, hsa-miR-146a-5p, hsa-miR-149-5p, hsa-miR-30c-5p, and hsa-miR-148a-3p.
Figure 5.
Biological background for the targets of our miRNA predictors. The validated targets of the miRNAs were used for enrichemnt in GO-BP and GO-MF. Top 30 results are shown ranked by adjusted
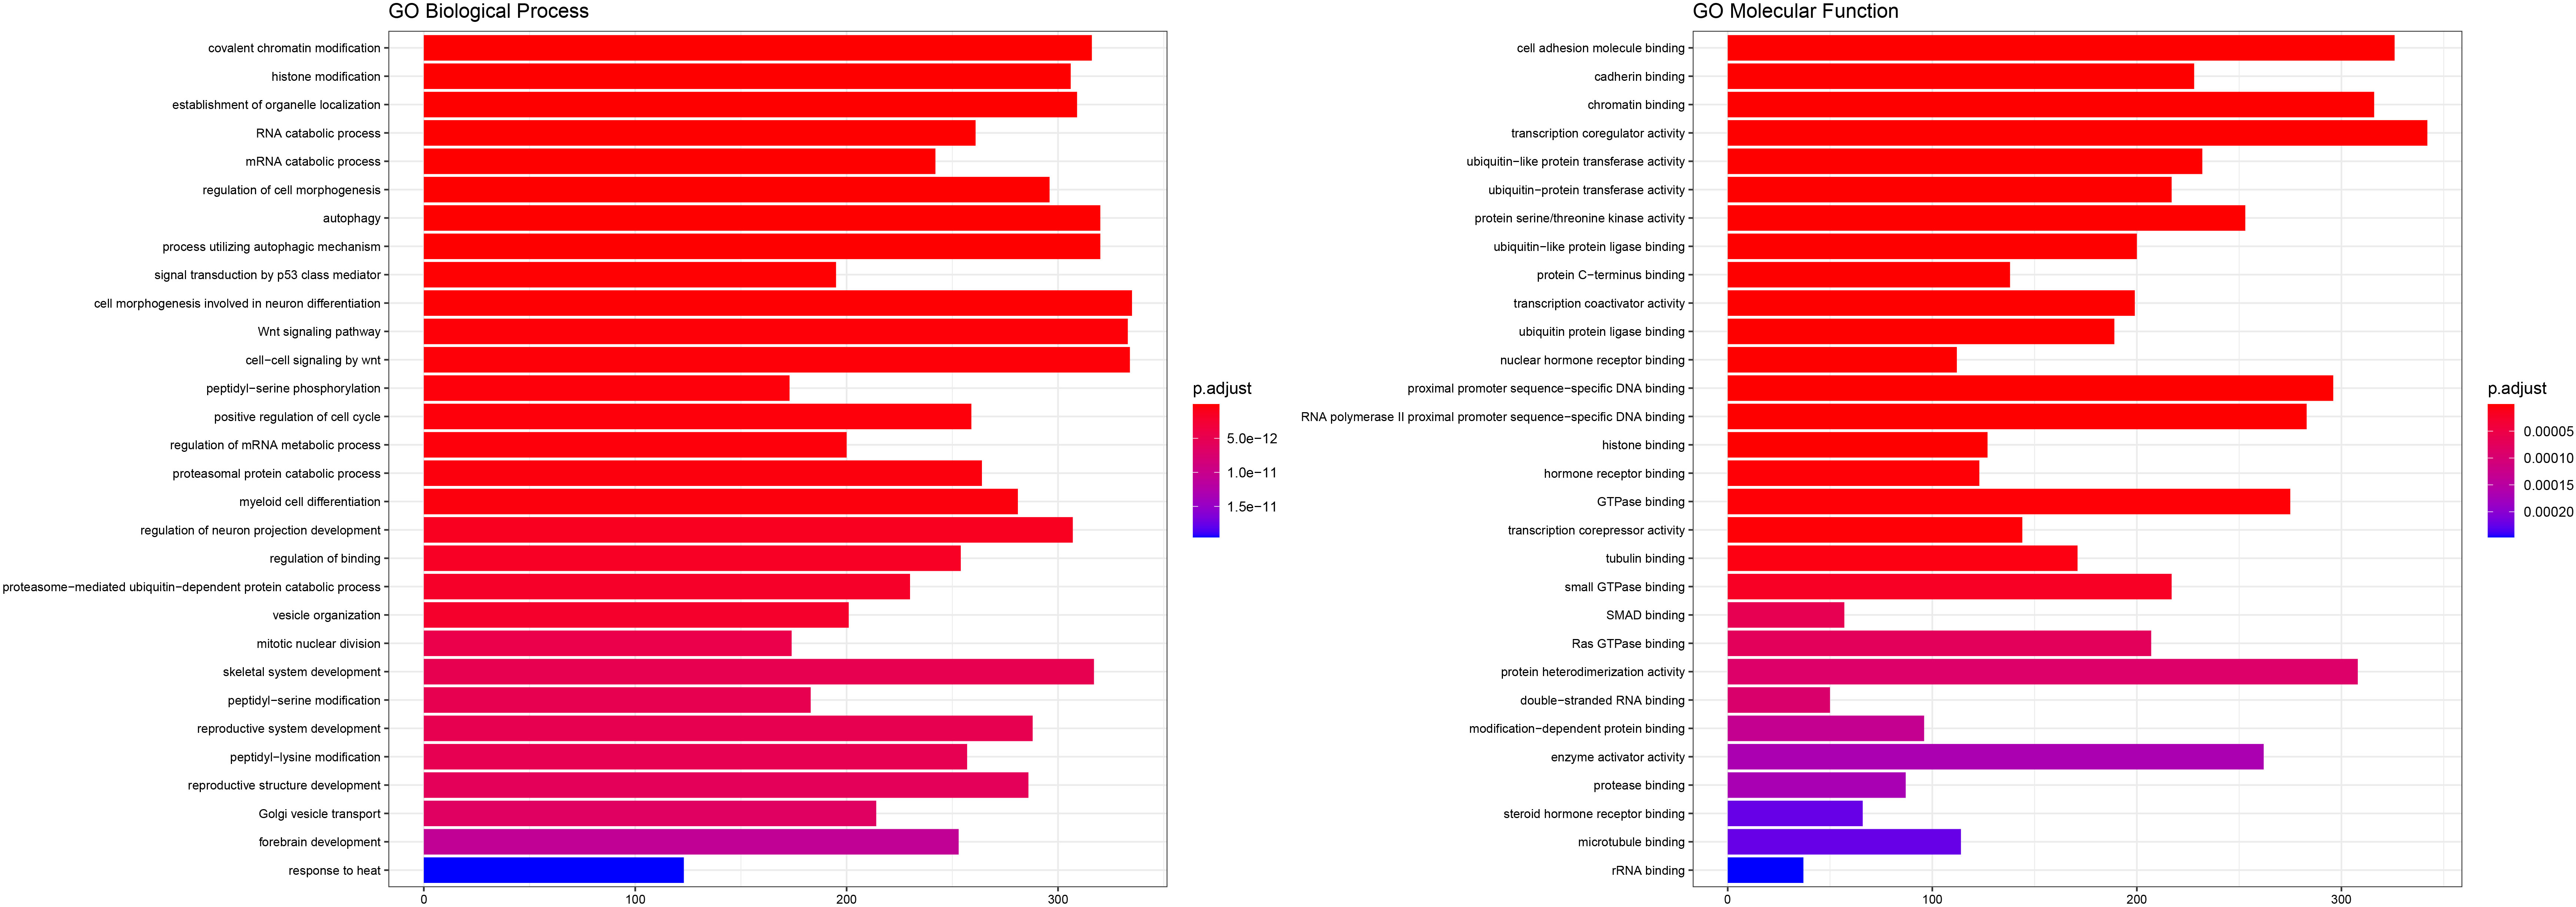
3.3miRNA target identification and functional analysis
Using the 10 miRNAs previously identified we performed a miRNA-target analysis using databases which provide both validated and predicted interactions. The validated results included 21,648 miRNA-gene interactions, whereas, the predicted results were 34710 (
4.Discussion
Several studies have identified the differential expression of miRNAs in GISTs and have shown clearly different miRNA profiles between GIST and non-cancerous tissues. In the present study, in addition to studying the expression of 84 miRNAs involved in the carcinogenesis of gastric GIST, we also utilized a machine learning in order to find a miRNA profile that can predict the risk for GIST development. Most of the miRNAs that we found to be differentially expressed in our samples have been previously shown to be associated with GIST [11, 27, 28, 29, 30] In agreement with previous studies hsa-miR-196a-5p, hsamiR-148a-3p and hsamiR-125a-5p were found to be significantly upregulated in our cohort, whereas hsamiR- let-7f-5p, hsamiR-126-3p, hsa-miR-222-3p, hsa-miR-146a-5p, hsa-miR-218-5p among others were found to be significantly downregulated [11, 28, 29, 30, 31, 32]. It is important to note that these miRNAs directly target fundamental genes in GIST pathogenesis like KIT/AKT, PDGFRA pathways, and have also been found as crucial carcinogenesis mediators in other gastrointestinal cancers such as gastric cancer [30, 33, 34].
The miRNAs that were differentially expressed were used to construct a machine learning classifier approach to pinpoint the miRNAs that could be independently related to GIST risk prognosis. All the risk models we used based on miRNA expression, seem to have a high accuracy for GIST risk prediction. Hsa-miR-218-5p was found to be the best predictor for GIST development in our cohort. Hsa-miR-218-5p serves as tumor suppressor in numerous cancer types. Its role in GIST has been reported in a few studies. Fan et al. [30] in agreement with our findings, reported that the expressions of miR-218 in tumor tissue and GIST cell lines were significantly decreased compared to the normal GISTadjacent tissue, and found that miR-218 can negatively control the expression of the KIT protein and inhibit the proliferation and invasion of GIST cells. Additionally it has been suggested that miR-218 increases the sensitivity of GIST to imatinib and more specifically that the expression of miR-218 is down-regulated in an imatinib mesylate-resistant GIST cell line (GIST430), while miR-218 over-expression can enhance the sensitivity of GIST cells to imatinib mesylate [35].
Hsa-miR-146a-5p, hsa-miR-222-3p, and hsa-miR-126-3p exhibit significantly lower expression levels in GIST cases compared to controls in our study and were among the top predictors in all of our models. The role of hsa-miR-146a-5p has not yet been investigated in GIST cases, but it is known that it acts as a tumor suppressor miRNA in some cancers (ie non-small cell lung cancer, esophageal squamous cell cancer, pancreatic cancer), and as an oncogenic miRNA in others (i.e. bladder cancer, cervical cancer, melanoma) [36]. Although, In a number of neoplasms, controversial results have been produced; for example, in gastric cancer there is evidence indicating a tumor suppressive role for miR-146a, but several studies have provided support for the opposite [37, 38]. Regarding hsa-miR-222-3p, in agreement with our results, it has been found reduced in most GISTs, in contrast to other tumors [39], however the functional role of this downregulation is not fully understood. Ihle et al. suggested that miR-222 downregulation induces apoptosis in vitro by a signaling cascade involving KIT, AKT and BCL2, and this miRNA appears to functionally counteract oncogenic signaling pathways in GIST [40]. Hsa-miR-126-3p has not been extensively studied in GISTs but Choi et al. reported that it was down-regulated in high risk GISTs and is implicated in cell cycle arrest, cell growth and death [9]. Also, in other cancers like non-small-cell lung cancer (NSCLC), hepatocellular carcinoma (HCC), cholangiocarcinoma (CCA) miR-126-3p’s expression in tumor tissues was also decreased [41]. Our results demonstrate that the previously mentioned miRNA signatures can be predictive indicators for GIST development.
The analysis of the miRNA-target regulatory networks shows mainly the involvement of neoplastic phenotypes and that our miRNA predictors are directly associated with cancer. The gene ontology analysis was significantly enriched in chromatin remodeling and histone modification, whereas molecular function focused on the regulation of cell adhesion molecules and cadherin binding. Indeed, it is strongly believed that epigenetic phenomena including chromatin modifications underlie GIST tumorigenesis and influence the clinical course and response to treatment [42]. Additionally, cell adhesion molecules like L1 cell adhesion molecule (CD171) overexpression predicts poor prognosis in GISTs [43] and E-cadherin significant under-expression was closely related to metastasis of GISTs [44]. Therefore, the miRNA expression may influence the GIST prognosis via the regulation of important pathways related to carcinogenesis.
Even though we performed comprehensive machine learning and bioinformatics analyses using the miRNA expression profile of GIST and confirmed the classification accuracy by cross-validation, there are some limitations in our study. The sample size was small since we only used gastric GIST in order to have a homogenous population, and our samples were from one surgery clinic. Due to the limited sample availability the study lacks validation experiments to assess the expression of the predictive miRNAs and the corresponding target genes. Our high accuracy scores are not caused by overfitting but are prone to exaggeration due to cross-validation. This can be amended in future works by using larger datasets that can effectively be partitioned into different training and validations sets. Therefore further studies are needed to support our findings.
In conclusion, a Machine Learning classification approach may be accurate in determining the risk for GIST development in patients. Moreover a small number of miRNAs, with hsa-miR218-5p as a focus, may strongly affect the prognosis of GIST.
Author contributions
IKS, DT and KGT contributed to samples and data collection. IKS, ND and MG carried out the experiments, designed the model and the computational framework and analyzed the data. MG, ND, GZ and KGT wrote the manuscript with input from all authors.
Supplementary data
The supplementary files are available to download from http://dx.doi.org/10.3233/CBM-210173.
Acknowledgments
This study was funded by Scholarship – Grant to Ioannis K. Stefanou by a non-profit organization of Greek Society of Cancer Biomarkers and Targeted Therapy.
References
[1] | C.L. Corless, J.A. Fletcher and M.C. Heinrich, Biology of gastrointestinal stromal tumors, Journal of Clinical Oncology 22: ((2004) ), 3813–3825. |
[2] | M. Miettinen, L.H. Sobin and J. Lasota, Gastrointestinal stromal tumors of the stomach: A clinicopathologic, immunohistochemical, and molecular genetic study of 1765 cases with long-term follow-up, The American Journal of Surgical Pathology 29: ((2005) ), 52–68. |
[3] | M. Yacob, S. Inian and C.B. Sudhakar, Gastrointestinal stromal tumours: review of 150 cases from a single centre, Indian Journal of Surgery 77: ((2015) ), 505–510. |
[4] | U.I. Chaudhry and R.P. DeMatteo, Management of resectable gastrointestinal stromal tumor, Hematology/Oncology Clinics of North America 23: ((2009) ), 79–96. |
[5] | C.R. Antonescu, A. Viale, L. Sarran, S.J. Tschernyavsky, M. Gonen, N.H. Segal, R.G. Maki, N.D. Socci, R.P. DeMatteo and P. Besmer, Gene expression in gastrointestinal stromal tumors is distinguished by KIT genotype and anatomic site, Clinical Cancer Research 10: ((2004) ), 3282–3290. |
[6] | K. Shah, K. Chan and Y. Ko, A systematic review and network meta-analysis of post-imatinib therapy in advanced gastrointestinal stromal tumour, Current Oncology 24: ((2017) ), e531. |
[7] | S. Farag, M.J. Smith, N. Fotiadis, A. Constantinidou and R.L. Jones, Revolutions in treatment options in gastrointestinal stromal tumours (GISTs): The latest updates: Revolutions in treatment options in GIST, Current Treatment Options in Oncology 21: ((2020) ), 1–11. |
[8] | I.K. Stefanou, M. Gazouli, G.C. Zografos and K.G. Toutouzas, Role of non-coding RNAs in pathogenesis of gastrointestinal stromal tumors, World Journal of Meta-Analysis 8: ((2020) ), 233–244. |
[9] | H.J. Choi, H. Lee, H. Kim, J.E. Kwon, H.J. Kang, K.T. You, H. Rhee, S.H. Noh, Y.K. Paik and W.J. Hyung, MicroRNA expression profile of gastrointestinal stromal tumors is distinguished by 14q loss and anatomic site, International Journal of Cancer 126: ((2010) ), 1640–1650. |
[10] | F. Haller, A. Von Heydebreck, J.D. Zhang, B. Gunawan, C. Langer, G. Ramadori, S. Wiemann and Ö. Sahin, Localization-and mutation-dependent microRNA (miRNA) expression signatures in gastrointestinal stromal tumours (GISTs), with a cluster of co-expressed miRNAs located at 14q32. 31, The Journal of Pathology: A Journal of the Pathological Society of Great Britain and Ireland 220: ((2010) ), 71–86. |
[11] | T. Niinuma, H. Suzuki, M. Nojima, K. Nosho, H. Yamamoto, H. Takamaru, E. Yamamoto, R. Maruyama, T. Nobuoka and Y. Miyazaki, Upregulation of miR-196a and HOTAIR drive malignant character in gastrointestinal stromal tumors, Cancer Research 72: ((2012) ), 1126–1136. |
[12] | A. Amirnasr, S. Sleijfer and E.A. Wiemer, Non-Coding RNAs, a novel paradigm for the management of gastrointestinal stromal tumors, International Journal of Molecular Sciences 21: ((2020) ), 6975. |
[13] | Z. Zhang, N. Jiang, R. Guan, Y. Zhu, F. Jiang and D. Piao, Identification of critical microRNAs in gastrointestinal stromal tumor patients treated with Imatinib, Neoplasma 65: ((2018) ), 683–692. |
[14] | M. Kuhn, Building predictive models in R using the caret package, J Stat Softw 28: ((2008) ), 1–26. |
[15] | R. Ihaka and R. Gentleman, R: a language for data analysis and graphics, Journal of Computational and Graphical Statistics 5: ((1996) ), 299–314. |
[16] | J. Dong and M. Xu, A 19-miRNA Support Vector Machine classifier and a 6-miRNA risk score system designed for ovarian cancer patients Corrigendum in/10.3892/or. 2019.7385, Oncology Reports 41: ((2019) ), 3233–3243. |
[17] | A. Adorada, R. Permatasari, P.W. Wirawan, A. Wibowo and A. Sujiwo, Support vector machine-recursive feature elimination (svm-rfe) for selection of microrna expression features of breast cancer, in: 2018 2nd International Conference on Informatics and Computational Sciences (ICICoS), IEEE, (2018) , pp. 1–4. |
[18] | Y. Ru, K.J. Kechris, B. Tabakoff, P. Hoffman, R.A. Radcliffe, R. Bowler, S. Mahaffey, S. Rossi, G.A. Calin and L. Bemis, The multiMiR R package and database: integration of microRNA-target interactions along with their disease and drug associations, Nucleic Acids Research 42: ((2014) ), e133–e133. |
[19] | F. Xiao, Z. Zuo, G. Cai, S. Kang, X. Gao and T. Li, miRecords: an integrated resource for microRNA-target interactions, Nucleic Acids Research 37: ((2009) ), D105–D110. |
[20] | H.-Y. Huang, Y.-C.-D. Lin, J. Li, K.-Y. Huang, S. Shrestha, H.-C. Hong, Y. Tang, Y.-G. Chen, C.-N. Jin and Y. Yu, miRTarBase 2020: Updates to the experimentally validated microRNA-target interaction database, Nucleic Acids Research 48: ((2020) ), D148–D154. |
[21] | M.D. Paraskevopoulou, I.S. Vlachos and A.G. Hatzigeorgiou, DIANA-TarBase and DIANA suite tools: studying experimentally supported microRNA targets, Current Protocols in Bioinformatics 55: ((2016) ), 1214.1–12.14.18. |
[22] | Á.L. Riffo-Campos, I. Riquelme and P. Brebi-Mieville, Tools for sequence-based miRNA target prediction: what to choose? International Journal of Molecular Sciences 17: ((2016) ), 1987. |
[23] | G. Yu, L.-G. Wang, Y. Han and Q.-Y. He, clusterProfiler: an R package for comparing biological themes among gene clusters, Omics: A Journal of Integrative Biology 16: ((2012) ), 284–287. |
[24] | M. Ashburner, C.A. Ball, J.A. Blake, D. Botstein, H. Butler, J.M. Cherry, A.P. Davis, K. Dolinski, S.S. Dwight and J.T. Eppig, Gene Ontology: tool for the unification of biology, Nature Genetics 25: ((2000) ), 25–29. |
[25] | S.M. Bello, M. Shimoyama, E. Mitraka, S.J. Laulederkind, C.L. Smith, J.T. Eppig and L.M. Schriml, Disease Ontology: improving and unifying disease annotations across species, Disease Models & Mechanisms 11: ((2018) ). |
[26] | J. Piñero, Á. Bravo, N. Queralt-Rosinach, A. Gutiérrez-Sacristán, J. Deu-Pons, E. Centeno, J. García-García, F. Sanz and L.I. Furlong, DisGeNET: a comprehensive platform integrating information on human disease-associated genes and variants, Nucleic Acids Research ((2016) ), gkw943. |
[27] | U. Gyvyte, S. Juzenas, V. Salteniene, J. Kupcinskas, L. Poskiene, L. Kucinskas, S. Jarmalaite, K. Stuopelyte, R. Steponaitiene and G. Hemmrich-Stanisak, MiRNA profiling of gastrointestinal stromal tumors by next-generation sequencing, Oncotarget 8: ((2017) ), 37225. |
[28] | Y. Wang, J. Li, D. Kuang, X. Wang, Y. Zhu, S. Xu, Y. Chen, H. Cheng, Q. Zhao and Y. Duan, miR-148b-3p functions as a tumor suppressor in GISTs by directly targeting KIT, Cell Communication and Signaling 16: ((2018) ), 1–17. |
[29] | P. Akcakaya, S. Caramuta, J. Åhlen, M. Ghaderi, E. Berglund, A. Östman, R. Bränström, C. Larsson and W. Lui, microRNA expression signatures of gastrointestinal stromal tumours: associations with imatinib resistance and patient outcome, British Journal of Cancer 111: ((2014) ), 2091–2102. |
[30] | R. Fan, J. Zhong, S. Zheng, Z. Wang, Y. Xu, S. Li, J. Zhou and F. Yuan, MicroRNA-218 inhibits gastrointestinal stromal tumor cell and invasion by targeting KIT, Tumor Biology 35: ((2014) ), 4209–4217. |
[31] | J. Kupcinskas, Small molecules in rare tumors: Emerging role of microRNAs in GIST, International Journal of Molecular Sciences 19: ((2018) ), 397. |
[32] | L. Kelly, K. Bryan, S.Y. Kim, K.A. Janeway, J.K. Killian, H.-U. Schildhaus, M. Miettinen, L. Helman, P.S. Meltzer and M. van de Rijn, Post-transcriptional dysregulation by miRNAs is implicated in the pathogenesis of gastrointestinal stromal tumor [GIST], PLoS One 8: ((2013) ), e64102. |
[33] | A. Link and A. Goel, MicroRNA in gastrointestinal cancer: a step closer to reality, Advances in Clinical Chemistry 62: ((2013) ), 221–268. |
[34] | J. Bornschein, M. Leja, J. Kupcinskas, A. Link, J. Weaver, M. Rugge and P. Malfertheiner, Molecular diagnostics in gastric cancer, Front Biosci (Landmark Ed) 19: ((2014) ), 312–338. |
[35] | R. Fan, J. Zhong, S. Zheng, Z. Wang, Y. Xu, S. Li, J. Zhou and F. Yuan, microRNA-218 increase the sensitivity of gastrointestinal stromal tumor to imatinib through PI3K/AKT pathway, Clinical and Experimental Medicine 15: ((2015) ), 137–144. |
[36] | J.R. Iacona and C.S. Lutz, miR-146a-5p: Expression, regulation, and functions in cancer, Wiley Interdisciplinary Reviews: RNA 10: ((2019) ), e1533. |
[37] | Z. Hou, H. Yin, C. Chen, X. Dai, X. Li, B. Liu and X. Fang, microRNA-146a targets the L1 cell adhesion molecule and suppresses the metastatic potential of gastric cancer, Molecular Medicine Reports 6: ((2012) ), 501–506. |
[38] | S.G. Crone, A. Jacobsen, B. Federspiel, L. Bardram, A. Krogh, A.H. Lund and L. Friis-Hansen, microRNA-146a inhibits G protein-coupled receptor-mediated activation of NF-κB by targeting CARD10 and COPS8 in gastric cancer, Molecular Cancer 11: ((2012) ), 1–14. |
[39] | M. Koelz, J. Lense, F. Wrba, M. Scheffler, H.P. Dienes and M. Odenthal, Down-regulation of miR-221 and miR-222 correlates with pronounced Kit expression in gastrointestinal stromal tumors, International Journal of Oncology 38: ((2011) ), 503–511. |
[40] | M.A. Ihle, M. Trautmann, H. Kuenstlinger, S. Huss, C. Heydt, J. Fassunke, E. Wardelmann, S. Bauer, H.-U. Schildhaus and R. Buettner, miRNA-221 and miRNA-222 induce apoptosis via the KIT/AKT signalling pathway in gastrointestinal stromal tumours, Molecular Oncology 9: ((2015) ), 1421–1433. |
[41] | L.P. Spinola, G.F. Vieira, R.F. Ferreira, M.C. Calastri, G.D. Tenani, F.L. Aguiar, I.F.S.F. Boin, L.B. Da Costa, M.F.C. Correia and E.M. Zanovelo, Underexpression of miR-126-3p in Patients with Cholangiocarcinoma, Asian Pacific Journal of Cancer Prevention: APJCP 22: ((2021) ), 573–579. |
[42] | A.D. Sioulas, D. Vasilatou, V. Pappa, G. Dimitriadis and K. Triantafyllou, Epigenetics in gastrointestinal stromal tumors: clinical implications and potential therapeutic perspectives, Digestive Diseases and Sciences 58: ((2013) ), 3094–3102. |
[43] | G.J. Gordon, R. Bueno and D.J. Sugarbaker, Genes associated with prognosis after surgery for malignant pleural mesothelioma promote tumor cell survival in vitro, BMC Cancer 11: ((2011) ), 1–9. |
[44] | J. Ding, Z. Zhang, Y. Pan, G. Liao, L. Zeng and S. Chen, Expression and significance of twist, E-cadherin, and N-cadherin in gastrointestinal stromal tumors, Digestive Diseases and Sciences 57: ((2012) ), 2318–2324. |


