
Re-evaluation of a LEED Platinum Building: Occupant experiences of health and comfort
Abstract
BACKGROUND: There is a need to better understand the perceived experiences of workers in green buildings as the literature to this point has been mixed.
OBJECTIVES: To re-evaluate occupant experiences within a LEED platinum building and investigate current experiences in general.
METHODS: An online post occupancy evaluation (POE) survey of 62 occupants of LEED Platinum building on a US college campus is reported. The online survey addressed indoor environmental quality in relation to health, productivity and satisfaction.
RESULTS: Of the respondents, 38.7% had participated in a prior POE of this building in 2011 and results were compared for this subgroup, as well as for overall results. There was a significant increase in satisfaction with office workstations and air freshness as compared to 3 years earlier. However, there was also a significant increase in reported frequency of all physical symptoms. When looking just at the current POE results, control over features of the workstation had a significant relationship with most outcomes of interest.
CONCLUSION: While improvements have been noted, issues continue to exist that have implications for health, productivity and satisfaction. The results of this study have implications for the ergonomic design of workstations and indoor environmental quality within LEED buildings.
1Introduction
Green buildings have been a topic of interest in the literature for a few years, and several factors have contributed to this ongoing interest. There has been a sharp rise in building projects being certified as green through various agencies such as Leadership in Energy and Environmental Design (LEED) over the past decade and this trend is continuing steadily [1]. There has been recognition that of the three pillars of sustainable development, the main focus in the rating systems thus far has been on the environment and the economics with little attention given to the social (human) dimension [2, 3]. The human factors/ergonomics (HF/E) literature has acknowledged and begun to define the role of HF/E professionals in the area of green ergonomics [4–6]. Numerous studies have investigated the occupant experience within green buildings. While there have been many identified benefits to working in green buildings, there have also been persistent issues that need to be addressed [5, 7–9].
1.1Green Building Certification
In 2000, the United States Green Building Council (USGBC) developed the LEED certification program with the intent of promoting principles of sustainable development [1]. Since that time, LEED has become the industry standard for high-performance green buildings [1]. The current rating system, LEED v4, contains five rating systems for varied project types and reflects five main areas of sustainability: sustainable site design, water quality and conservation, energy and environment, indoor environmental quality (IEQ), and materials and resources [1]. Projects are certified based on the number of points achieved: certified 40–49 points; silver 50–59 points; gold 60–79 points; and platinum 80+ points [1]. One credit can be earned for a comprehensive ergonomics strategy, which is included in the additional “innovation” category [10].
In November 2012, a document containing recertification guidance under Existing Buildings: Operation & Maintenance (EB: O&M) was released, and it was updated in October 2013 [10]. This was considered to be the first step by the USGBC in establishing a clear recertification program to ensure that buildings are performing as intended. Projects initially certified under any version of LEED for existing buildings must recertify at least once every five years to maintain O&M certification. This is an important requirement as it promotes the ongoing maintenance of high performance operations through documenting set “performance requirements” for credit compliance. A sample performance requirement under IEQ: Occupant Comfort- Occupant Survey is “Action: conduct occupant comfort survey at least once every 2 years” (LEED for Existing Buildings: Operations & Maintenance Recertification Guidance document). The recertification process is still unfolding and is a very important aspect of LEED to meet the full intent of sustainable development. It is not enough for buildings to achieve LEED certification- they must continue to be held to standards to ensure they are performing to green standards as designed.
It is of importance to note a new certification system, the WELL Building Standard, which evaluates buildings in regards to human wellness within the built environment [11]. The certification system works in alignment with LEED and other global programs and has ongoing recertification requirements, and it incorporates an ergonomics requirement [11]. There are 7 rating categories, with the “comfort” category directly addressing ergonomics. This is different from the LEED rating system in that it is an essential part of the rating system in the WELL Building Standard versus an option within LEED [10, 11].
1.2Green Buildings and occupants
The USGBC states that “LEED certified buildings save money and resources and have a positive impact on the health of occupants, while promoting renewable, clean energy” [1]. However, research has yet to demonstrate that LEED buildings automatically result in improved occupant health. In two longitudinal studies, Singh et al. [12] found that the mean numbers of depression, stress, asthma and allergies were reduced after occupants moved from conventional to green buildings. Perceptions of health and wellbeing improved as did productivity and absenteeism [12]. Similarly, Thatcher and Milner [13] suggest, through the results of their longitudinal study, that green buildings may positively impact wellbeing and productivity of occupants. There have been other studies pointing to the positive benefits of green buildings, including lower negative health symptom prevalence in LEED buildings [8] and improved perceptions of stress, health and productivity in green versus conventional buildings [3].
While there have been positive findings, there have also been persistent issues identified in green buildings that can negatively impact occupants. Newsham et al. [7] found that while green buildings generally outperformed conventional buildings in regards to IEQ from the occupants’ perspective, there can still be issues with unsatisfactory acoustics and indoor air quality. Other studies also have pointed to dissatisfaction in green buildings with lighting [3, 14, 15], acoustics [3, 9, 16], thermal comfort [8, 9], and air quality [3, 17]. In short, it is not a given fact that the green features of green buildings will inherently benefit the occupants by creating a more comfortable environment. It is important to continue to investigate occupant experiences to better understand the relationship between green buildings and human health and performance over time. With the current move towards a recertification process in the LEED system, it is imperative that buildings are not just studied once to gain a snapshot, but rather are continually evaluated. The current study reexamines a LEED platinum building that was studied three years prior to see what has shifted over time from the perspective of the occupants.
Our previous study of this building showed a number of issues with the indoor environmental conditions and with the ergonomic design of the office workspaces [3]. It is possible that these findings arose because occupants were relatively new to the building at the time of the study. The current survey will assess how occupants are responding to conditions in this building after being in this space for 3 years. Our hypothesis is that occupants will rate their experiences more positively in this survey than in the previous one because they will have had time to adjust to beneficial “green” design features of thebuilding.
2Methods
2.1Research site and sample
A LEED Platinum building located on the academic campus of Ithaca College, New York State, USA was selected for this study. The Peggy Ryan Williams Center (PRWC) was previously studied by Hedge and Dorsey [3] and was found to have some occupant concerns related to indoor environmental quality. PRWC is a 5,388 m2 (58,000.ft2) building that opened in the fall of 2009 and was certified platinum under LEED v.2.2. Some of the green features of the building include: extensive use of daylighting, natural convection ventilation, a ground source geothermal system, use of renewable energy sources, vegetated roofing, lighting and mechanical ventilation sensor systems, varied shading devices on the glass curtain wall, rainwater collection, low-e coated glass, use of porous pavement and native vegetation, and the use of local, recycled, low-toxicity materials whenever possible [18]. The full details of the LEED credits are available online along with the scorecard for this building (http://www.usgbc.org/projects/peggy-ryan-williams-center).
There are approximately 120 employees that have primary offices in this building, and the majority of tasks are computer and paper based. Sample departments housed in this building include the registrar, human resources, and admissions. Office spaces in PRWC include perimeter private offices, cubicle offices and office suites, as well as interior cubicle offices with partial height partition walls. The north façade of the building is entirely made of glass and faces towards the lake.
2.2Survey and procedure
Ithaca College employees, ages 18 and older, with an office/workstation in the Peggy Ryan Williams Center (PRWC) were eligible to participate in this study. This included part time and full time faculty and staff, however student workers were not eligible. Participants were asked to complete a 10–15 minute anonymous online survey investigating their experiences of their work environment within PRWC and how this work environment affects health, satisfaction and productivity.
The researchers announced the survey through the online campus announcement system, with an initial posting and a follow up reminder posting 2 weeks later. The researchers compiled the email addresses of eligible employees by looking up each department’s employee listings on the college’s website. The primary investigator then contacted eligible employees directly via email to inform them of the study and provided them with a link to the survey. The study was approved by the All College Human Subjects Review Board on November 25, 2014.
2.3Survey
The self- made survey (S2) used in this study was based off the post occupancy evaluation survey (S1) used in the prior study [3], with additional questions asking about workstation layout and control over workstation factors such as air temperature and lighting. This replication of questions allowed comparability between the two surveys. The survey was comprised of 64 items that included:
• Demographic information (age in ranges, gender, length of occupancy).
• Use of ergonomic products at their workstation (chair, keyboard, mouse, trackball, keyboard tray, adjustable mouse platform, single or dual LCD, LCD arm, document holder, footrest, laptop, laptop holder, tablet).
• Experience of indoor environmental conditions (air temperature, freshness, quality, movement, noise, lighting, daylight, furniture and overall workstation conditions). Items had a four points scale (two positive and 2 negative categories) and the scale valence was alternated for items.
• Effects of the indoor environment conditions on self-rated work performance were assessed with a four-point scale (definitely hinders work performance; somewhat hinders work performance; somewhat helps work performance; definitely helps work performance).
• Effects of indoor environmental conditions on health. Responses were made with a four-point scale (definitely makes me feel less healthy; somewhat makes me feel less healthy; somewhat makes me feel healthier; definitely makes me feel healthier).
• Satisfaction with indoor environmental conditions. Responses were made with a four-point scale (definitely dissatisfied; somewhat dissatisfied; somewhat satisfied; definitely satisfied).
• Control of indoor environmental conditions. Responses were made with a three-point scale (no control; some control; full control). New S2 survey item
• Frequency of musculoskeletal symptoms. Responses were made on a five point scale (not experienced; monthly; weekly; daily; several times daily).
• Use of various areas in the PRW building, seasonal effects of conditions, gender and age (<21,21–30,31–40,41–50,51–60,>60), and whether they had participated in the previous survey (S1). New S2 survey item
• Respondents were also allowed to add written comments.
2.4Data analysis
All survey data was analyzed using multivariate statistical analysis software (SPSS v22). Comparisons between survey responses for the current survey (S2) and a previous survey conducted 3 years earlier (S1) were made using Chi-Square tests. The effects of control on ratings were tested using independent t-tests. Descriptive statistics were used to summarize demographic variables. No individual identifying information was collected so it was not possible to match respondents across surveys.
3Results
3.1Respondent characteristics
Complete responses were received from 62 occupants of PRWC (approximately 55% response rate), and this sample is referred to as Survey 2 (S2). Of these respondents, 24 reported having participated in the 2011 study, which will be referred to as Survey 1 (S1). The actual S1 had 35 respondents total [3].
The survey results were analyzed to compare the responses of those who said they had or had not participated in S1 and there were no statistically significant differences in responses and consequently the complete S2 data were used for the S1 and S2 comparisons.
The majority of S2 respondents were female (74.2%) with a 67.7% between the ages of 31 and 60. Respondents had worked in the building an average of 49.3 months (σ= 22.0) and at their current workstation, an average of 36.6 months (σ= 25.0).
When asked about their current experiences in PRWC almost half of respondents had workstations facing north (45.2%) and 22.6% faced south, 67.7% had private offices, 22.6% worked in a cubicle and 8.1% were in an open office. Only 9.7% reported having had an ergonomics evaluation at their current workstation, however, many respondents reported using equipment at their workstations that could be considered part of ergonomic design (see Table 1). Very few respondents reported using the common areas in the building, with 69.4% reporting never using the large outdoor deck. A majority of respondents reported that the building conditions were comfortable in the spring (72.6% responded yes), the fall (69.4%) and the summer (61.3%) but only around one third (37.1%) said that conditions were comfortable in the winter.
Table 1
Office workstation equipment for S2
| Equipment | Count | Percentage |
| Ergonomic chair | 28 | 50.9% |
| Ergonomic keyboard | 12 | 21.8% |
| Ergonomic keyboard tray | 15 | 27.3% |
| Ergonomic mouse | 12 | 21.8% |
| Ergonomic trackball | 4 | 7.3% |
| Ergonomic mouse tray | 3 | 5.5% |
| Single LCD display | 8 | 14.5% |
| Dual LCD display | 39 | 70.9% |
| LCD arm | 4 | 7.3% |
| Task Light | 15 | 27.3% |
| Document holder | 7 | 12.7% |
| Footrest | 16 | 29.1% |
3.2Overall quality of workstation factors
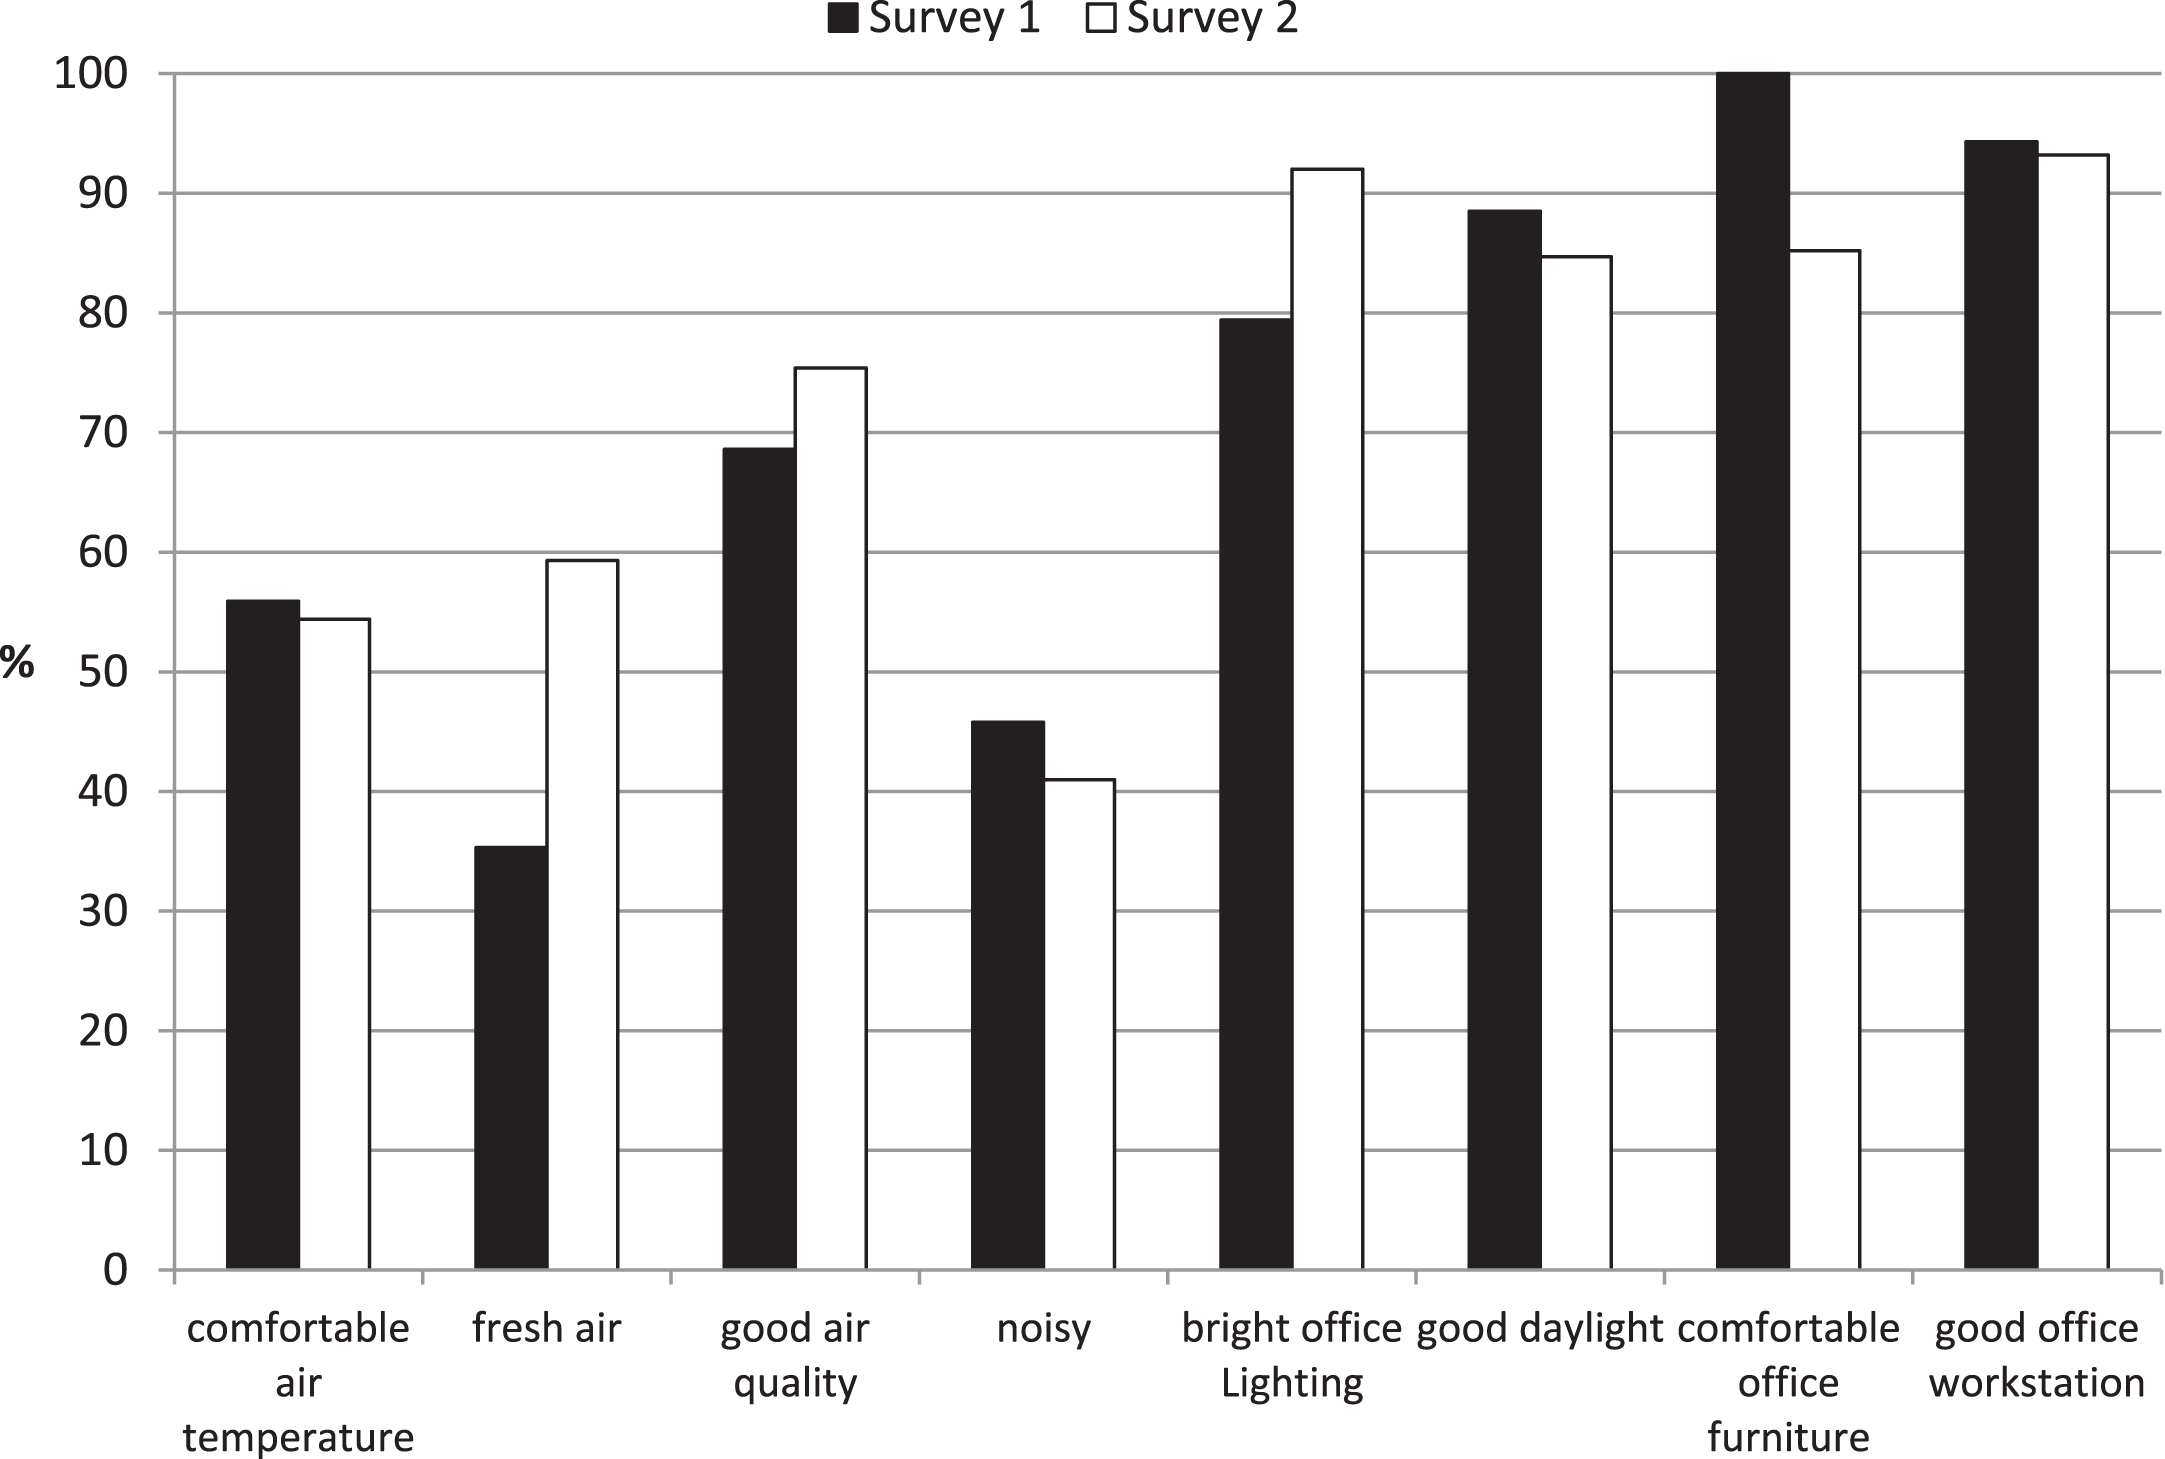
There were no statistically significant differences in S1 and S2 responses for the conditions reported by respondents between S2 and S1 (Fig. 1). Responses show that for S2 a majority of employees found the air temperature comfortable, the air fresh, and the air quality was good. A minority reported that the office was noisy. A large majority also said their office was bright, that daylight was good, that their furniture was comfortable and that the design of the workstation was good.
Fig.1
Perceived office conditions for S1 and S2 at the time of each survey.
3.3Effects on work performance
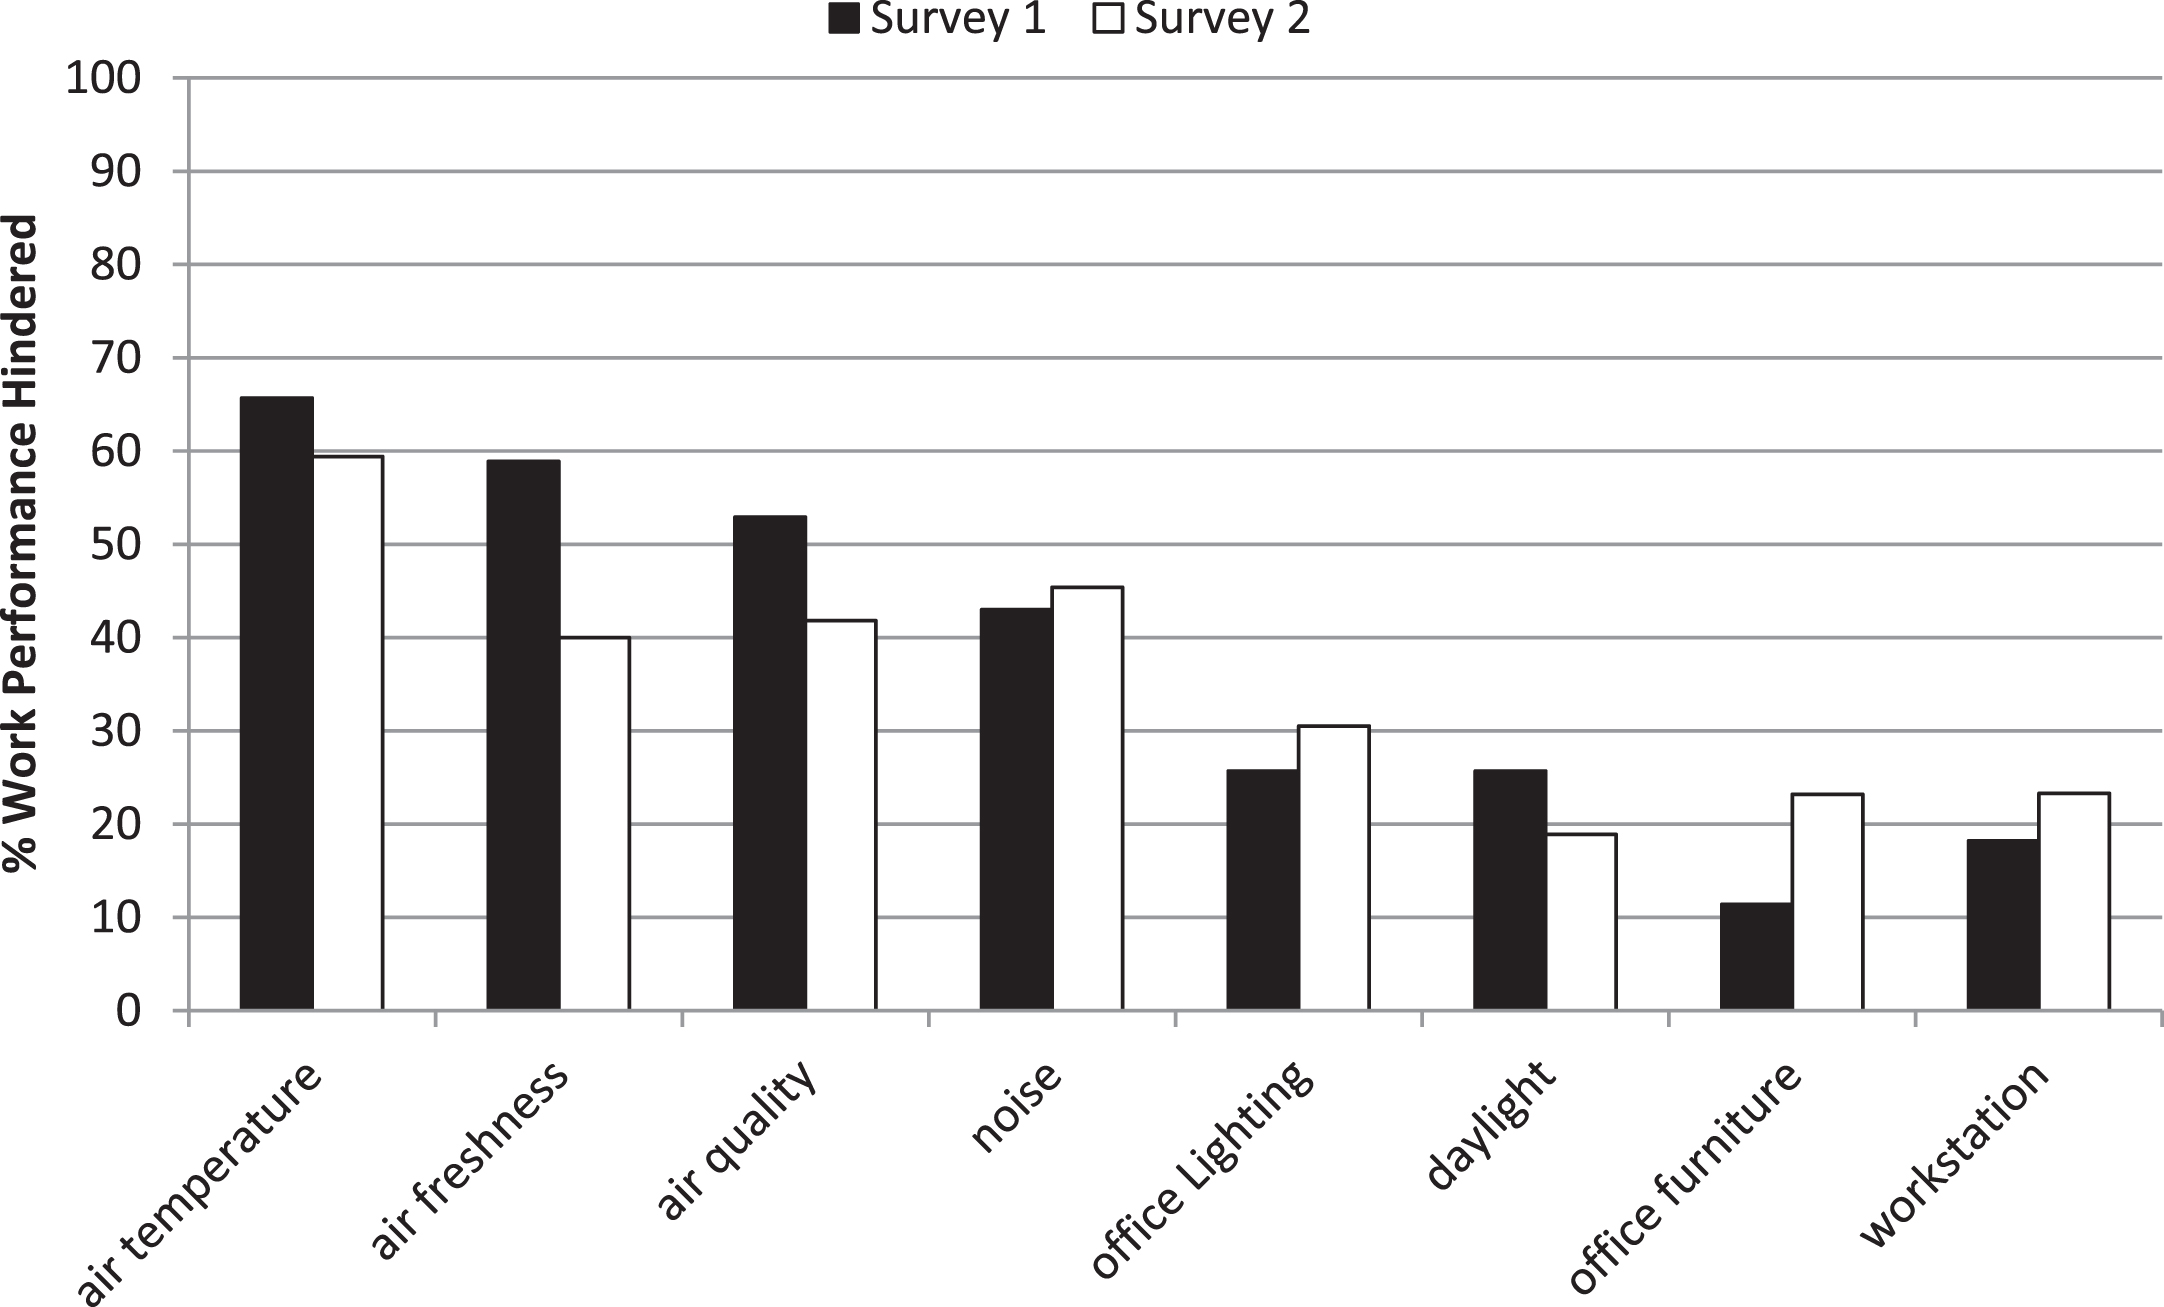
When asked about the effects of office conditions on their work performance, there were no statistically significant differences between responses from S1 and S2 (Fig. 2). For S2 a majority of respondents said their work performance actually was hindered by the air temperature and air freshness, around half said that the air quality hindered their performance, and some 40% reported that noise had this effect. Office lighting, daylight, the office furniture and the workstation design were problematic for less than 30% of the respondents.
Fig.2
Effects of office conditions on ratings of work performance for S1 and S2.
3.4Effects on health
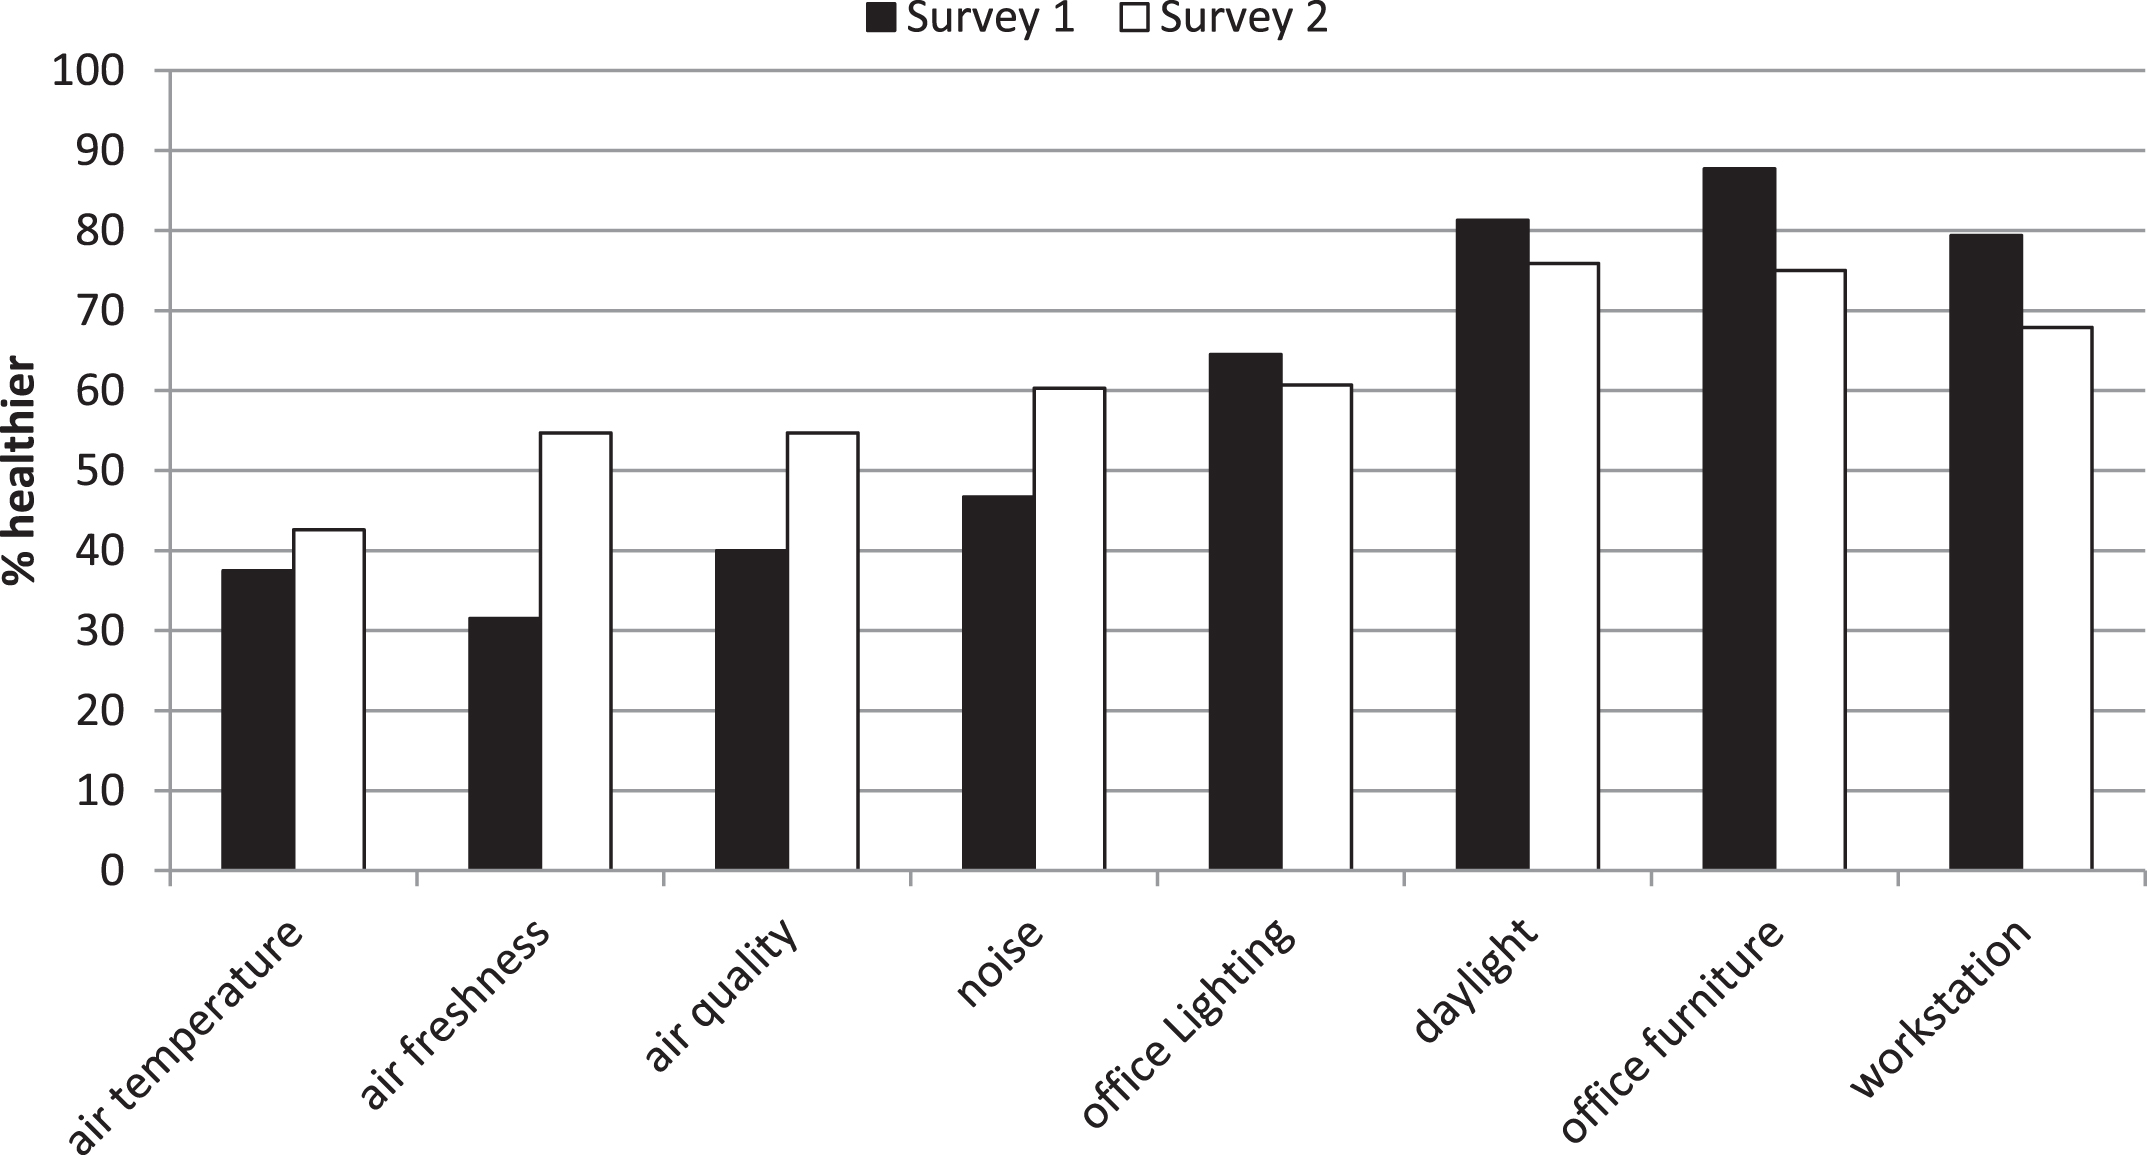
There were no statistically significant differences between responses from S1 and S2 for the effects of office conditions on respondents’ health (Fig. 3). For S2 a majority of respondents said they felt healthier because of the office lighting, daylight, the office furniture and the workstation design. However, a majority also said that they felt less healthy because of the ambient conditions (air temperature, air freshness, air quality, noise).
Fig.3
Effects of office conditions on ratings of health for S1 and S2.
3.5Effects on satisfaction
More respondents said they were satisfied with the office air quality in S2 than in S1, otherwise there were no significant differences between the two surveys. A majority of respondents indicated satisfaction with the office lighting, daylight, and their office furniture and office workstation design.
3.6Frequency of symptoms
Apart from reports of wrist/hand ache, significantly more respondents in S2 reported musculoskeletal and ill health symptoms than in S1 (Table 2). These differences appear to have arisen because many people in S1 reported no symptoms whereas in S2 more respondents indicated monthly symptoms.
Table 2
Frequency of symptoms for S1 and S2
| Symptom | Survey | None | Monthly | Weekly | Daily | P |
| Headache | 1 | 54.3 | 22.9 | 11.4 | 11.4 | 0.000 |
| 2 | 3.7 | 70.4 | 18.5 | 7.4 | ||
| Eyestrain | 1 | 40.0 | 14.3 | 25.7 | 20.0 | 0.002 |
| 2 | 3.7 | 55.6 | 18.5 | 22.2 | ||
| Backache | 1 | 51.4 | 17.1 | 14.3 | 17.2 | 0.000 |
| 2 | 3.7 | 74.1 | 7.4 | 14.8 | ||
| Neck/shoulder ache | 1 | 60.0 | 8.6 | 11.4 | 20.0 | 0.000 |
| 2 | 3.7 | 59.3 | 22.2 | 11.1 | ||
| Wrist/hand ache | 1 | 54.3 | 17.1 | 8.6 | 20.0 | NS |
| 2 | 55.6 | 11.1 | 22.2 | 11.1 | ||
| Coughs/sneezes | 1 | 51.4 | 14.3 | 11.4 | 22.9 | 0.000 |
| 2 | 3.7 | 55.6 | 22.2 | 18.5 | ||
| General fatigue | 1 | 22.9 | 17.1 | 22.9 | 37.2 | 0.008 |
| 2 | 3.7 | 59.3 | 18.5 | 18.5 |
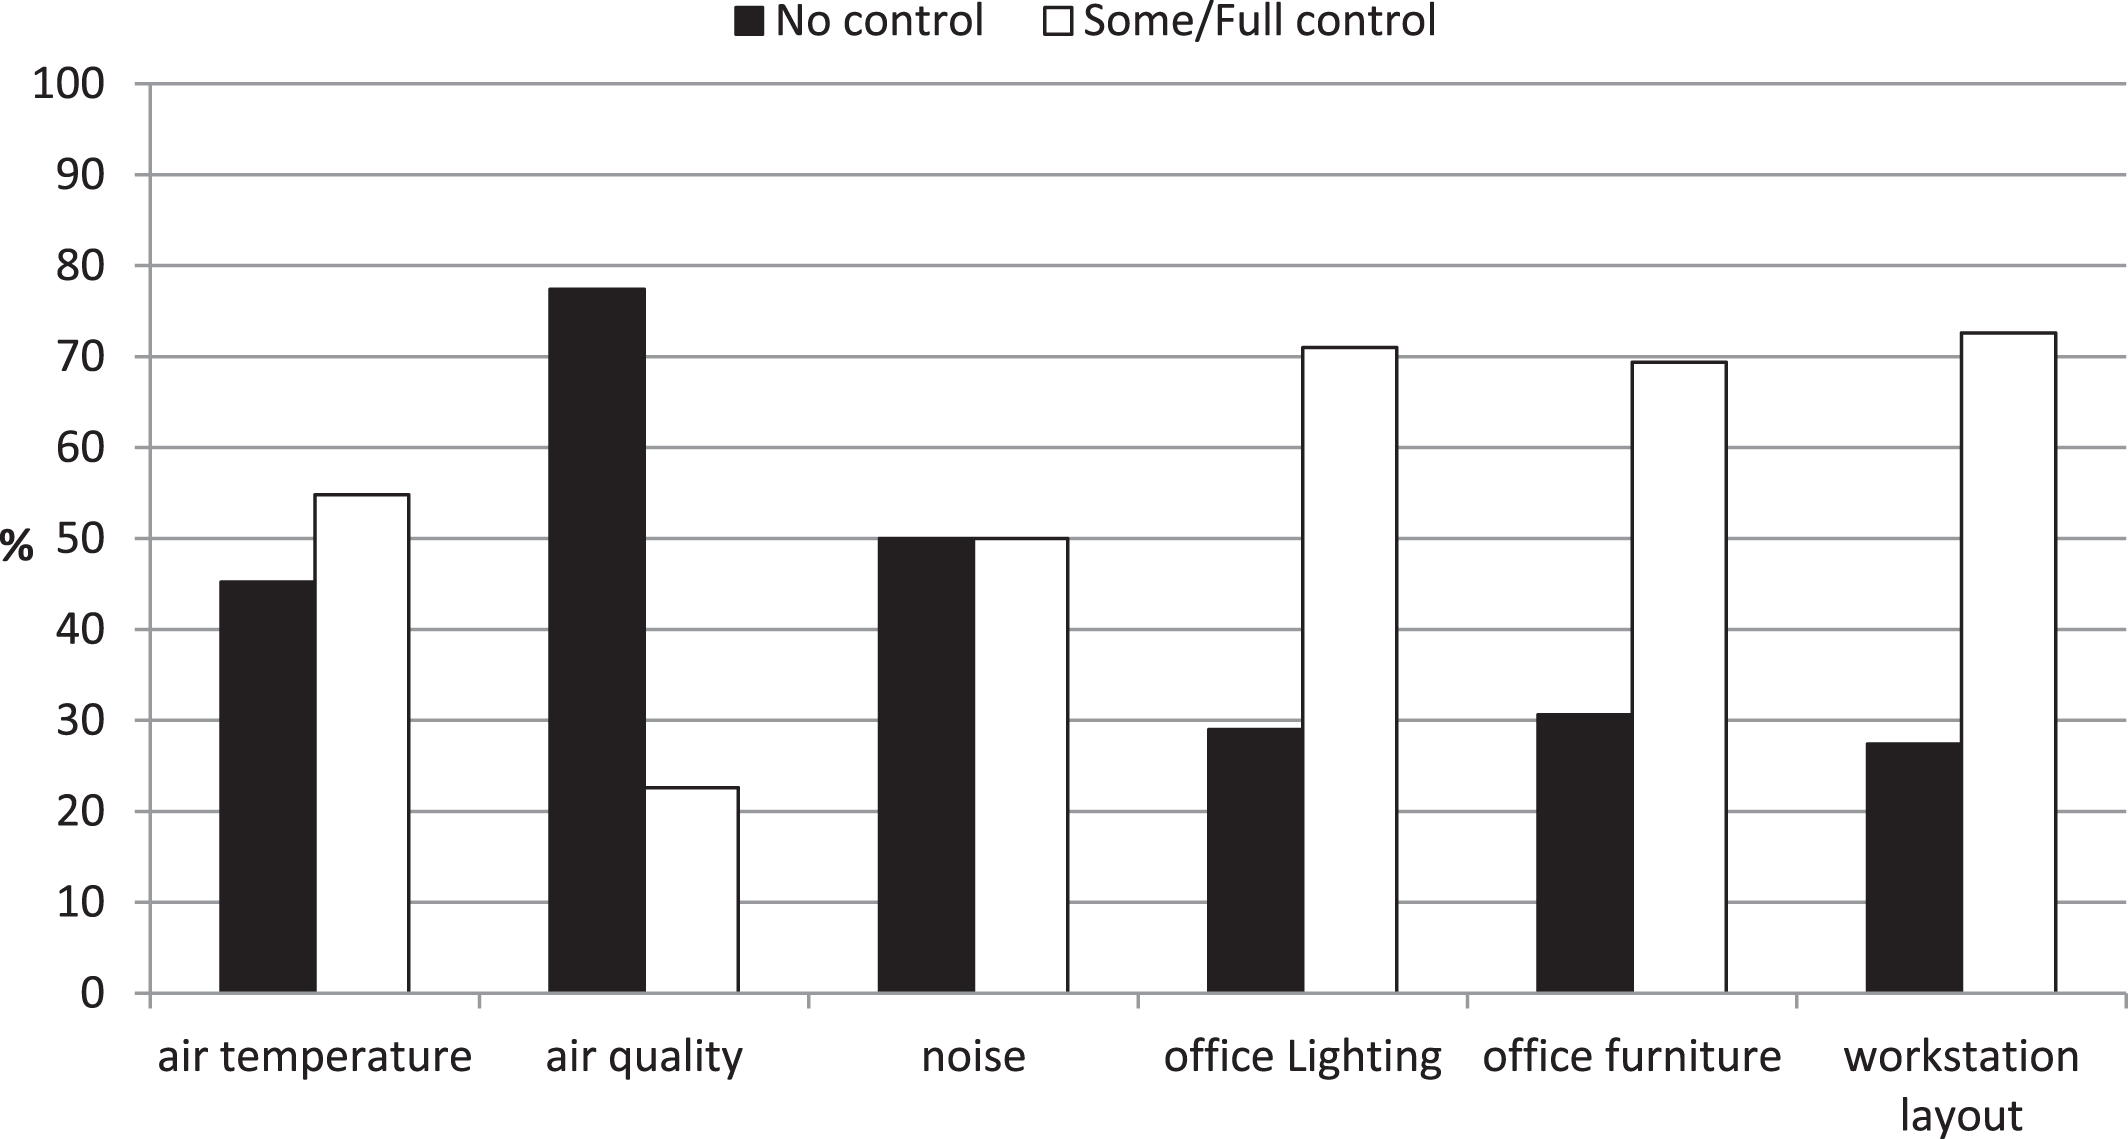
3.7Control over workstation features
In S2 respondents were asked about their ability to control certain conditions at work and the results are shown in Fig. 5. There was a significant effect of office type on the ability to control air temperature (p = 0.002) and 57.5% of those in private offices said that they had some or full control over their temperature, compared to 42.9% of those in cubicles and 40% of those in open offices. There was a significant effect of office type on the ability to control office lighting (p = 0.001) and 85.4% of those in private offices said that they had some or full control over their lighting, compared to 38.5% of those in cubicles and only 20% of those in open offices. There were no significant effects of office type for control of air quality, noise, the office furniture or office layout. Many of the LEED credits discussed below have requirements for providing a certain percentage of occupants with control over workstation features (USGBC, 2015a), whereas many conventional buildings typically do not offer the same controls.
Fig.4
Effects of office conditions on satisfaction ratings for S1 and S2.
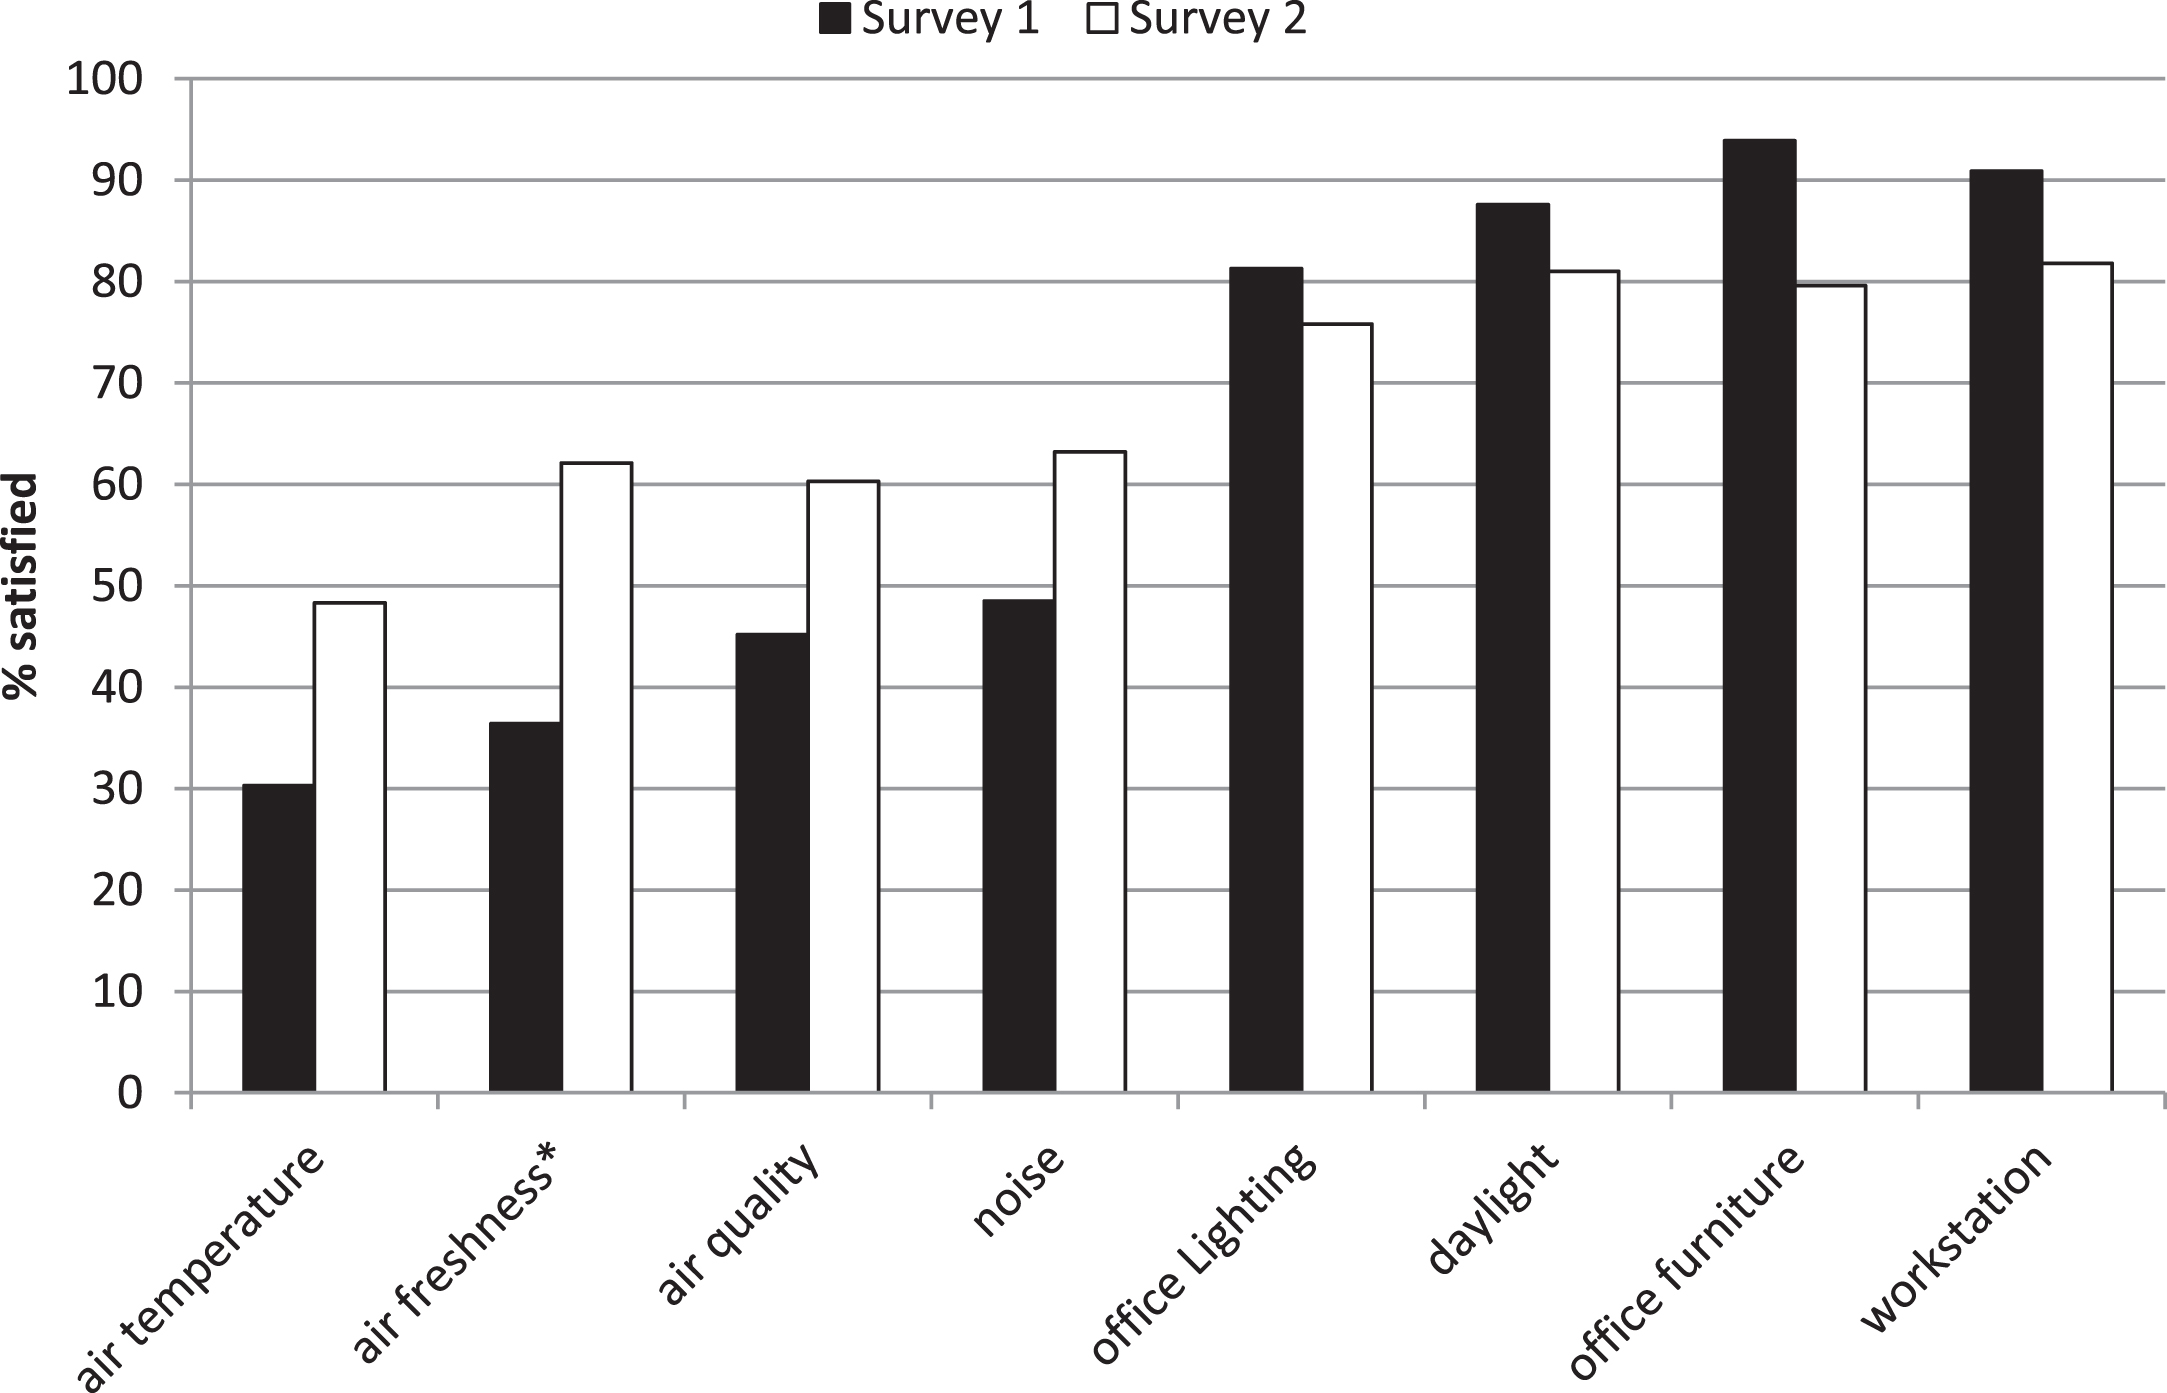
Fig.5
Personal control of conditions reported in S2.
3.7.1Air temperature control
The ability to control air temperature significantly improved respondents’ ratings of air temperature comfort, effects on work performance, health and satisfaction (Table 3).
Table 3
Effects of control of air temperature on ratings of air temperature related comfort, work performance, health and satisfaction
| Air temperature | N | Mean | Std. | P | |
| rating | Deviation | ||||
| Comfort | No control | 28 | 2.18 | 0.772 | 0.01 |
| Control | 28 | 2.68 | 0.612 | ||
| Work performance | No control | 27 | 2.07 | 0.874 | 0.011 |
| Control | 30 | 2.70 | 0.915 | ||
| Health | No control | 26 | 2.08 | 0.744 | 0.012 |
| Control | 26 | 2.62 | 0.752 | ||
| Satisfaction | No control | 28 | 2.11 | 0.956 | 0.011 |
| Control | 30 | 2.73 | 0.868 |
3.7.2Air quality control
The ability to control air quality significantly improved respondents’ ratings of air quality effects on work performance, health and satisfaction, but had no effect on ratings of comfort (Table 4).
Table 4
Effects of control of air quality on ratings of air quality related comfort, work performance, health and satisfaction
| Air quality | N | Mean | Std. | P | |
| rating | Deviation | ||||
| Comfort | No control | 48 | 2.73 | 0.707 | ns |
| Control | 12 | 3.00 | 0.426 | ||
| Work performance | No control | 42 | 2.52 | 0.943 | 0.034 |
| Control | 12 | 3.17 | 0.718 | ||
| Health | No control | 41 | 2.37 | 0.859 | 0.006 |
| Control | 11 | 3.18 | 0.751 | ||
| Satisfaction | No control | 45 | 2.49 | 0.787 | 0.000 |
| Control | 12 | 3.50 | 0.522 |
3.7.3Noise control
The ability to control noise significantly improved respondents’ ratings of noise effects on comfort, work performance, and satisfaction, but had no effect on ratings of health (Table 5).
Table 5
Effects of control of noise on ratings of noise-related comfort, work performance, health and satisfaction
| Noise | N | Mean | Std. | P | |
| rating | Deviation | ||||
| Comfort | No control | 31 | 2.35 | 0.755 | 0.018 |
| Control | 29 | 2.76 | 0.511 | ||
| Work performance | No control | 28 | 2.32 | 1.056 | 0.019 |
| Control | 26 | 2.96 | 0.871 | ||
| Health | No control | 24 | 2.50 | 0.780 | ns |
| Control | 23 | 2.78 | 0.671 | ||
| Satisfaction | No control | 29 | 2.52 | 0.949 | 0.032 |
| Control | 27 | 3.00 | 0.679 |
3.7.4Lighting control
The ability to control office lighting significantly improved respondents’ ratings of lighting effects on health, but had no effect on ratings of comfort, work performance, and satisfaction (Table 6).
Table 6
Effects of control of office lighting on ratings of lighting-related comfort, work performance, health and satisfaction
| Office | N | Mean | Std. | P | |
| rating | Deviation | ||||
| Comfort | No control | 17 | 3.06 | 0.556 | ns |
| Control | 41 | 3.05 | 0.545 | ||
| Work performance | No control | 18 | 2.61 | 0.778 | ns |
| Control | 37 | 3.08 | 0.862 | ||
| Health | No control | 15 | 2.20 | 0.676 | 0.007 |
| Control | 34 | 2.91 | 0.866 | ||
| Satisfaction | No control | 18 | 2.67 | 0.907 | ns |
| Control | 38 | 3.13 | 0.906 |
3.7.5Office furniture control
The ability to control office furniture significantly improved respondents’ ratings of furniture effects on comfort, work performance, health and satisfaction (Table 7).
Table 7
Effects of control of office furniture on ratings of furniture-related comfort, work performance, health and satisfaction
| Office Furniture | N | Mean | Std. | P | |
| rating | Deviation | ||||
| Comfort | No control | 19 | 2.58 | 0.607 | 0.003 |
| Control | 41 | 3.07 | 0.412 | ||
| Work performance | No control | 18 | 2.56 | 0.922 | 0.009 |
| Control | 37 | 3.24 | 0.641 | ||
| Health | No control | 16 | 2.38 | 0.885 | 0.008 |
| Control | 35 | 3.09 | 0.612 | ||
| Satisfaction | No control | 19 | 2.53 | 0.772 | 0.000 |
| Control | 39 | 3.26 | 0.637 |
3.7.6Office workstation layout control
The ability to control the layout of the workstation significantly improved respondents’ ratings of furniture effects on comfort, work performance and health but had no effect on ratings of satisfaction(Table 8).
Table 8
Effects of control of office workstation layout on ratings of layout-related comfort, work performance, health and satisfaction
| Office Furniture | N | Mean | Std. | P | |
| rating | Deviation | ||||
| Comfort | No control | 17 | 2.88 | 0.697 | 0.028 |
| Control | 41 | 3.24 | 0.489 | ||
| Work performance | No control | 16 | 2.63 | 0.885 | 0.039 |
| Control | 39 | 3.13 | 0.767 | ||
| Health | No control | 14 | 2.21 | 0.802 | 0.002 |
| Control | 38 | 2.92 | 0.632 | ||
| Satisfaction | No control | 16 | 2.88 | 0.806 | ns |
| Control | 38 | 3.11 | 0.649 |
4Discussion
Comparisons of the S21 and S1 results showed that over time some aspects of the indoor environment in this green building had been improved, and this may reflect the ongoing maintenance of the environmental systems. However, the opposite was true for musculoskeletal symptoms, which indicates the importance of fully considering ergonomic design principles for workstations. The current study showed that after a few years, the occupants are reporting increased comfort and satisfaction, which potentially can beneficially affect productivity, although we did not gather any productivity data. Thatcher and Milner [13] found significant improvements in productivity in a yearlong study of a green versus conventional building, and the findings of the current study may suggest a similar trend.
There are many factors that could have contributed to the differences in occupant experiences since the previous POE in 2011. The researchers had conversations with the director of facilities and the campus interior designer to identify what, if any, changes have been made to PRWC since 2011. It was confirmed that no major changes to the environment within the building had been made in relation to HVAC or lighting, though some diffusers were added to the HVAC outputs in many of the offices. The interior designer reported that some minor adjustments have been made to individual workstations when people have moved from one workstation to another, such as changing the direction of some desks and adding filing and storage in some offices. There have been no major changes made to furniture or office layouts since the last POE.
The occupants of PRWC had previously occupied older buildings across the campus that mainly had individually controlled thermostats or constantly tempered blowing air from air handlers. They likely had similar expectations when they moved into PRWC, and were not familiar with the heat pump systems and other “green” features. It is also possible that occupants had very high expectations in general that all systems and features would be flawless and intuitive, with low tolerance for any issues, since it is a LEED platinum building that was highly anticipated by the campus community. It is possible that occupants have now adjusted their expectations and adapted to the environmental conditions created by the different mechanical systems used in PRWC. Adaptation processes have been documented for other environmental conditions, for example, Evans et al. [19] showed how recent arrivals to Los Angeles reported greater irritation and respiratory problems compared to desensitized long-termresidents.
While we cannot pinpoint when this adaptation happened for the occupants due to the study design, we suggest that there is a need to facilitate the transition from conventional to green buildings. If occupants are left to figure out the new systems on their own, their comfort, productivity and satisfaction can suffer in the meantime. Many supposedly “green” features rely on appropriate user behaviors and without appropriate education and training building users typically revert to old habits so building performance may deteriorate over time. There appears to be a disconnect between building system designers and users, which is not a new issue. However, it does suggest a clear role for HF/E professionals in working with designers and other stakeholders in LEED projects. Recognizing the need for an adjustment period as suggested by our study, providing education to occupants upon the initial move to a green building could help them to learn and understand the green features to shorten the transition period.
When compared to S1, respondents in S2 reported significant differences in frequency of MSDs and health symptoms, with increased occurrence of all symptoms except wrist/hand ache. This is an important finding to consider especially since the overall occupant experiences generally remained the same or improved over time. The MSD and health related findings are in contrast with prior studies, though it is hard to draw true comparisons due to differences in methodology and outcome measures [7, 13]. Also, within the same type of building there is a greater variety of types and layouts of office furniture which directly impacts employees’ working postures that in turn affect MSD risks. A very small percentage of S2 respondents reported having received an ergonomics evaluation of their current workstation, similar to S1 results [3]. However, many reported using equipment that could be considered part of ergonomic design. Some of the equipment listed on the survey was likely provided to them as part of the general workstation design, such as keyboard trays, dual monitors and chairs. It is possible that individuals are purchasing their own products or equipment in an attempt to improve their comfort at work. Despite the usage of these “ergonomic” devices, without a comprehensive ergonomics program in place respondents are experiencing high frequencies of MSDs and negative health symptoms. There is clearly a need for the integration of ergonomics in green buildings to improve occupant experiences and to promote health. PRWC did not seek the LEED ergonomics credit, however if it had, a comprehensive and ongoing ergonomics program would be in place to address the issues currently being experienced by occupants and perhaps could have prevented the issues in the first place.
Over 50% of occupants in this building reported having a workstation facing south, east or west. Hwang and Kim [14] found that workstations in green buildings that faced north were perceived to have the most evenly distributed illuminance and those facing other directions may have a need for additional controls and training in such controls. Around 30% of respondents in S2 reported working in cubicle or open offices and this could contribute to dissatisfaction with lighting [15]. The provision of increased lighting controls and task lighting may improve occupant experiences when working in cubicle designed workstations [15]. Prior studies have found persistent issues with thermal comfort in green buildings related to control of thermostats [9, 17]. S2 results showed that control over air temperature, air quality, noise, lighting office furniture, and office layout significantly increased many of the outcomes of interest. Control over IEQ features is part of most of the associated LEED credits and it is important that occupants understand how to operate the controls. While it is not possible to allow each individual to have control over every workstation features for various reasons, educating occupants about the features they can control may have a positive impact on their work experiences.
Finally, the fact that employees seem to have adapted to the indoor environmental conditions over time whereas there is no evidence of an improvement in MSDs reinforces the need to devote more effort to implementing the LEED ergonomics credit. The credit is designed to focus on the health and performance of building occupants, and in future this should be given greater prominence and the scope of this credit should be expanded. This building’s designers did not seek the ergonomics credit and there is no formal ergonomics program in place specifically for this facility. Without specific attention given to ergonomic design, many occupants in this study continue to experience workplace discomfort. A building that is sustainable for the environment and the economics of a business, but does not focus on the needs of occupants and provide ergonomic working conditions, is not truly sustainable. Green building design must address the health and well-being of occupants in order to fully meet the intent of sustainable development.
4.1Limitations
There were several limitations to this study that could affect generalizability of the results. The sample size is relatively small, though it did represent a good response rate (51.7%). Both surveys, S1 and S2, were anonymous so the researchers were unable to match responses. The researchers had to rely on S2 respondents to report participation in S1, and there were a few respondents who were unsure if they had participated in S1 (their results were not included in the comparison). As with any follow up study, there are many other factors that could have impacted occupant responses over time. Given the scope of the current study, it is impossible to account for all of those factors though many were considered in the discussion section of this paper. There is a need for future research to examine occupant experiences in green buildings from a longitudinal perspective. As with conventional buildings, green buildings need to be maintained over time and ergonomics must be considered through the buildings’ lifecycle [20].
4.2Conclusion
This study investigated current occupant experiences in a LEED platinum building, and also compared results with a prior POE of the same building. While the building is perceived positively in general, there are still some persistent issues with IEQ and negative experiences of MSDs and health. There is a clear need for LEED buildings to pursue the ergonomics credit to give specific attention to the human element of green building design. Sustainable development has three pillars that deserve equal attention, and the attention being given to the human or social pillar has been limited [2]. With rapid growth in the green building sector, the time has come to focus on the long term effects on occupants. Additionally, the shift to a recertification process for LEED buildings creates additional roles for HF/E professionals to ensure that the changing needs of occupants are met over time. The new WELL Building Standard also speaks to the importance of ergonomics in green building design and together these credits create additional opportunities for HF/E professionals to become involved in the green building certification process.
Conflict of interest
The authors have no conflict of interest to report.
References
[1] | United States Green Building Council. Washington, D.C: USGBC. 2015 [Updated 2016; cited 2015 Oct 26] Available from http://www.usgbc.org |
[2] | Institute of Medicine (IOM). Climate Change, the Indoor Environment, and Health. Washington, DC: [(2011) ]. The National Academies Press. |
[3] | Hedge A , Dorsey J . Green buildings need good ergonomics. Ergonomics (2013) ;56: :492–506. |
[4] | Hedge A . The sprouting of “green” ergonomics. Bulletin of theHuman Factors and Ergonomics Society (2008) ;51: (12):1–3. |
[5] | Thatcher A . Green ergonomics: Definition and scope. Ergonomics (2013) ;56: :389–98. |
[6] | Hanson M . Green ergonomics: Challenges and opportunities. Ergonomics (2013) ;56: :399–408. |
[7] | Newsham G , Birt B , Arsenault C , Thompson L , Veitch J , Mancini S , Galasiu A , Gover B , Macdonald I , Burns G . Do ‘green’ buildingshave better indoor environments? New evidence. BuildingResearch & Information (2013) ;41: (4):415–34. |
[8] | Hedge A , Miller L , Dorsey J . Occupant comfort and health and green and conventional university buildings. WORK (2014) ;49: (3):363–72. |
[9] | Lee Y , Guerin D . Indoor environmental quality related to occupant satisfaction and performance in LEED-certified buildings. Indoor and Built Environment (2009) ;18: (4). |
[10] | United States Green Building Council. Washington, D.C: USGBC. 2015 [Updated 2016; cited 2015 Oct 26] Available from http://www.usgbc.org/resources/leed-existing-buildings-operations-amp-maintenance-recertification-guidance293-300. |
[11] | Delos Building Wellness. Well Building Standard. [Internet] Delos Living, LLC. 2012 [2015]. Available from http://delos.com/about/well-building-standard. |
[12] | Singh A , Syal M , Grady SC , Korkmaz S . Effects of green buildings on employee health and productivity. American Journal of Public Health (2010) ;100: :1665–8. http://dx.doi.org/10.2105/AJPH.2009.180687 |
[13] | Thatcher A , Milner K . Changes in productivity, psychological well-being and physical well-being from working in a ‘green’ building. WORK (2014) ;49: (3):381–93. |
[14] | Hwang T , Kim J . Effects of indoor lighting on occupants’ visual comfort and eye health in a green building. Indoor and Built Environment (2011) ;20: (1):75–90. |
[15] | Lee YS , Guerin D . Indoor environmental quality differences between office types in LEED-certified buildings in the US. Building and Environment (2010) ;45: (2010):1104–12. |
[16] | Hodgson M , Hyde R , Fulton B , Taylor-Hell C . Acoustical evaluation of six ‘green’ office buildings. Canadian Acoustics (2008) ;36: (3):72–3. |
[17] | Lee YS . Comparisons of indoor air quality and thermal comfort quality between certification levels of LEED-certified buildings in USA. Indoor and Built Environment (2011) b;20: (5):564–76. |
[18] | Ithaca College Gateway Building. Ithaca, NY: Holt Architects; 2009 [Cited 2015 Oct 26] Available from http://www.ithaca.edu/sustainability/docs/greenbuildings/williamsfactsheet.pdf |
[19] | Evans GW , Jacobs SV , Frager NB . Human adaptation to smog. Journal of the Air Pollution Control Association (1982) ;32: (10):1054–7. |
[20] | Miller L , Dorsey J , Jacobs K . The importance of ergonomics tosustainability throughout a building’s life cycle. WORK (2012) ;41: :2129–32. DOI: 10.3233/WOR-2012-0647-2129 |

