
Prevalence of persistent vegetative state in patients with severe traumatic brain injury and its trend during the past four decades: A meta-analysis
Abstract
BACKGROUND: Estimating the prevalence of persistent vegetative state (PVS) following severe traumatic brain injury (sTBI) and its change over time is important for the study of the disease.
OBJECTIVE: To estimate the prevalence of PVS at six months after sTBI and its trend over the past four decades, and to explore the effect of demographic data, such as age and sex, on the prevalence of PVS.
METHOD: Observational studies presenting the prevalence of PVS or the number of patients with PVS at six months after sTBI were included in the analysis. The overall prevalence and prevalence within pre-defined time intervals were calculated and meta-regression analysis was performed to assess the effect of age, gender, and time on the prevalence.
RESULTS: Twenty articles reporting 21 cohort studies were included. The overall prevalence of PVS at six months after injury was 2.77% (95% CI 0.0204-0.0375). There was no statistically significant trend towards time (P = 0.77). And we found no differences in prevalence according to age (P = 0.68) and gender (P = 0.57).
CONCLUSIONS: Prevalence of PVS at six months after sTBI has no significant change over the past four decades. Age and gender do not seem to have a significant effect on the prevalence.
1Introduction
An estimated 10 million people have traumatic brain injury (TBI), and 2% of the population in the United States lives with a TBI-related disability (Le Roux, 2013). Furthermore, TBI will surpass all other diseases and become the leading cause of death and disability by 2020 (Humphreys, Wood, Phillips, & Macey, 2013). Some survivors of severe traumatic brain injury (sTBI) fail to fully recover self and environmental awareness despite awaking from acute coma. The term persistent vegetative state (PVS) is applied when the vegetative state (VS) lasts for at least 1 month. An estimated 10,000 to 25,000 adults and 4,000 to 10,000 children are in a PVS in the United States (PVS, 1994).
PVS is the worst outcome besides death in patients with sTBI. The prognosis for PVS is generally poor, not only because of the substantially shortened life expectancy (2 to 5 years for most patients; survival beyond 10 years is unusual (PVS, 1994)), but also because of the patients’ living conditions, which seriously affect the lives of these patients and their relatives and place a considerable burden on society.
The pace of research on sTBI and PVS has advanced rapidly over the past few decades, with more therapeutic measures being applied in the management of TBI and many studies reporting prevalence of PVS after sTBI. However, the reported prevalence varies and long-term report based on large cohort is scarce. Estimating the prevalence of PVS following sTBI and its change over time is important for patients’ families and health practioner in the study of the disease. In this meta-analysis, we aim to estimate the prevalence of PVS at six months after sTBI and its trend over the past four decades, and to explore the effect of demographic data, such as age and sex, on the prevalence of PVS.
2Method
Our study was reported out according to the MOOSE Reporting instrument (Stroup et al., 2000). The protocol was registered in International Prospective Register of Systematic Reviews (PROSPERO) database under registration number CRD42015025802.
2.1Search strategy
The search strategy was developed under the consensus of all the investigators. Medline, EMBASE, SCOPUS, and the Cochrane database were searched using a combination of the following terms: brain injury, head injury, TBI, vegetative state, PVS, unresponsive wakefulness syndrome, UWS. We applied no language restrictions and we included both cohort studies and hospital databanks. The reference lists of initially included studies and review articles were searched manually to identify additional relevant reports. The search was carried out in April 2016.
2.2Eligibility criteria
Observational studies presenting the prevalence of PVS or the number of patients with PVS at six months after sTBI were included in the analysis. Studies that included only single case reports were excluded. Two investigators independently reviewed the titles and abstracts and eligible studies based on study characteristics and clinical relevance. And any conflicts were adjudicated by a third investigator.
2.3Quality assessment
The Agency for Healthcare Research and Quality (AHRQ) elaborated and validated a checklist for observational studies (Sanderson, Tatt, & Higgins, 2007; Zeng et al., 2015). Therefore the AHRQ quality assessment was applied to all the included articles. Two reviewers assessed each included study independently and scored each item with “yes”, “no” and “unclear”. Any disagreement was resolved by consulting with a third reviewer (Table 2).
2.4Data extraction
The following information was extracted: year of publication, first author, number of centers, country, time period, median year, number of patients with sTBI, age limits, mean age, proportion of males, number of followed up patients, and prevalence of PVS.
Data were extracted from eligible studies by two investigators acting independently and any disagreement was resolved by consulting with a third reviewer. When needed, we contacted the original author for clarification.
2.5Data analysis
Prevalence was extracted or calculated using the number of PVS and follow-up patients. Log transformation was performed on the percentage of PVS prevalence prior to calculation, which was then back-transformed for interpretation. Publication bias was assessed using Egger’s test of the correlation between effect sizes and their variances. Statistical heterogeneity was assessed using the I2 statistic; I2>50% indicated heterogeneity between studies. A random effects meta-analysis was used to estimate the combined PVS prevalence; otherwise, fixed effects models were used.
Based on the mid-time follow-up of patients in the included studies, we pre-defined four time periods to assess the change in PVS prevalence over the past four decades: before 1980, 1980–1990, 1990–2000, and after 2000. A potential change in the prevalence of PVS at six months after sTBI towards time was tested by performing meta-regression analysis with the median year of the study and log-prevalence as outcome. Effect of age and gender on the prevalence was assessed using meta-regression as well.
Subgroup analysis was performed to check whether the location and the number of center influenced the pooled prevalence. In order to determine the robustness of the combined prevalence, sensitivity analysis was performed by removing one study.
All analyses were performed using R version 3.2.2 software.
3Result
Our search identified 4595 articles. After 2324 duplications removed, 1930 additional articles were excluded on the basis of their titles or abstracts, resulting in the full text of 341 articles being examined. Finally, 20 articles reporting 21 cohort studies were included in the present analysis (Andriessen et al., 2011; Fearnside, Cook, McDougall, & McNeil, 1993; Foulkes, Eisenberg, Jane, Marmarou, & Marshall, 1991; Gomez et al., 2000; Heiden, Small, Caton, Weiss, & Kurze, 1983; Jourdan et al., 2013; Judson, Cant, & Shaw, 1990; Lannoo et al., 2000; Mamelak, Pitts, & Damron, 1996; G. D. Murray et al., 1999; L. S. Murray et al., 1999; Myburgh et al., 2008; Nordstrom, Messeter, Sundbarg, & Wahlander, 1989; Pang et al., 2007; Petroni et al., 2010; Rusnak, Janciak, Majdan, Wilbacher, & Mauritz, 2007; Selladurai, Jayakumar, Tan, & Low, 1992; Stranjalis et al., 2008; Turazzi, Bricolo, & Pasut, 1984; Turazzi, Bricolo, Pasut, & Formenton, 1987). A flow diagram of the selection process is presented in Fig. 1. These articles representing a total sample of 12,263 patients with sTBI and a total of 332 cases of PVS over a period of 41 years from 1968 to 2009. Mean age was described in 15 articles and gender in 17. A summary of the characteristics of the studies is presented in Table 1.
Of the studies included in this analysis, three were performed before 1980 in 4191 patients, six were from 1980 to 1990 in 3478 patients, five from 1990 to 2000 in 1975 patients, and seven after 2000 in 2619 patients. The overall PVS prevalence at six months after TBI before 1980 was 2.10% (95% CI 0.0170–0.0258), which increased to 2.10% (95% CI 0.0170–0.0258) during the 1980s. During the 1990s, the prevalence was 3.42% (95% CI 0.0204–0.0574), and decreased to 2.44% (95% CI 0.0127–0.0469) after 2000 (Fig. 2). When results from all 21 studies were pooled, the overall combined prevalence was 2.77% (95% CI 0.0204–0.0375) (Fig. 3). There was no statistically significant trend towards time (P = 0.77). And we found no differences in prevalence according to age (P = 0.68) and gender (P = 0.57). Meta-regression analysis showed a trend of a slight increase in PVS prevalence over time, but it was far from significant (P = 0.77). And we found no differences in prevalence according to age (P = 0.68) and gender (P = 0.57). Egger’s test indicated that a publication bias did not exist (P = 0.06).
Given the large heterogeneity between the studies, subgroup analysis was performed, and the results are shown in Table 3. Sensitivity analysis was carried out to exclude a single study and calculated the pooled prevalence for remaining studies, and omission of each study did not have a significant impact on the merged value of prevalence.
4Discussion
TBI results in mechanical damage to the central nervous system and generates a kind of secondary insult. TBI is currently one of the causes of severe functional nervous damage. In China, the rate of unfavorable outcome after TBI has been reported to be as high as 50% (Jiang, 2013), which indicates a need to focus on the nervous function of patients who survive after TBI while attempting to reduce the mortality rate.
Vegetative state, also known as unresponsive wakefulness syndrome (UWS) (Laureys et al., 2010), was first proposed by Jennet and Plum to describe the condition of a group of patients with severe brain injury who awoke from coma but still lacked detectable awareness (McCauley et al., 2013).
The Multi-Society Task Force on Vegetative State defined VS as a condition in which awareness of the self and environment is completely lacking but sleep-wake cycles exist and hypothalamic/brain stem autonomic functions are fully or partly preserved. In VS, there is also no evidence of sustained, reproducible, purposeful, or voluntary behavioral responses to visual, auditory, tactile, or noxious stimuli. Language comprehension or expression in is also scarce in such patients, with bowel and bladder incontinence and variable preservation of cranial nerve and spinal reflexes.
VS is one of the unfavorable outcomes of sTBI. A patient with sTBI enters VS if wakefulness and circadian rhythms are preserved but self-perception and awareness of the environment is severely damaged (PVS, 1994). The lives of patients in a PVS rely on artificial nutrition and hydration. Thus, the life expectancy of these patients depends, to some extent, on the attitude of the family and clinicians. Of course, all life has value, but whether it is in the patient’s best interest to continue living or an assault on the patient’s dignity is in question. Obviously, PVS is not only a problem of medical treatment, but also an ethical and legal issue.
A comprehensive review of the prevalence of PVS is the basis for estimating and analyzing the outcome of PVS more accurately. Thus, we conducted a meta-analysis exploring the prevalence of PVS at six months after onset in sTBI patients over the past 40 years.
The studies included in this analysis indicated a wide range of PVS prevalence at six months after sTBI, from 0.52% to 7.33%. The highest prevalence was in Kelantan, Malaysia (Selladurai et al., 1992). The study period was 1989–1991. In that study, 8 of 109 patients were in a PVS at six months after onset. In contrast, the lowest prevalence was in Paris, France (Jourdan et al., 2013). The study period was 2005–2007. In that study, only 2 of 381 patients were in a PVS at six months after injury. The location variance and large span of time may contribute to the broad distribution of the prevalence.
4.1Location
The prevalence of PVS varies between different countries and different regions within the same country. The included studies were mostly from America and Europe; of 21 studies, 11 were from Europe, 3 from the United States, and 1 was carried out in both. Only two studies were from Asia (7.33% from Kelantan, Malaysia and 6.60% from Singapore) (Pang et al., 2007; Selladurai et al., 1992) and one from Latin America (0.68% from Rosario, Argentina) (Petroni et al., 2010). No study has reported the prevalence in Africa. Only 2 of the 21 studies were from developing countries (7.33% from Kelantan, Malaysia and 0.68% from Rosario, Argentina) (Petroni et al., 2010; Selladurai et al., 1992) The overall prevalence in developing countries is 6.3%, which is higher than the overall prevalence of 2.8% in developed countries. The quality and availability of emergency and intensive care services differs among different regions. Patients with sTBI, compared to patients with mild or moderate injury, are more prone to entering PVS. In places with advanced emergency and intensive care services, such patients are more likely to live to their sixth month after injury. In contrast, more sTBI patients die in a short period of time in regions with poor medical resources. Therefore, the prevalence of PVS is higher in regions with advanced emergency and intensive care services than in areas with poor medical conditions.
Moreover, a country’s policies towards end-of-life patients, ethics, and cultural atmosphere influence relatives’ attitudes and decisions. The Netherlands is the first country in the world to permit euthanasia; it is legal in this country to withdraw life-sustaining medical treatment, artificial nutrition, and hydration in patients in PVS when there is little possibility of them recovering consciousness (Gevers, 2005). Therefore, fewer PVS patient’s can be supported to the sixth month. In contrast, most Asians will not give up medical treatment of their relatives if it is economically viable. This difference may contribute to the fact that studies from the Netherlands report a lower prevalence of PVS and that the two studies from Asian countries reported a higher prevalence of PVS.
4.2Time
The included studies cover 36 years. We analyzed the prevalence of PVS according to four artificially divided time periods. Prevalence differs among time periods; the prevalence increased over time except for a slight decrease in the time period after 2000. This trend may be explained as follows. First, an aging population and increase in chronic health conditions over time is a worldwide phenomenon. Older age is associated with a worse outcome in patients with sTBI (Braakman, Jennett, & Minderhoud, 1988; Hukkelhoven et al., 2003; Perel et al., 2008; Perel, Edwards, Wentz, & Roberts, 2006; Steyerberg et al., 2008) Second, with emergency and intensive care services improving over time, standardized guidelines being implemented, and rehabilitation medicine advancing, more patients who suffer sTBI have survived and fewer patients who were diagnosed with a PVS die before six months from onset. In addition, there is a high rate of misdiagnosis of VS; MCS patients exhibit discernible behavioral evidence of consciousness but fail to reproduce this behavior consistently, leading to misdiagnosis of a VS in some cases (Andrews, Murphy, Munday, & Littlewood, 1996; Childs, Mercer, & Childs, 1993). No diagnosis criterion for MCS was available until Giacino et al. proposed one in 2002 (Giacino et al., 2002), which may help explain the slight decline in the prevalence after 2000.
4.3Age and sex
In multiple meta-regression analysis, we found no correlation between mean age or gender composition and the prevalence of PVS at six months after injury. The prevalence of PVS at six months after onset may be irrelevant to age and gender in the included studies, but no study has reported the effect of age and sex on the prevalence of PVS. Age probably has an impact on the outcome of TBI because it is an important factor in some models predicting the prognosis after TBI (Boyd, Tolson, & Copes, 1987; Murray et al., 2007; Perel et al., 2008) Thus, the reason for the negative result may be that the number of included studies is limited, and most of the studies have a similar mean age (27–49.3 years) and gender composition (0.698–0.818). These factors make it less likely that a significant result can be drawn from the multiple meta-regression analysis.
The prevalence of diseases forms the basis for clinicians determining their impact. In order to make treatment plans, research the mechanism, and develop policies for the disease, the number of patients it affects needs to be known. VS is often thought of as ‘a fate worse than death’, (Jennett, 1976) and the economic impact of it is enormous, which makes the study of the prevalence of PVS necessary. To the best of our knowledge, no study has previously evaluated the prevalence of PVS at six months after onset among a large population.
However, our study has some limitations. First, the included articles were observational studies, which have potential risk of biases and none of them complying all AHRQ items related to risk of bias. Second, the limitations of behavioral assessment techniques for the diagnosis of VS influence the accuracy of the PVS prevalence reported in the included studies (Giacino et al., 2009). A diagnostic criterion for MCS did not exist until 2002, which may make the prevalence reported in studies before 2002 higher the actual prevalence. Third, all included studies are in English, despite not restricting the language in our search strategy. Most of the included studies are from America and Europe, with none from Africa and only two from developing countries and thus limits the generalizability of our findings to other contexts.
In conclusion, the overall prevalence of PVS at six months after onset over the past four decades is 2.9% (95% CI 0.021–0.040). There has been a trend of a slight increase in PVS prevalence over time, but it is far from significant. Age and gender do not seem to have a significant effect on the prevalence.Further studies are needed to assess the prevalence of PVS at six months after onset with recently available emergency aid and intensive care therapies.
Conflict of interest
The authors have no potential conflicts of interest to disclose.
References
1 | Andrews K. , Murphy L. , Munday R. , & Littlewood C. ((1996) ). Misdiagnosis of the vegetative state: Retrospective study in a rehabilitation unit. Bmj, 313: (7048), 13–16. |
2 | Andriessen T. M. , Horn J. , Franschman G. , van der Naalt J. , Haitsma I. , Jacobs B. , …& Vos P. E. ((2011) ). Epidemiology, severity classification, and outcome of moderate and severe traumatic brain injury: A prospective multicenter study. J Neurotrauma, 28: (10), 2019–2031. doi: 10.1089/neu.2011.2034 |
3 | Boyd C. R. , Tolson M. A. , & Copes W. S. ((1987) ). Evaluating trauma care: The TRISS method. Trauma score and the injury severity score. J Trauma, 27: (4), 370–378. |
4 | Braakman R. , Jennett W. B. , & Minderhoud J. M. ((1988) ). Prognosis of the posttraumatic vegetative state. Acta Neurochir (Wien), 95: (1-2), 49–52. |
5 | Childs N. L. , Mercer W. N. , & Childs H. W. ((1993) ). Accuracy of diagnosis of persistent vegetative state. Neurology, 43: (8), 1465–1467. |
6 | Fearnside M. R. , Cook R. J. , McDougall P. , & McNeil R. J. ((1993) ). The Westmead Head Injury Project outcome in severe head injury. A comparative analysis of pre-hospital, clinical and CT variables. Br J Neurosurg, 7: (3), 267–279. |
7 | Foulkes M. A. , Eisenberg H. M. , Jane J. A. , Marmarou A. , & Marshall L. F. ((1991) ). The Traumatic Coma Data Bank: Design, methods, and baseline characteristics. Journal of Neurosurgery, 75: (SUPPL.), S8–S13. |
8 | Gevers S. ((2005) ). Withdrawing life support from patients in a persistent vegetative state: The law in the Netherlands. Eur J Health Law, 12: (4), 347–355. |
9 | Giacino J. T. , Ashwal S. , Childs N. , Cranford R. , Jennett B. , Katz D. I. , …& Zasler N. D. ((2002) ). The minimally conscious state: Definition and diagnostic criteria. Neurology, 58: (3), 349–353. |
10 | Giacino J. T. , Schnakers C. , Rodriguez-Moreno D. , Kalmar K. , Schiff N. , & Hirsch J. ((2009) ). Behavioral assessment in patients with disorders of consciousness: Gold standard or fool’s gold? Prog Brain Res, 177: , 33–48. doi: 10.1016/s0079-6123(09)17704-x |
11 | Gomez P. A. , Lobato R. D. , Boto G. R. , De la Lama A. , Gonzalez P. J. , & de la Cruz J. ((2000) ). Age and outcome after severe head injury.; discussion. Acta Neurochir (Wien), 142: (4), 380–371. |
12 | Heiden J. S. , Small R. , Caton W. , Weiss M. , & Kurze T. ((1983) ). Severe head injury. Clinical assessment and outcome. Phys Ther, 63: (12), 1946–1951. |
13 | Hukkelhoven C. W. , Steyerberg E. W. , Rampen A. J. , Farace E. , Habbema J. D. , Marshall L. F. , …& Maas A. I. ((2003) ). Patient age and outcome following severe traumatic brain injury: An analysis of 5600 patients. J Neurosurg, 99: (4), 666–673. doi: 10.3171/jns.2003.99.4.0666 |
14 | Humphreys I. , Wood R. L. , Phillips C. J. , & Macey S. ((2013) ). The costs of traumatic brain injury: A literature review. Clinicoecon Outcomes Res, 5: , 281–287. doi: 10.2147/ceor.s44625 |
15 | Jennett B. ((1976) ). Editorial: Resource allocation for the severely brain damaged. Arch Neurol, 33: (9), 595–597. |
16 | Jiang J. Y. ((2013) ). Head trauma in China. Injury, 44: (11), 1453–1457. doi: 10.1016/j.injury.2012.08.045 |
17 | Jourdan C. , Bosserelle V. , Azerad S. , Ghout I. , Bayen E. , Aegerter P. , …& Azouvi P. ((2013) ). Predictive factors for 1-year outcome of a cohort of patients with severe traumatic brain injury (TBI): Results from the PariS-TBI study. Brain Inj, 27: (9), 1000–1007. doi: 10.3109/02699052.2013.794971 |
18 | Judson J. A. , Cant B. R. , & Shaw N. A. ((1990) ). Early prediction of outcome from cerebral trauma by somatosensory evoked potentials. Crit Care Med, 18: (4), 363–368. |
19 | Lannoo E. , Van Rietvelde F. , Colardyn F. , Lemmerling M. , Vandekerckhove T. , Jannes C. , & De Soete G. ((2000) ). Early predictors of mortality and morbidity after severe closed head injury. J Neurotrauma, 17: (5), 403–414. |
20 | Laureys S. , Celesia G. G. , Cohadon F. , Lavrijsen J. , Leon-Carrion J. , Sannita W. G. , …& European Task Force on Disorders of, C. ((2010) ). Unresponsive wakefulness syndrome: A new name for the vegetative state or apallic syndrome. BMC Med, 8: , 68. doi: 10.1186/1741-7015-8-68 |
21 | Le Roux P. ((2013) ). Physiological monitoring of the severe traumatic brain injury patient in the intensive care unit. Curr Neurol Neurosci Rep, 13: (3), 331. doi: 10.1007/s11910-012-0331-2 |
22 | Mamelak A. N. , Pitts L. H. , & Damron S. ((1996) ). Predicting survival from head trauma 24 hours after injury: A practical method with therapeutic implications. J Trauma, 41: (1), 91–99. |
23 | McCauley S. R. , Wilde E. A. , Moretti P. , Macleod M. C. , Pedroza C. , Drever P. , …& Clifton G. L. ((2013) ). Neurological outcome scale for traumatic brain injury: III. Criterion-related validity and sensitivity to change in the NABIS hypothermia-II clinical trial. Journal of neurotrauma, 30: (17), 1506–1511. Retrieved from http://onlinelibrary.wiley.com/o/cochrane/clcentral/articles/263/CN-01000263/frame.html doi:10.1089/neu.2013.2925 |
24 | Murray G. D. , Butcher I. , McHugh G. S. , Lu J. , Mushkudiani N. A. , Maas A. I. , …& Steyerberg E. W. ((2007) ). Multivariable prognostic analysis in traumatic brain injury: Results from the IMPACT study. J Neurotrauma, 24: (2), 329–337. doi: 10.1089/neu.2006.0035 |
25 | Murray G. D. , Teasdale G. M. , Braakman R. , Cohadon F. , Dearden M. , Iannotti F. , …& Unterberg A. ((1999) ). The European Brain Injury Consortium survey of head injuries. Acta Neurochir (Wien), 141: (3), 223–236. |
26 | Murray L. S. , Teasdale G. M. , Murray G. D. , Miller D. J. , Pickard J. D. , & Shaw M. D. ((1999) ). Head injuries in four British neurosurgical centres. Br J Neurosurg, 13: (6), 564–569. |
27 | Myburgh J. A. , Cooper D. J. , Finfer S. R. , Venkatesh B. , Jones D. , Higgins A. , …& Higlett T. ((2008) ). Epidemiology and 12-month outcomes from traumatic brain injury in australia and new zealand. J Trauma, 64: (4), 854–862. doi: 10.1097/TA.0b013e3180340e77 |
28 | Nordstrom C. H. , Messeter K. , Sundbarg G. , & Wahlander S. ((1989) ). Severe traumatic brain lesions in Sweden Part I: Aspects of management in non-neurosurgical clinics. Brain Inj, 3: (3), 247–265. |
29 | Pang B. C. , Kuralmani V. , Joshi R. , Hongli Y. , Lee K. K. , Ang B. T. , …& Ng I. ((2007) ). Hybrid outcome prediction model for severe traumatic brain injury. J Neurotrauma, 24: (1), 136–146. doi: 10.1089/neu.2006.0113 |
30 | Perel P. , Arango M. , Clayton T. , Edwards P. , Komolafe E. , Poccock S. , …& Yutthakasemsunt S. ((2008) ). Predicting outcome after traumatic brain injury: Practical prognostic models based on large cohort of international patients. Bmj, 336: (7641), 425–429. doi: 10.1136/bmj.39461.643438.25 |
31 | Perel P. , Edwards P. , Wentz R. , & Roberts I. ((2006) ). Systematic review of prognostic models in traumatic brain injury. BMC Med Inform Decis Mak, 6: , 38. doi: 10.1186/1472-6947-6-38 |
32 | Petroni G. , Quaglino M. , Lujan S. , Kovalevski L. , Rondina C. , Videtta W. , …& Chesnut R. ((2010) ). Early prognosis of severe traumatic brain injury in an urban argentinian trauma center. J Trauma, 68: (3), 564–570. doi: 10.1097/TA.0b013e3181ce1eed |
33 | PVS T. M.-S. T. F. O. ((1994) ). Medical aspects of the persistent vegetative state. New England Journal of Medicine, 330: (21), 1499–1508. doi: 10.1056/NEJM199405263302107 |
34 | Rusnak M. , Janciak I. , Majdan M. , Wilbacher I. , & Mauritz W. ((2007) ). Severe traumatic brain injury in Austria I: Introduction to the study. Wien Klin Wochenschr, 119: (1-2), 23–28. doi: 10.1007/s00508-006-0760-5 |
35 | Sanderson S. , Tatt I. D. , & Higgins J. P. ((2007) ). Tools for assessing quality and susceptibility to bias in observational studies in epidemiology: A systematic review and annotated bibliography. Int J Epidemiol, 36: (3), 666–676. doi: 10.1093/ije/dym018 |
36 | Selladurai B. M. , Jayakumar R. , Tan Y. Y. , & Low H. C. ((1992) ). Outcome prediction in early management of severe head injury: An experience in Malaysia. Br J Neurosurg, 6: (6), 549–557. |
37 | Steyerberg E. W. , Mushkudiani N. , Perel P. , Butcher I. , Lu J. , McHugh G. S. , …& Maas A. I. ((2008) ). Predicting outcome after traumatic brain injury: Development and international validation of prognostic scores based on admission characteristics. PLoS Med, 5: (8), e165; discussion e165. doi: 10.1371/journal.pmed.0050165 |
38 | Stranjalis G. , Bouras T. , Korfias S. , Andrianakis I. , Pitaridis M. , Tsamandouraki K. , …& Marmarou A. ((2008) ). Outcome in 1,000 head injury hospital admissions: The Athens head trauma registry. J Trauma, 65: (4), 789–793. doi: 10.1097/TA.0b013e3181469e26 |
39 | Stroup D. F. , Berlin J. A. , Morton S. C. , Olkin I. , Williamson G. D. , Rennie D. , …& Thacker S. B. ((2000) ). Meta-analysis of observational studies in epidemiology: A proposal for reporting. Meta-analysis Of Observational Studies in Epidemiology (MOOSE) group. Jama, 283: (15), 2008–2012. |
40 | Turazzi S. , Bricolo A. , & Pasut M. L. ((1984) ). Review of 1,000 consecutive cases of severe head injury treated before the advent of CT scanning. Acta Neurochir (Wien), 72: (3-4), 167–195. |
41 | Turazzi S. , Bricolo A. , Pasut M. L. , & Formenton A. ((1987) ). Changes produced by CT scanning in the outlook of severe head injury. Acta Neurochir (Wien), 85: (3-4), 87–95. |
42 | Zeng X. , Zhang Y. , Kwong J. S. , Zhang C. , Li S. , Sun F. , …& Du L. ((2015) ). The methodological quality assessment tools for preclinical and clinical studies, systematic review and meta-analysis, and clinical practice guideline: A systematic review. J Evid Based Med, 8: (1), 2–10. doi: 10.1111/jebm.12141 |
Figures and Tables
Fig.1
Flow chart for literature search.
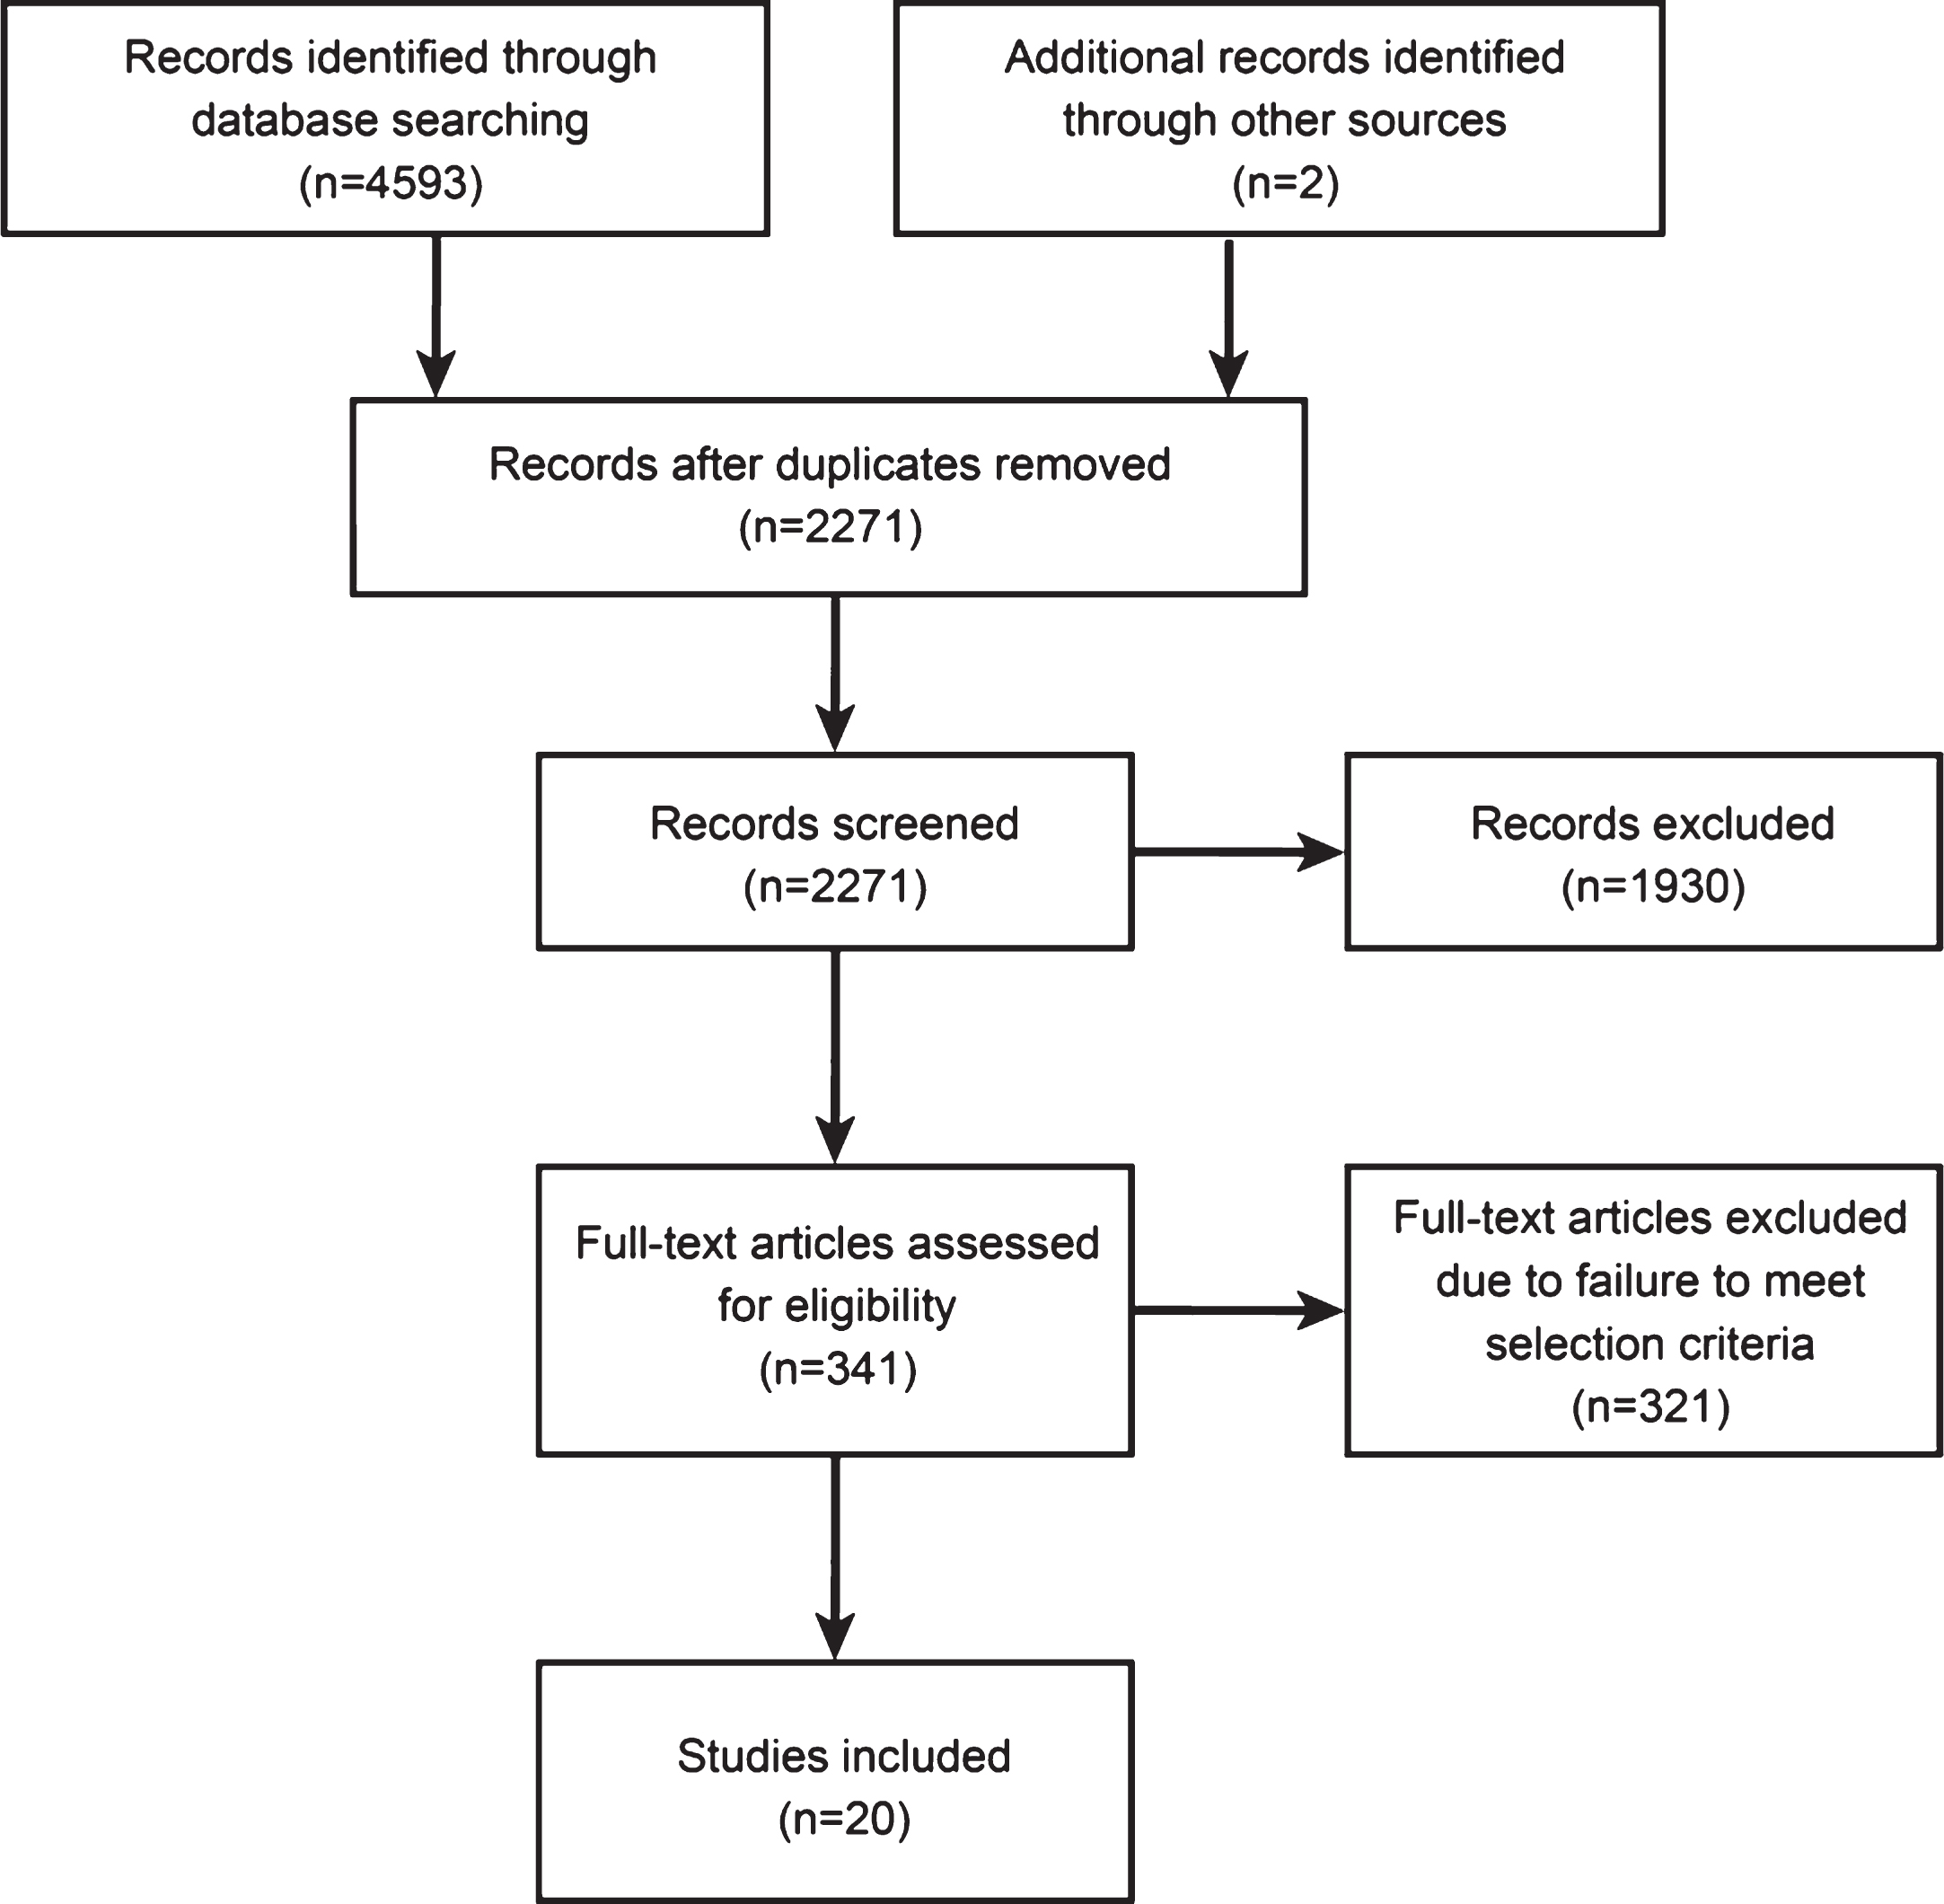
Fig.2
The prevalence of PVS and its trend over the past four decades.
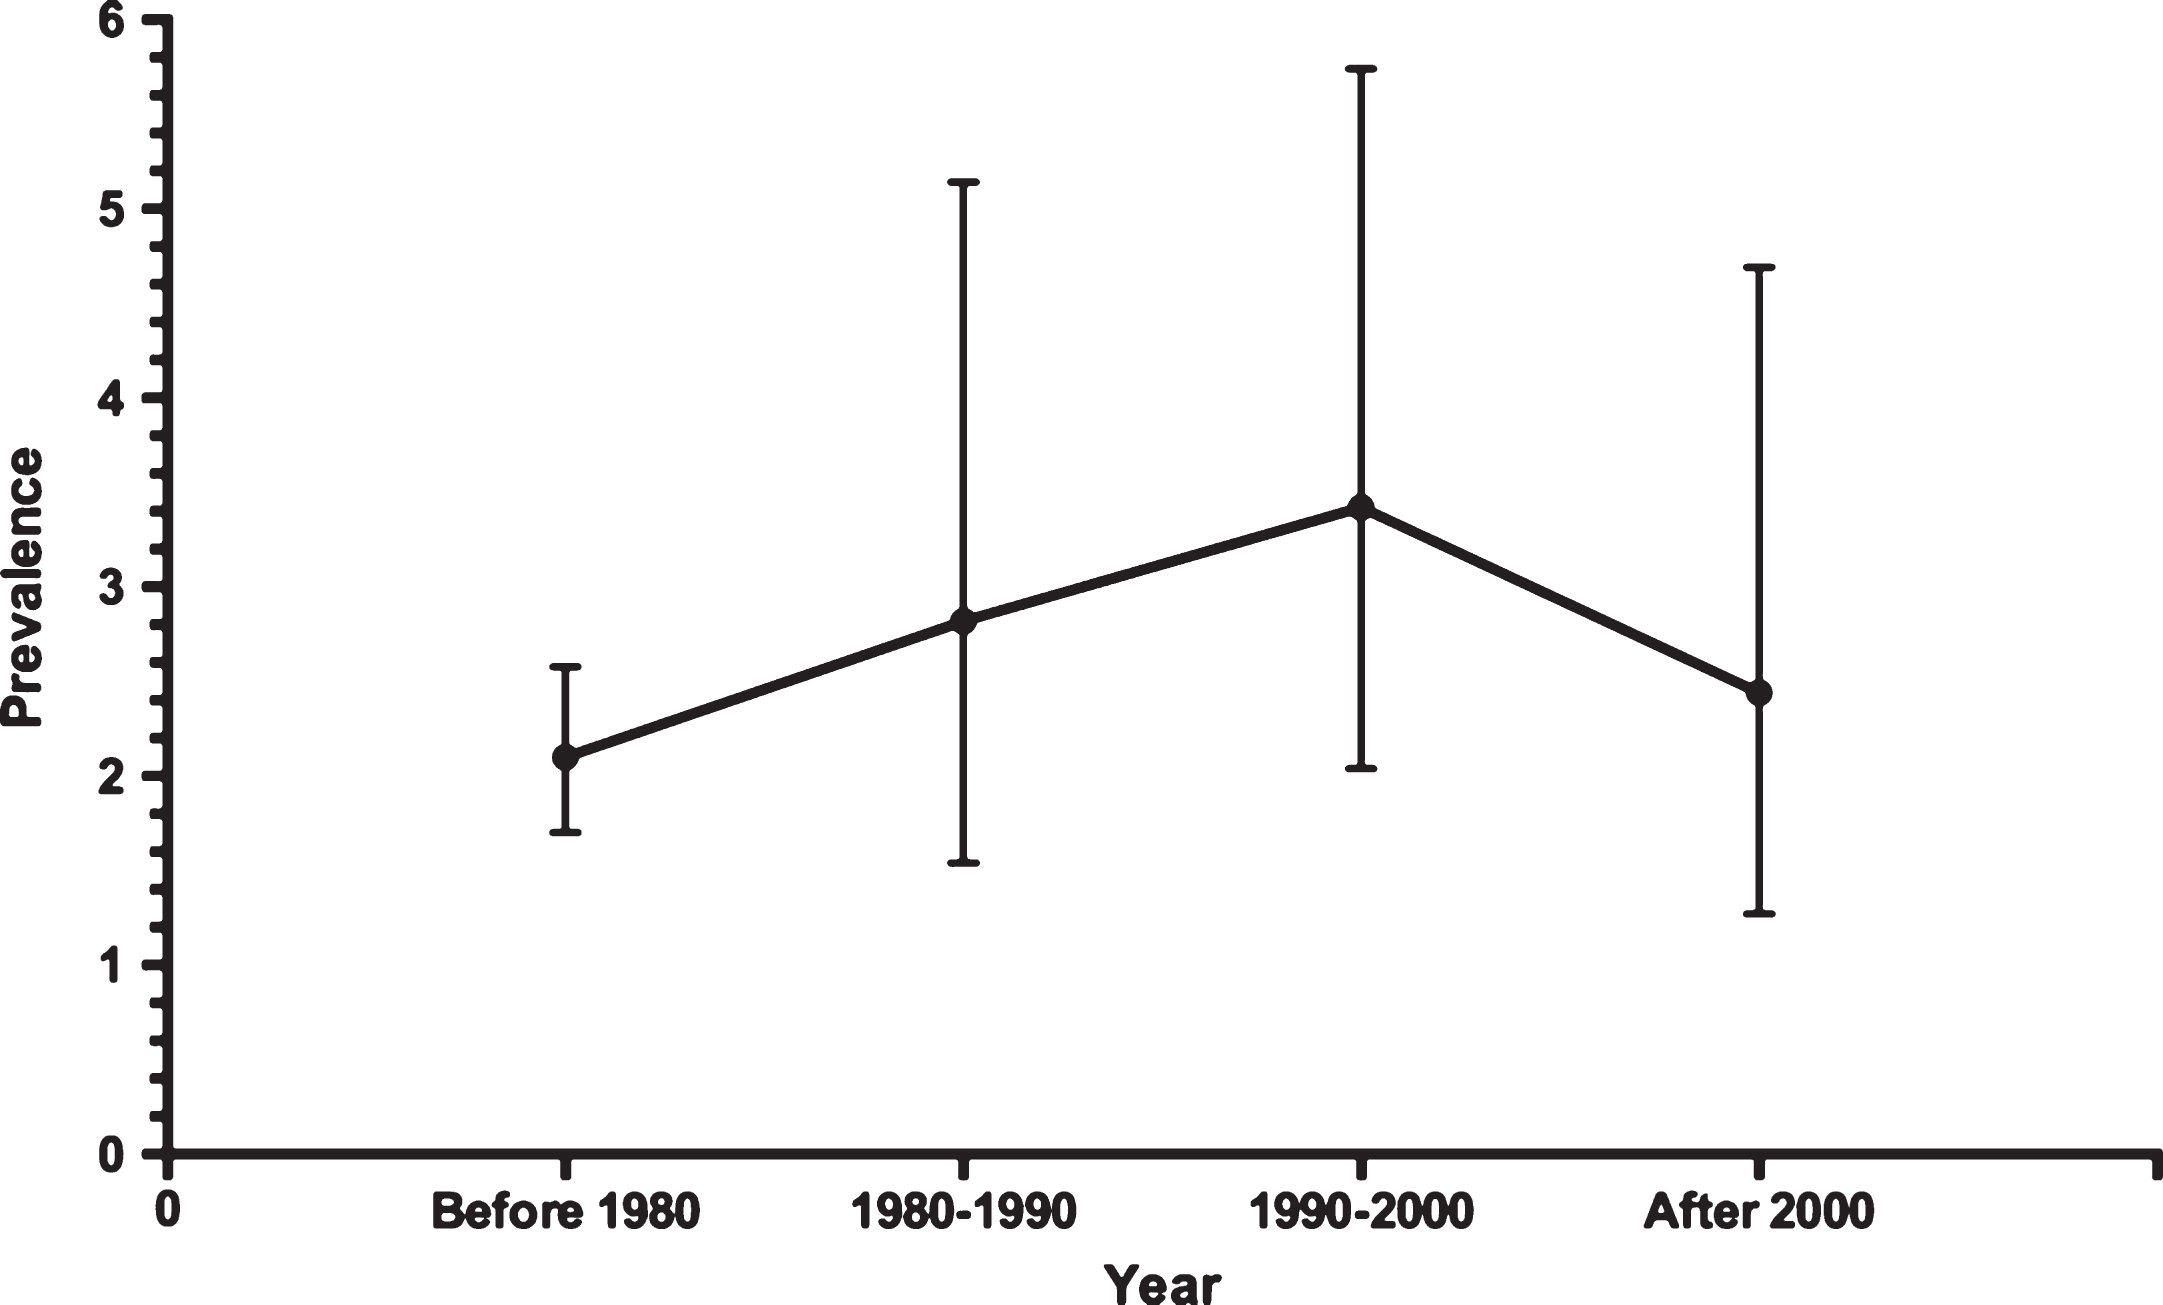
Fig.3
The forest plots displaying prevalence of PVS over the past four decades.
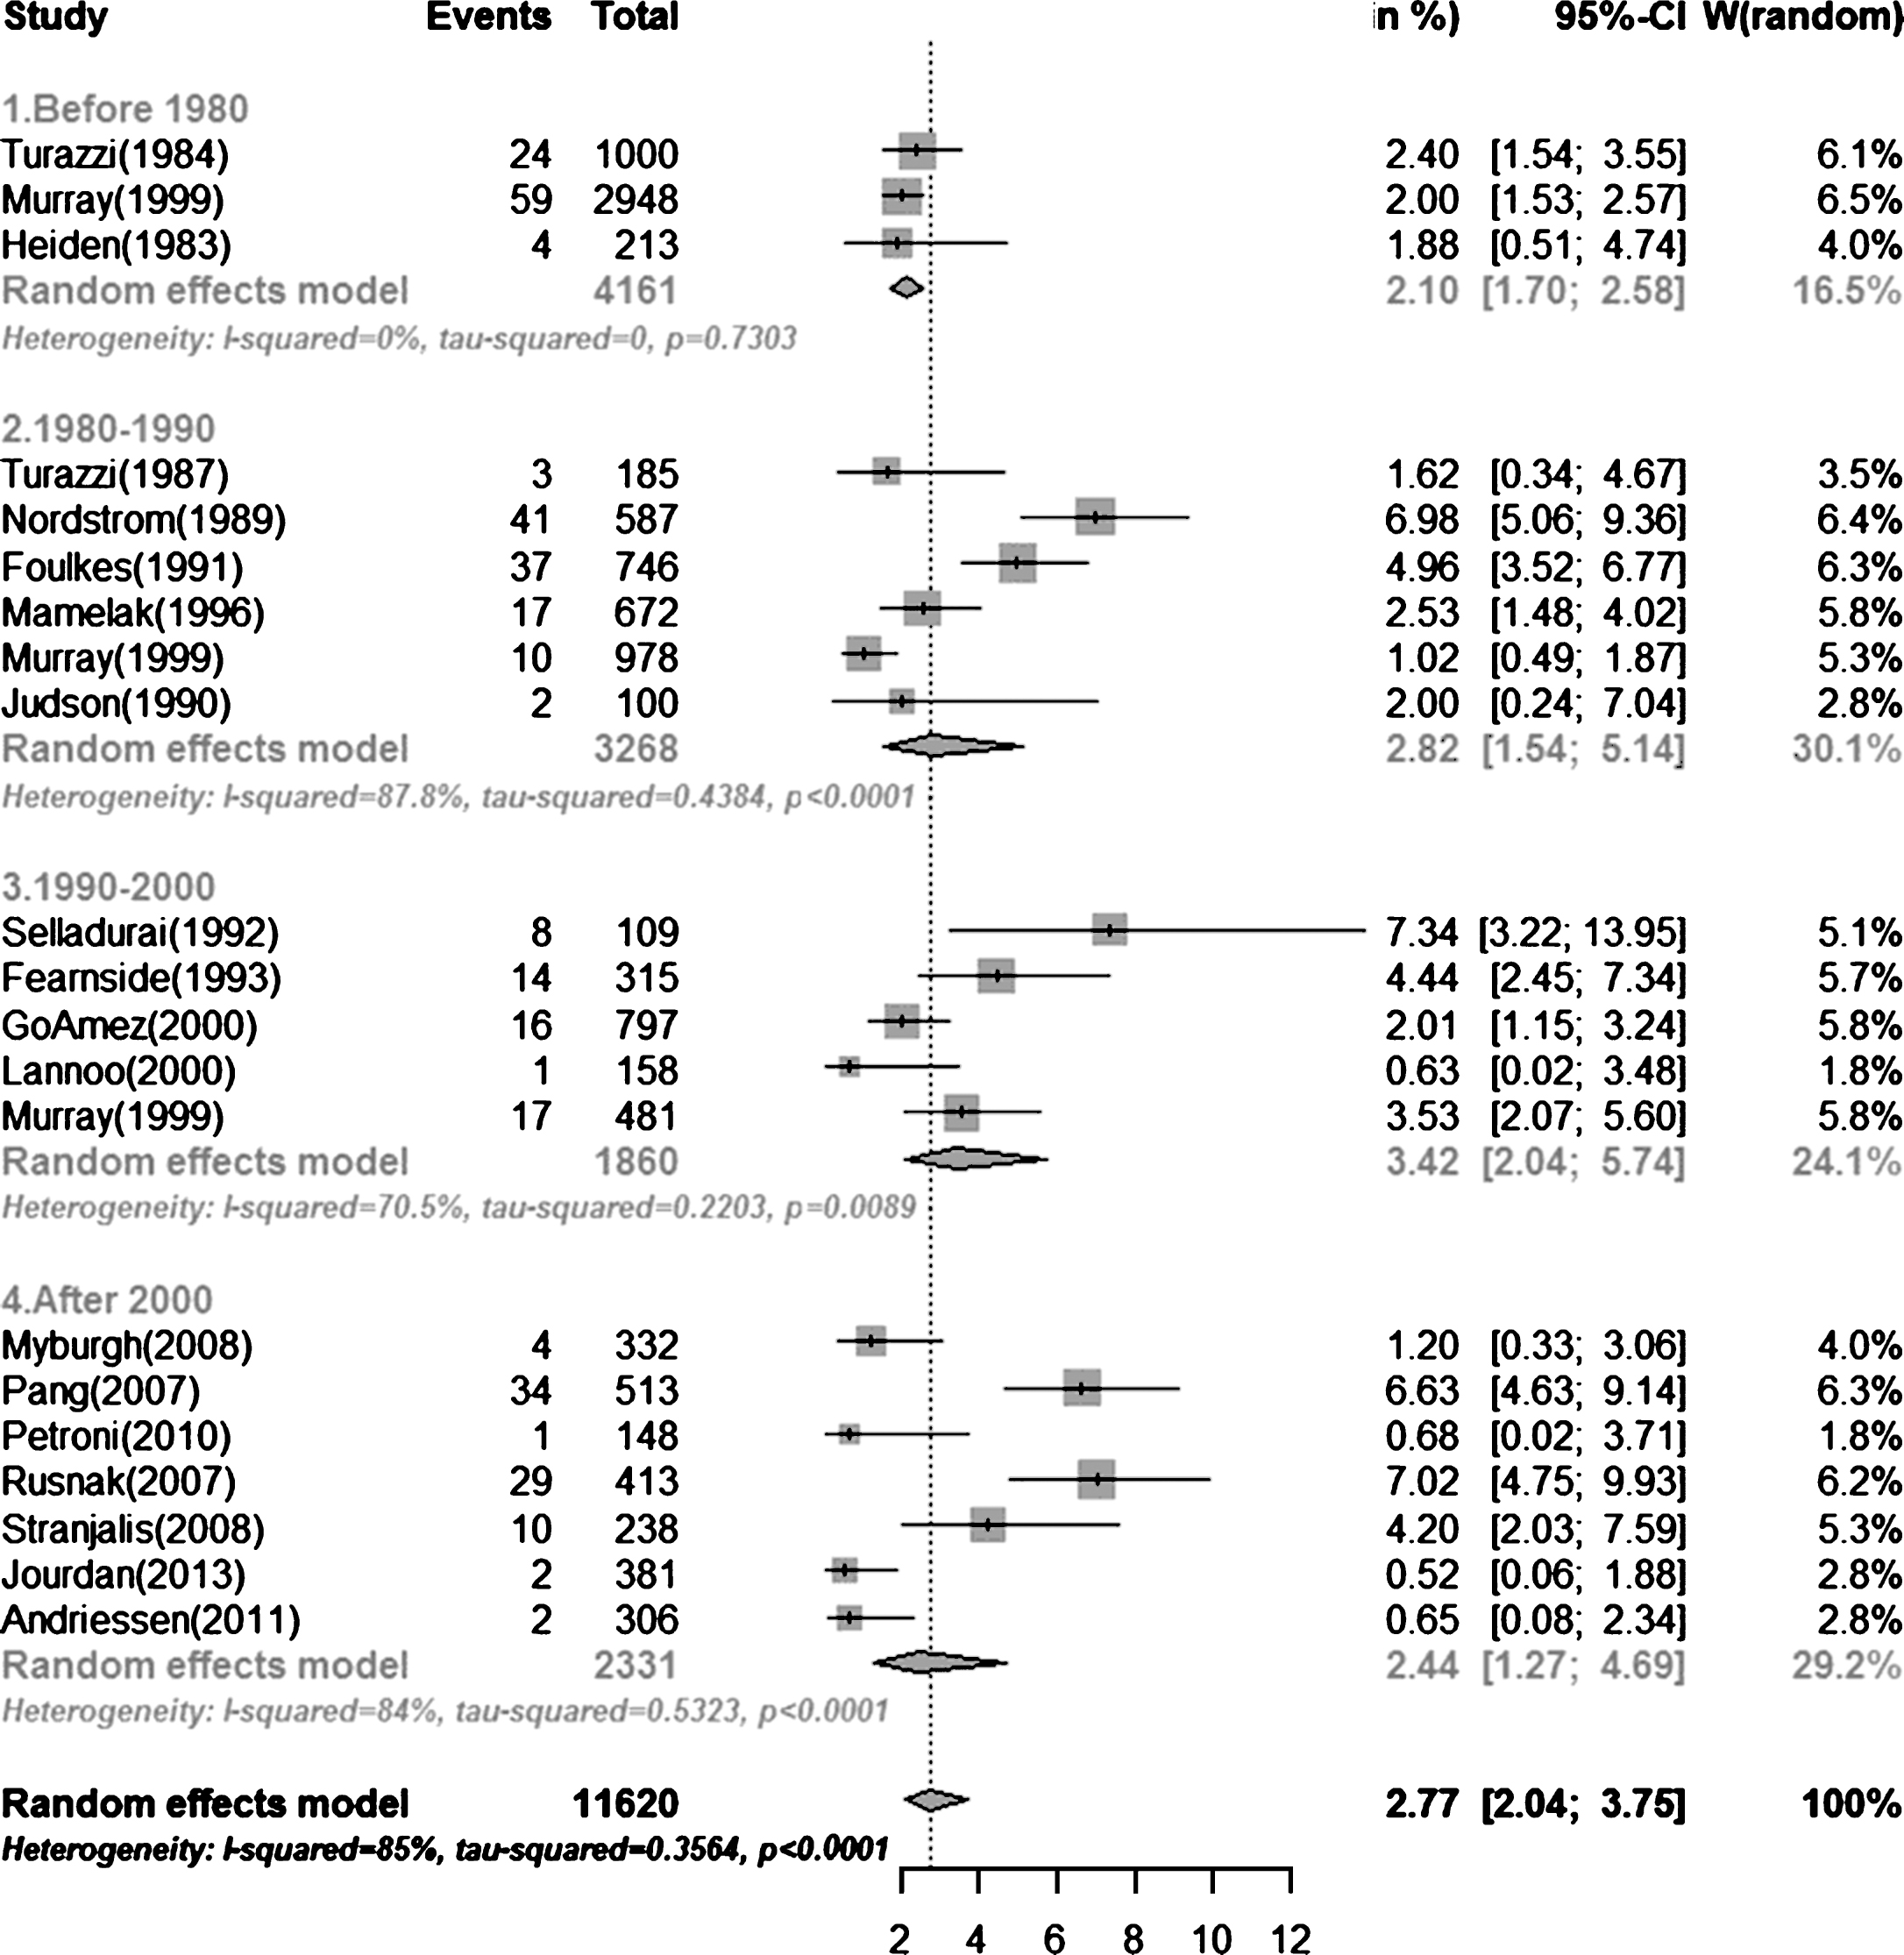
Table 1
Studies included in the analysis
| Publication | Author | Centers | Localization | Study | Mid- | Patients with | Age limitation | Mean Age | Male (%) | Follow-up | Follow-up | Patients | Incidence |
| Year | period | cohort | STBI | (Year) | (Year) | rate | with PVS | of PVS | |||||
| 1984 | Turazzi | 1 | Verona, Italy | 1973–1976 | 1975 | 1000 | any | 34 | 0.77 | 1000 | 100% | 24 | 2.40% |
| 1999 | Murray GD | 5 | UK, Netherlands, USA | 1968–1985 | 1977 | 2978 | any | 36 | 0.79 | n.a. | 99% | n.a. | 2.00% |
| 1983 | Heiden | 1 | Los Angeles, USA | 1974–1983 | 1979 | 213 | any | 35 | n.a. | 213 | 100% | 4 | 1.88% |
| 1987 | Turazzi | 1 | Verona, Italy | 1979–1980 | 1980 | 385 | any | 33 | 0.78 | 385 | 100% | 3 | 0.78% |
| 1989 | Nordström | 1 | Lund, Sweden | 1977–1984 | 1981 | 587 | any | n.a. | 0.698 | 587 | 100% | n.a. | 7.00% |
| 1991 | Foulkes | 6 | USA | 1984–1987 | 1986 | 746 | any | 29 | 0.77 | n.a. | 100% | n.a. | 5.00% |
| 1996 | Mamelak | 1 | San Francisco, USA | 1978–1993 | 1986 | 672 | any | n.a. | 0.794 | 672 | 100% | 17 | 2.52% |
| 1999 | Murray LS | 4 | Glasgow/Edinburgh/Liverpool/ | 1986–1988 | 1987 | 988 | any | 34 | 0.75 | 976 | 99% | n.a. | 1.00% |
| Southampton, UK | |||||||||||||
| 1990 | Judson | 1 | Auckland Hospital, New Zealand | 1987–1990 | 1989 | 100 | any | n.a. | 0.73 | 100 | 100% | 2 | 2.00% |
| 1992 | Selladurai | 1 | Kelantan, Malaysia | 1989–1991 | 1990 | 109 | any | 28.5 | n.a. | 109 | 100% | 8 | 7.33% |
| 1993 | Fearnside | 1 | Sydney, Australia | 1990–1992 | 1991 | 315 | any | 27 | 0.76 | 315 | 100% | 14 | 4.44% |
| 2000 | Go mez | 1 | Madrid, Spain | 1987–1996 | 1992 | 810 | > = 14 | n.a. | 0.78 | 797 | 98.40% | 16 | 2.00% |
| 1999 | Murray GD | 67 | Mutiple countries, Europe | 1995 | 1995 | 583 | > = 16 | 41 | 0.73 | 481 | 83% | 17 | 3.53% |
| 2000 | Lannoo | 1 | Gent,Belgium | 1993–1996 | 1995 | 158 | >15 | 43 | 0.715 | 158 | 100% | 1 | 0.63% |
| 2008 | Myburgh | 16 | Australia, New Zealand | 2000 | 2000 | 363 | any | 39.2 | 0.741 | 332 | 92% | 4 | 1.20% |
| 2007 | Pang | 1 | Singapore | 1999–2003 | 2001 | 513 | any | 44.4 | 0.791 | 513 | 100% | 34 | 6.60% |
| 2007 | Rusnak | 5 | Austria | 1999–2004 | 2002 | 492 | any | 49.3 | 0.72 | n.a. | 84% | n.a. | 7.00% |
| 2008 | Stranjalis | 1 | Athens, Greece | 2000–2003 | 2002 | 260 | >14 | n.a. | n.a. | 250 | 96% | n.a. | 4.20% |
| 2010 | Petroni | 1 | Rosario, Argentina | 2000–2003 | 2002 | 148 | > = 12 | 34 | 0.818 | 148 | 100% | 1 | 0.68% |
| 2013 | Jourdan | multi | Paris, France | 2005–2007 | 2006 | 504 | > = 15 | 42 | 0.77 | 381 | 76% | 2 | 0.52% |
| 2011 | Andriessen | 5 | Netherlands | 2008–2009 | 2009 | 339 | > = 16 | 46.1 | 0.702 | 288 | 85% | 2 | 0.69% |
Table 2
AHRQ* quality assessment criteria for observational studies
| 1 | 2 | 3 | 4 | 5 | 6 | 7 | 8 | 9 | 10 | 11 | |
| Turazzi et al., 1984 | Y | Y | Y | U | U | N | N | N | N | Y | Y |
| Murray GD et al., 1999 | Y | Y | Y | U | U | N | N | N | N | Y | Y |
| Heiden et al., 1983 | Y | Y | Y | Y | U | N | Y | N | N | Y | Y |
| Turazzi et al., 1987 | Y | Y | Y | U | U | N | N | N | N | Y | Y |
| Nordström et al., 1989 | Y | Y | Y | Y | U | N | Y | N | N | Y | Y |
| Foulkes et al., 1991 | Y | Y | Y | U | U | N | N | N | N | Y | Y |
| Mamelak et al., 1996 | Y | Y | Y | U | N | N | Y | Y | N | Y | Y |
| Murray LS et al., 1999 | Y | Y | Y | U | U | Y | N | N | Y | Y | Y |
| Judson et al., 1990 | Y | Y | Y | Y | U | N | N | N | N | Y | Y |
| Selladurai et al., 1992 | Y | Y | Y | Y | U | N | Y | N | N | Y | Y |
| Fearnside et al., 1993 | Y | Y | Y | Y | U | N | Y | N | N | Y | Y |
| Gomez et al., 2000 | Y | Y | Y | Y | U | N | Y | N | N | Y | Y |
| Murray GD et al., 1999 | Y | Y | Y | U | U | N | N | N | Y | Y | Y |
| Lannoo et al., 2000 | Y | Y | Y | U | U | N | Y | N | N | Y | Y |
| Myburgh et al., 2008 | Y | Y | Y | U | U | Y | N | N | Y | Y | Y |
| Pang et al., 2007 | Y | Y | Y | U | U | N | N | N | N | Y | Y |
| Rusnak et al., 2007 | Y | Y | Y | U | U | N | N | N | N | Y | Y |
| Stranjalis et al., 2008 | Y | Y | Y | Y | U | N | N | N | N | Y | Y |
| Petroni et al., 2010 | Y | Y | Y | U | U | N | Y | N | N | Y | Y |
| Jourdan et al., 2013 | Y | Y | Y | U | U | N | N | N | N | Y | Y |
| Andriessen et al., 2011 | Y | Y | Y | U | U | N | Y | N | N | Y | Y |
*AHRQ: Methods Guide for Effectiveness and Comparative Effectiveness Reviews. AHRQ Publication No. 10(14)-EHC063-EF. Rockville, MD: Agency for Healthcare Research and Quality. January 2014. Chapters available at: www.effectivehealthcare.ahrq.gov. 1. Defined the source of information (survey, record review). 2. Listed inclusion and exclusion criteria for exposed and unexposed subjects or refer to previous publications. 3. Indicated time period used for identifying patients. 4. Indicated whether or not subjects were consecutive if not population-based. 5. Indicated if evaluators of subjective which incomplete data or follow-up was obtained. 6. Described any assessments undertaken for quality assurance purposes (e.g., test/retest of primary outcome measurements). 7. Explained any patient exclusions from analysis. 8. Described how confounding was assessed and/or controlled. 9. If applicable, explained how missing data were handled in the analysis. 10. Summarized patient response rates and Y completeness of data collection. 11. Clarified what follow-up, if any, was NA expected and the percentage of patients for which incomplete data or follow-up was obtained.
Table 3
Sensitivity analysis
| Types of studies included in | Statistical Model | No. of Studies | Prevalence Proportion, % (95% CI) |
| sensitivity analysis | |||
| Studies in developed countries | Random | 19 | 2.69 (1.96–3.69) |
| Studies in developing countries | Random | 2 | 2.70 (0.26–23.06) |
| Single-center studies | Random | 13 | 3.24 (2.25–4.64) |
| Multicenter studies | Random | 8 | 2.15 (1.23–3.72) |


