
Co-expression of galectin-3 and vimentin in triple negative breast cancer cells promotes tumor progression, metastasis and survival
Abstract
BACKGROUND:
Lack of druggable targets and complex expression heterogeneity of known targets is common among TNBC subtypes. An enhanced expression of galectin-3 in TNBCs has already been documented. We have observed a tumor progression-dependent galectin-3 expression in TNBCs compared to adjacent epithelium and non TNBCs.
OBJECTIVE:
To unravel the association of galectin- 3 in tumor progression, aggressiveness and drug resistance in TNBC patients.
METHODS:
Galectin-3 expression in 489 breast cancer tissues was correlated with clinicopathological features and the results were validated in cell lines and mouse model by silencing galectin-3 using shRNA and the proteins were profiled by western blot and qRT-PCR. Protein interaction was analyzed by GFP Trap and Mass spectrometry.
RESULTS:
Galectin-3 expression correlated with tumor stage in TNBC and a lower galectin-3 expression was associated with poor patient survival. The positive correlation between galectin-3, vimentin and CD44 expression, pinpoints galectin-3 contribution to epithelial to mesenchymal transition, drug resistance and stemness. Vimentin was found as an interacting partner of galectin-3. Duplexing of galecin-3 and vimentin in patient samples revealed the presence of tumor cells co-expressing both galectin-3 and vimentin. In vitro studies also showed its role in tumor cell survival and metastatic potential, elementary for tumor progression. In vivo studies further confirmed its metastatic potential.
CONCLUSIONS:
Tumor progression dependent expression pattern of galectin 3 was found to indicate prognosis. Co-expression of galectin-3 and vimentin in tumor cells promotes tumor dissemination, survival and its metastatic capability in TNBCs.
1Introduction
An increased incidence of Triple Negative Breast Cancers (TNBCs) of about 25–30% has been reported in India compared to that seen in western population [1]. Even though defined based on the lack of expression of ER (Estrogen receptor), PR (Progesterone receptor), and HER2 (Human epidermal growth factor receptor2) markers, TNBC is a highly heterogenic group with unpredictable prognosis. Due to the lack of specific molecular targets, the vast majority of these tumors are treated with chemotherapeutic agents, such as anthracyclins and taxanes [2]. About 50% of these patients with residual disease will rapidly relapse with frequent metastases to brain and lungs and only less than 60% of these patients are reported to have a three-year overall survival [3, 4]. High recurrence rate, metastasis and drug resistance are responsible for the poor prognosis of this subgroup [5]. Considerable efforts have been made to elucidate the specific molecular and cellular mechanism underlying the chemoresistance and metastatic potential of TNBC. The dynamic interaction of tumor cells with their microenvironment favors the selection of preexisting resistant cells as well as the emergence of new resistant cells exhibiting epithelial to mesenchymal transition (EMT) and cancer stem cell traits [6–8]. Several signaling pathways, such as Transforming Growth Factor- β (TGF- β), Notch, Wnt/ β -catenin, Hh (hedgehog) and common cancer-related intrinsic pathways Nuclear Factor-kappa B (NF-kB), Phosphoinositide 3-kinase (PI3K)/(AKT)/mechanistic target of rapamycin (mTOR), have been considered as drivers of chemoresistance [9] and are targets of many of the ongoing clinical trials [10, 11].
Galectins are a family of low molecular weight, galactoside-specific lectins with functions in cell activation, cell growth, cell-cell and cell-matrix adhesion, including binding to carcinoembryonic antigen, laminin and metalloproteinase [12]. Earlier we have reported a lower expression of galectin-3 in advanced stage breast cancers that predicts axillary lymph node metastasis in a limited number of samples [13]. A potential role for galectin-3 in driving tumorigenesis was also reported in TNBC [14]. However, the progressive level of expression of galectin-3 in different stages of breast cancer and its importance in tumor progression and stemness needs to be further elucidated. In the current study, we found that even though galectin-3 was overexpressed in early-stage tumors, its expression was found to be lowering in advanced stages of TNBCs, whereas the higher expression was found to be retained in metastatic deposits. In vitro and in vivo studies clearly indicated that overexpressed intracytoplasmic galectin-3 during early stages promotes tumor progression through EMT by interacting with vimentin, and this is the first report showing vimentin as the active partner of galectin-3 in breast cancer progression.
2Materials and methods
2.1Patient samples
A total of 489 breast cancer patients were recruited for the study, after obtaining approval from the Human Ethics Committee of Regional cancer centre, Thiruvananthapuram (HEC No. 29/2014). The breast cancer patients included were not subjected to any chemotherapy treatments. Tissue samples were collected from patients who have undergone modified radical mastectomy in the Surgical Oncology Division of the Regional Cancer Centre (RCC) after obtaining informed consent. A sample of the tumor tissue as well as of benign adjacent epithelium were collected and kept deep frozen (– 70°C) for molecular studies. Separate fragments of tumor tissue and adjacent epithelium were processed for paraffin embedding and block preparation. Clinical data of each patient was obtained from respective clinical record. Haematoxylin and eosin sections were prepared from each block before immunohistochemical analysis to confirm the presence of tumor. Similarly, the presence of tumor in tissue samples selected for western blotting was assessed on imprint smears from the cut surface of the tissue.
2.2Cell lines
All breast cancer cell lines were obtained from the American Type Culture Collection (ATCC). Human cancer cell lines representing TNBC such as MDA-MB-231 and Luminal breast cancer such as MCF-7 were cultured in Dulbecco’s modified Eagle’s medium (DMEM) (gibco®) supplemented with 10% fetal bovine serum (FBS) (gibco®), 100 U/ml penicillin, 100 μg/ml streptomycin and maintained in a 37°C atmosphere with 5% carbon dioxide.
2.3Chemicals and antibodies
The drugs used for the study were Camptothecine (1 μM or 10 μg/ml), Staurosporine (500 nM), Cisplatin (50 μg/ml) and Etoposide (25 μM). Monoclonal antibodies against Galectin-3 (# D412R), Vimentin (# D21H3), E-cadherin (# 24E10), Slug (# C19G7), GAPDH (# 14C10), CD44(# 156-3C11), PARP (# 9542), secondary anti-rabbit IgG HRP-linked antibody (# 7074) and anti-mouse IgG HRP-linked antibody (# 7076S) were purchased from Cell Signaling Technology, Inc. (Beverly, MA) and CD24 (# 14-0242) was from e-bioscience, whereas monoclonal antibody beta-actin (# SC4778) were purchased from Santa Cruz Biotechnology.
2.4Immunohistochemistry (IHC)
For immunostaining of tissue samples, the standard ABC method using the kit from (MACH4 Universal HRP-polymer detection system, Biocare Medical, CA) was used as per a standardized protocol. Briefly, 4 μm sections on 3-aminopropyl triethoxysilane (APES)-coated slides were deparaffinized in xylene and rehydrated through descending grades of alcohol and water. Antigens were retrieved using 10 mM citrate buffer (pH-6) or 1 mM EDTA (pH-8), depending on antibodies used. Further steps were carried out using IHC kit according to the manufacturer’s instructions. Finally, slides were developed with 0.05% 3′, 3-diaminobenzidine tetra hydrochloride and counterstained with Modified Harris haematoxylin. Immunoexpressions were assessed semi quantitatively with uniform grading as absence of staining (0 = negative, 1+ = light, 2+ = moderate, 3+ = intense, 4+ = heavy). Two sections from each sample were immunostained and scored separately. Finally, H-scores were calculated by multiplying intensity score (0 = negative, 1+ = light, 2+ = moderate, 3+ = intense, 4+ = heavy) with the percentage of stained tumor cells [13]. The mean H-score was considered for statistical analysis. H-score up to 40 was considered as negative, 41–1501 as low expression and a score above 1502 as high expression. ER and PR were assessed using Allred scoring system. A score of 0–2 was regarded as negative, while 3–8 as positive. A score of 0–2+ for HER2 protein was considered negative, whereas a score of 3+ and above was positive.
2.5Dual staining
For dual staining, first we carried out the procedures till antigen retrieval using IHC standard protocol as described above. Further steps were carried out using ImmPRESS Duet Staining Polymer Kit (# MP7724). Sections were blocked using BLOXALL blocking solution. After TBST wash, sections were incubated with 2.5% Normal Horse Serum. After overnight incubation with primary antibody (1:100), the sections were washed and incubated with ImmPRESS duet reagent. Sections were then stained using ImmPACT DAB EqV substrate until desired stain intensity developed. After washing with TBST, Vector Blue substrate (# SK-5300) was added and incubated for one hour in dark. After appropriate wash with TBST, the sections were finally mounted in glycerol-PBS and viewed under microscope.
2.6Stable transfections for silencing and over expression of galectin-3
The transfection grade shRNA plasmids for LGALS3 and control shRNA were obtained from Sigma (LGALS3 mission shRNA # TRCN0000029305 and Mission shRNA # SHC001). For the over expression of hGal-3, the expression vector pEGFP-hGal-3 (# 73080) was procured from Addgene. Transfection grade plasmids were prepared using Qiagen Plasmid Midi kit (# 12143, Qiagen GmbH, MD) as per the manufacturer’s instructions. Cells were transfected with the galectin-3 shRNA, non-targeting control shRNA and overexpression vector using Lipofectaminetrademark LTX Reagent with PLUStrademark Reagent (# 15338100, Thermo Fischer Scientific) as per the manufacturer’s protocol. After transfection, stable clones expressing the galectin-3 shRNA and pEGFP-hGal-3 were isolated by selecting the cells in 2.5 pg/μl puromycin (# A1113803, Gibco) for shRNA and 800 μg/ml G418 (# 11811031, Thermo Fischer Scientific) for pEGFP-hGal-3 containing media for two to three weeks.
2.7Protein extraction and Western blotting
Protein lysates extracted using the Phospholysis buffer supplemented with protease inhibitor cocktail (# HY-K001, MedChemExpress) were denatured with sample loading buffer for 10 min at 95°C. Total cellular proteins (40–80 μg) were separated on 10% SDS-PAGE gel and then electro-transferred onto a 0.2 μm PVDF membrane (# GE10600021, Amershamtrademark Hybond® P). The protein blotted membrane was then blocked and treated with primary and secondary antibodies. GAPDH and beta-actin were used as loading control. Finally, horseradish peroxidase (HRP)-conjugated secondary antibodies were detected using the enhanced Piercetrademark ECL Western Blotting Substrate (# 32106, Thermo Fischer Scientific).
2.8Quantitative real-time PCR (q RT-PCR)
Whole cellular RNA was extracted from cell lines using High Pure RNA Tissue Kit (# 12033674001, Roche Diagnostics GmbH, Germany). One microgram of RNA was taken for cDNA synthesis using Transcriptor First Strand cDNA Synthesis kit (# 04379012001, Roche Diagnostics GmbH, Germany). cDNA was then finally used for q-PCR analysis using SYBR green chemistry (# 04707516001, LightCycler® 480 SYBR Green I Master, Roche Diagnostics GmbH, Germany) in the LightCycler® 480 System (Roche Diagnostics GmbH, Germany). Primers were designed using Primer 3, sequences are listed in the Supplementary Table 1.
2.9Wound healing assay
Cells were seeded in a 12 well plate and after reaching confluency, a wound was made using a sterile 10 μl tip. Detached cells were washed off using 1X PBS. Cells were imaged and then allowed to grow for next 24 h in Opti-MEM® I Reduced Serum Medium serum ((# 31985062, Thermo Fischer Scientific). Images were then recorded at 0, 6, 12 and 24 h after scratching.
2.10Quantification of apoptosis using flow cytometry
Apoptosis in galectin-3 expressed and silenced MDA-MB-231 cells were quantified via flow cytometry using Annexin V-FITC/PI assay (# 556547, BD Biosciences) and TMRM (tetra methyl rhodamine methyl ester) staining (# T-668, Molecular Probes). A total of 10,000 events were collected from each sample using a flow cytometer (BD FACS Ariatrademark III), and analyzed using FACS Diva software. Annexin V-FITC/PI assay was done according to manufacturer’s protocol. For analyzing the mitochondrial transmembrane potential of cells using TMRM staining, cells after treatment with drugs were harvested by trypsinization and washed with 1X PBS. Then cells were incubated in RPMI media supplemented with TMRM stain (25 nM) at 37°C for 5–10 min before flow cytometric analysis. The TMRM is a cell-permeant cationic red-orange fluorescent dye that is readily sequestered by active mitochondria. The signal has absorption/emission maxima of 548/574 nm.
2.11CD44+/CD24- assay
For CD44+/CD24- assay, MDA-MB-231 and galectin-3-silenced MDA-MB-231 cells (1×10⁶ cells) were grown on 60 mm dishes and trypsinized at 80% confluency. Cell pellets were incubated at 37°C for 40 minutes with both 10 μl anti-CD44 (# 559942, BD Pharmingen) and 3 μl anti-CD24 antibodies (# MHCD2404, Invitrogen) conjugated with APC and PE respectively in 100 μl of 2% Phosphate buffered saline (PBS). After incubation, the cells were washed with PBS and resuspended in 2% PBS. The stained cells were analyzed using flow cytometer FACS Ariatrademark III and signals were collected with phycoerythrin (PE) and allophycocyanine (APC) channels.
2.12Immunoprecipitation experiments
For analyzing galectin-3-interacting proteins, an immunoprecipitation experiment was performed using MDA-MB-231 cells stably expressing pEGFP-hGal-3. The stable cells were grown on 100 mm dishes; the immunoprecipitation (IP) of GFP-fusion proteins was carried out using the affinity resin ChromoTek GFP Trap®A kit. GFP-Trap is a versatile tool to purify GFP-fusion proteins and their interacting factors for biochemical studies including mass spectrometry and enzyme activity assays. Immunoprecipitation was carried out according to the manufacturer’s protocol (ChromoTek GmbH, Germany). The IP samples were further probed for the interacting protein using western blot. For proteomic analysis, the IP samples were processed for eluting bound proteins by adding 50 μl 0.2 M glycine (pH 2.5) for 30 sec under constant mixing followed by centrifugation (2500 g for 2 min). The supernatant was transferred to a new tube and 5 μl 1M Tris base (pH 10.4) was added for neutralization. After neutralization, 50 μl of 6M Guanidium Hydrochloride was added to the samples and mass spectrometric analysis was carried out by Valerian Chem Pvt Ltd, New Delhi. The samples were digested using trypsin and cleaned with C18 silica cartridge. The samples were analyzed using EASY-nLC 1000 system (Thermo Fisher Scientific) coupled to Thermo Fisher-Orbitrap Fusion Tribrid mass spectrometer equipped with nano electrospray ion source.
2.13In vivo studies
Animal studies were performed using the animal research facility at Rajiv Gandhi Centre for Biotechnology, Trivandrum. The animal study was reviewed and approved by the Institutional Animal Ethics Committee (IAEC/530/TRSK/2016). Immunocompromised, age matched female 5- to 6-week-old, NOD-SCID mice were maintained at 24°C in sterile conditions. For developing in vivo imaging ready cells, both MDA-MB-231 (control) and MDA-MB-231 galectin-3-silenced cells were transfected with the expression vector pcDNA3.1 (+)/Luc2 = tdT (# 32904) from Addgene. pcDNA3.1 (+)/Luc2 = tdT plasmids expresses a fusion of firefly luciferase and tandem Tomato red fluorescent protein in the transduced cells. The cells were sorted based on Td Tomato fluorescence using flow cytometry. Multiple clones were expanded in selection media and high expressing clones were expanded for tumor development.
Briefly, the mice were grouped into two comprising 6 each. The stable imaging ready cells (104– 106 cells /100 μl) were orthotopically implanted in 50 μl PBS into the fourth mammary fat pad via a 27G needle. Tumor volume was weekly assessed with a caliper and calculated as length x width x height (in mm3). Animal imaging was carried out under anesthesia using the optical imager from Perkin Elmer IVIS spectrum (USA). All mice were sacrificed at 1.5 months after tumor cell implantation or when their tumor volume parameters reached 1.8 cm in any direction of tumor measurement.
2.14Statistical analysis
Statistical significance was analyzed by Fisher’s exact test (GraphPad InStat software), One-way ANOVA, Two-way ANOVA and chi-square test (GraphPad Prism 5.01). For survival rate data, the log-rank test was used. The criteria for significance were p < 0.05 (*), p < 0.01 (**), and p < 0.001 (***) for all comparisons.
3Results
3.1Clinical features of the cohort
The average age of the study cohort was 50.53 years. 38.8% of the study population were premenopausal. Among the 489 patients, 119 (24.3%) were with grade 2 (moderately differentiated) and 370 (75.7%) were with grade 3 tumor (poorly differentiated). Distribution of tumor size revealed that 77.5% of patients were with tumor size >2–5 cm. There were 251 cases with lymph node metastasis (51.3%), 79.2% of which were in multiple lymph nodes. Distant metastases were found in 41 (8.3%) patients. Clinical and pathological characteristics along with receptor status are shown in the Table 1. Distribution of clinical stage revealed that 357 patients (73%) were in stage I– III A (Early) and 132 (26.9%) were in stage III B- IV (Advanced). 249 patients were TNBC (ER, PR and Her-2 negative), which accounts for 50.9% of the selected cohort.
Table 1
Association of galectin-3 expression with clinicopathological features of breast cancer
| Association between galectin-3 and Clinicopathological characteristics | ||||
| No: of patients | 489 | |||
| Mean Age (Years) | 50.53 | |||
| Galectin-3 High | Galectin-3 Low | p-value | ||
| Age | ||||
| <50 | 236 (48.3%) | 116 (49.2%) | 120 (50.8%) | 0.41 |
| ≥50 | 253 (51.74%) | 114 (45.1%) | 139 (54.9%) | |
| Menopausal status | ||||
| Pre | 190 (38.8%) | 97 (51.1%) | 93 (48.9%) | 0.30 |
| Post | 282 (57.7%) | 124 (44.0%) | 158 (56.0%) | |
| Unknown | 17 (3.5%) | 9 (52.9%) | 8 (47.1%) | |
| Pathological Stage | ||||
| Early | 357 (73%) | 186 (52.1%) | 171 (47.9%) | 0.0002 |
| Advanced | 132 (27%) | 44 (33.3%) | 88 (66.7%) | |
| Tumor size | ||||
| T1 (0–2 cm) | 21 (4.3%) | 10 (47.6%) | 11 (52.4%) | 0.03 |
| T2 (>2–5 cm) | 379 (77.5%) | 190 (50.1%) | 189 (49.9%) | |
| T3 (>5 cm) | 86 (17.6%) | 28 (32.6%) | 58 (67.4%) | |
| Unknown | 3 (0.6%) | 2 (66.7%) | 1 (33.3%) | |
| Histological grade | ||||
| Grade II | 119 (24.3%) | 51 (42.8%) | 68 (57.1%) | 0.34 |
| Grade III | 370 (75.7%) | 179 (48.4%) | 191 (51.6%) | |
| Lymph node status | ||||
| Positive | 251(51.3%) | 87 (34.7%) | 164 (65.3%) | <0.0001 |
| Negative | 238 (48.7%) | 143 (60.1%) | 95 (39.9%) | |
| ER status | ||||
| Positive | 121 (24.7%) | 59 (48.8%) | 62 (51.2%) | 0.71 |
| Negative | 368 (75.3%) | 171 (46.5%) | 197 (53.5%) | |
| PR status | ||||
| Positive | 112 (22.9%) | 46 (41.1%) | 66 (58.9%) | 0.20 |
| Negative | 377 (77.1%) | 184 (48.8%) | 193 (51.2%) | |
| HER2 status | ||||
| Positive | 91 (18.6%) | 44 (48.4%) | 47 (51.6%) | 0.82 |
| Negative | 398 (81.4%) | 186 (46.7%) | 212 (53.3%) | |
| TNBC (n = 249) | ||||
| Early | 183 (73.5%) | 99 (54.1%) | 84 (45.9%) | 0.002 |
| Advanced | 66 (26.5%) | 21 (31.8%) | 45 (68.2%) | |
1H-score (0–150) = Low expression. 2H-score (>150) = High expression.
3.2Galectin-3 expression, clinico-pathological features and breast cancer metastases
The sub-cellular distribution of galectin-3 was generally found to be uniform and diffused all over the cytoplasm. Nuclear expression and extra cellular expressions were also found in a few samples, which were excluded from the analysis owing to its relatively little number. The adjacent benign ductal epithelium also showed a similar pattern of expression with a different intensity. The galectin-3 expression pattern and its correlation with clinicopathological features are shown in Table 1. Around 47% of the samples showed high galectin-3 expression irrespective of the pathological stage (Table 1). The expression pattern was found to have significant association with pathological stage of the disease (p = 0.0002) (Table 1 and Fig. 1A). Among the early-stage tumors (357) of the entire cohort, 186 (52.1%) patients showed higher galectin-3 expression. Within the 186 patients, 99 (53.2%) were confined to TNBC subgroup (Table 1). Galectin-3 was found to be expressed more in the tumor invading front (Fig. 1B a.) and also in tumor tissue cells close to the blood vessels (Fig. 1B b.). Intra ductal components also displayed a higher galectin-3 expression (Fig. 1B c.).
Fig. 1
Galectin-3 expression in human breast tumor tissues A. 489 IDC samples were immunohistochemically stained using a monoclonal galectin-3 antibody as described in Materials and methods. A. Representative images of breast tumor tissues showing galectin-3 expression in early (Stage 1A-StageIIIA) (a- (20X), b-(20X), c-(20X) & d-(20X) and advanced stages (Stage IIIB- Stage IV) (e-(20X), f-(20X), g-(20X), h-(20X) of primary breast tumors in TNBC. B. (a.) Representative image of primary tumor tissue showing galectin-3 expression in invading areas (20X). Arrow (orange) indicates invading tumor cells. (b.) Representative image of primary tumor tissue showing galectin-3 expression in tumor cells near blood vessels (20X). Arrow (black) indicates blood vessel and Arrow (orange) indicates tumor cells near blood vessels. (c.) Representative image of primary tumor tissue showing galectin-3 expression in intraductal areas (20X). Arrow (orange) indicates tumor cells in the intraductal area. C. Western blot analysis of galectin-3 expression in breast cancer cell line model for tumor progression (1-MCF 10A (Normal), 2- MCF 10 AT (Precancerous), 3- MCF 10CA1D (Metastatic), 4- MCF 10DCIS (DCIS). Tubulin was used as the loading control. D. Both a. (20X) and b. (20X) show representative images of IHC analysis of galectin-3 expression in metastatic lymph node tissues from TNBC patients. The tumors were categorized into galectin-3 low (overall H-score<150) and galectin-3 high (overall H-score>150). H-scores were calculated by multiplying intensity score (0 = negative, 1+ = light, 2+ = moderate, 3+ = intense, 4+ = heavy) with the percentage of stained tumor cells. Overall score less than 40 was considered negative.
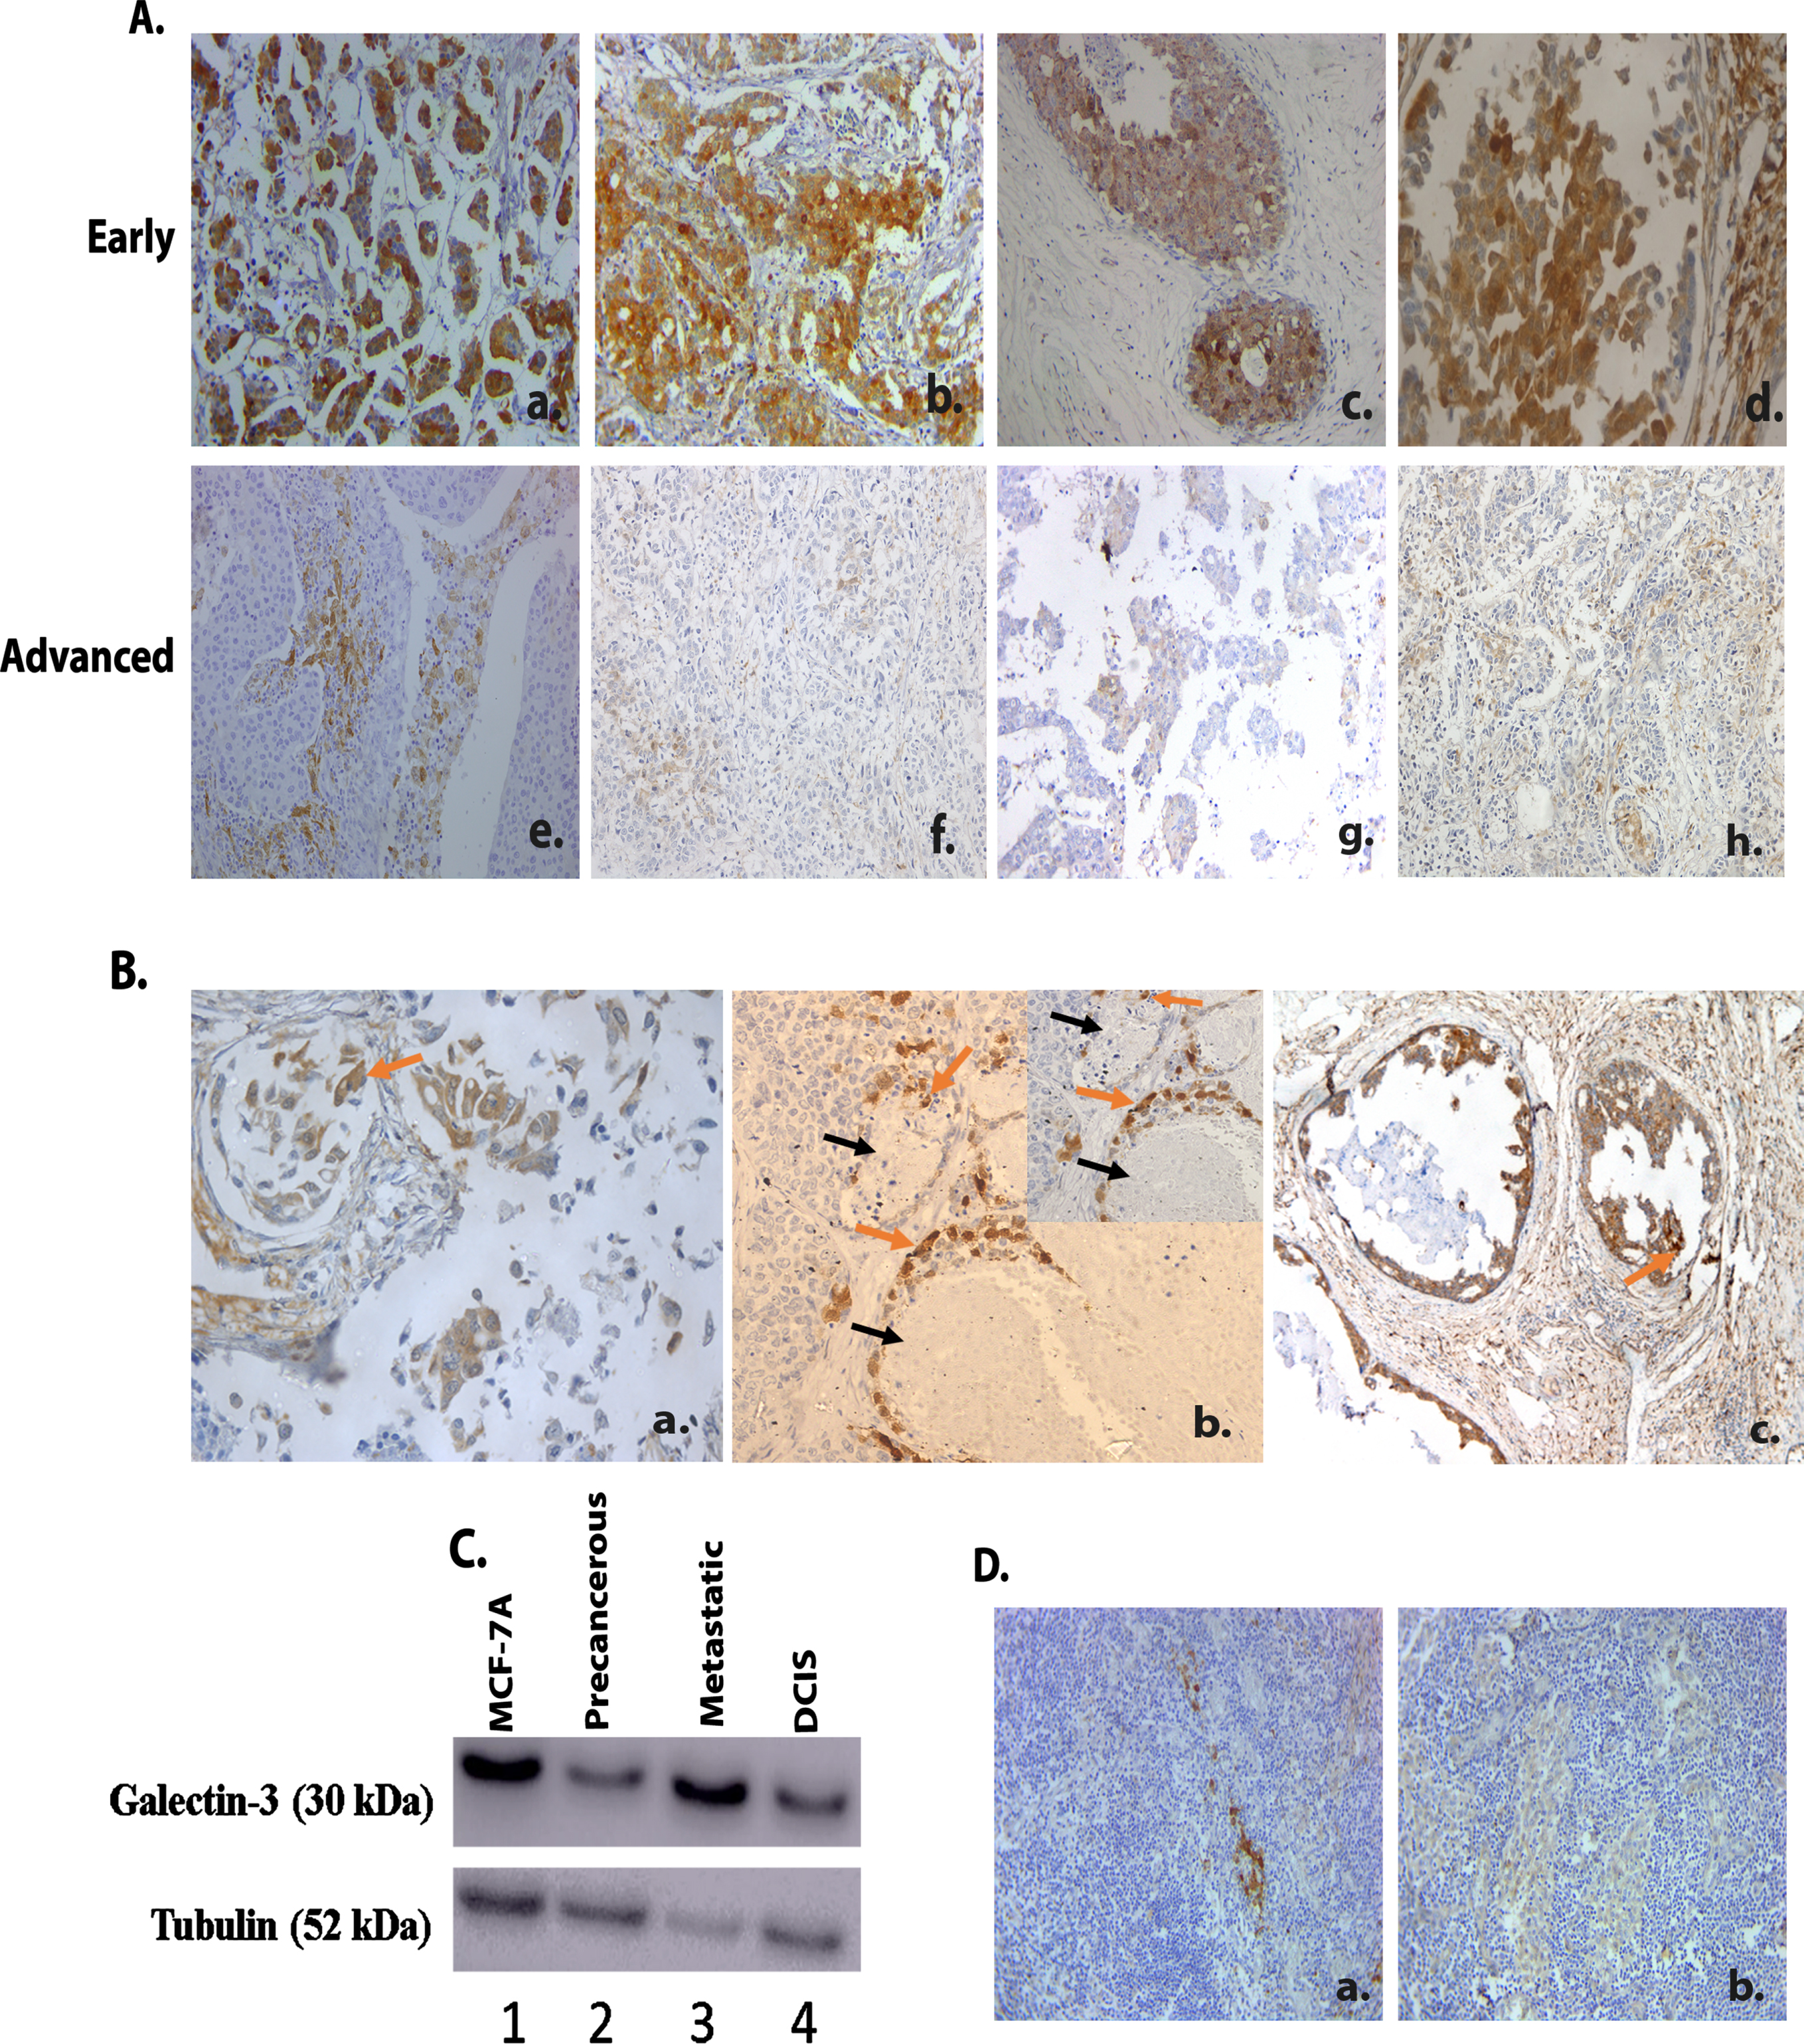
Tumor progression-dependent expression of galectin-3 among tumor samples were evaluated via immunoblotting using MCF series of cells in vitro. The MCF 10A sublines, MCF 10 AT and MCF 10DCIS represents the premalignant lesions and Ductal carcinoma in situ (DCIS), respectively. MCF 10CA1D represents fully malignant lesions with metastatic potential [15, 16]. Immunoblotting results revealed that galectin-3 expression displays a drastic decline in the precancerous MCF-10 AT cells than its normal counter-part MCF-10A. Furthermore, the MCF 10DCIS and MCF 10CA1D, metastatic cell line showed a progressive augmentation in galectin-3 expression (Fig. 1C). IHC analysis of galectin-3 showed a higher and heterogeneous expression among the metastatic lymph node tumors of TNBC patients (n = 20) (Fig. 1D a. & 1D b.). This confirms the expression of galectin-3 in tumor cell line representing metastatic state as well as in tumor cells from metastatic lymph node tissues of patients. The observation of galectin-3 expression in the metastatic cell line was thus confirmed in the clinical scenario as well.
The Survival analysis using Kaplan-Meier plot revealed that patients with tumors expressing low levels of galectin-3 had a decreased overall survival (OS) as well as disease free survival (DFS) in node positive cases, similar to our earlier report [13]. Univariate analysis of galectin-3 expression of OS (p = 0.002) and DFS (p = 0.001) are shown in the Supplementary Figure 1.
3.3Galectin-3 promotes EMT and metastatic potential in tumor cells via interacting with vimentin
The EMT phenotype, critical in early stages of cell transformation and metastasis is more represented among TNBC. So, we have analyzed EMT markers in a subset of TNBC patient samples (No: 249) by IHC analysis. The canonical mesenchymal marker vimentin showed positive expression in 169 (67.8%) TNBC patients, irrespective of pathological stages. Uniform diffuse staining of vimentin was observed mainly in the membrane. Even though high vimentin expression was found significant in high grade cases, positive expression was found significant among early-stage tumors among TNBC cases (p = 0.008) (Table 2). However, association between galectin-3 and E-cadherin expression was not found significant in the study (Data not shown).
Table 2
Association between Vimentin expression and pathological stages in TNBC patients (n = 249)
| Association of Vimentin and Pathological stages | |||
| Vimentin positive | Vimentin negative | p-value | |
| Early stage (183) | 133 (72.7%) | 50 (27.3%) | 0.008 |
| Advanced stage (66) | 36 (54.5%) | 30 (45.5%) | |
Western blot analysis (Supplementary Figure 2) of the tumor samples from TNBC patients showed an upregulation of vimentin and downregulation of E-cadherin compared to their adjacent benign epithelium at the translational level, irrespective of pathological stages. This data provides the evidence of EMT occurrence in the clinical setting.
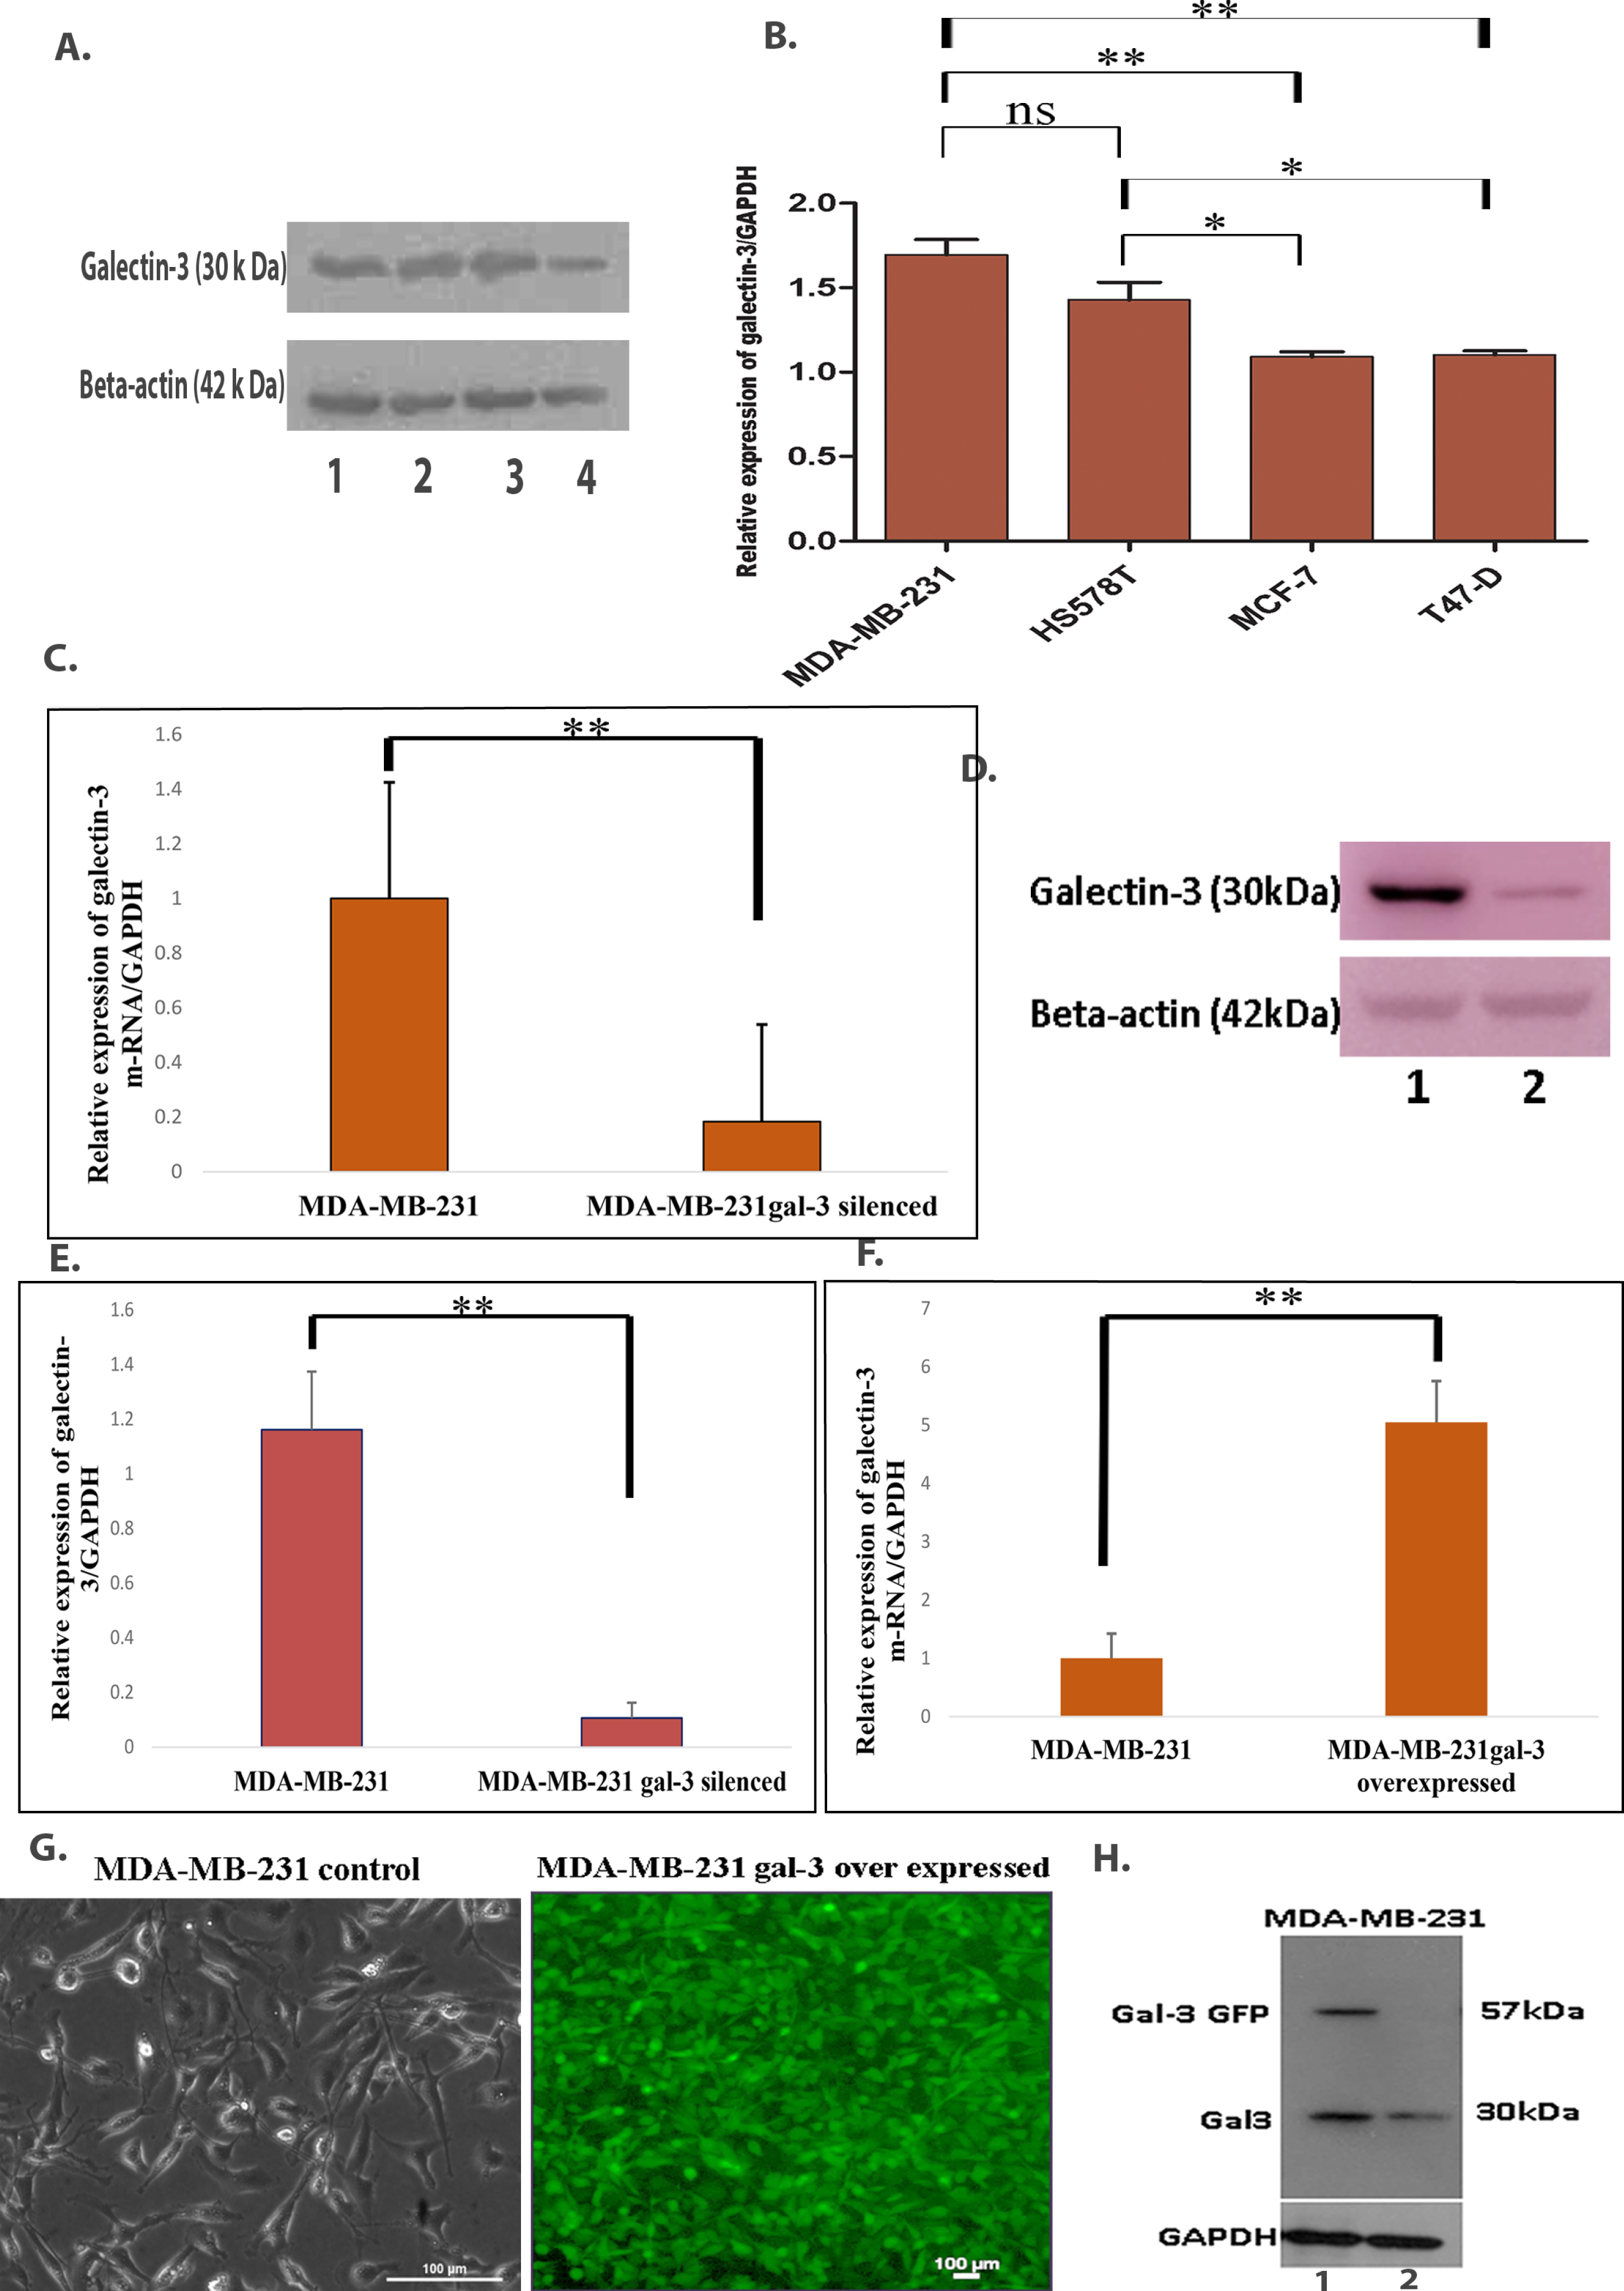
Since clinicopathological analysis of the samples showed variable and complex level of expression for galectin-3 and EMT markers, we have focused our studies to understand the functional role of galectin-3 in a TNBC cell line model. ER, PR and Her2 negative MDA-MB-231 cells displaying invasive mesenchymal phenotype were found to be expressing higher galectin-3 compared to the other cell lines, namely HS578T, MCF-7 and T47-D (Fig. 2A & 2B). Based on this, MDA-MB-231 cells were selected for evaluating the signaling mechanism of galectin-3 in tumor progression and metastasis. Galectin-3-silenced and overexpressed MDA-MB-231 cell lines were validated at the mRNA and protein levels (Fig. 2C–H).
Fig. 2
A. Different breast cancer cell lines, namely 1-MDA-MB-231& 2-HS578T (TNBC) and 3- MCF-7& 4 -T47-D (Luminal Breast cancer), were subjected to western blot analysis, as described in Materials and methods for the protein level of galectin-3. Beta-actin was used as the loading control. B. Quantification of western blot analysis using Image J analysis. C. Transcriptional level of galectin-3 m-RNA in 1- MDA-MB-231 and 2- MDA-MB-231 galectin-3-silenced cells were evaluated by qRT-PCR analysis (p = 0.002). GAPDH (Glyceraldehyde-3-phosphate dehydrogenase) was used as a control. D. After stable transfection of galectin-3 shRNA, western blot analysis of lysates from control MDA-MB-231 and MDA-MB-231galectin-3-silenced cells with anti-galectin-3 antibody. Beta-actin was used as the loading control. E. Relative expression of galectin-3 bands were evaluated by Image J analysis and the graph represents the change in protein expression normalized to the control (p = 0.001). F. Transcriptional level of galectin-3 m-RNA in MDA-MB-231 and MDA-MB-231 galectin-3 overexpressed cells were evaluated by qRT-PCR analysis (p = 0.01). GAPDH was used as the control. G. Representative image of MDA-MB-231 control cells and MDA-MB-231 cells with galectin-3 overexpression. H. For confirmation, protein extract from overexpressed galectin-3 MDA-MB-231 and control MDA-MB-231 cells (1- MDA-MB-231 galectin-3 overexpressed, 2- MDA-MB-231) were subjected to western blot analysis. GAPDH was used as the loading control. Data represented in (B, C, E and F) are mean±SD (n = 3) calculated using GraphPad Prism 5.01 and GraphPad InStat software. The criteria for significance were p < 0.05 (*), p < 0.01 (**), and p < 0.001 (***) and ns means no statistical significance.
In order to address the association of galectin-3 in the cellular transition during EMT, the expression level of EMT markers such as mesenchymal marker vimentin, epithelial marker E-cadherin and EMT transcription factor slug were assessed in galectin-3-silenced cells. Silencing of galectin-3 was found to reduce the expression of vimentin, both at the transcriptional and translational levels, whereas expression of slug was downregulated at the translational level alone (Fig. 3A–C). Interestingly, the epithelial marker E-cadherin was found to be significantly increased at the m-RNA level (Fig. 3A) even though it failed to be detected at the protein level (Data not shown).
Fig. 3
Inhibition of galectin-3 gene expression affected the protein expression of EMT markers in galectin-3-silenced MDA-MB-231 cells. This was confirmed using A. q RT-PCR analysis. GAPDH was used as the control. B and C. Western blot analysis of galectin-3, EMT marker, Vimentin and EMT transcription factor, Slug in 1- MDAMB-231 and 2- MDA-MB-231 galectin-3 silenced cells and its quantification (p = <0.001). GAPDH was used as the loading control. D and E. Migratory potential assessed using wound healing assay demonstrated that cell migration was decreased in MDA-MB-231 cells after transfection with galectin-3 shRNA. Microscopy images of wound closure (Scale bars, 50 μm) of control and silenced MDA-MB-231 cells at 0, 6, 12, 24 h and quantification of migratory distance (p = <0.001). Data represented in (A, C and E) are mean±SD (n = 3) calculated using GraphPad Prism 5.01. The criteria for significance were p < 0.05 (*), p < 0.01 (**), and p < 0.001 (***) and ns means no statistical significance.
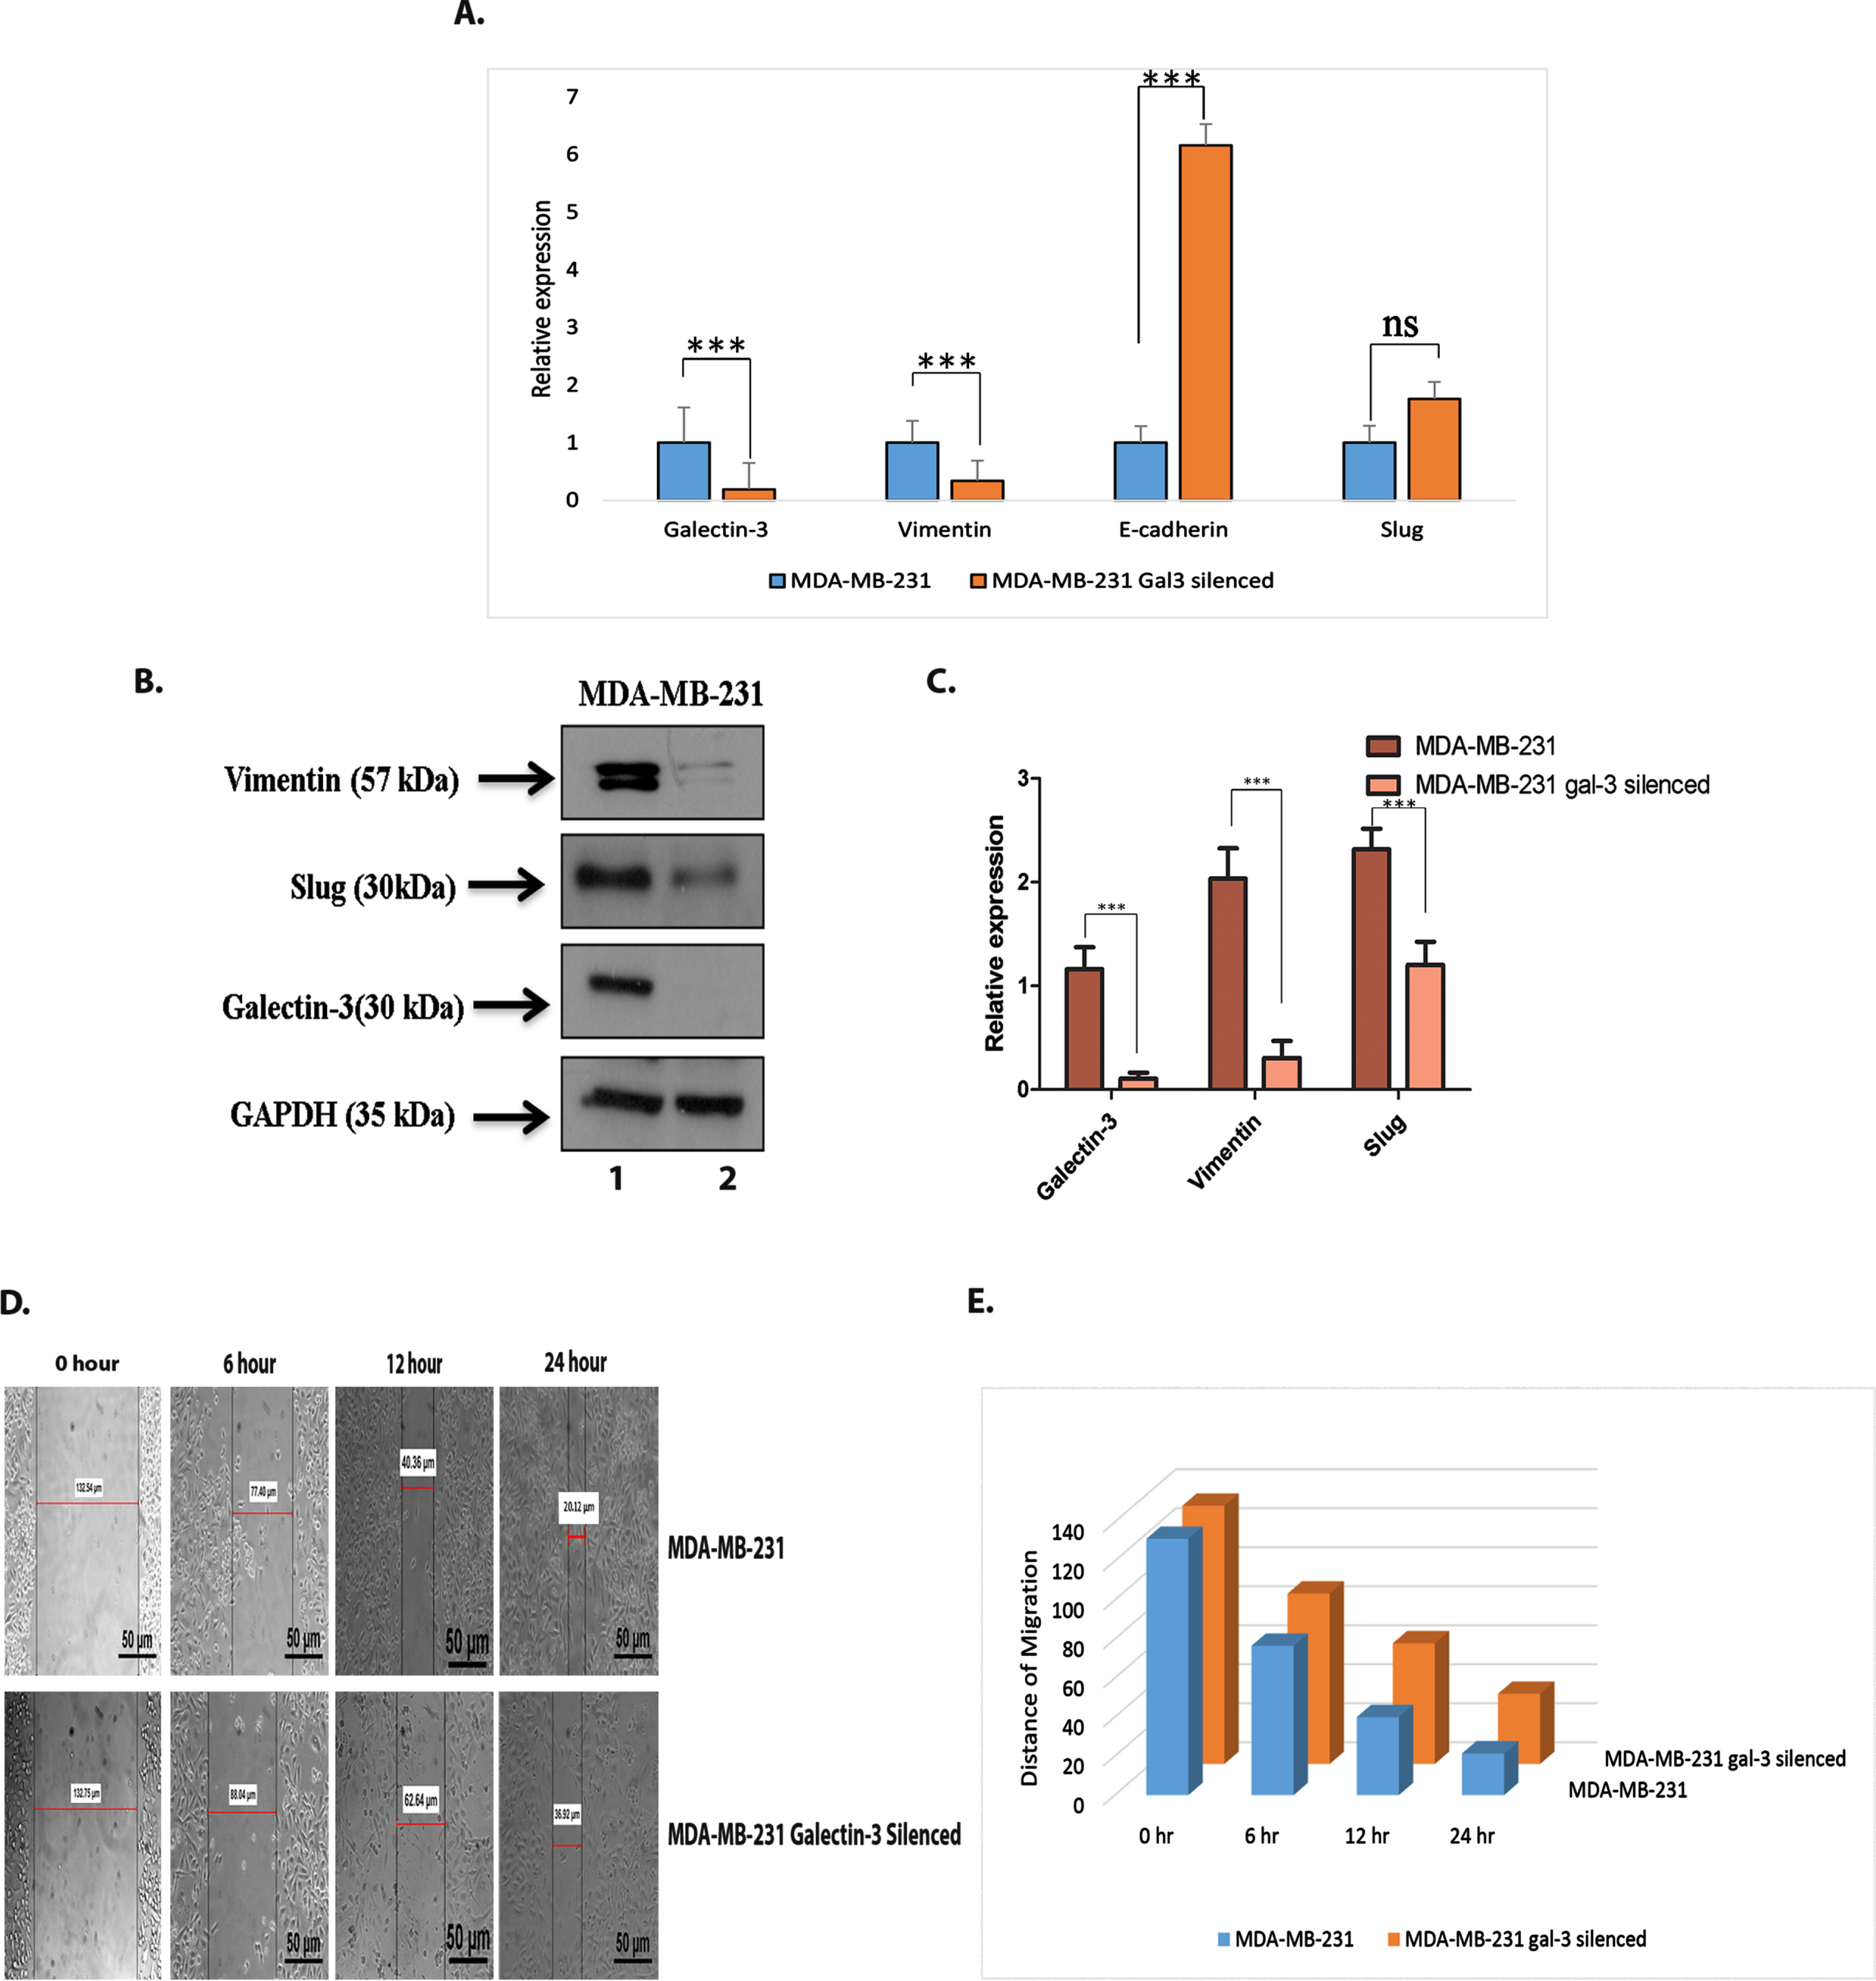
The wound-healing assay showed a significantly lower migration of cells transfected with galectin-3 shRNA than the control cells (p ≤ 0.001) suggesting that galectin-3 silencing inhibited the migratory potential in MDA-MB-231 cells (Fig. 3D and 3E).
Galectin-3 EGFP pull-down samples prepared using GFP trap and control EGFP samples were subjected to mass spectrometric analysis. The data identified around 31 proteins interacting with galectin-3, including galectin-3 (Table 3). The mass spectrometric data showing interaction between galectin-3 and vimentin was further confirmed by immunoblotting (Fig. 4A & 4B). In addition, even though not significant, integrative m-RNA analysis of galectin-3 and vimentin performed in cBioPortal based on TCGA database using breast cancer and LGALS3 as search filters also detected a co-expression pattern (Fig. 4C). Furthermore, in order to explore the existence of tumor cells co-expressing galectin-3 and vimentin, we performed a dual staining of both antigens in tumor tissues using IHC (Fig. 4D). IHC analysis clearly showed the presence of tumor cells expressing both galectin-3 and vimentin that may probably participate in the process of metastasis.
Fig. 4
Identification of galectin-3-interacting proteins A. Overexpressed galectin-3 fraction with GFP after pull down assay using GFP-TRAP was confirmed using western blotting [1-Input (Protein sample from Galectin-3-GFP overexpressed MDA-MB-231 cells), 2- Unbound (Supernatant of protein sample after incubation with GFP-trap beads), 3- Bound (Galectin-3-GFP protein bound to the GFP-TRAP beads)]. B. Pull down sample subjected to immunoblotting analysis was found to have vimentin protein substantiating the association of vimentin with galectin-3 (1-Input, 2- Unbound, 3- Bound). C. Co-expression analysis of galectin-3 and vimentin done using m-RNA data from TCGA database in cBioPortal. D. Representative image of breast tissue sample showing dual staining of galectin-3 and vimentin in tumor cells (Magnification: 20X). Arrow indicates tumor cells co-expressing both galectin-3 (brown) in the cytoplasm and vimentin (blue) in the membrane.
![Identification of galectin-3-interacting proteins A. Overexpressed galectin-3 fraction with GFP after pull down assay using GFP-TRAP was confirmed using western blotting [1-Input (Protein sample from Galectin-3-GFP overexpressed MDA-MB-231 cells), 2- Unbound (Supernatant of protein sample after incubation with GFP-trap beads), 3- Bound (Galectin-3-GFP protein bound to the GFP-TRAP beads)]. B. Pull down sample subjected to immunoblotting analysis was found to have vimentin protein substantiating the association of vimentin with galectin-3 (1-Input, 2- Unbound, 3- Bound). C. Co-expression analysis of galectin-3 and vimentin done using m-RNA data from TCGA database in cBioPortal. D. Representative image of breast tissue sample showing dual staining of galectin-3 and vimentin in tumor cells (Magnification: 20X). Arrow indicates tumor cells co-expressing both galectin-3 (brown) in the cytoplasm and vimentin (blue) in the membrane.](https://content.iospress.com:443/media/tub/2023/45-1/tub-45-1-tub230002/tub-45-tub230002-g004.jpg)
Table 3
Mass spectrometric analysis data of Galectin-3-interacting partners. Galectin-3 EGFP pull-down samples prepared using GFP-TRAP and control EGFP samples were subjected to mass spectrometric analysis.
| UniProt Accession | Description | Gene Symbol | Sum PEP Score |
| P35579 | Myosin-9 OS = Homo sapiens GN = MYH9 PE = 1 SV = 4 | MYH9 | 93.299 |
| P60660 | Myosin light polypeptide 6 OS = Homo sapiens GN = MYL6 PE = 1 SV = 2 | MYL6 | 44.108 |
| P04264 | Keratin, type II cytoskeletal 1 OS = Homo sapiens GN = KRT1 PE = 1 SV = 6 | KRT1 | 38.568 |
| P35527 | Keratin, type I cytoskeletal 9 OS = Homo sapiens GN = KRT9 PE = 1 SV = 3 | KRT9 | 32.512 |
| P02768 | Serum albumin OS = Homo sapiens GN = ALB PE = 1 SV = 2 | ALB | 24.615 |
| P62736 | Actin, aortic smooth muscle OS = Homo sapiens GN = ACTA2 PE = 1 SV = 1 | ACTA2 | 23.228 |
| P08670 | Vimentin OS = Homo sapiens GN = VIM PE = 1 SV = 4 | VIM | 14.351 |
| P13645 | Keratin, type 1 cytoskeletal 10 OS = Homo sapiens GN = KRT10 PE = 1 SV = 6 | KRT10 | 14.03 |
| P35908 | Keratin, type II cytoskeletal 2 epidermal OS = Homo sapiens GN = KRT2 PE = 1 SV = 2 | KRT2 | 12.841 |
| P16402 | Histone H1.3 OS = Homo sapiens GN = HIST1H1D PE = 1 SV = 2 | HIST1H1D | 10.543 |
| P17931 | Galectin-3 OS = homo sapiens GN = LGALS3 PE = 1 SV = 5 | LGALS3 | 8.942 |
| P67936 | Tropomyosin alpha-4 chain OS = homo sapiens GN = TPM4 PE = 1 SV = 3 | TPM4 | 8.564 |
| P06753 | Tropomyosin alpha-3 chain OS = homo sapiens GN = TPM3 PE = 1 SV = 2 | TPM3 | 7.019 |
| P61513 | 60S ribosomal protein L37a chain OS = homo sapiens GN = RPL37A PE = 1 SV = 2 | RPL37A | 5.954 |
| P61605 | Dermcidin OS = homo sapiens GN = DCD PE = 1 SV = 2 | DCD | 5.438 |
| P02538 | Keratin, type II cytoskeletal 6A OS = homo sapiens GN = KRT6A PE = 1 SV = 3 | KRT6A | 4.281 |
| Q05639 | Elongation factor 1- alpha 2 OS = homo sapiens GN = EEF1A2 PE = 1 SV = 1 | EEF1A2 | 4.145 |
| O14950 | Myosin regulatory light chain 12B OS = homo sapiens GN = MYL12B PE = 1 SV = 2 | MYL12B | 4.07 |
| P30050 | 60S ribosomal protein L12 OS = homo sapiens GN = RPL12 PE = 1 SV = 1 | RPL12 | 4 |
| P13647 | Keratin, type II cytoskeletal 5 OS = homo sapiens GN = KRT5 PE = 1 SV = 3 | KRT5 | 3.911 |
| P62906 | 60S ribosomal protein L10a OS = homo sapiens GN = RPL10A PE = 1 SV = 2 | RPL10A | 3.155 |
| P23396 | 40S ribosomal protein S3 OS = homo sapiens GN = RPS3 PE = 1 SV = 2 | RPS3 | 2.447 |
| P13646 | Keratin, type 1cytoskeletal 13 OS = homo sapiens GN = KRT13 PE = 1 SV = 4 | KRT13 | 2.268 |
| Q9NYL9 | Tropomodulin-3 OS = homo sapiens GN = TMOD3 PE = 1 SV = 1 | TMOD3 | 2.172 |
| P07477 | Trypsin-1 OS = Homo sapiens GN = PRSS1 PE = 1 SV = 1 | PRSS1 | 2.132 |
| Q92786 | Prospero homeobox protein 1 OS = Homo sapiens GN = PROX1 PE = 1 SV = 2 | PROX1 | 1.664 |
| P01834 | Ig kappa chain C region OS = Homo sapiens GN = IGKC PE = 1 SV = 1 | IGKC | 1.587 |
| O00522 | Krev interaction trapped protein 1 OS = Homo sapiens GN = KRIT1 PE = 1 SV = 2 | KRIT1 | 1.471 |
| Q8NDH2 | Coiled-coil domain-containing protein 168 OS = Homo sapiens GN = CCDC168 PE = 2 SV = 2 | CCDC 168 | 1.447 |
| P62899 | 60S ribosomal protein L31 OS = Homo sapiens GN = RPL31 PE = 1 SV = 1 | RPL31 | 1.407 |
| P29692 | Elongation factor 1-delta OS = Homo sapiens GN = EEF1D PE = 1 SV = 5 | EEF1D | 1.382 |
3.4Galectin-3 in maintaining EMT like breast cancer stem cell population and drug resistance
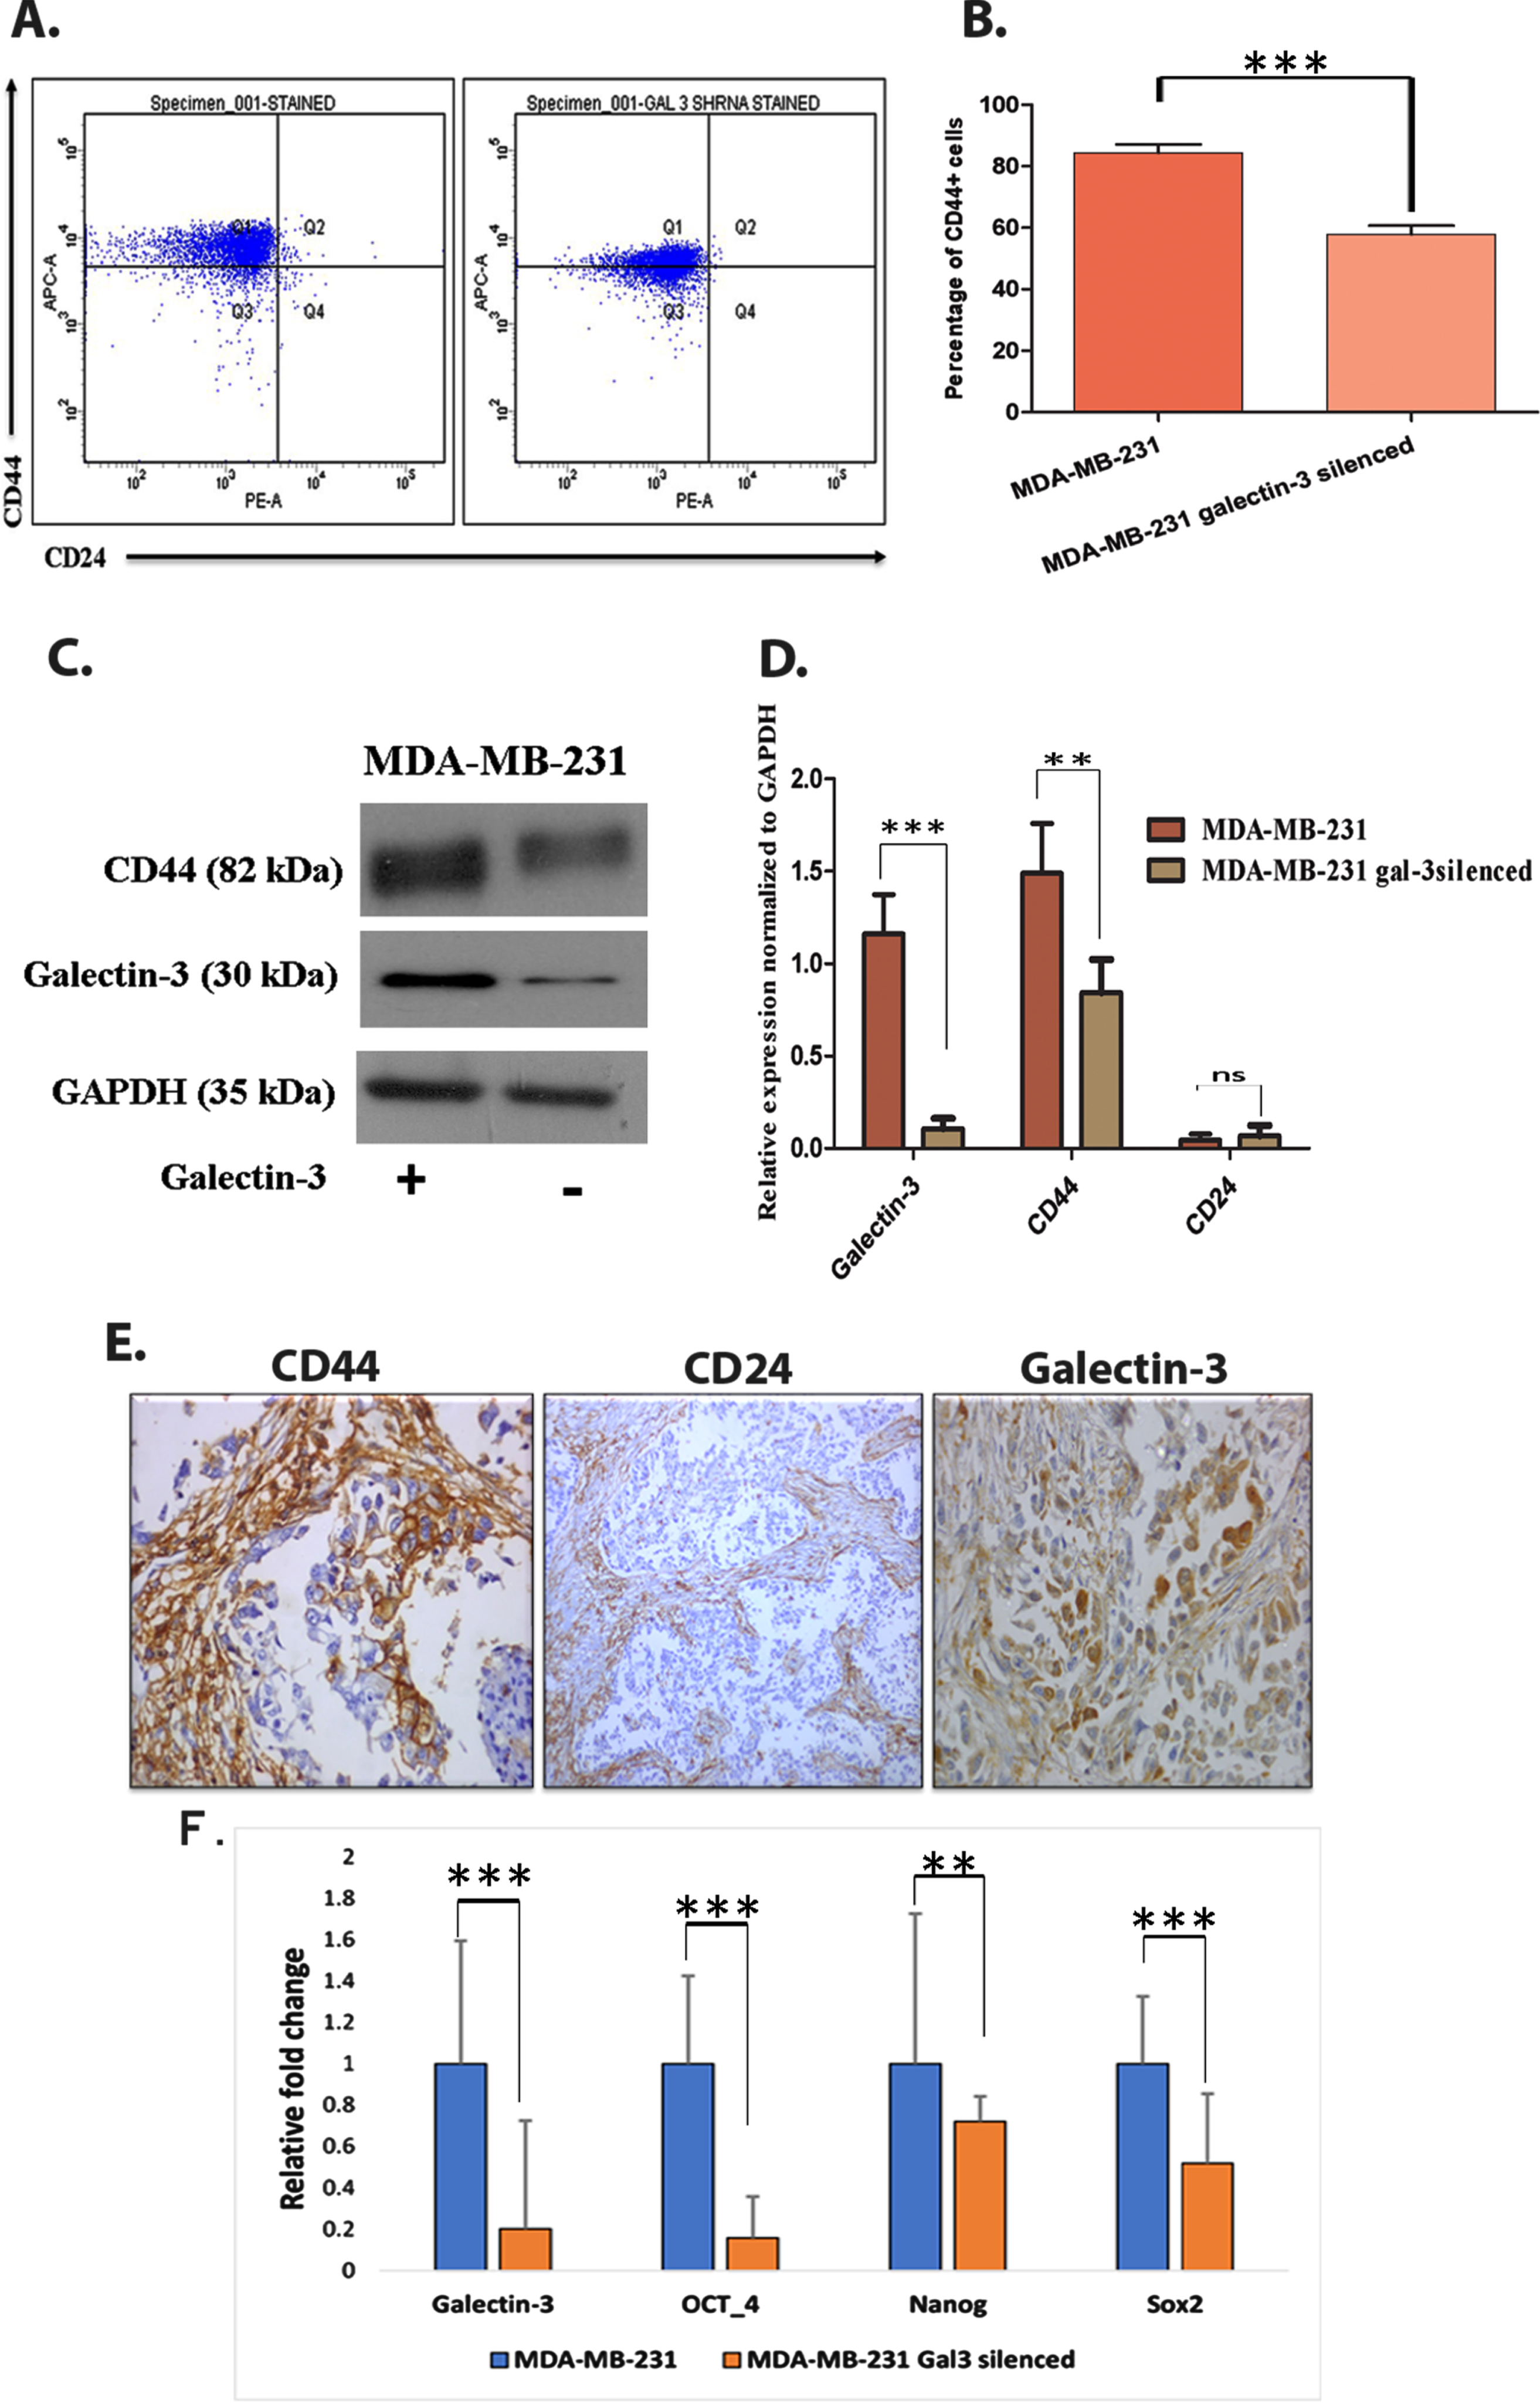
Since both EMT and tumor initiation potential are linked with tumor stem cell like cells, we have analyzed the impact of galectin-3 silencing on stem cell like cell population. Flow cytometry analysis of CD44+/CD24- demonstrated clear reduction of CD44+ cells (p = 0.0003) in galectin-3-silenced MDA-MB-231 cells (Fig. 5A and 5B). The stem-cell exhorting potential of galectin-3 was further corroborated by immunoblotting analysis (Fig. 5C and 5D). Immunohistochemical analysis of CD44+ and CD24– in patient samples also showed the presence of cancer stem cells (CSC) in primary tumor tissues on which an enhanced galectin-3 expression has been documented (Fig. 5E). Other stem cell markers such as OCT4, NANOG and SOX2 were also found to be transcriptionally downregulated in galectin-3-silenced cells (Fig. 5F). Altogether, the expression of galectin-3 helps tumor cells to gain mesenchymal-like CSC phenotype along with EMT features.
Fig. 5
Galectin-3 expression contributes in maintaining cancer stem-like cells A. Using CD44+/CD24– assay, stem cell marker (CD44+ and CD24–) expressing cells were flow cytometrically analyzed using anti-CD44-APC- and anti-CD24- PE-conjugated antibodies. B. Quantification of CD44+/CD24– assay (p = 0.0003). C&D. The stem cell maintaining potential of galectin-3-expressing cells were further confirmed using western blot analysis and its quantification. GADPH was used as the loading control. E. Immunohistochemical analysis showed the presence of stem cells in patients’ samples of primary breast tumors, using anti-CD44, anti-CD24 and anti-galectin-3 antibodies. F. MDA-MB-231 cells and MDA-MB-231 galectin-3-silenced cells were subjected to qRT-PCR analysis as described in Materials and methods with specific primers for the expression of galectin-3, OCT-4, NANOG and SOX2 genes. The primer sequences are available in supplementary data, Table 1. Data represented in (B, D and F) are mean±SD (n = 3) calculated using GraphPad Prism 5.01. The criteria for significance were p < 0.05 (*), p < 0.01 (**), and p < 0.001 (***) and ns means no statistical significance.
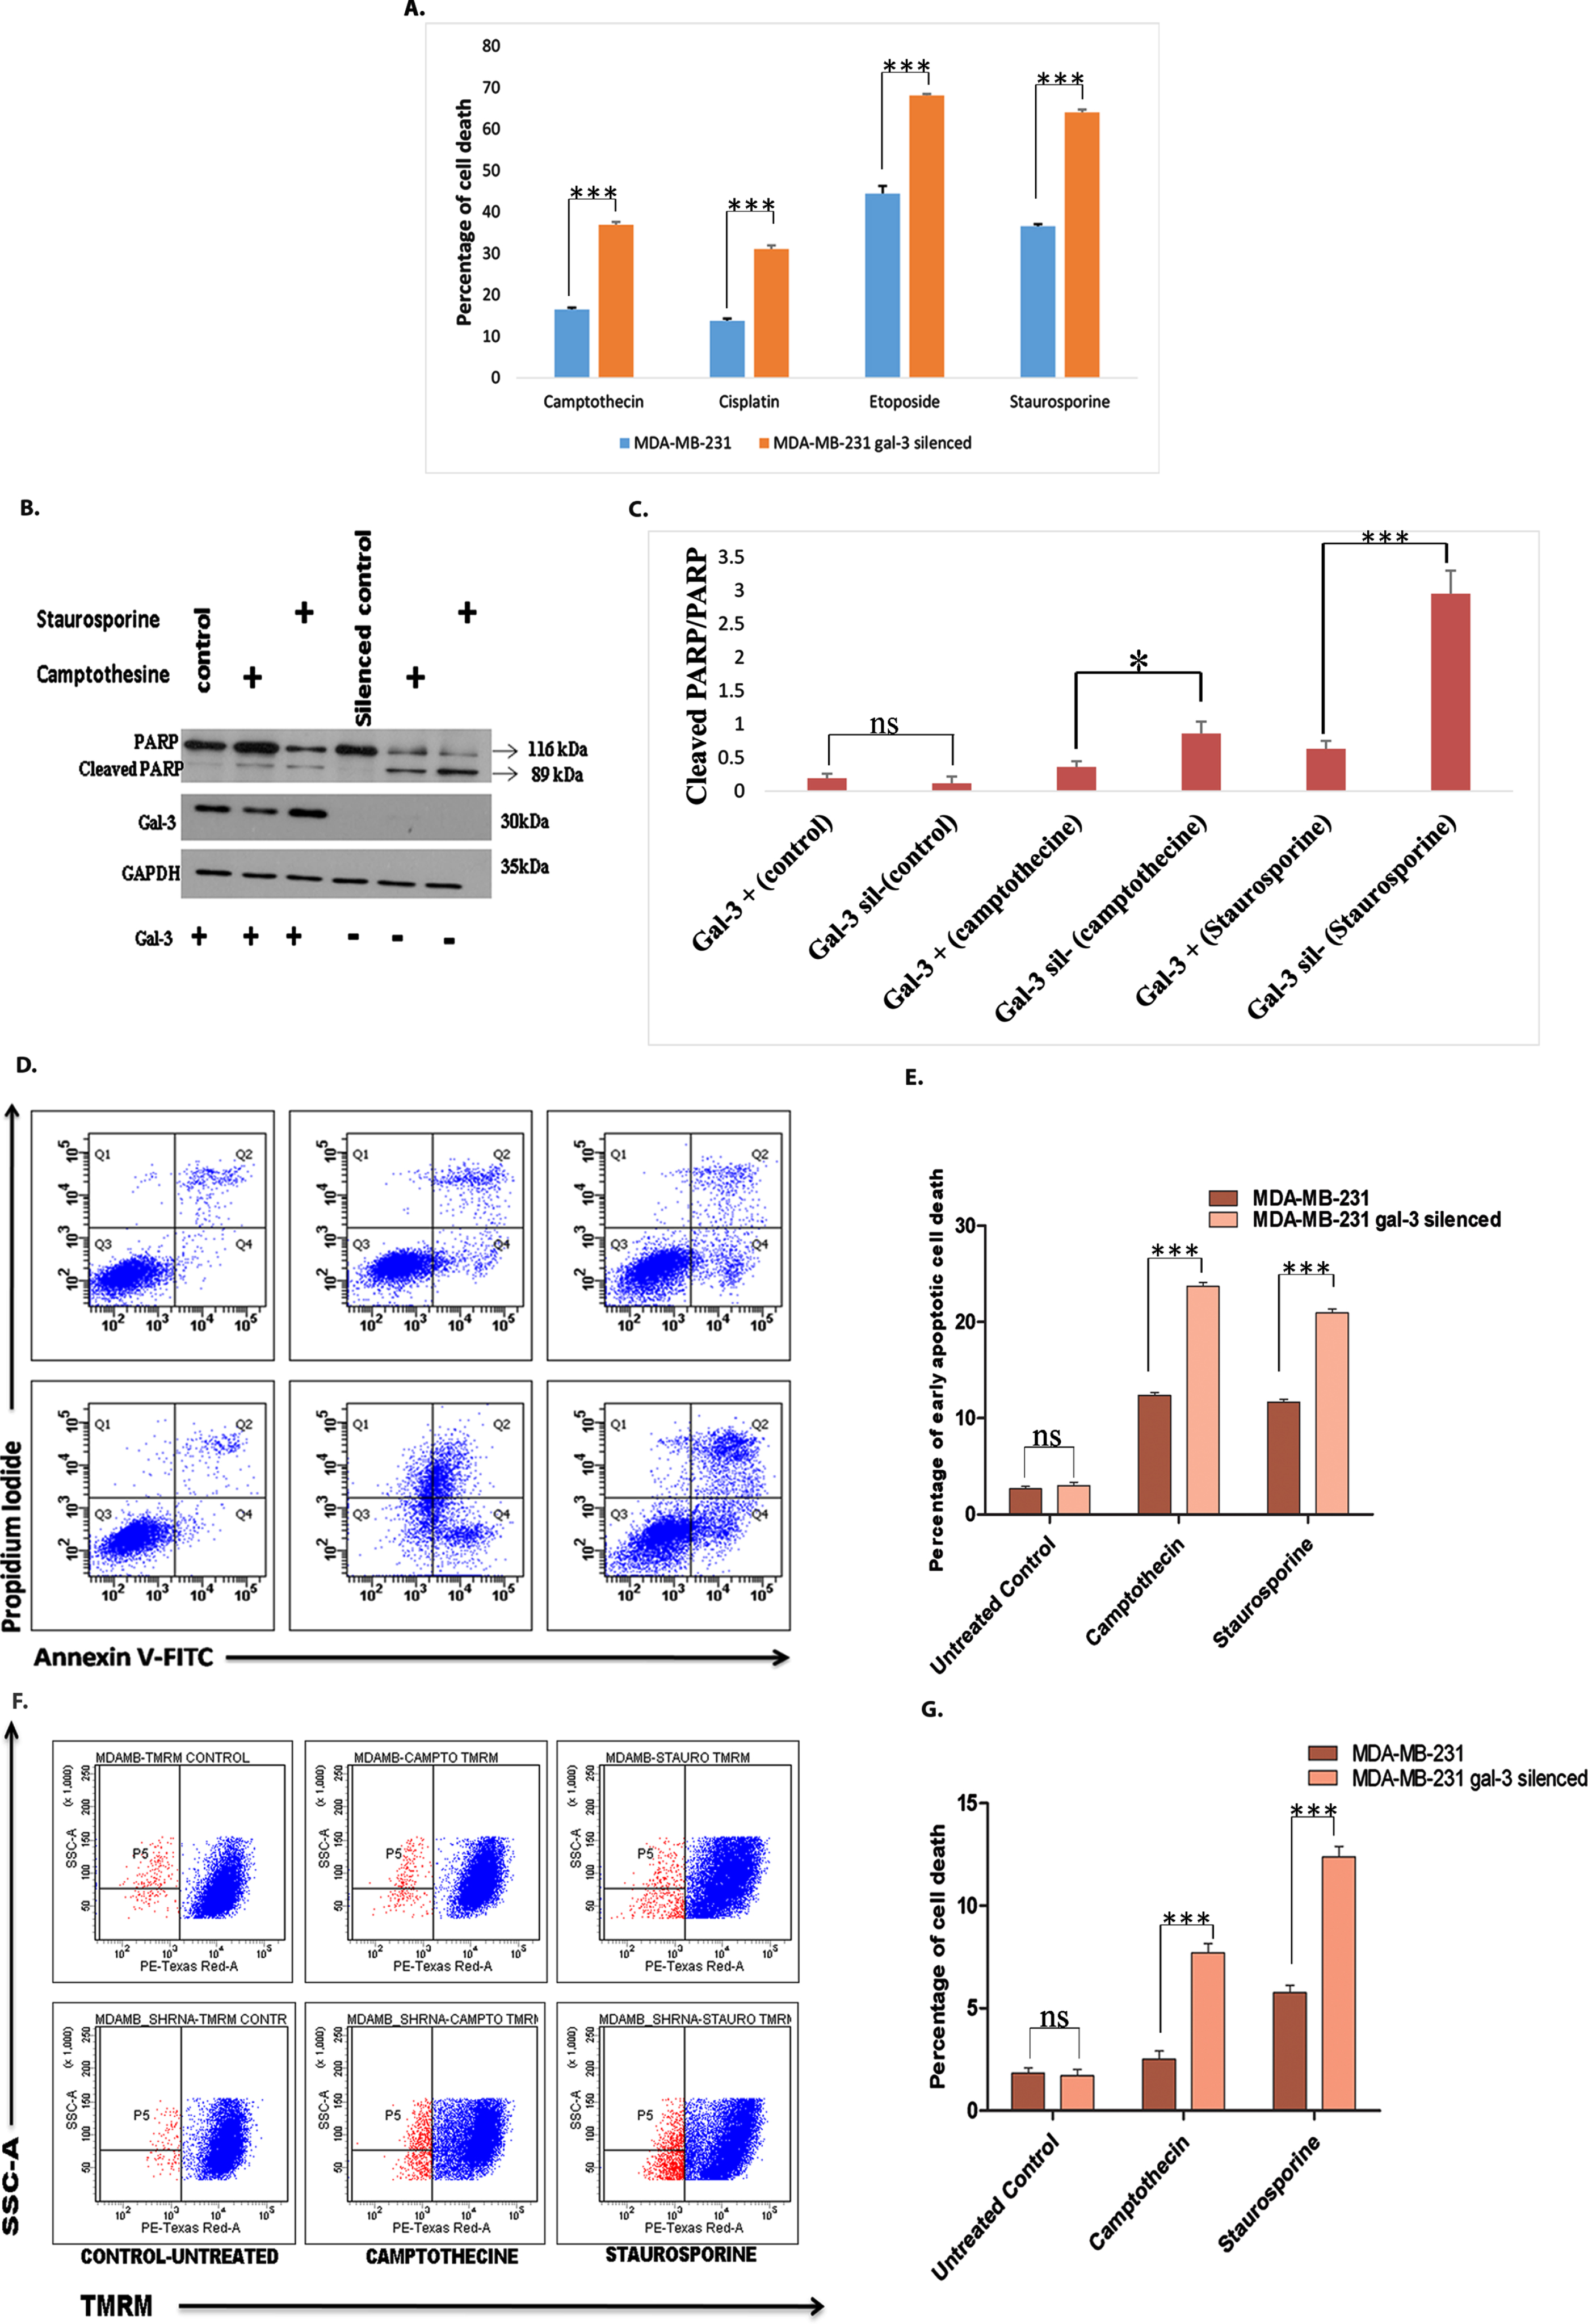
Drug resistance is another major factor contributing to tumor relapse and progression. Figure 6A revealed the effect of galectin-3 silencing on drug resistance. The cell death was evaluated by flow cytometric method employing apoptosis inducing agents, such as camptothecine, staurosporine, cisplatin, and etoposide. The role of galectin-3 in conferring apoptotic resistance was further reinforced by assessing apoptosis-specific cleavage of PARP after treating with camptothecine and staurosporine. Proteolytic cleavage of PARP resulting from activation of Caspase-3 was found to be significantly high in galectin-3-silenced MDA-MB-231 cells treated with camptothecine and staurosporine (Fig. 6B and 6C). Annexin V/PI (Fig. 6D and 6E) analysis of cells treated with camptothecine and staurosporine, confirmed that the silencing of galectin-3 sensitized them to drug treatment. In order to track whether the effect of galectin-3 in conferring drug resistance trails back to the upstream events of apoptotic cascade, the inner mitochondrial membrane potential loss was examined in the silenced cells using TMRM assay. The results indicated that galectin-3 regulates apoptotic escape of cells at very early stages of cell death cascade (Fig. 6F and 6G). Altogether, the data asserts that intra cellular galectin-3 is capable of rendering EMT in cancer cells and in turn promoting apoptotic escape facilitating cell survival and resistance to cancer chemotherapeutics.
Fig. 6
Silencing of galectin-3 in MDA-MB-231 cells sensitizes them towards drug treatment A. Cell death analysis using flow cytometry was carried out following treatment of both control and galectin-3-silenced cells MDA-MB-231 cells with different drugs namely camptothecine (25 μM), staurosporine (1 μM), cisplatin (50 μg/ml), and etoposide (50 μg/ml) for 24 hours. The cells were stained with Hoechst 33342 to determine the level of sub G1 cells. Drugs caused significant induction of apoptosis in galectin-3-silenced cells compared with control MDA-MB-231 cells. B and C. Activation of Caspase-3 leading to apoptosis-specific cleavage of PARP after treating with camptothecine and staurosporine was significantly detected through western blot analysis in galectin-3-silenced MDA-MB-231 cells and its quantification. D. Detection of the externalization of phosphatidylserine in apoptotic cells using annexin V conjugated to green-fluorescent FITC dye and dead cells using propidium iodide. E. Quantification of Annexin V/PI assay. F. After treatment with drugs like camptothecine and staurosporine, cells were stained using TMRM and subjected to FACS analysis for identification of disruption of mitochondrial membrane potential. TMRM that localizes in mitochondria detects mitochondrial membrane depolarization. G. Quantification of TMRM staining. Data represented in (A, C, E and G) are mean±SD (n = 3) calculated using GraphPad Prism 5.01. The criteria for significance were p < 0.05 (*), p < 0.01 (**), and p < 0.001 (***) and ns means no statistical significance.
3.5Galectin-3 silencing hampers Triple Negative Breast Cancer growth and metastasis in vivo
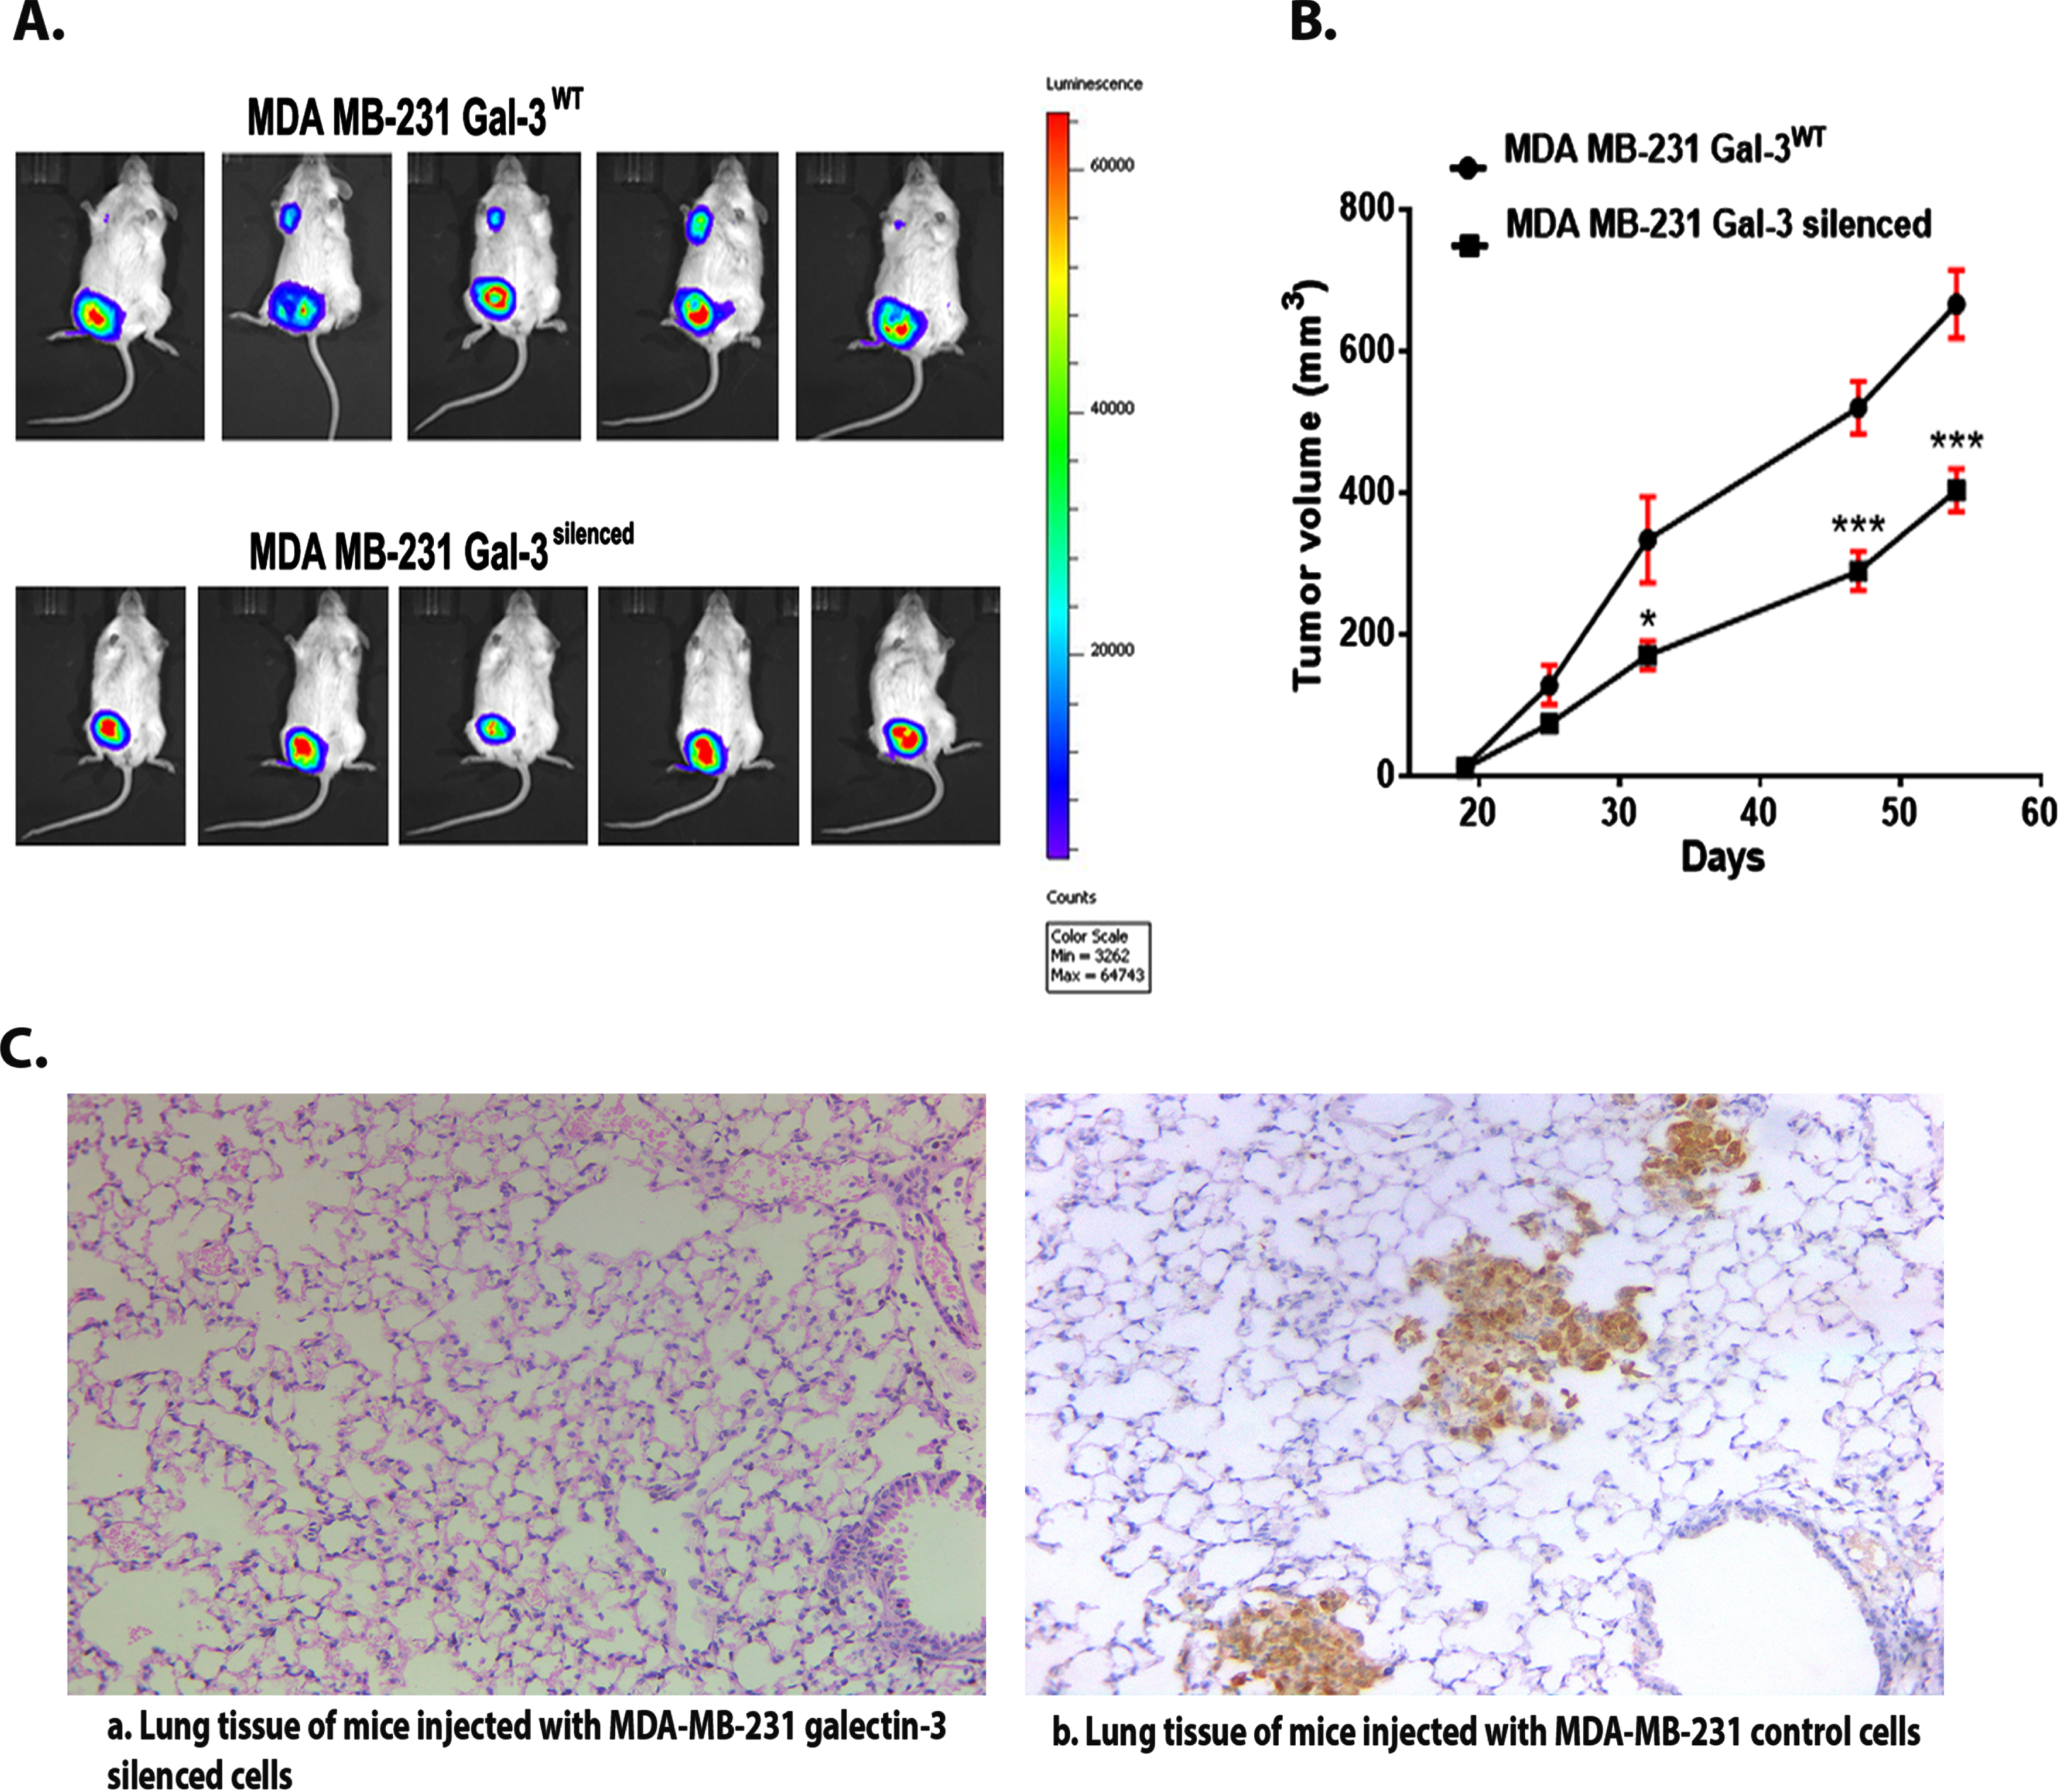
The results from the experimental studies using galectin-3-silenced cells confirmed pro-survival and in vitro tumor promoting potential of galectin-3 expressing cells exhibiting vimentin and CD44 as well. To confirm this, we have done an in vivo tumorigenesis study using vector control and silenced cells. MDA-MB-231 (control) and MDA-MB-231 galectin-3-silenced cells stably expressing pcDNA3.1 (+)/Luc2 = tdT were orthotopically injected (104– 106/100 μl cells) into the mammary fat pads of 6-week-old female NOD/SCID mice. Tumor progression imaging using IVIS spectrum system clearly demonstrated the presence of metastatic tumor in mice injected with galectin-3-expressing MDA-MB-231 control cells (Fig. 7A). Tumor growth curve showed that the tumors of the galectin-3-silenced cells grew more slowly than the control group (Fig. 7B). In the control animals, breast cancer cells metastasized to the lung and they expressed high levels of the galectin-3 protein as demonstrated by IHC (Fig. 7C). This strongly suggests a metastatic potential for tumor cells expressing galectin-3 along with vimentin and CD44 in in vivo conditions.
Fig. 7
A. Real-time imaging of mice using IVIS system confirms the presence of metastatic tumor in control group compared to silenced group. B. Tumor growth curve: Quantitative evaluation of in vivo tumor growth in SCID/NOD mice. Data are expressed as means±SD (B) and are representative of two independent experiments; n = 5 each. The criteria for significance were p < 0.05 (*), p < 0.01 (**), and p < 0.001 (***) and ns means no statistical significance. C. The figure (a) shows IHC image of lung tissue containing no metastatic deposits from mice injected with MDA-MB-231 galectin-3-silenced cells (b) shows IHC image of lung tissue containing the metastatic cells from mice injected with MDA-MB-231 galectin-3-expressing cells (Magnification = 10 X).
4Discussion
The β-galactoside-binding lectin family member, galectin-3 is a multifaceted protein with decisive cellular functions ranging from cell proliferation, cell death regulation and invasion. Even though most of this functional role is in agreement with its oncogenic and metastasis functions [17], the clinicopathological association of galectin-3 with tumorigenesis is controversial [18–20]. For instance, increased expression of galectin-3 is reported in head and neck [21], gastric and colon carcinomas [22]. Downregulation of galectin-3 was associated with advanced stage and metastasis in ductal adenocarcinoma of pancreas [23]. Some studies suggest an increased expression of galectin-3 [24], whereas some others hint on a negative correlation with survival and enhanced tumorigenicity in breast cancers. Ilmer et al. reported low galectin-3 expression in advanced stages of cancer in ER positive and node-positive breast cancer patients and that high tumorigenicity was found in galectin-3 negative breast cancer stem cells obtained from an ER and EGFR (Epidermal growth factor receptor) positive IDC (Infiltrating duct carcinoma) breast tumor cell line [19]. Another study reported that low galectin-3 expression in primary tumor of T1 lung adenocarcinoma was associated with increased metastasis and reduced DFS [20].
The key role of galectin-3 in most of the hallmarks of tumor initiation and progression has been well documented. Galectin-3 modulates gene expression [25] and cell proliferation in breast cancer by gate-keeping the conversion of N-Ras to K-Ras [26]. Cytoplasmic galectin-3 within the tumor cells confers apoptosis escape mechanism to the respective cell, while, when secreted to the tumor microenvironment, triggers apoptosis of cancer infiltrating T cells [27], both of which endorse tumorigenesis. Galectin-3 protein exhibits sequence similarity with anti-apoptotic protein Bcl-2 and can regulate mitochondria-associated and p-53-mediated apoptosis in several tumor cells [28–30]. The importance of galectin-3 in tumor progression, stemness and drug resistance in TNBC population has to be further clarified to assist better disease management. In our study an intra tumoral heterogeneity was evident in galectin-3 expression pattern among the tumor samples towards tumor progression. It was evident among the breast cancer cell lines representing different tumor stages as well. Even though galectin-3 expression was found decreasing with tumor progression, its expression was found to be regained by the cell line representing metastatic stage. This was clinically confirmed among the metastatic lymph node tumors of TNBC patients (n = 20) by IHC analysis. There are reports suggesting that intracellular galectin-3 in tumor cells favor angiogenesis and metastasis [31]. Metastatic tumor cells interact with endothelial cells during early stages of cancer metastasis [32]. Current study has found galectin-3 overexpression in tumor cells near blood vessels. This was supported by our previous report [33] showing high galectin-3 expression in the tumor emboli. Also, it was found that endothelium-associated galectin-3 mediates tumor-endothelial cell interaction, facilitating the docking of tumor cells and promoting metastasis. This also points out that exogenous TFD (Thomsen Friedenreich disaccharide) would be more effective and specific to block galectin-3-mediated tumorigenesis [34]. Some natural and synthetic galectin-3 antagonists were also reported to inhibit in vitro tumor cell adhesion to endothelium and homotypic aggregation as well as in vivo metastatic deposits of human breast and prostate carcinoma cells. For instance, modified citrus pectin has been reported as an effective antimetastatic drug [35]. Another polysaccharide, GCS-100 derived from citrus pectin has been found effective in treating multiple myeloma cells which are resistant to dexamethasone and doxorubicin. GCS-100 induced myeloma cell death, by modulating cell cycle and influencing the levels of myeloid leukemia cell differentiation protein-1 and NOXA, a Phorbol-12-myristate-13-acetate-induced protein 1 [36]. Thus, expression pattern of galectin-3 in tumor cells representing early-stage tumors, in tumor emboli and metastatic tissues among TNBC subgroup hints towards the possibility of a more complex galectin-3 regulation in tumor progression and metastasis.
Epithelial to mesenchymal transition, being an early event in the metastatic cascade [37], has been analyzed to determine the status of EMT markers in the TNBC subgroup. Several evidences showed that vimentin is associated with the development of tumors by regulating the EMT [38, 39]. Vimentin has also been reported as an important marker during tumor progression [40]. Vimentin is a critical regulator and a prerequisite for the epithelial–mesenchymal transition process [41, 42]. IHC analysis of vimentin showed a positive expression which was significant in early-stage tumors among TNBC cases (p = 0.008). However, western blot results failed to show the trend because of the dominant stromal representation.
In the current study, silencing of galectin-3 resulted in the downregulation of Vimentin and EMT transcription factor, Slug, at the translational level, whereas an increased expression of E-cadherin was obtained at the m-RNA level. Several studies reported the association of vimentin with metastasis. For instance, the migration ability of breast cancer cells, MDA-MB-231, and colon cancer cells, SW480, was found reduced when vimentin expression was obstructed using small interference RNA [43]. Vimentin has also been shown to positively regulate Scribble (Scrib), thereby leading to cell migration and aggregation [44]. Vimentin is also associated with cancer invasion and poor prognosis in several types of cancers, including breast cancer, prostate cancer, melanoma, and lung cancer, and serves as a potential target for cancer therapy [45, 46]. Slug was reported to be a critical modulator of cancer cell invasion by regulating E-cadherin expression. In turn, Slug expression has been reported to be positively regulated by vimentin [47]. It is also reported that a knockdown of Slug inhibited the tumor-initiating ability of MDA-MB231 cells [48]. Gao et al. have reported that galectin-3 stimulates MAPK/ERK1/2 pathway-dependent cell migration [49]. The wound-healing assay carried out to assess the migratory potential of galectin-3-silenced MDA-MB-231 cells showed reduced migration. Moreover, EGFP pull-down and global proteomic analysis revealed that the EMT marker vimentin as an interacting partner of galectin-3. The interaction between galectin-3 and vimentin prompted us to explore the occurrence in tumor tissues of cells co-expressing both proteins. So, an integrative m-RNA analysis of galectin-3 and vimentin was carried out in cBioPortal based on TCGA database. Even though not significant, the analysis detected the chance of co-expression of galectin-3 and vimentin in breast tumor samples. Furthermore, the dual staining of both galectin-3 and vimentin in tumor tissues using IHC confirmed their association in TNBC tissues. This study reinforces the probable participation of the co-expressing cells in initiating metastasis. Considering the known extracellular functions of both galectin-3 and vimentin in metastasis, further studies are indeed required to understand this association in mediating tumor metastasis.
Tumor cells acquiring EMT are regarded to have stem cell properties, and CD44+/CD24– cell surface phenotype has been extensively used to identify and isolate breast cancer cells with increased tumorigenicity [50, 51]. In the current cohort as well, the presence of CD44+/CD24–cancer stem cells in primary tumors representing early stages reinforces the chance of the presence cells with metastatic potential. Moreover, other stem cell markers, such as OCT4, NANOG and SOX2 were found to be transcriptionally downregulated in galectin-3-silenced cells in vitro. The results suggest that the expression of galectin-3 aids to gain the CSC phenotype, along with EMT features in tumor cells.
Emerging evidence suggests a significant correlation between drug resistance and the increased breast CSC populations [52] along with EMT [53, 54]. For instance, vimentin has been reported to protect cells from caspase-mediated proteolysis [55]. Also, upregulation in cellular levels of galectin-3 were already reported in drug-escaped leukemia cells after cisplatin treatment [56]. In our study, galectin-3-silenced cells exhibiting decreased vimentin expression showed apoptotic susceptibility after drug treatment, suggesting that galectin-3 is capable of promoting anti-apoptotic activity, thus facilitating cell survival.
Consistent with the in vitro data, our in vivo tumorigenesis study confirmed that vimentin- and CD44-expressing MDA-MB-231 cells produced spontaneous lung metastases in mice, while galectin-3-silenced cells did not. Tumor growth curve also showed that the tumors of the galectin-3-silenced cells grew more slowly than the control cells. In the control animals, breast cancer cells metastasized to the lung and expressed high levels of the galectin-3 protein as demonstrated by IHC. In compliance with this, breast cancer cells metastasized to the lung expressed high levels of the galectin-3 protein, suggesting that galectin-3 is essential for promoting metastasis.
This study supports the previously reported notion that tumor cell dissemination is not associated with either tumor size or advanced stages [57]. Galectin-3 expression pattern in tumor cells representing early-stages of breast cancer along with EMT markers, as observed in this study cohort, probably aids in the early onset of metastatic spread. This information can be utilized to preselect TNBC patients who will benefit from aggressive therapy. Anti-galectin-3 molecules can be used for inhibiting initiation of EMT and cell survival during early stages of breast cancer, rendering tumor cells susceptible to apoptosis and ultimately eliminating CSCs which are often hidden within the hypoxic, non-proliferative core of a tumor and promote tumor relapse.
There are quite a number of reports demonstrating the role of cytoplasmic galectin-3 in association with adhesion molecules in tumor cell migration, matrix remodeling, metastasis and angiogenesis. Cytoplasmic expression of galectin-3 has been reported to involve in various tumor invasion- and metastasis-related processes in breast cancer, such as angiogenesis and EMT [58]. Mechanistically, galectin-3 activates the PI3K-Akt-GSK-3β-β-catenin signaling cascade; the β-catenin/TCF4 transcriptional complex directly targets IGFBP3 and vimentin to regulate angiogenesis and EMT, respectively. Song et al. have already documented that galectin-3 enhances tumorigenesis and metastasis of hepatocellular carcinoma (HCC) cells via β-catenin signaling. Moreover, they found that molecular deletion of galectin-3-β-catenin signaling synergistically improves the anti-tumor effect of sorafenib and the Galectin-3-β-catenin-IGFBP3/vimentin signaling cascade was determined as a central mechanism controlling HCC [59]. A similar explanation can be drawn from the current study, as we could document the inhibition of tumor progression, cell migration and metastasis upon galectin-3-silencing. This further supports the notion that galectin-3 regulation could be a valuable tool in the effective management of TNBC.
Acknowledgments
We greatly acknowledge the support of DBT (BT/PR18812/COE/34/01/2017). TJR was supported by KSCSTE, Govt. of Kerala. AL was supported by Senior Research Fellowship from CSIR, Govt. of India. The authors acknowledge the support extended by Bio-imaging Facility and Animal Research Facility, RGCB, Thiruvananthapuram. The support extended by Valerian Chem Pvt. Ltd.; New Delhi for Mass Spectrometric analysis is also acknowledged.
Author contributions
CONCEPTION: TJR, KS and TRSK
DATA CURATION: TJR, AL, PD, ATM and KC
ANALYSIS OF DATA: JKKM, TJR, TS, PR and RVB
PREPARATION OF THE MANUSCRIPT: TJR
REVISION FOR IMPORTANT INTELLECTUAL CONTENT: TJR, KS, TRSK, MRP, APM and PA
SUPERVISION: KS and TRSK
Conflict of interest
TJR has no conflict of interest to report.
AL has no conflict of interest to report.
PD has no conflict of interest to report.
PR has no conflict of interest to report.
JKKM has no conflict of interest to report.
ATM has no conflict of interest to report.
PA has no conflict of interest to report.
APM has no conflict of interest to report.
KC has no conflict of interest to report.
RVB has no conflict of interest to report.
TS has no conflict of interest to report.
MRP has no conflict of interest to report.
TRSK has no conflict of interest to report.
KS has no conflict of interest to report.
Supplementary material
[1] The supplementary material is available in the electronic version of this article: https://dx.doi.org/10.3233/TUB-230002.
References
[1] | Sandhu GS , Erqou S , Patterson H , Mathew A Prevalence of triple-negative breast cancer in India: Systematic review and meta-analysis, J Glob Oncol. (2016) ;2: (6):412–21. doi: 10.1200/JGO.2016.005397. |
[2] | Lebert JM , Lester R , Powell E , Seal M , McCarthy J Advances in the systemic treatment of triple-negative breast cancer, Curr Oncol. (2018) ;25: :S142–50. doi: 10.3747/co.25.3954. |
[3] | Dent R , Trudeau M , Pritchard KI , Hanna WM , Kahn HK , Sawka CA , Lickey LA , Rawlinson E , Sun P , Narod SA Triple-negative breast cancer: Clinical features and patterns of recurrence, Cancer Res. (2007) ;13: :4429–34. doi: 10.1158/1078-0432.CCR-06-3045. |
[4] | Liedtke C , Mazouni C , Hess KR , Andre F , Tordai A , Mejia JA , et al. Response to neoadjuvant therapy and long-term survival in patients with triple negative breast cancer, J Clin Oncol. (2008) ;26: :1275–81. 10.1200/JCO.2007.14.4147. |
[5] | Thakur KK , Bordoloi D , Kunnumakkara AB Alarming burden of triple-negative breast cancer in India, Clin Breast Cancer. (2018) ;18: (3):e393–99. doi: 10.1016/j.clbc.2017.07.013. |
[6] | Mukherjee P , Gupta A , Chattopadhyay D , Chatterji U Modulation of SOX2 expression delineates an end-point for paclitaxel effectiveness in breast cancer stem cells, Sci Rep. (2017) ;7: :9170. doi: 10.1038/s41598-017-08971-2. |
[7] | Zhang X , Zhang Z , Zhang Q , Zhang Q , Sun P , Xiang R , Ren G , Yang S ZEB1 confers chemotherapeutic resistance to breast cancer by activating ATM, Cell Death Dis. (2018) ;9: :57. doi: 10.1038/s41419-017-0087-3. |
[8] | Volk-draper L , Hall K , Griggs C , Rajput S , Kohio P , DeNardo D , Ran S Paclitaxel therapy promotes breast cancer metastasis in TLR4-dependent manner, Cancer Res. (2014) ;74: :5421–34. doi: 10.1158/0008-5472.CAN-14-0067. |
[9] | Nedeljković M , Damjanović A Mechanisms of chemotherapy resistance in triple-negative breast cancer-How we can rise to the challenge, Cells. (2019) ;8: :957. doi: 10.3390/cells8090957. |
[10] | Tomao F , Papa A , Zaccarelli E , Rossi L , Caruso D , Minozzi M , Vici P , Frati L , Tomao S Triple-negative breast cancer: New perspectives for targeted therapies, OncoTarget Ther. (2015) ;8: :177–93. doi: 10.2147/OTT.S67673. |
[11] | Jhan JR , Andrechek ER Triple-negative breast cancer and the potential for targeted therapy, Pharmacogenomics. (2017) ;18: :1595–160. doi: 10.2217/pgs-2017-0117. |
[12] | Idikio H Galectin-3 expression in human breast carcinoma: Correlation with cancer histologic grade, Int J Oncol. (1998) ;6: :1287–90. doi: 10.3892/ijo.12.6.1287. |
[13] | Sujathan K , Somanathan T , Nimi GK , et al. Down regulation of Gal-3 in primary tumor tissues of breast predict axillary lymph node metastasis, J Cancer Res and Exp Oncol. (2011) ;3: (4):37–49. https://doi.org/10.5897/JCREO.9000008 |
[14] | Zhang H , Luo M , Liang X , Wang D , Gu X , Duan C , Gu H , Chen G , Zhao X , Zhao Z , Liu C Galectin-3 as a marker and potential therapeutic target in breast cancer, PLoS One. (2014) ;9: (9):e1034821. doi: 10.1371/journal.pone.0103482. |
[15] | Puleo J , Polyak K The MCF10 model of breast tumor progression, Cancer Res. (2021) ;81: (16):4183–5. doi: 10.1158/0008-5472.CAN-21-1939. |
[16] | Soule HD , Maloney TM , Wolman SR , Peterson WD Jr , Brenz R , McGrath CM , Brooks SC Isolation and characterization of a spontaneously immortalized human breast epithelial cell line, MCF-10, Cancer Res. (1990) ;50: (18):6075–86, PMID: 1975513. |
[17] | Zhang D , Chen ZG , Liu SH , Dong ZQ , Dalin M , Bao SS , et al. Galectin-3 gene silencing inhibits migration and invasion of human tongue cancer cells in vitro via downregulating β-catenin, Acta Pharmacol Sin. (2013) ;34: (1):176–8410. doi: 10.1038/aps.2012.150. |
[18] | Çakır Y , Kelten Talu C , Mermut Ö , Can Trabulus D , Arslan E The expression of galectin-3 in tumor and cancer-associated fibroblasts in invasive micropapillary breast carcinomas: Relationship with clinicopathologic parameters, Eur J Breast Health. (2021) ;17: (4):341–51. doi: 10.4274/ejbh.galenos.2021.2021-2-8. |
[19] | Ilmer M , Mazurek N , Gilcrease MZ , et al. Low expression of galectin-3 is associated with poor survival in node-positive breast cancers and mesenchymal phenotype in breast cancer stem cells, Breast Cancer Research. (2016) ;18: (1):97. doi.org/10.1186/s13058-016-0757-6. |
[20] | Kao MW , Su YC , Liang PI , Wu YY , Hong TM Low galectin-3 expression level in primary tumors is associated with metastasis in T1 lung adenocarcinoma, J Clin Med (1990) ;9: (6). doi: 10.3390/jcm9061990. |
[21] | Bresalier RS , Yan PS , Byrd JC , Lotan R , Raz A Expression of the endogenous galactose-binding protein galectin-3 correlates with the malignant potential of tumors in the central nervous system, Cancer. (1997) ;80: (4):776–87. PMID: 9264362. |
[22] | Song S , Mazurek N , Liu C , et al. Galectin-3 mediates nuclear beta-catenin accumulation and Wnt signaling in human colon cancer cells by regulation of glycogen synthase kinase-3beta activity, Cancer Res (2009) ;69: , 1343–9. |
[23] | Takeshi S , Michiie S , Yoshinori I , Kazuaki S , Tomoo K , Yasuto S , Katsuaki T , Hisahiko S , Setsuo H Clinicopathological significance of galectin-3 expression in ductal adenocarcinoma of the pancreas, Clin Can Res (2002) ;8: , 2570–5. |
[24] | Shekhar MP , Nangia-Makker P , Tait L , Miller F , Raz A Alterations in galectin-3 expression and distribution correlate with breast cancer progression: Functional analysis of galectin-3 in breast epithelial-endothelial interactions, Am J Pathol (2004) ;165: , 1931–41. |
[25] | Elad-Sfadia G , Haklai R , Balan E , Kloog Y Galectin-3 augments K-Ras activation and triggers a Ras signal that attenuates ERK but not phosphoinositide 3-kinase activity, J Biol Chem. (2004) ;279: (33):34922–30. doi: 10.1074/jbc.M312697200. |
[26] | Shalom-Feuerstein R , Cooks T , Raz A , Kloog Y Galectin-3 regulates a molecular switch from N-Ras to K-Ras usage in human breast carcinoma cells, Cancer Res. (2005) ;65: (16):7292–300. doi: 10.1158/0008-5472.CAN-05-0775. |
[27] | Hsu DK , Chen HY , Liu FT Galectin-3 regulates T-cell functions, Immunol Rev. (2009) ;230: :114–27. doi: 10.1111/j.1600-065X.2009.00798.x. |
[28] | Akahani S , Nangia-Makker P , Inohara H , et al. Gal- A novel antiapoptotic molecule with a functional BH1 (NWGR) domain of Bcl-2 family, Cancer Res. (1997) ;57: :5272–6. PMID: 9393748. |
[29] | Etulain J , Negrotto S , Tribulatti MV , et al. Control of angiogenesis by galectins involves the release of platelet-derived proangiogenic factors, PLoS One. (2014) ;9: :e96402. doi: 10.1371/journal.pone.0096402. |
[30] | Nangia-Makker P , Nakahara S , Hogan V , et al. Galectin-3 in apoptosis, a novel therapeutic target, J Bioenerg Biomembr. (2007) ;39: :79–84. doi: 10.1007/s10863-006-9063-9. |
[31] | Funasaka T , Raz A , Nangia-Makker P Galectin-3 in angiogenesis and metastasis, Glycobiology. (2014) ;24: (10):886–91. doi: 10.1093/glycob/cwu086. |
[32] | Al-Mehdi AB , Tozawa K , Fisher AB , Shientag L , Lee A , Muschel RJ Intravascular origin of metastasis from the proliferation of endothelium-attached tumor cells: A new model for metastasis, Nat Med. (2000) ;6: :100–2. doi: 10.1038/71429. |
[33] | Jeethy Ram T , Lekshmi A , Somanathan T , Sujathan K Galectin- A factotum in carcinogenesis bestowing an archery for prevention, Tumour Biol. (2021) ;43: (1):77–96. doi: 10.3233/TUB-200051. |
[34] | Guha P , Kaptan E , Bandyopadhyaya G , Kaczanowska S , Davila E , Thompson K , Martin SS , Kalvakolanu DV , Vasta GR , Ahmed H Cod glycopeptide with picomolar affinity to galectin-3 suppresses T-cell apoptosis and prostate cancer metastasis, Proc Natl Acad Sci U S A. (2013) ;110: (13):5052–7. doi: 10.1073/pnas.1202653110. |
[35] | Glinskii OV , Huxley VH , Glinsky GV , Pienta KJ , Raz A , Glinsky VV Mechanical entrapment is insufficient and intercellular adhesion is essential for metastatic cell arrest in distant organs, Neoplasia. (2005) ;7: (5):522–7. doi: 10.1593/neo.04646. |
[36] | Streetly MJ , Maharaj L , Joel S , Schey SA , Gribben JG , Cotter FE GCS-100, a novel galectin-3 antagonist, modulates MCL-1, NOXA, and cell cycle to induce myeloma cell death, Blood. (2010) ;115: (19):3939–48. doi: 10.1182/blood-2009-10-251660. |
[37] | Tiwari N , Gheldof A , Tatari M , Christofori G EMT as the ultimate survival mechanism of cancer cells, Semin Cancer Biol. (2012) ;22: (3):194–207. doi: 10.1016/j.semcancer.2012.02.013. |
[38] | Bronte G , et al. Epithelial-to-mesenchymal transition and EGFR status in NSCLC: The role of vimentin expression, Ann Oncol. (2019) ;30: (2):339–40. doi: 10.1093/annonc/mdy548. |
[39] | Liu CY , et al. Vimentin contributes to epithelial-mesenchymal transition cancer cell mechanics by mediating cytoskeletal organization and focal adhesion maturation, Oncotarget. (2015) ;6: (18):15966–83. doi: 10.18632/oncotarget.3862. |
[40] | Vuoriluoto K , Haugen H , Kiviluoto S , Mpindi JP , Nevo J , Gjerdrum C , et al. Vimentin regulates EMT induction by Slug and oncogenic H-Ras and migration by governing Axl expression in breast cancer, Oncogene. (2011) ;30: :1436–48. doi: 10.1038/onc.2010.509. |
[41] | Gilles C , Polette M , Zahm JM , Tournier JM , Volders L , Foidart JM , et al. Vimentin contributes to human mammary epithelial cell migration, J Cell Sci. (1999) ;112: :4615–25. doi: 10.1242/jcs.112.24.4615. |
[42] | Zhu QS , Rosenblatt K , Huang , KL , Lahat G , Brobey R , Bolshakov S , et al. Vimentin is a novel AKT1 target mediating motility and invasion, Oncogene. (2011) ;30: :457–70. doi: 10.1038/onc.2010.421. |
[43] | McInroy L , Maatta A Down-regulation of vimentin expression inhibits carcinoma cell migration and adhesion, Biochem Biophys Res Commun. (2007) ;360: (1):109–14. doi: 10.1016/j.bbrc.2007.06.036. |
[44] | Phua DC , Humbert PO , Hunziker W Vimentin regulates scribble activity by protecting from proteasomal degradation, Mol Biol Cell. (2009) ;20: :2841–55. doi: 10.1091/mbc.e08-02-0199. |
[45] | Satelli A , Li S Vimentin in cancer and its potential as a molecular target for cancer therapy, Cell Mol Life Sci. (2011) ;68: :3033–46. doi: 10.1007/s00018-011-0735-1. |
[46] | Lehtinen L , Ketola K , Makela R , Mpindi JP , Viitala M , Kallioniemi O , Iljin K High-throughput RNAi screening for novel modulators of vimentin expression identifies MTHFD2 as a regulator of breast cancer cell migration and invasion, Oncotarget. (2013) ;4: :48–63. doi: 10.18632/oncotarget.756. |
[47] | Bolos V , et al. The transcription factor Slug represses E-cadherin expression and induces epithelial to mesenchymal transitions: A comparison with Snail and E47 repressors, J Cell Sci. (2003) ;116: (Pt 3):499–511. doi: 10.1242/jcs.00224. |
[48] | Guo W , Keckesova Z , Donaher JL , Shibue T , Tischler V , Reinhardt F , Itzkovitz S , Noske A , Zürrer-Härdi U , Bell G , Tam WL , Mani SA , van Oudenaarden A , Weinberg RA Slug and Sox9 cooperatively determine the mammary stem cell state, Cell. (2012) ;148: (5):1015–28. doi: 10.1016/j.cell.2012.02.008. |
[49] | Gao X , Balan V , Tai G , Raz A Galectin-3 induces cell migration via a calcium-sensitive MAPK/ERK1/2pathway, Oncotarget. (2014) ;5: (8):2077–84. doi: 10.18632/oncotarget.1786. |
[50] | Mani SA , Guo W , Liao MJ , Eaton EN , Ayyanan A , Zhou AY , Brooks M , Reinhard F , Zhang CC , Shipitsin M , et al. The epithelial-mesenchymal transition generates cells with properties of stem cells, Cell. (2008) ;133: :704–15. doi: 10.1016/j.cell.2008.03.027. |
[51] | Sheridan C , Kishimoto H , Fuchs RK , Mehrotra S , Bhat-Nakshatri P , Turner CH , Goulet R Jr , Badve S , Nakshatri H CD44+/CD24-breast cancer cells exhibit enhanced invasive properties: An early step necessary for metastasis, Breast Cancer Res. (2006) ;8: (5):R59. doi: 10.1186/bcr1610. |
[52] | Phi LTH , Sari IN , Yang YG , Lee SH , Jun N , Kim KS , Lee YK , Kwon HY Cancer stem cells (CSCs) in drug resistance and their therapeutic implications in cancer treatment, Stem Cell Int, (2018) ;5416923. doi: 10.1155/2018/5416923. |
[53] | Arumugam T , et al. Epithelial to mesenchymal transition contributes to drug resistance in pancreatic cancer, Cancer Res. (2009) ;69: :5820–8. doi: 10.1158/0008-5472.CAN-08-2819. |
[54] | Shibue T , Weinberg RA EMT, CSCs, and drug resistance: The mechanistic link and clinical implications, Nat Rev Clin Oncol. (2017) ;14: :611. doi: 10.1038/nrclinonc.2017.44. |
[55] | Chakraborty S , Kumar A , Faheem MM , et al. Vimentin activation in early apoptotic cancer cells errands survival pathways during DNA damage inducer CPT treatment in colon carcinoma model, Cell Death Dis. (2019) ;10: :467. https://doi.org/10.1038/s41419-019-1690-2 |
[56] | Cheng YL , Huang WC , Chen CL , Tsai CC , Wang CY , Chiu WH , Chen YL , Lin YS , Chang CF , Lin CF Increased galectin-3 facilitates leukemia cell survival from apoptotic stimuli, Biochem Biophys Res Commun. (2011) ;412: (2):334–40. doi: 10.1016/j.bbrc.2011.07.099. |
[57] | Hüsemann Y , Geigl JB , Schubert F , Musiani P , Meyer M , Burghart E , Forni G , Eils R , Fehm T , Riethmüller G , Klein CA Systemic spread is an early step in breast cancer, Cancer Cell. (2008) ;13: (1):58–68. doi: 10.1016/j.ccr.2007.12.003. |
[58] | Girotti MR , Salatino M , Dalotto-Moreno T , Rabinovich GA Sweetening the hallmarks of cancer: Galectins as multifunctional mediators of tumor progression, J Exp Med. (2020) ;217: (2):e20182041. doi: 10.1084/jem.20182041. |
[59] | Song M , Pan Q , Yang J , He J , Zeng J , Cheng S , Huang Y , Zhou ZQ , Zhu Q , Yang C , Han Y , Tang Y , Chen H , Weng DS , Xia JC Galectin-3 favours tumour metastasis via the activation of β-catenin signalling in hepatocellular carcinoma, Br J Cancer. (2020) ;123: (10):1521–34. doi: 10.1038/s41416-020-1022-4. |


