
Identification of HPV16 positive cervical cancer subsets characterized by divergent immune and oncogenic phenotypes with potential implications for immunotherapy
Abstract
BACKGROUND:
Cervical cancers (CaCx), like many other cancer types, portray high molecular heterogeneity that affects response to therapy, including immunotherapy. In India and other developing countries, CaCx mortality rates are very high because women report to the clinics with advanced cancers in absence of organized screening programs. This calls for implementation of newer therapeutic regimens for CaCx, like immunotherapy, which is again not used commonly in such countries.
OBJECTIVE:
Therefore, we focused on dissecting tumour immune heterogeneity, if any, identify immune gene-based biomarkers of heterogeneity and subsets of such cancers with the potential for immunotherapy. We also attempted to characterize the cancer-associated phenotypes of such subsets, including viral load, to decipher the relationship of tumour immunogenicity with oncogenicity.
METHODS:
Employing RNA-seq analysis of 44 HPV16 positive CaCx patients, immune subtypes were identified by unsupervised hierarchical clustering of global immune-gene expression profiles. Proportions of tumor infiltrating immune cells in the tumor milieu were estimated, employing Cell-type Identification by Estimating Relative Subsets of RNA Transcripts (CIBERSORT), using gene expression data from RNA-seq. The oncogenic phenotypes of the immune subtypes of CaCx were deciphered through differential gene expression (DEGs) and pathway enrichment analysis. Viral load was estimated through TaqMan-based qRT-PCR analysis.
RESULTS:
Analysis revealed the presence of two immune subtypes of CaCx, A (26/44; 59.09%) and B (18/44; 40.90%). Compared to Subtype-A, Subtype-B portrayed overexpression of immune genes and high infiltration of immune cells, specifically CD8+ T cells (p < 0.0001). Besides, a significant correlation between PD-1 and PD-L1 co-expression among Subtype-B, as opposed to Subtype-A, confirmed the interactive roles of these immune checkpoint molecules in Subtype B. Stepwise discriminant analysis pin-pointed ten immune-genes that could classify 100% of the patients significantly (p < 0.0001) into the two immune subtypes and serve as potential biomarkers of CaCx immunity. Differential gene expression analysis between the subtypes unveiled that Subtype-B was more biologically aggressive than Subtype-A, reflecting loss of structural integrity and promotion of cancer progression. The viral load was significantly lower in Subtype-B (average viral load = 10.74/100 ng of genomic DNA) compared to Subtype-A (average viral load = 14.29/100 ng of genomic DNA). Thus viral load and the ten-gene panel underscore their association with immunogenicity and oncogenicity.
CONCLUSION:
Our study provides strong evidence that only a subset, about 41% of HPV16 positive CaCx patients in India, portray immune enrichment of the tumor milieu coupled with aggressive phenotypes. Such subtypes are therefore likely to benefit through checkpoint molecule-based or tumor infiltrating lymphocyte-based immunotherapy, which could be a leap forward in tackling aggressive forms of such CaCx in India and other developing countries.
Abbreviations
CaCx | Cervical Cancer |
HPV | Human Papilloma Virus |
RIN | RNA Integrity Number |
TPM | Transcript per million |
ImmPort | Immunology database and Analysis Portal |
TME | Tumor Microenvironment |
CIBERSORT | Cell-type Identification by Estimating Relative Subsets of RNA Transcripts |
TIICs | Tumor Infiltrating Immune Cells |
DEGs | Differentially Expressed Genes |
FDR | False Discovery Rate |
DAVID | Database for Annotation, Visualization and Integrated Discovery |
BH | Benjamini Hochberg |
ROC | Receiver Operating Curve |
AUC | Area Under the Curve |
1Introduction
Globally, the prevalence of cervical cancer (CaCx) remains to be high, with more than 50% of affected women succumbing to death [1]. Nearly all such cancers are Human Papillomavirus (HPV)-driven [2] and are most prominent among immune compromised women [3, 4]. Furthermore, only women having persistent HPV infection develop the disease [5]. Such observations are suggestive of the significant role of host immunity in the natural control of HPV infection.
Currently, the major treatment options available for CaCx patients are surgical interventions, chemotherapy and/or radiotherapy. However, these show limited efficacy for advanced cancers [6]. Immunotherapy, a new paradigm in cancer therapy, has significantly enriched the treatment of several cancers [7], like lung, bladder, renal, and head and neck cancers, and has recently been approved for CaCx as well (https://www.fda.gov/drugs/resources-information-approved-drugs/fda-approves-pembrolizumab-combination-first-line-treatment-cervical-cancer). Since CaCx is virus-driven, so there is a strong justification to explore the possibilities of using immunotherapy as a treatment option [6]. Tumor molecular heterogeneity is known to have significant impact on response to therapy, particularly in advanced-stage cancers [8]. It is observed through large clinical trials on CaCx that only a small subset of patients (12.2% in advanced cancers and 14.6% in PD-L1 positive cancers) show favorable response to immunotherapy [9, 10]. This has been attributed to altered molecular profiles and acquired resistance in the form of antigen escape and immunosuppression [8]. Therefore, elucidation of the role of tumor-associated immune components, together with other molecular factors, are likely to provide important insights into the etiopathogenesis of CaCx and help in the development of prognostic tools and therapeutic interventions.
Earlier studies from our laboratory have revealed heterogeneity of CaCx with respect to viral [11, 12] as well as host factors [13, 14]. Further on, in this study, we aimed to dissect out tumor immune heterogeneity, if any, considering the expression status of a large majority of immune pathway genes and characterise these tumors with respect to host immune-related factors, cancer-associated phenotypes and viral factors. Through such analysis, we intended to draw cues towards patient stratification for the implementation of immunotherapy, because not all patients respond equally. Our study reflects that a subset, about 41% of CaCx patient samples interrogated in this study, portrayed immune-enriched and aggressive oncogenic features potentially suitable for the implementation of this novel therapeutic regimen.
2Methods
2.1Patient recruitment and ethical approval
CaCx tissue biopsies were collected from treatment-naïve married women (median age: 54 years) who were diagnosed with CaCx (histopathologically confirmed) at Tata Medical Centre (TMC), West Bengal, with written informed consent to participate in the study. The study was approved by the Institutional Ethics Committee of our collaborating institution, TMC, Kolkata (Ref No.: EC/GOVT/18/17 dated January 3, 2018) and National Institute of Biomedical Genomics, Kalyani. The clinical parameters corresponding to the patients included in the study are summarized in Supplementary Table S1.
2.2Sample processing, transcriptome sequencing data generation and analysis
DNA was isolated from the cervical biopsy tissues using Qiagen DNA Mini Kit and screened for HPV using DNA-based PCR primers as mentioned in our earlier studies [13]. Only HPV16-positive samples were considered for further analysis. RNA was isolated from these tissues using Qiagen RNeasy Mini Kit. The quality and integrity of the RNA samples was determined using Agilent Bioanalyzer 2100 (Agilent Technologies) and samples having RIN (RNA Integrity Number)≥6.5 were used for library preparation using TruSeq Stranded Total RNA Library Prep kit (Illumina) and sequenced in Nova-Seq 6000 (Illumina) for a minimum of 100 million reads (paired-end reads). The sequencing details of the samples (n = 44) are provided in Supplementary Table S2.
RNA-seq data was analyzed as per GDC RNA-seq analysis recommendation [https://docs.gdc.cancer.gov/Data/Bioinformatics_Pipelines/Expression_mRNA_Pipeline/] [15], involving a suite of packages including FastQC-0.11.7 (https://www.bioinformatics.bbsrc.ac.uk/projects/fastqc/), STAR aligner (STAR-2.6.0c) and HTSeq (HTSeq-0.11.0). Differential gene expression analysis between the groups was performed using DESeq2 [16]. The gene expression, i.e., TPM (Transcript per million) values were generated using TPMCalculator [17] tool.
2.3Identification of molecular subtypes of CaCx based on expression status of immune genes
The molecular subtypes of CaCx were identified based on the global immune gene expression. The immune-related gene list belonging to different immune processes was downloaded from the Immunology database and Analysis Portal (ImmPort) database (https://www.immport.org/shared/genelists). The expression (TPM) values of all these immune genes in our patient cohort was extracted and the genes that were expressed (TPM > 0) in at least 80% of our patient cohort, were considered for further analysis. The unsupervised clustering with the immune genes was performed using the pheatmap package in R (https://cran.r-project.org/web/packages/pheatmap/pheatmap.pdf).
2.4Analysis of Immune cell composition in the Tumor microenvironment (TME) from bulk RNA-seq data
The immune cell abundance in the CaCx tissues was determined using Cell-type Identification by Estimating Relative Subsets of RNA Transcripts (CIBERSORT)-absolute deconvolution algorithm with LM22 signature genes and 100 permutations (default). The gene expression (TPM values) was used to generate a proportion matrix of 22 Tumor Infiltrating Immune Cells (TIICs) in these tissues [18].
2.5Stepwise Discriminant Analysis to identify a minimal set of genes that can efficiently identify patients belonging to the molecular subtypes of the CaCx
To identify a subset of immune genes that can efficiently differentiate and classify the patients into subtypes, we used stepwise discriminant analysis method. For this, we considered the immune genes showing significantly different expression levels between the subtypes and then performed forward stepwise discriminant analysis, in which the variables (genes) were sequentially added to the discriminant function starting with the gene that discriminates the best. We used the Wilks’ ∧ statistic and the F-value for identifying the variable to be added at each step; the variable that significantly (based on F-value) minimizes Wilks’ ∧ at that step [19].
2.6Expression analysis of host immune checkpoint molecules using quantitative Real time PCR (qRT-PCR)
cDNA was generated from 400 ng of RNA using High Capacity cDNA Reverse transcription Kit (Applied Biosystems, Cat No-4368814) with both oligo-dTP3 and random hexamers as described in earlier studies of our laboratory [13]. The gene expression of the relevant genes was determined in the samples using SYBR Green based qRT-PCR by relative quantification (ΔCt) method. The list of primers used for the assays are provided in Supplementary Table S3, while the dissociation curves and amplification plots corresponding to the genes are depicted in Supplementary Figure S1.
2.7Estimation of viral load in the CaCx tissues
The copy number of HPV16 genome (viral load) per hundred nanogram (ng) of genomic DNA (natural log transformed) in the CaCx tissues were estimated employing TaqMan based qRT-PCR assay as described earlier [20] and elaborated in “Supplementary methods”.
2.8Evaluation of the potential of immune genes as biomarkers to distinguish between the subtypes
To estimate the potential of the host immune genes as effective biomarkers for distinguishing the immune subtypes of CaCx, Receiver Operating Curve (ROC) analysis was done to calculate the Area Under the Curve (AUC) using GraphPad Prism 9.0 software.
2.9Data visualisation, Bioinformatics and Statistical analysis
The heatmaps were generated using the R pheatmap package. Box plots were created to represent the distribution across different groups using R and GraphPad Prism 9.0. The statistical analysis between the groups was performed using unpaired student’s t-test. All the statistical tests (2-sided) with p < 0.05 were considered as significant and were performed in R and GraphPad Prism 9.0. Pearson’s correlation coefficient (r) between the genes was calculated using R.
3Results
3.1Global immune gene expression-based analysis reveals the presence of multiple subtypes of HPV16 positive CaCx
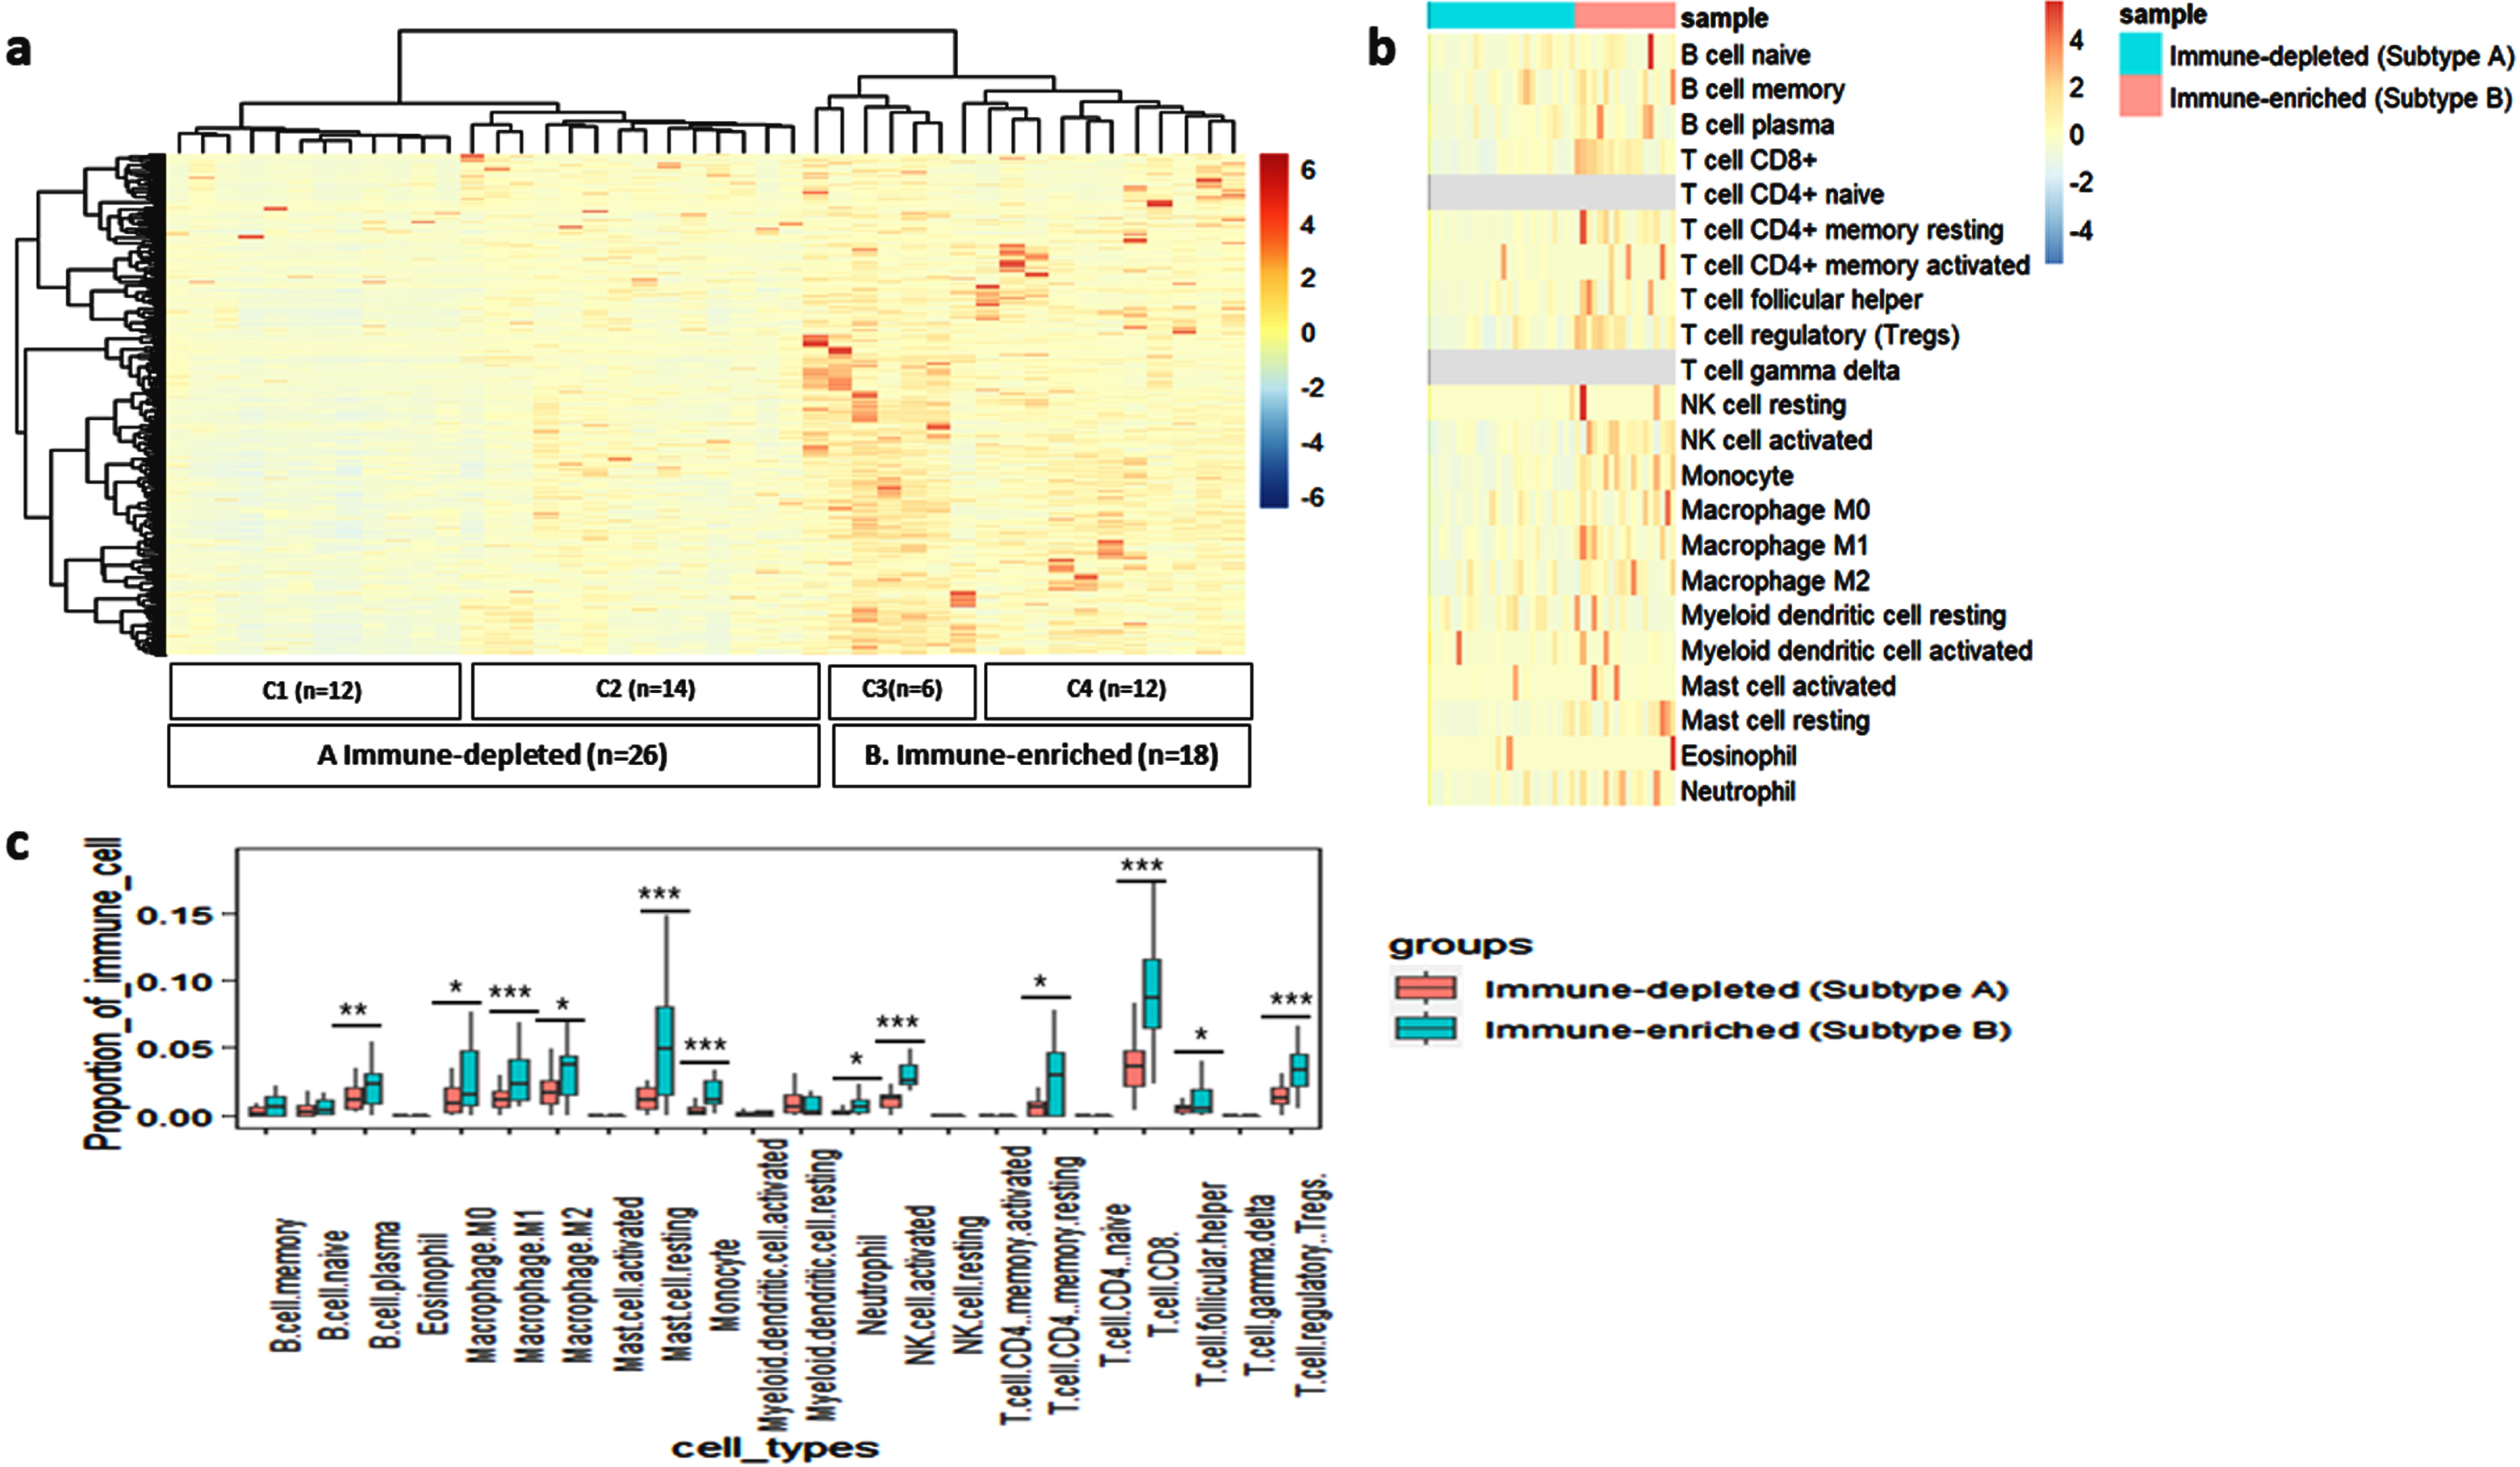
We undertook this analysis to decipher the existence of molecular subtypes within the CaCx patients with respect to immune gene expression profiles, exploring the ImmPort Database (involving 2483 immune-related genes). Of these, 1471 genes were expressed (TPM > 0) in at least 80% of the CaCx patient cohort. Unsupervised hierarchical clustering based on the expression of these 1471 genes, using the Euclidean distance and ward.D2 clustering method, revealed 4 subtypes, as shown in Fig. 1a. The subtypes were designated as C1, C2, C3 and C4 and included 12, 14, 6 and 12 samples respectively. The heatmap further revealed that subtypes C1 and C2 showed lower expression for most of the immune genes, compared to subtypes C3 and C4. Therefore, subsequently we considered the subtypes C1 and C2 as immune-depleted tumors and designated as Subtype-A (n = 26) and C3 and C4 as immune-enriched tumors, designated as Subtype-B (n = 18).
Fig. 1
Identification and characterisation of immune-related subtypes of CaCx patients based on the global immune gene expression. (a) Unsupervised hierarchical clustering of the CaCx patients (n = 44) based on the expression (TPM) of the immune pathway genes showing two major subtypes: A (Immune-depleted-C1 and C2) and B (Immune-enriched –C3 and C4). The blue and red colour in the heatmap indicates low and high expression of the immune genes, respectively. (b) Heatmap showing the proportions of 22 Immune cell types in the tumor microenvironment across the 2 immune subtypes i.e A (Immune-depleted) and B (Immune-enriched), generated using CIBERSORT. Blue and red represent lower and higher proportions of immune cells, respectively. (c) Boxplot exhibiting the difference of proportion of 22 immune cells across the 2 immune subtypes- A and B. p < 0.05 is represented as “*”, p < 0.001 is represented as “**” and p < 0.0001 is represented as “***”.
We further investigated whether the formation of immune molecular subtypes is dependent on the stage of the disease. For this we undertook the similar analysis, considering separately the early-stage patients (n = 9) and late-stage patients (n = 34). Unsupervised hierarchical clustering with the immune genes (n = 1369), which were expressed in at least 80% of the early-stage patient samples, revealed the presence of 2 distinct immune subtypes, as depicted in Supplementary Figure S2a. Similar immune subtypes were also identified with the immune genes (n = 1481) expressed in 80% of the late-stage patients, as shown in Supplementary Figure S2b. Thus, immune subtypes within the HPV16 positive CaCx patient samples were independent of the clinical stage of the disease.
3.2Subtype-B tumors showed significantly higher proportions of TIICs as compared to Subtype-A tumors
One of the major components of TME are infiltrating immune cells, which play an important role in determining treatment response in cancers [21]. Therefore, we estimated the proportion of TIICs using CIBERSORT within the Subtype-A and B tumors, the details of which are provided in Supplementary Table S4. Overall, Subtype-B showed higher infiltration of TIICs, compared to Subtype-A (Fig. 1b). However, we found a significantly (pt - test<0.0001) higher proportion of CD8+ T cells in Subtype-B (mean CD8+ T cells proportion = 0.09±0.04) compared to Subtype-A (mean CD8+ T cells proportion = 0.03±0.02). We also recorded significantly (pt - test<0.05) higher proportion of other TIICs, as well, such as macrophages (M0, M1 and M2), CD4+ memory resting cells, monocytes, activated NK cells, plasma B cells, Tregs and neutrophils in Subtype-B tumors, as compared to Subtype-A tumors, reflecting an immune-enriched phenotype of such tumors, as indicated in Fig 1c.
3.3Subtype-B tumors portrayed a significant correlation between the immune checkpoint molecules PD-L1 and PD-1, as opposed to Subtype-A tumors
In view of the immense relevance of immune checkpoint molecules in immunotherapy, we investigated the expression of some key immune checkpoint molecules along with their ligands across the subtypes. Overall, a higher expression (TPM) of these molecules was observed among the Subtype-B tumors in comparison to Subtype-A as portrayed by the heatmap (Fig 2a). The details of the immune checkpoint molecules and their ligands are provided in Supplementary Table S5. We have also validated the expression of 2 key molecules, PD-1 and PD-L1, in these subtypes by qRT-PCR assay. Based on such analysis, PD-L1 showed significant upregulation in Subtype-B (Fold change = 5.37, pt - test=0.001) as compared to Subtype-A (shown in Supplementary Figure S3a).
Fig. 2
Characterization of CaCx immune subtypes based on the expression of immune checkpoint molecules. (a) Heatmap representing the expression (TPM) values of key immune checkpoint molecules and their ligands between the two subtypes –A (immune-depleted) and B (immune-enriched). The blue and red colours represent lower and higher expression of the molecules, respectively. (b-c) Sample-wise correlation plots between the expression (TPM) of PD-1 (PDCD1) and PD-L1 (CD274) among the two immune subtypes- (b) A (immune-depleted) and (c) B (immune-enriched).
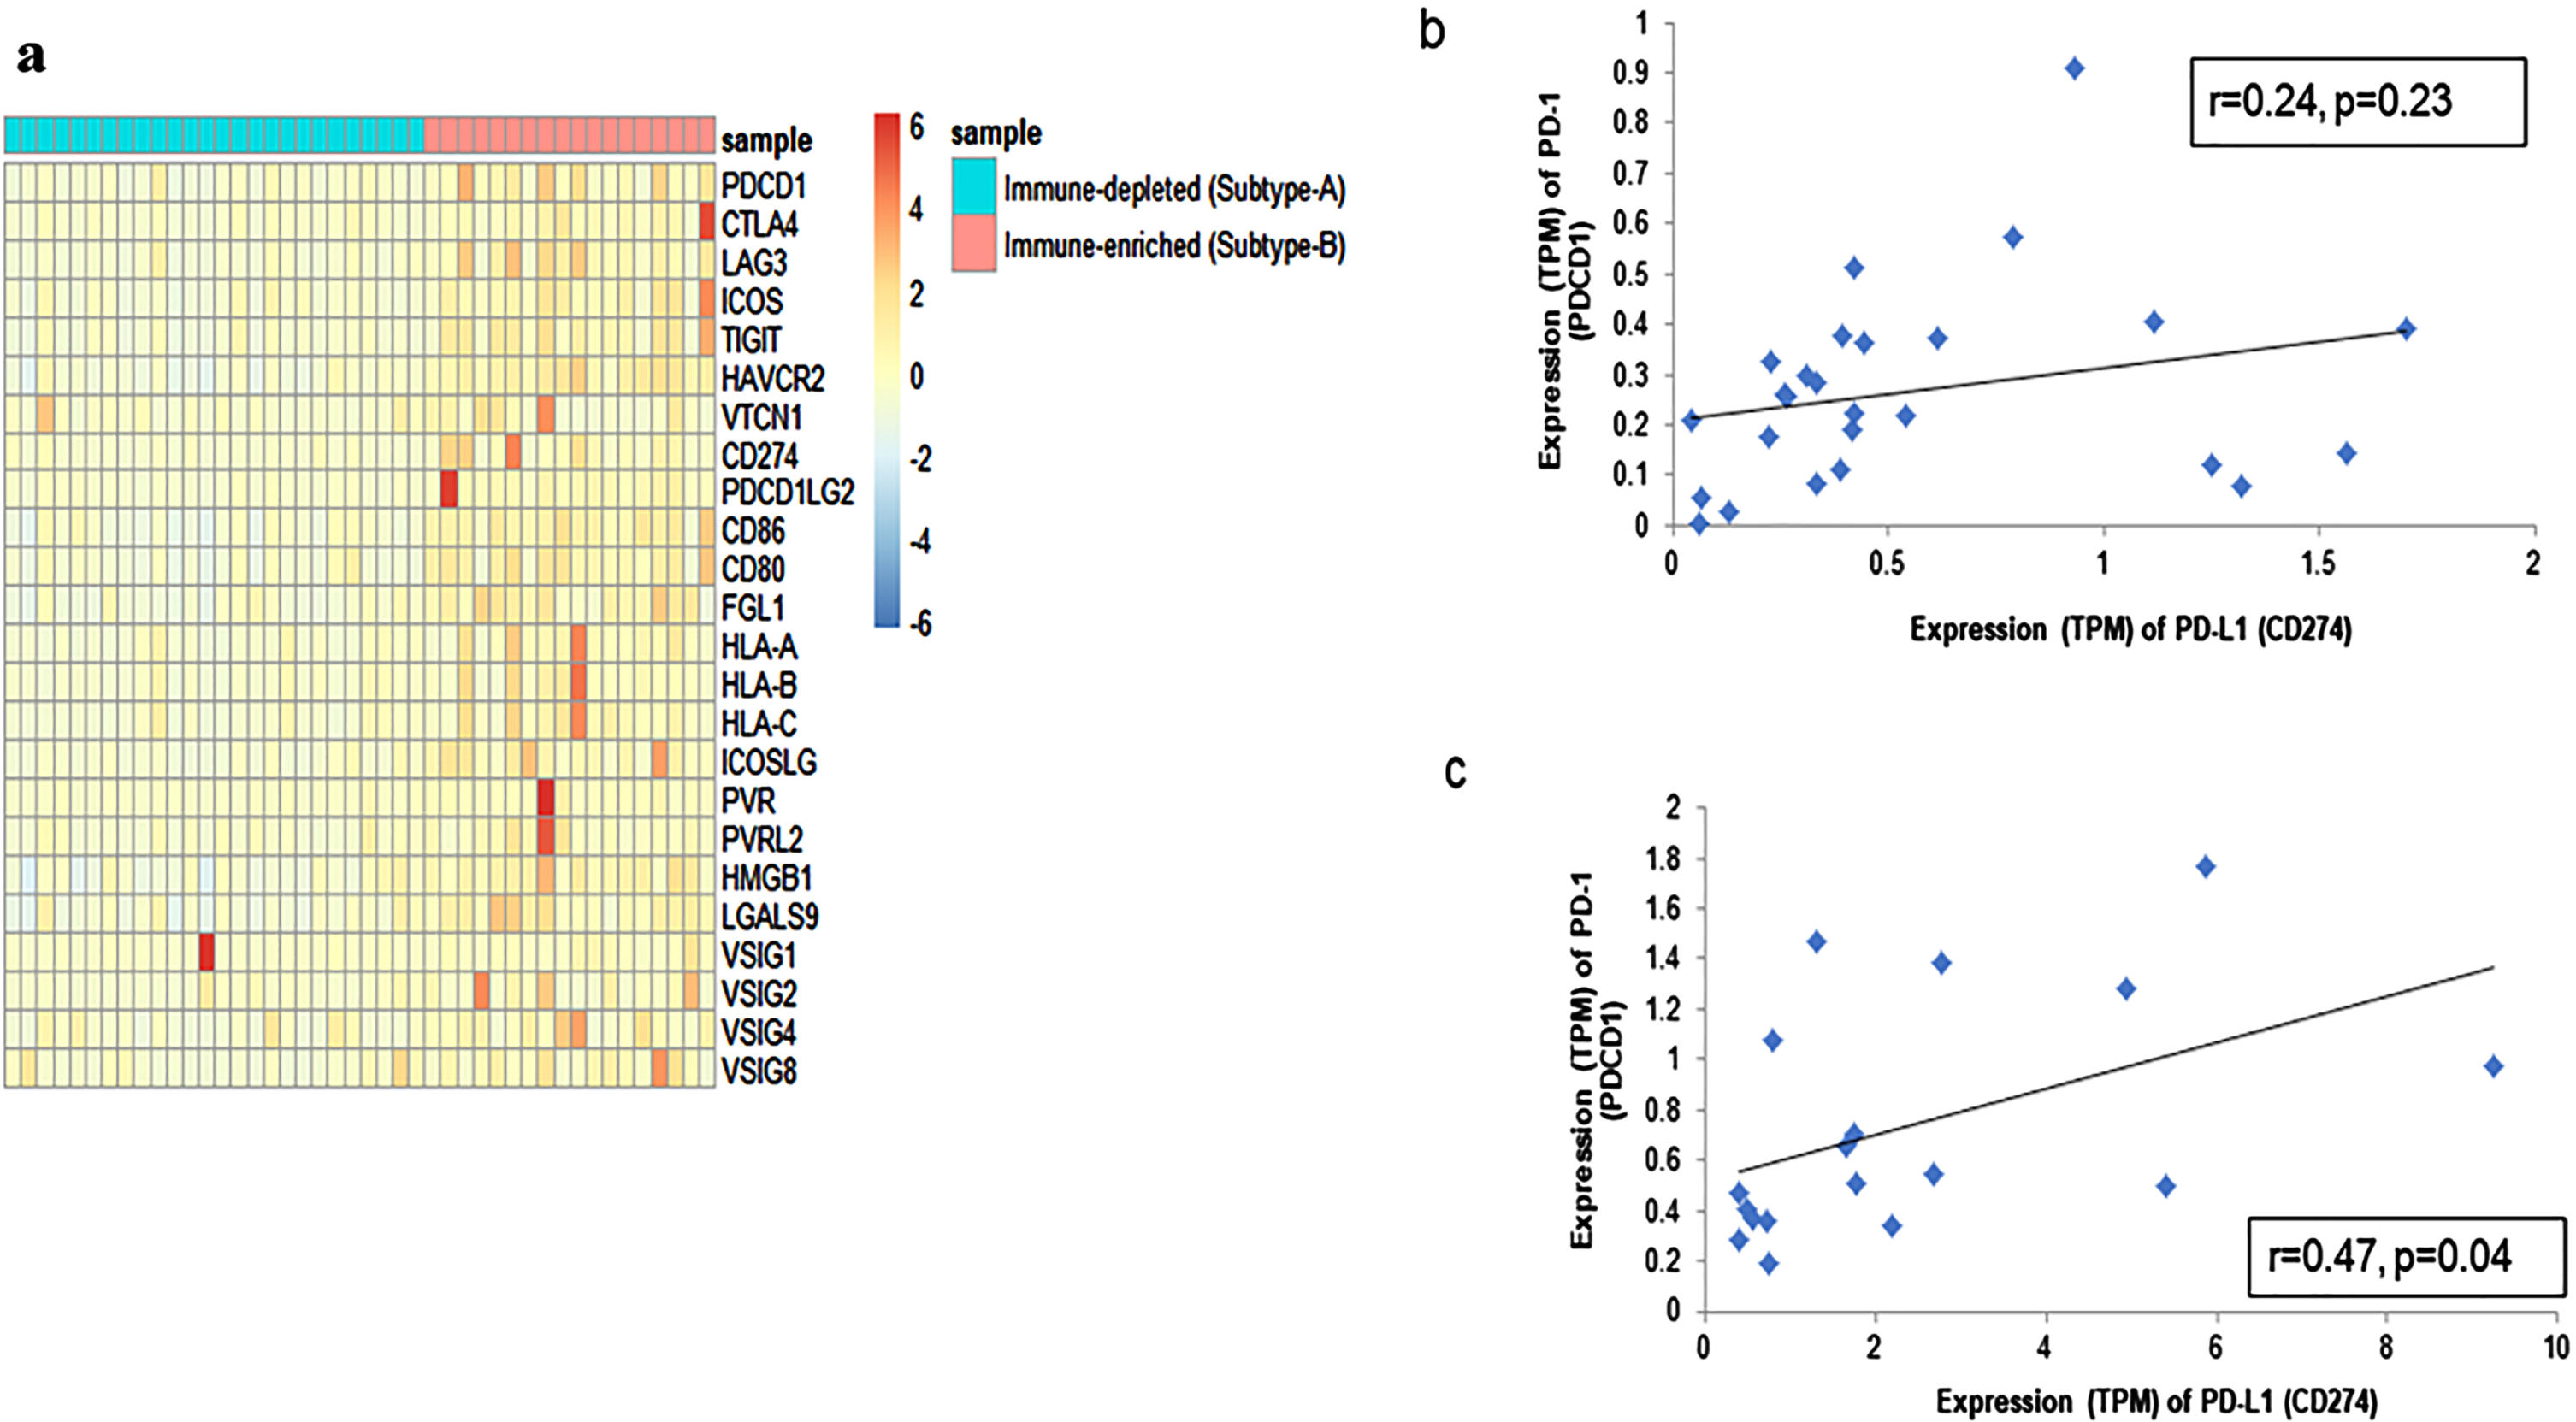
We further chose to determine the correlation, if any, between the expression of PD-L1 and PD-1, because the correlated co-expression of genes implies functional relatedness. Interestingly, as portrayed in Fig. 2b and c, a significant positive correlation (r = 0.47; p = 0.04) between PD-1 and PD-L1 was evident among the Subtype-B tumors, as opposed to lack of such correlation, in Subtype-A tumors (r = 0.24; p = 0.23), justifying the functional role of co-expression between PD-L1 and PD-1 in Subtype-B, but not within Subtype-A. This was also validated through qRT-PCR analysis, where a positive correlation between PD-1 and PD-L1 in Subtype-B (r = 0.75; p = 0.002) and no correlation in Subtype-A (r = 0.29; p = 0.13) was observed, as depicted in Supplementary Figure S3 b and c. Thus, the significant interaction between PD-1 and PD-L1 in Subtype-B suggests the dependence on this pathway for immune evasion and hence, if targeted, these tumors may respond better to intervention through immunotherapy, as suggested by a similar report on non-small cell lung carcinoma [22].
3.4Expression levels of a set of ten immune genes significantly differentiate the CaCx immune subtypes and serve as a biomarker panel for distinguishing them
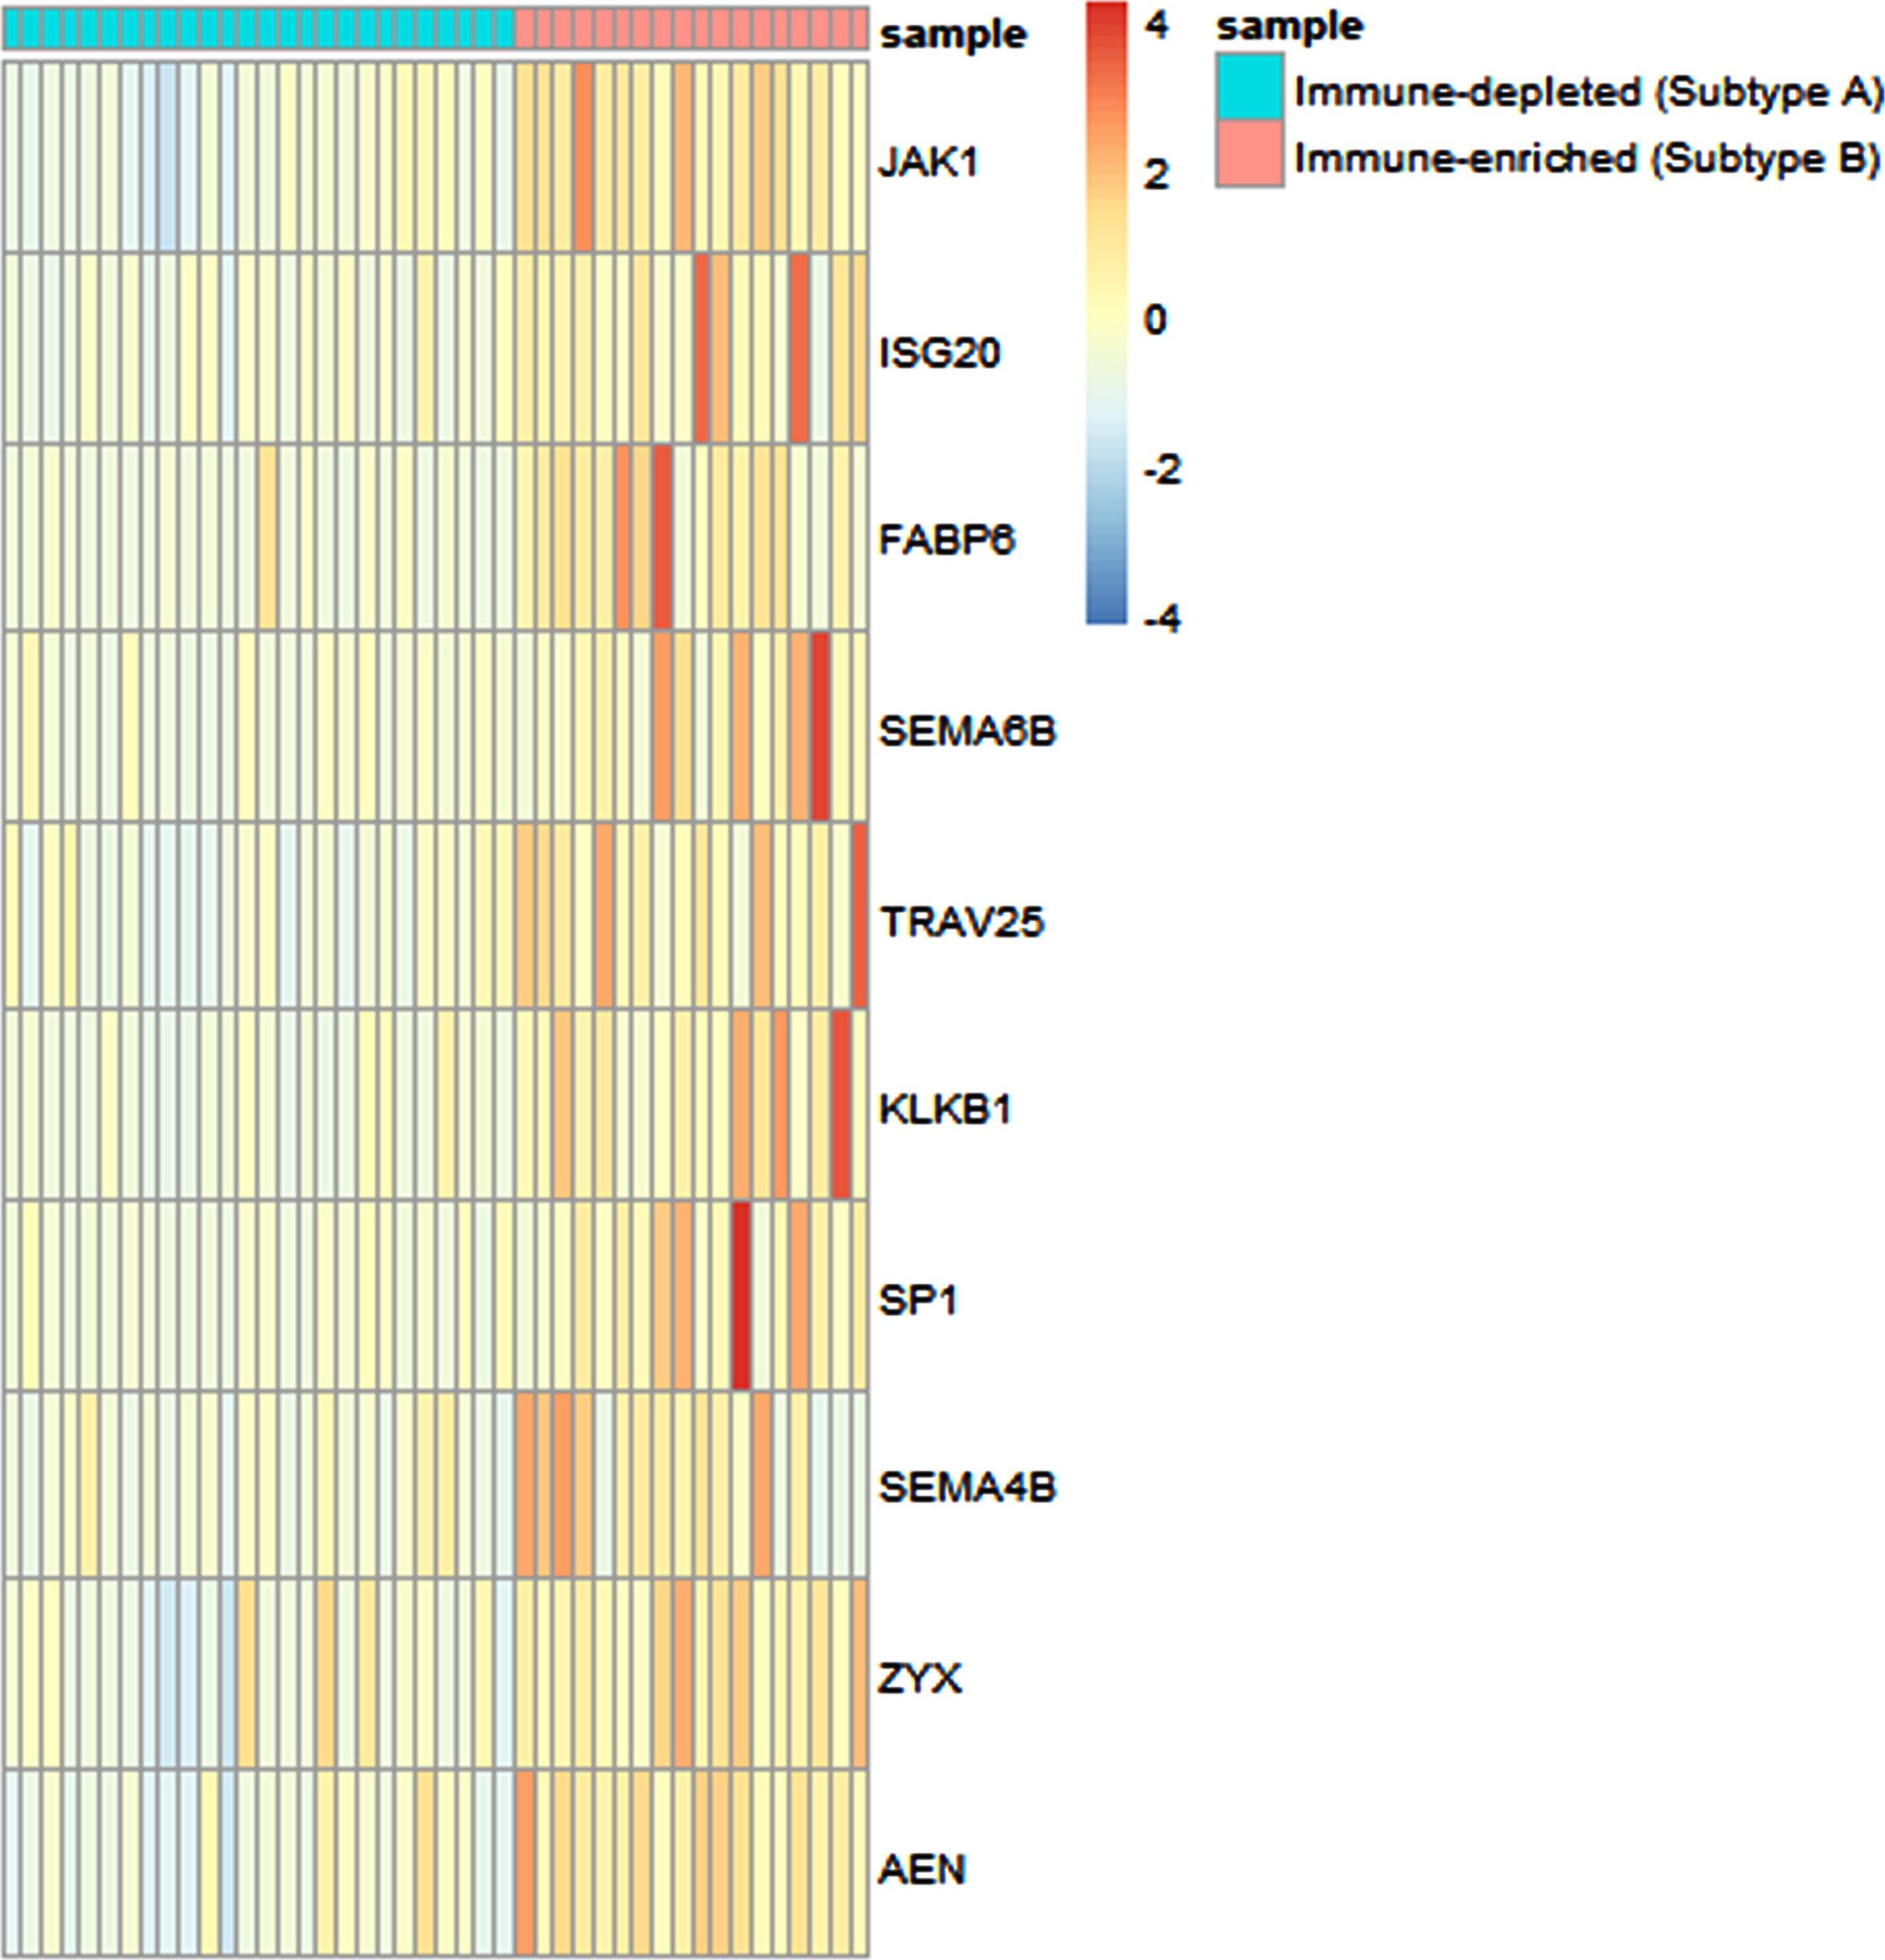
Based on the expression status of a large set of immune genes, we then sought to identify a subset of immune genes that could efficiently differentiate between the 2 immune subtypes. Therefore, we first performed t-test to compare the expression levels of each of the 1471 immune genes and after multiple testing corrections, a total of 567 genes appeared to exhibit significantly different expression levels, between the two subtypes. These 567 genes were considered for stepwise discriminant analysis, which pinpointed ten immune-genes –JAK1, ISG20, FABP6, SEMA6B, TRAV25, KLKB1, SP1, SEMA4B, ZYX and AEN that can significantly (p < 0.0001) discriminate between the two immune subtypes based on their expression levels (TPM values) and classify the patients into subtypes with high precision. The results of classification of the patients into molecular subtypes using the expression levels of these 10 genes revealed that 100% of the patients were correctly classified into their original subtypes. The expression of each of these genes in the 2 subtypes is depicted in Fig. 3. These 10 immune genes could also potentially be used as a biomarker panel for differentiating the two immune subtypes of CaCx, which was evident from the ROC analysis, as depicted in Supplementary Figure S4. The AUC values along with 95% confidence intervals (CIs) are provided in Supplementary Table S6. Therefore, this 10-gene panel appears to play a significant role in the manifestation of immune diversity of such cancers.
Fig. 3
Expression analysis of ten immune genes capable of differentiating between the CaCx immune subtypes. Heatmap indicating the expression (TPM) values of the 10 immune genes capable of differentiating between the two subtypes –A (immune-depleted) and B (immune-enriched), identified by stepwise discriminant analysis, with blue and red representing lower and higher expression, respectively.
3.5Subtype-B tumors portrayed more aggressive oncogenic phenotypes in comparison with Subtype-A tumors
To explore whether the CaCx tumor Subtypes-A and B also portray variability at the level of oncogenic phenotypes, we identified the Differentially Expressed Genes (DEGs) between the 2 subtypes, based on the criteria of False Discovery Rate (FDR) corrected p < 0.05 and |log2(Fold Change)|≥1. Upon functional enrichment analysis using Database for Annotation, Visualization and Integrated Discovery (DAVID) and considering only significant (FDR < 0.05) Gene Ontology-Biological Process (GO-BP) terms, we identified the cancer-related processes associated with these CaCx subtypes. Compared to Subtype-A, the Subtype-B tumors showed downregulation of genes associated with such GO-BP terms as keratinization, epidermis development, peptide crosslinking, intermediate filament organization and epithelial cell differentiation, whereas upregulation of genes associated with for example cilium movement and microtubule-based movement. The results are summarized in Table 1 and the details of the DEGs are provided in Supplementary Table S7, which show that the Subtype-B tumors are phenotypically more aggressive than Subtype-A tumors.
Table 1
Gene Ontology- Biological Processes (GO-BP) corresponding to the Differentially Expressed Genes (DEGs) between the immune-depleted (Subtype-A) and immune-enriched (Subtype-B) tumors
| GO-BP Term ID | Description | Count in gene set | Gene names | FDR [BH] p value |
| GO:0008544 | epidermis development | 15 | SPRR2E, KRTDAP, SPRR3, CDSN, KLK5, EMP1, KRT10, KRT31, CST6, KLK7, SCEL, SPRR1A, SPRR2B, SPRR1B, SPRR2D | 9.67E-13 |
| GO:0031424 | keratinization | 13 | SPRR2E, SPRR3, KRT1, KRT78, CNFN, KRT75, LCE3E, LCE3D, KRT17, SPRR1A, SPRR2B, SPRR1B, SPRR2D | 1.49E-10 |
| GO:0018149 | peptide cross-linking | 6 | SPRR2E, SPRR3, KRT1, KRT10, SPRR1A, SPRR1B | 2.62E-04 |
| GO:0045109 | intermediate filament organization | 6 | KRT17, KRT1, KRT78, KRT31, KRT75, KRT40 | 0.001 |
| GO:0030855 | epithelial cell differentiation | 6 | KRT17, DHRS9, AKR1C2, KRT10, KRT31, KRT40 | 0.042 |
| GO:0007018 | microtubule-based movement | 10 | DNAH12, DNAI2, DNAH10, KIF19, DNAH17, KIF5A, KIF12, DNAH9, KIF17, TCTE1 | 0.007 |
| GO:0003341 | cilium movement | 7 | RSPH4A, DNAI2, DNAH17, SPAG6, DNAAF1, HYDIN, DNAH9 | 0.048 |
†Compared to immune-depleted (Subtype-A), the GO-BP terms marked in green are downregulated, whereas those marked in red are upregulated in immune-enriched (Subtype-B) CaCx subtypes. *The GO-BP terms having Benjamini Hochberg [BH] FDR p value < 0.05 were considered significant.
3.6Subtype-B tumors showed significantly reduced viral load as compared to Subtype-A tumors
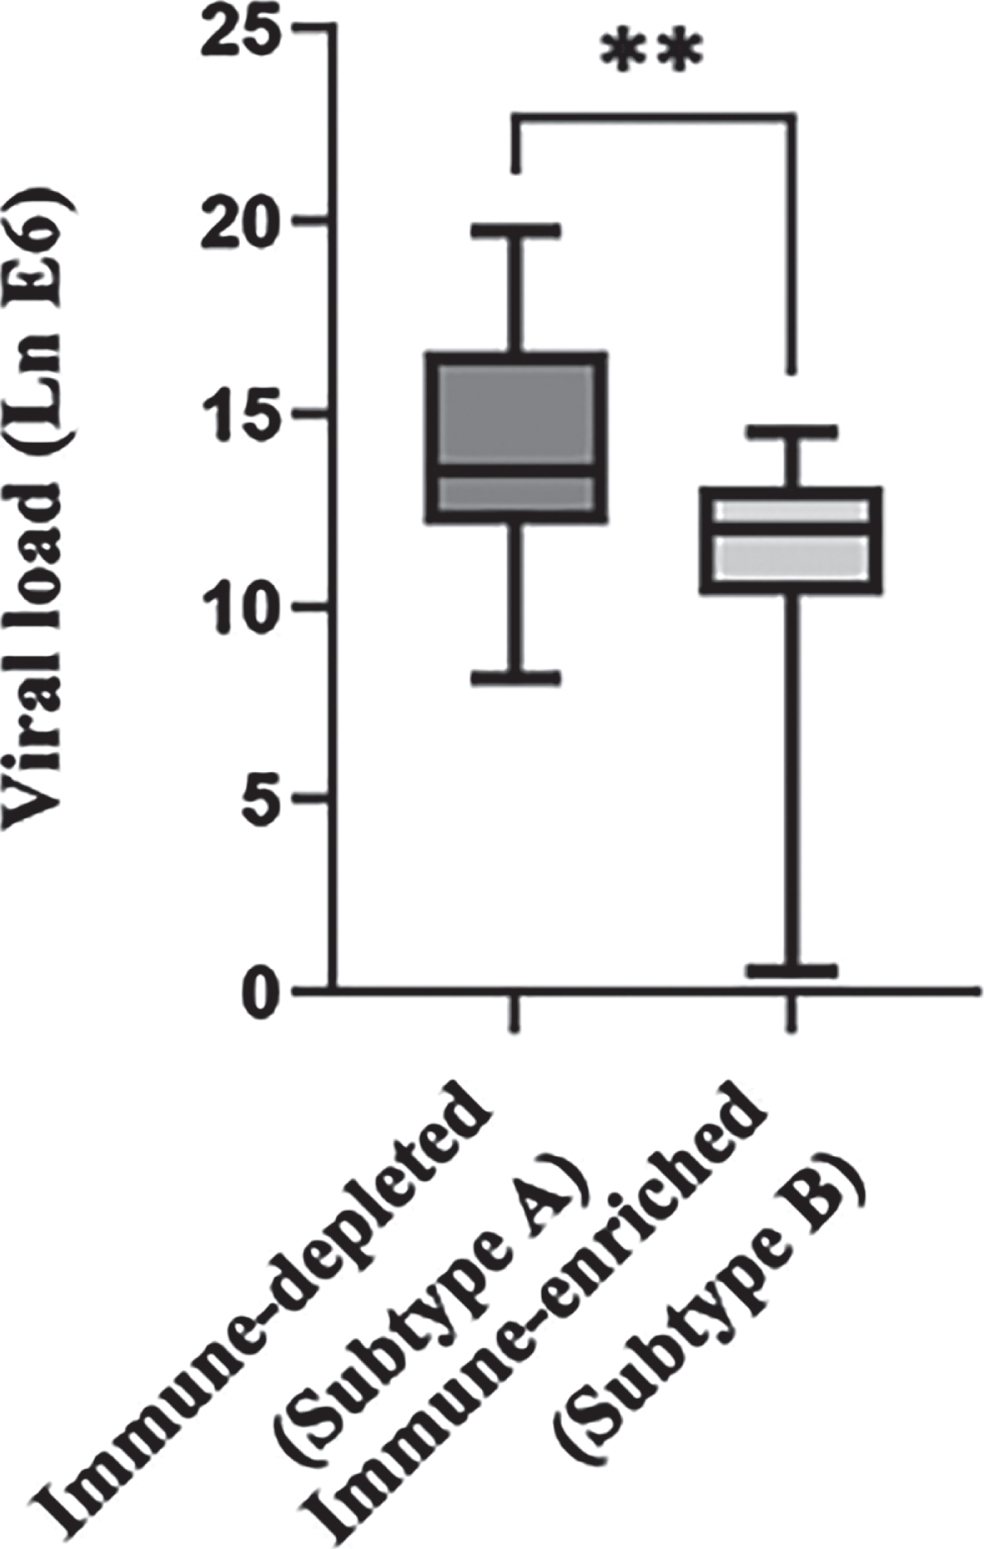
As CaCx is majorly HPV-driven, host pathogen interaction plays a significant role in cervical carcinogenesis. A number of studies [23–26] have shown increasing viral load from mild dysplasia to CaCx, including our previous study, comparing HPV16 positive normal samples with CaCx [20]. Thus, in view of the relevance of viral load in CaCx pathogenesis, we attempted to estimate the viral load in both of these CaCx subtypes. The results revealed that Subtype-B tumors were characterized by significantly (pt - test=0.002) lower viral load (average viral load = 10.74/100 ng of genomic DNA), compared to Subtype-A tumors (average viral load = 14.29/100 ng of genomic DNA), as depicted in Fig. 4. The reduced viral load in Subtype-B could reflect the reduction of viral replication due to a loss of structural integrity of the CaCx tissues in this subtype [Table 1], as HPV replication is tightly associated with epithelial differentiation [27].
Fig. 4
Difference in viral load between the two tumor immune subtypes. Box plot representing the distribution of HPV16 viral load across the tumor immune subtypes –A (immune depleted) and B (immune enriched). The Y axis represents the natural log-transformed value of the copy number of viral oncogene E6 per 100 ng of genomic DNA across the tumor samples. “**” indicates a significant (p < 0.001) difference between the two subtypes.
4Discussion
In India and other developing counties, besides minimization of the risk of CaCx development, adoption of newer therapeutic options to counteract the high mortality rates of such cancers seems to be highly necessary. Immunotherapy appears to be an advanced treatment option but the response rate to immunotherapy is low for most cancers, even for CaCx [9, 10, 28]. This could be attributed to molecular heterogeneity among patient samples. Tumor heterogeneity, in general, is known to be manifested through the impact of both tumor cell genomic instability affecting the molecular milieu of the tumors, as well as selection of tumor cells based on immunological attacks [29]. Therefore, we undertook this analysis to decipher the existence of molecular subtypes within the CaCx patients based on tumor immune intrinsic and extrinsic factors as well as to characterize these subtypes with respect to oncogenic phenotypes and viral factors.
To date, most of the studies regarding the immune subtypes in CaCx have been conducted on publicly available datasets like TCGA and GEO [30, 31]. To our knowledge, this is the first study on Indian population attempting to identify the immune landscape of CaCx patients based on global immune gene expression profiling. A recent study [32] on cross-racial comparison of tumor mutation burden in non-small cell lung cancer (NSCLC) posed that analysis of biomarkers in underrepresented populations seem to be crucial towards minimizing disparities, pertaining to precision medicine. This renders support to our study, where we succeeded in identifying two major immune subtypes of CaCx patients –immune-enriched subtype or Subtype-B and immune-depleted subtype or Subtype-A. The Subtype-B was characterized by high (i) immune gene expression profiles including the immune checkpoint molecules and (ii) infiltration of TIICs, as compared to Subtype-A. As per available reports on various cancers [33, 34], including CaCx [35, 36], higher infiltration of TIICs in the TME have often been associated with a better patient response to immunotherapy. In recent times, Tumor Infiltrating Lymphocyte or TIL-based therapy has also been reported to be an interesting avenue of immunotherapy, based on studies on breast cancer, melanoma, and a few on CaCx [37]. Our finding of an enhanced infiltration of CD8+ T cells, apart from some other TILs in Subtype-B CaCx cases, therefore merits attention and appears to be intriguing in predicting their clinical relevance.
In fact, the Subtype-B tumors also portrayed a significant correlation between the immune checkpoint molecules, PD-L1 and PD-1, in contrast to a lack of such correlation within the Subtype-A tumors. This finding points towards an interaction between immune cells and tumor cells via the PD-1 –PD-L1 axis, among the Subtype-B patients. A recent study [22] demonstrated through direct imaging that metastatic NSCLC patients undergoing immunotherapy portrayed poor outcomes under the impact of reduced interactions between PD-1 and PD-L1. The significant interaction between PD-1 and PD-L1 points towards the dependence of Subtype-B on this pathway for immune evasion through the induction of exhaustion among the infiltrating T cells. Therefore, this tumor subtype is likely to respond better to intervention [22]. Hence, disruption of such correlation through immune checkpoint inhibitors (anti PD-1/PD-L1) are likely to be therapeutically beneficial to the Subtype-B CaCx patients, which account for a substantial proportion, about 41%, of CaCx cases in our cohort.
In pursuit of identification of suitable biomarkers to discriminate the two CaCx immune subtypes, we used the approach of stepwise discriminant analysis and identified a set of 10 immune genes-JAK1, ISG20, FABP6, SEMA6B, TRAV25, KLKB1, SP1, SEMA4B, ZYX and AEN. This gene panel could not only efficiently discriminate between these immune subtypes, but also serve as robust biomarkers for the identification of immune subtypes. The expression of these genes has been reported to be associated with different immune related functions in various cancers [38–42] and some are also used as biomarkers for predicting the efficacy of immunotherapy in various cancers [43–45]. Apart from imparting immune functions, the above-mentioned genes are also known to be involved in tumorigenesis of several cancers [39, 44, 46–55], including CaCx [56–58].
Interestingly, besides portraying an immune-enriched TME, Subtype-B CaCx are also characterized by divergent oncogenic phenotypes associated with biological processes such as loss of structural integrity and differentiation of tumor cells and gain of cellular movement resulting in cancer progression by various mechanisms [59, 60]. Thus, our observations could be suitably used for designing effective targeted therapy for such HPV16 CaCx subtypes portraying aggressive oncogenic phenotypes. Therefore, taken together, the ten gene signature bears the potential to serve as a biomarker panel for segregating HPV16 positive CaCx patients with immune-enriched and aggressive oncogenic Subtype-B tumors, from those with Subtype-A tumors.
As it has been earlier established in our laboratory [11, 13, 20], CaCx patients in India show variation with respect to viral factors. In this study, we also revealed that variations in immune subtypes were concomitant with variations in the HPV16 load. Our observation of the prevalence of low viral load in Subtype-B could be attributable to a reduced viral replication rate due to the loss of tumor cell differentiation. HPV replicative cycle is tightly correlated with epithelial differentiation [27]. The genes associated with regulation of epithelial differentiation also regulate the late gene transcription of HPV [27]. Thus, loss of differentiation leads to an abortive viral life cycle, resulting in a reduction in the production of virions and, consequently, a decrease in viral load. Under this circumstance, we rule out the possibility of low viral load in Subtype-B tumors being attributable to loss of HPV16 positive cells of the cervical epithelium, under the impact of infiltrating immune cells. The latter cells would be exhausted under the impact of a functional interaction between PD-L1 and PD-1 within the Subtype-B tumors.
In conclusion, although the sample size analyzed in this study is moderate, with insufficient patient survival data, convincing insights could be drawn, on a possible relationship between immunogenicity and oncogenic potential of such cancers, impacting pathogen load. The findings could thus be harnessed to develop novel therapeutic strategies, including immune checkpoint-based or TIL-based therapy, towards the benefit of a subset of HPV16 positive CaCx cases, to combat the high mortality rates of Indian patients. Besides, being the first RNA-seq dataset from India, revealing immune subtypes, our findings are of significant translational relevance in terms of targeted immunotherapy, particularly because of the associated high costs which are unaffordable by most patients in India.
Acknowledgments
We are grateful to the Government of India, Department of Biotechnology, for financial support to this study, through the Systems Medicine Cluster (SyMeC) project (BT/Med-II/NIBMG/SyMeC/2014/Vol. II). We are also grateful to all participating members of SyMeC for their inputs and contributions to this study. We acknowledge Tata Memorial Centre, Kolkata for providing us with the clinical samples for the study; all the members of the Core Technology Research Initiative (CoTeRI) of the National Institute of Biomedical Genomics (NIBMG), Kalyani, India for their technical support during the work; special thanks also to Council of Scientific and Industrial Research (CSIR), India, for providing research fellowships to Abhisikta Ghosh (JRF and SRF), Department of Science and Technology (INSPIRE), Govt. of India for providing research fellowship to Abarna Sinha (JRF and SRF); and thanks also to Dr. Ankita Chatterjee (NIBMG, Kalyani) for her help regarding the immune cell infiltration analysis.
Author contributions
CONCEPTION: AG and SSG
DATA CURATION: AG, SM, JB, AM, NKB and AM
ANALYSIS OF DATA: AG, AG, AS, NKB, SSG and PPM
PREPARATION OF THE MANUSCRIPT: AG, SSG and PPM
REVISION FOR IMPORTANT INTELLECTUAL CONTENT: AG, SSG and PPM
SUPERVISION: SSG
Conflict of interest
AG declares no conflict of interest.
AG declares no conflict of interest.
AS declares no conflict of interest.
SM declares no conflict of interest.
JB declares no conflict of interest.
AM declares no conflict of interest.
AM declares no conflict of interest.
NKB declares no conflict of interest.
PPM declares no conflict of interest.
SSG declares no conflict of interest.
Supplementary materials
[1] The supplementary materials are available online from: https://dx.doi.org/10.3233/TUB-220035.
References
[1] | Sung H , Ferlay J , Siegel RL , et al. Global cancer statistics 2020: GLOBOCAN estimates of incidence and mortality worldwide for 36 cancers in 185 countries. CA Cancer J Clin. (2021) ;71: :209–49. doi: 10.3322/caac.21660 |
[2] | Muñoz N , Castellsagué X , de González AB , et al. HPV in the etiology of human cancer. Vaccine. (2006) ;24: :S1–S10. doi: 10.1016/j.vaccine.2006.05.115 |
[3] | Wieland U , Kreuter A , Pfister H . Human papillomavirus and immunosuppression. Curr Probl Dermatol. (2014) ;45: :154–65. doi: 10.1159/000357907 |
[4] | Denny LA , Franceschi S , de Sanjosé S , et al. Human papillomavirus, human immunodeficiency virus and immunosuppression. Vaccine. (2012) ;30: :F168–74. doi: 10.1016/j.vaccine.2012.06.045 |
[5] | de Sanjose S , Brotons M , Pavon MA . The natural history of human papillomavirus infection. Best Pract Res Clin Obstet Gynaecol. (2018) ;47: :2–13. doi: 10.1016/j.bpobgyn.2017.08.015 |
[6] | Ferrall L , Lin KY , Roden R , et al. Cervical Cancer Immunotherapy: Facts and Hopes. Clin Cancer Res. (2021) ;27: :4953–73. doi: 10.1158/1078-0432.CCR-20-2833 |
[7] | Otter S , Chatterjee J , Stewart A , et al. The role of biomarkers for the prediction of response to checkpoint immunotherapy and the rationale for the use of checkpoint immunotherapy in cervical cancer. Clin Oncol. (2019) ;31: :834–43. doi: 10.1016/j.clon.2019.07.00 |
[8] | El-Sayes N , Vito A , Mossman K . Tumor heterogeneity: A great barrier in the age of cancer immunotherapy. Cancers. (2021) ;13: :806. doi: 10.3390/cancers13040806 |
[9] | Frenel J-S , Le Tourneau C , O’Neil B , et al. Safety and efficacy of pembrolizumab in advanced, programmed death ligand 1–positive cervical cancer: results from the phase Ib KEYNOTE-028 trial. >J Clin Oncol. (2017) ;35: :4035–41. doi: 10.1200/JCO.2017.74.5471 |
[10] | Ros W , Delord J , Perets R , et al. Efficacy and safety of pembrolizumab in previously treated advanced cervical cancer: results from the phase 2 KEYNOTE-158 study. J Clin Oncol. (2019) ;37: :117. doi: 10.1200/JCO.18.01265 |
[11] | Das Ghosh D , Bhattacharjee B , Sen S , et al. Some novel insights on HPV16 related cervical cancer pathogenesis based on analyses of LCR methylation, viral load, E7 and E2/E4 expressions. PLoS One. 2012;7: e44678. doi: 10.1371/journal.pone.0044678 |
[12] | Mandal P , Bhattacharjee B , Sen S , et al. Predominance of genomically defined A lineage of HPV16 over D lineage in Indian patients from eastern India with squamous cell carcinoma of the cervix in association with distinct oncogenic phenotypes. Transl Oncol. (2022) ;15: :101256. doi: 10.1016/j.tranon.2021.101256 |
[13] | Sharma S , Mandal P , Sadhukhan T , et al. Bridging links between long noncoding RNA HOTAIR and HPV oncoprotein E7 in cervical cancer pathogenesis. Sci Rep. (2015) ;5: :1–15. doi: 10.1038/srep11724 |
[14] | Mandal P , Saha SS , Sen S , et al. Cervical cancer subtypes harbouring integrated and/or episomal HPV16 portray distinct molecular phenotypes based on transcriptome profiling of mRNAs and miRNAs. Cell Death Discov. (2019) ;5: :1–13. doi: 10.1038/s41420-019-0154-x |
[15] | Ghosh A , Das C , Ghose S , et al. Integrative analysis of genomic and transcriptomic data of normal, tumour, and cooccurring leukoplakia tissue triads drawn from patients with gingivobuccal oral cancer identifies signatures of tumour initiation and progression. J Pathol. 2022;257:593-606. doi: 10.1002/path.5900 |
[16] | Love MI , Huber W , Anders S . Moderated estimation of fold change and dispersion for RNA-seq data with DESeq2. Genome Biol. (2014) ;15: :1–21. doi: 10.1186/s13059-014-0550-8 |
[17] | Vera Alvarez R , Pongor LS , Mariño-Ramírez L , et al. TPMCalculator: one-step software to quantify mRNA abundance of genomic features. Bioinformatics. (2019) ;35: :1960–2. doi: 10.1093/bioinformatics/bty896 |
[18] | Newman AM , Liu CL , Green MR , et al. Robust enumeration of cell subsets from tissue expression profiles. Nat Methods. (2015) ;12: :453–7. doi: 10.1038/nmeth.3337 |
[19] | KleckaWR. Discriminant analysis. Sage University Paper series. Quantitative Applications in the Social Sciences, Series No. 07-019. Beverly Hills and London: Sage Publications; (1980) . |
[20] | Das D , Bhattacharjee B , Sen S , et al. Association of viral load with HPV16 positive cervical cancer pathogenesis: causal relevance in isolates harboring intact viral E2 gene. Virology. (2010) ;402: :197–202. doi: 10.1016/j.virol.2010.03.030 |
[21] | Wu Z , Chen H , Luo W , et al. The landscape of immune cells infiltrating in prostate cancer. Front Oncol. (2020) ;10: :517637. doi: 10.3389/fonc.2020.517637 |
[22] | Sánchez-Magraner L , Miles J , Baker CL , et al. High PD-1/PD-L1 Checkpoint Interaction Infers Tumor Selection and Therapeutic Sensitivity to Anti-PD-1/PD-L1 TreatmentTherapeutic Sensitivity to PD-1 & PD-L1 Interaction. Cancer Res. (2020) ;80: :4244–57. doi: 10.1158/0008-5472.CAN-20-1117 |
[23] | Peitsaro P , Johansson B , Syrjänen S . Integrated human papillomavirus type 16 is frequently found in cervical cancer precursors as demonstrated by a novel quantitative real-time PCR technique. J Clin Microbiol. (2002) ;40: :886–91. doi: 10.1128/JCM.40.3.886-891.2002 |
[24] | Abba M , Mouron S , Gomez M , et al. Association of human papillomavirus viral load with HPV16 and high-grade intraepithelial lesion. Int J Gynecol Cancer. (2003) ;13: :154–8. doi: 10.1046/j.1525-1438.2003.13011.x |
[25] | Josefsson AM , Magnusson PK , Ylitalo N , et al. Viral load of human papilloma virus 16 as a determinant for development of cervical carcinoma in situ: a nested case-control study. Lancet. (2000) ;355: :2189–93. doi: 10.1016/S0140-6736(00)02401-6 |
[26] | Hernández-Hernández DM , Ornelas-Bernal L , Guido-Jiménez M , et al. Association between high-risk human papillomavirus DNA load and precursor lesions of cervical cancer in Mexican women. Gynecol Oncol. (2003) ;90: :310–7. doi: 10.1016/s0090-8258(03)00320-2 |
[27] | White EA . Manipulation of epithelial differentiation by HPV oncoproteins. Viruses. (2019) ;11: :369. doi: 10.3390/v11040369 |
[28] | Yang L , Yang Y , Meng M , et al. Identification of prognosis-related genes in the cervical cancer immune microenvironment. Gene. (2021) ;766: :145119. doi: 10.1016/j.gene.2020.145119 |
[29] | Knoche SM , Larson AC , Sliker BH , et al. The role of tumor heterogeneity in immune-tumor interactions. Cancer Metastasis Rev. (2021) ;40: :377–89. doi: 10.1007/s10555-021-09957-3 |
[30] | Lu X , Jiang L , Zhang L , et al. Immune signature-based subtypes of cervical squamous cell carcinoma tightly associated with human papillomavirus type 16 expression, molecular features, and clinical outcome. Neoplasia. (2019) ;21: :591–601. |
[31] | Wang Y , He M , Zhang G , et al. The immune landscape during the tumorigenesis of cervical cancer. Cancer Med. (2021) ;10: :2380–95. doi: 10.1002/cam4.3833 |
[32] | Nassar AH , Adib E , Abou Alaiwi S , et al. Ancestry-driven recalibration of tumor mutational burden and disparate clinical outcomes in response to immune checkpoint inhibitors. Cancer Cell. 2022. doi: 10.1016/j.ccell.2022.08.022 |
[33] | Ferrata M , Schad A , Zimmer S , et al. PD-L1 expression and immune cell infiltration in gastroenteropancreatic (GEP) and non-GEP neuroendocrine neoplasms with high proliferative activity. Front Oncol. (2019) ;9: :343. doi: 10.3389/fonc.2019.00343 |
[34] | Darzi M , Gorgin S , Majidzadeh-A K , et al. Gene co-expression network analysis reveals immune cell infiltration as a favorable prognostic marker in non-uterine leiomyosarcoma. Sci Rep. (2021) ;11: :1–11. doi: 10.1038/s41598-021-81952-8 |
[35] | Kang Y , Huang J , Liu Y , et al. Integrated analysis of immune infiltration features for cervical carcinoma and their associated immunotherapeutic responses. Front Cell Dev Biol. (2021) ;9: :573497. doi: 10.3389/fcell.2021.573497 |
[36] | Li Y , Lu S , Wang S , et al. Identification of immune subtypes of cervical squamous cell carcinoma predicting prognosis and immunotherapy responses. J Transl Med. (2021) ;19: :1–17. doi: 10.1186/s12967-021-02894-3 |
[37] | Tang Y , Zhang AX , Chen G , et al. Prognostic and therapeutic TILs of cervical cancer—Current advances and future perspectives. Mol Ther Oncolytics. (2021) ;22: :410–430. doi: 10.1016/j.omto.2021.07.006 |
[38] | Shen K , Wei Y , Lv T , et al. The expression landscape of JAK1 and its potential as a biomarker for prognosis and immune infiltrates in NSCLC. BMC Bioinform. (2021) ;22: :1–14. doi: 10.1186/s12859-021-04379-y |
[39] | Chen B , Lai J , Dai D , et al. JAK1 as a prognostic marker and its correlation with immune infiltrates in breast cancer. Aging (Albany NY). (2019) ;11: :11124. doi: 10.18632/aging.102514 |
[40] | Gao M , Lin Y , Liu X , et al. ISG20 promotes local tumor immunity and contributes to poor survival in human glioma. Oncoimmunology. (2019) ;8: :e1534038. doi: 10.1080/2162402X.2018.1534038 |
[41] | Lian W , Wang Z , Ma Y , et al. FABP6 Expression Correlates with Immune Infiltration and Immunogenicity in Colorectal Cancer Cells. J Immunol Res. 2022;129765. doi: 10.1155/2022/3129765 |
[42] | Liu L , Yang S , Lin K , et al. Sp1 induced gene TIMP1 is related to immune cell infiltration in glioblastoma. Sci Rep. (2022) ;12: :1–18. doi: 10.1038/s41598-022-14751-4 |
[43] | Wang X , Muzaffar J , Kirtane K , et al. T cell repertoire in peripheral blood as a potential biomarker for predicting response to concurrent cetuximab and nivolumab in head and neck squamous cell carcinoma. J Immunother Cancer. (2022) ;10: :e004512. doi: 10.1136/jitc-2022-004512 |
[44] | Adamopoulos PG , Kontos CK , Papageorgiou SG , et al. KLKB1 mRNA overexpression: A novel molecular biomarker for the diagnosis of chronic lymphocytic leukemia. Clin Biochem. (2015) ;48: :849–54. doi: 10.1016/j.clinbiochem.2015.04.007 |
[45] | Manils J , Marruecos L , Soler C . Exonucleases: Degrading DNA to deal with genome damage, cell death, inflammation and cancer. Cells. (2022) ;11: :2157. doi: 10.3390/cells11142157 |
[46] | Jiang J , Lu Y , Zhang F , et al. Semaphorin 4B promotes tumor progression and associates with immune infiltrates in lung adenocarcinoma. BMC Cancer. (2022) ;22: :1–13. doi: 10.1186/s12885-022-09696-w |
[47] | Alsheikh HAM , Metge BJ , Pruitt HC , et al. Disruption of STAT5A and NMI signaling axis leads to ISG20-driven metastatic mammary tumors. Oncogenesis. (2021) ;10: :1–11. doi: 10.1038/s41389-021-00333-y |
[48] | Miyashita H , Fukumoto M , Kuwahara Y , et al. ISG20 is overexpressed in clinically relevant radioresistant oral cancer cells. Int J Clin Exp Pathol. (2020) ;13: :1633–39. |
[49] | Zhang Y , Zhao X , Deng L , et al. High expression of FABP4 and FABP6 in patients with colorectal cancer. World J Surg Oncol. (2019) ;17: :1–13. doi: 10.1186/s12957-019-1714-5 |
[50] | Pai F-C , Huang H-W , Tsai Y-L , et al. Inhibition of FABP6 Reduces Tumor Cell Invasion and Angiogenesis through the Decrease in MMP-2 and VEGF in Human Glioblastoma Cells. Cells. (2021) ;10: :2782. doi: 10.3390/cells10102782 |
[51] | Lu T-P , Tsai M-H , Hsiao CK , et al. Expression and functions of semaphorins in cancer. Transl Cancer Res. (2012) ;1: :74–87. doi: 10.3978/j.issn.2218-676X.2012.04.04 |
[52] | Chandran SS , Klebanoff CA . T cell receptor-based cancer immunotherapy: emerging efficacy and pathways of resistance. Immunol Rev. (2019) ;290: :127–47. doi: 10.1111/imr.12772 |
[53] | Che Y-Q , Zhang Y , Li H-B , et al. Serum KLKB1 as a potential prognostic biomarker for hepatocellular carcinoma based on data-independent acquisition and parallel reaction monitoring. J Hepatocell Carcinoma. (2021) ;8: :1241–52. doi: 10.2147/JHC.S325629 |
[54] | Wen X-M , Luo T , Jiang Y , et al. Zyxin (ZYX) promotes invasion and acts as a biomarker for aggressive phenotypes of human glioblastoma multiforme. Lab Invest. (2020) ;100: :812–23. doi: 10.1038/s41374-019-0368-9 |
[55] | Kawase T , Ichikawa H , Ohta T , et al. p53 target gene AEN is a nuclear exonuclease required for p53-dependent apoptosis. Oncogene. (2008) ;27: :3797–810. doi: 10.1038/onc.2008.32 |
[56] | She S , Zhao Y , Kang B , et al. Combined inhibition of JAK1/2 and DNMT1 by newly identified small-molecule compounds synergistically suppresses the survival and proliferation of cervical cancer cells. Cell Death Dis. (2020) ;11: :1–16. doi: 10.1038/s41419-020-02934 |
[57] | Qu X , Shi Z , Guo J , et al. Identification of a novel six-gene signature with potential prognostic and therapeutic value in cervical cancer. Cancer Med. (2021) ;10: :6881–96. doi: 10.1002/cam4.4054 |
[58] | Deng Y-R , Chen X-J , Chen W , et al. Sp1 contributes to radioresistance of cervical cancer through targeting G2/M cell cycle checkpoint CDK1. Cancer Manag Res. (2019) ;11: :5835–44. doi: 10.2147/CMAR.S200907 |
[59] | Parker AL , Kavallaris M , McCarroll JA . Microtubules and their role in cellular stress in cancer. Front Oncol. (2014) ;4: :153. doi: 10.3389/fonc.2014.00153 |
[60] | Shetty S , Gokul S . Keratinization and its disorders. Oman Med J. (2012) ;27: :348–57. doi: 10.5001/omj.2012.90 |


