
Pre-analytical stability of the CEA, CYFRA 21.1, NSE, CA125 and HE4 tumor markers
Abstract
BACKGROUND:
For lung cancer, circulating tumor markers (TM) are available to guide clinical treatment decisions. To ensure adequate accuracy, pre-analytical instabilities need to be known and addressed in the pre-analytical laboratory protocols.
OBJECTIVE:
This study investigates the pre-analytical stability of CA125, CEA, CYFRA 21.1, HE4 and NSE for the following pre-analytical variables and procedures; i) whole blood stability, ii) serum freeze-thaw cycles, iii) electric vibration mixing and iv) serum storage at different temperatures.
METHODS:
Left-over patient samples were used and for every investigated variable six patient samples were used and analysed in duplicate. Acceptance criteria were based on analytical performance specifications based on biological variation and significant differences with baseline.
RESULTS:
Whole blood was stable for at least 6 hours for all TM except for NSE. Two freeze-thaw cycles were acceptable for all TM except CYFRA 21.1. Electric vibration mixing was allowed for all TM except for CYFRA 21.1. Serum stability at 4°C was 7 days for CEA, CA125, CYFRA 21.1 and HE4 and 4 hours for NSE.
CONCLUSIONS:
Critical pre-analytical processing step conditions were identified that, if not taken into account, will result in reporting of erroneous TM results.
1.Introduction
Serum tumor markers (TM) are molecules used to distinguish healthy from non-healthy and to monitor treatment response [1]. Often, these TMs are proteins derived from the tumor that are released into the blood stream [2]. Since TMs are found in the sera of patients, they provide a rather non-invasive way to monitor treatment. Serum carcinoembryonic antigen (CEA), cytokeratin 19 fragment (CYFRA 21.1), serum neuron-specific enolase (NSE), cancer antigen 125 (CA125), and human epididymis protein 4 (HE4) have demonstrated diagnostic value in lung cancer [3–8]. These TMs tests are marketed by several in vitro diagnostic (IVD) suppliers and offered as a clinical diagnostic test by clinical laboratories.
The clinical laboratory testing process can be divided into three phases: the pre-analytical, analytical and post-analytical. The pre-analytical phase includes patient identification, sample labelling, sample transport and sample preparation. In the analytical phase the laboratory analysis is performed. The final phase of the laboratory process, the post-analytical phase, includes the data processing resulting in the final test report, interpretation and annotation to support clinical decision-making. It is generally accepted that the pre-analytical phase accounts for up to 40–70% of the errors made in the total testing process [9, 10]. These errors can either be using incorrect blood collection tubes, sample or patient mix-up, incorrect handling and transport of samples or be introduced and compromised by inadequate sample storage conditions [11]. More specifically, analyte instability at various temperatures or under specific laboratory procedures, such as centrifugation or electric vibration mixing, can be critical. Furthermore, storage of blood samples at room temperature can induce cell lysis, which can affect levels of several proteins. It has been well established that hemolysis in the blood sample causes an increase in NSE concentration [12].
Thus, to enable clinical application of any analyte, it is essential to investigate the biomarkers’ pre-analytical stability and determine the operational requirements to control for these in the laboratory protocol, since these can potentially markedly influence the test results. Generally, these investigations are performed by the IVD suppliers, and pre-analytical criteria are presented in the instructions for use. However, data presenting the exact effect of a pre-analytical variable are often missing, the experimental design is questionable, or the criteria used are unclear or debatable. This study aims to assess the effects of pre-analytical variables, including storage stability of whole blood and serum at different temperatures, electric vibration mixing and freeze-thawing of serum on the concentrations of TMs, using a statistically powered experimental design. Furthermore, pre-specified performance criteria based on TM biological variation will be used to set pre-analytical requirements for the TMs.
2.Material and methods
2.1.Patient samples
A total of 184 serum samples of cancer patients from routine laboratory testing between March and July 2021 at the Netherlands Cancer Institute, Amsterdam, The Netherlands, were included. Sera were collected in either Rapid Serum Tubes ((RST368774, Becton Dickinson International (BD), Erembodegem, Belgium) or Serum Separator Tube (SST) (367983, BD). The samples were routinely spun down (2500 g, 10 min (RST)); 1700 g, 10 min (SST)), at room temperature (RT). Only serum sample left-over after measurements for clinical purposes was collected and used for validation experiments. Blood samples collection and analysis for the whole blood stability experiment was performed at Radboud UMC hospital in Nijmegen and did not include elevated TM results. The study was approved by the Institutional Review Board (IRB21-150).
2.2.Experimental design and tumor biomarker analysis
The sample size for each variable of the study was determined by analysing preliminary data using the pwr package [13] within R [14], using a significance of 0.05 and a power of 0.80, a maximum allowable effect size of 10% and analytical variation of the analytes based on Quality control (QC) performance. The obtained sample size was six individual patient samples per TM. To include potential TM level-dependent stability effects in the experimental design, the stability was investigated in 3 arbitrary TM levels: low (i.e., within the reference range), medium (i.e., just above the reference range) and high (i.e., largely exceeding the reference range) based on TM results from routine practice. Altogether, a total of 2 low, 2 medium and 2 high patient samples were used to study each pre-analytical variable. Also, to reduce the analytical variation component and to avoid any potential random error as well as systematic errors introduced e.g. by calibration, every obtained and generated sample was measured in duplicate and samples within an experiment were always analyzed within one analytical run (i.e., on the same day on the same analyzer system). Thus, all samples within an experiment were frozen and thawed just prior to analysis within one analytical run.
The concentrations of CEA, CYFRA 21.1, NSE, CA125 (2nd generation) and HE4 were all determined on a Roche Cobas Pro analyzer system (F. Hoffman - La Roche, Basel, Switzerland).
2.3.Stability testing
Serum samples were collected and divided into the necessary number of aliquots of 150μl each. For the freeze-thaw stability of serum, serum samples were stored at – 20°C for two hours before thawing. This procedure was repeated twice, and the results were compared to those in an aliquot sample without a freeze-thaw cycle.
To determine the effect of electric vibration mixing, all serum sample aliquots were frozen and stored at –80°C. Next, all aliquots were thawed and then homogenized by either gentle inverting the sample 5 times or electric vibration mixing on the highest setting (10), for 20 seconds (Vortex-genie 2, Scientific Industries, New York, US). For CYFRA 21.1 an additional experiment was performed investigating the manufacturer’s instructions of electric vibration mixing for a maximum of five seconds. The gentle inverting of the aliquots was used as the baseline measurement.
To determine the stability of serum at various storage conditions, analyte stability was investigated at room temperature (20°C) and at refrigerated temperature (4°C) for both 2 and 7 days after blood sample collection and serum preparation. All samples obtained within an experiment were stored at – 80°C until measurement of TMs in one analytical run. For NSE an additional experiment was performed to determine the serum stability after 4, 8 and 24 hours at both storage temperatures (RT and 4°C).
Whole blood stability experiments were performed at Radboud UMC hospital in Nijmegen, the Netherlands. Here, the whole blood samples were processed immediately after blood collection and six hours later.
2.4.Statistical analysis
Stability was assessed using the TM recovery, which was calculated using the baseline measurement as reference and expressed as percentage of baseline. The Shapiro-Wilk normality test was used to test for normal data distribution. The difference of TM values compared to baseline was assessed using a paired T-test and a multivariate general linear model with a Bonferroni post-hoc test using SPSS Statistics for Windows version 27.0 (IBM, Armonk, New York, US). The criteria for the (in)stability of the TMs were based on the total allowable bias, which was determined using the TM biological variation data determined by the EFLM working group (Table 1) [15, 16]. Moreover, to determine the stability based on the total allowable bias (TBa) criterion (Table 2) all 6 recovery observations for a certain variable were required to fall within the TBa criterion and no significant difference with the baseline was allowed.
Table 1
Total allowable bias criteria based on within-subject (CVi) and between-subject variation (CVg) [16]
| Marker | CVg (%) | CVi (%) | Total allowable bias (%) |
| CEA | 45.3 | 17.9 | 12.2 |
| CYFRA 21.1 | 22.5 | 38.1 | 11.1 |
| NSE | 16.6 | 10.9 | 5.0 |
| CA125 | 15.8 | 13.3 | 5.2 |
| HE4 | 9.7 | 16.4 | 4.8 |
The total allowable bias (TBa) calculation is based on: TBa = 0.25*(CVg2 +CVi2)1/2.
Table 2
Obtained pre-analytical processing restrictions for TM. TM processing restrictions are based on the requirement that all observations are within the TBa criterion
| Pre-analytical processing step | CA125 | CEA | CYFRA 21.1 | HE4 | NSE |
| Whole blood stability before processing | at least 6 hours | at least 6 hours | at least 6 hours | at least 6 hours | N.D. Processing immediately after blood collection |
| Number of serum freeze-thaw cycles | at least 2 | at least 2 | at least 2** | at least 2 | at least 2 |
| Electronic vibration mixing of serum | at least ≤20 seconds | at least ≤20 seconds | ≤5 seconds* | at least ≤20 seconds | at least ≤20 seconds |
| Serum storage at 4°C | at least 7 days | at least 7 days | at least 7 days | at least 7 days | maximum of 4 hours |
| Serum storage at RT (20°C) | maximum of 2 days*** | at least 7 days | at least 7 days | maximum of 2 days | maximum of 4 hours |
*Although within the TBa (total allowable bias) criterion, a significant bias will be introduced by electronic vibration mixing for 5 seconds therefore preferably electronic vibration mixing is avoided. **Although within the TBa criterion, all samples decreased significantly after 2 freeze-thaw cycles, therefore depending on laboratory preferences freeze-thawing more than once should be avoided. ***Although within the TBa criterion, a significant increase in CA125 concentrations was observed after 7 days of storage.
3.Results
3.1.Analyte stability in whole blood
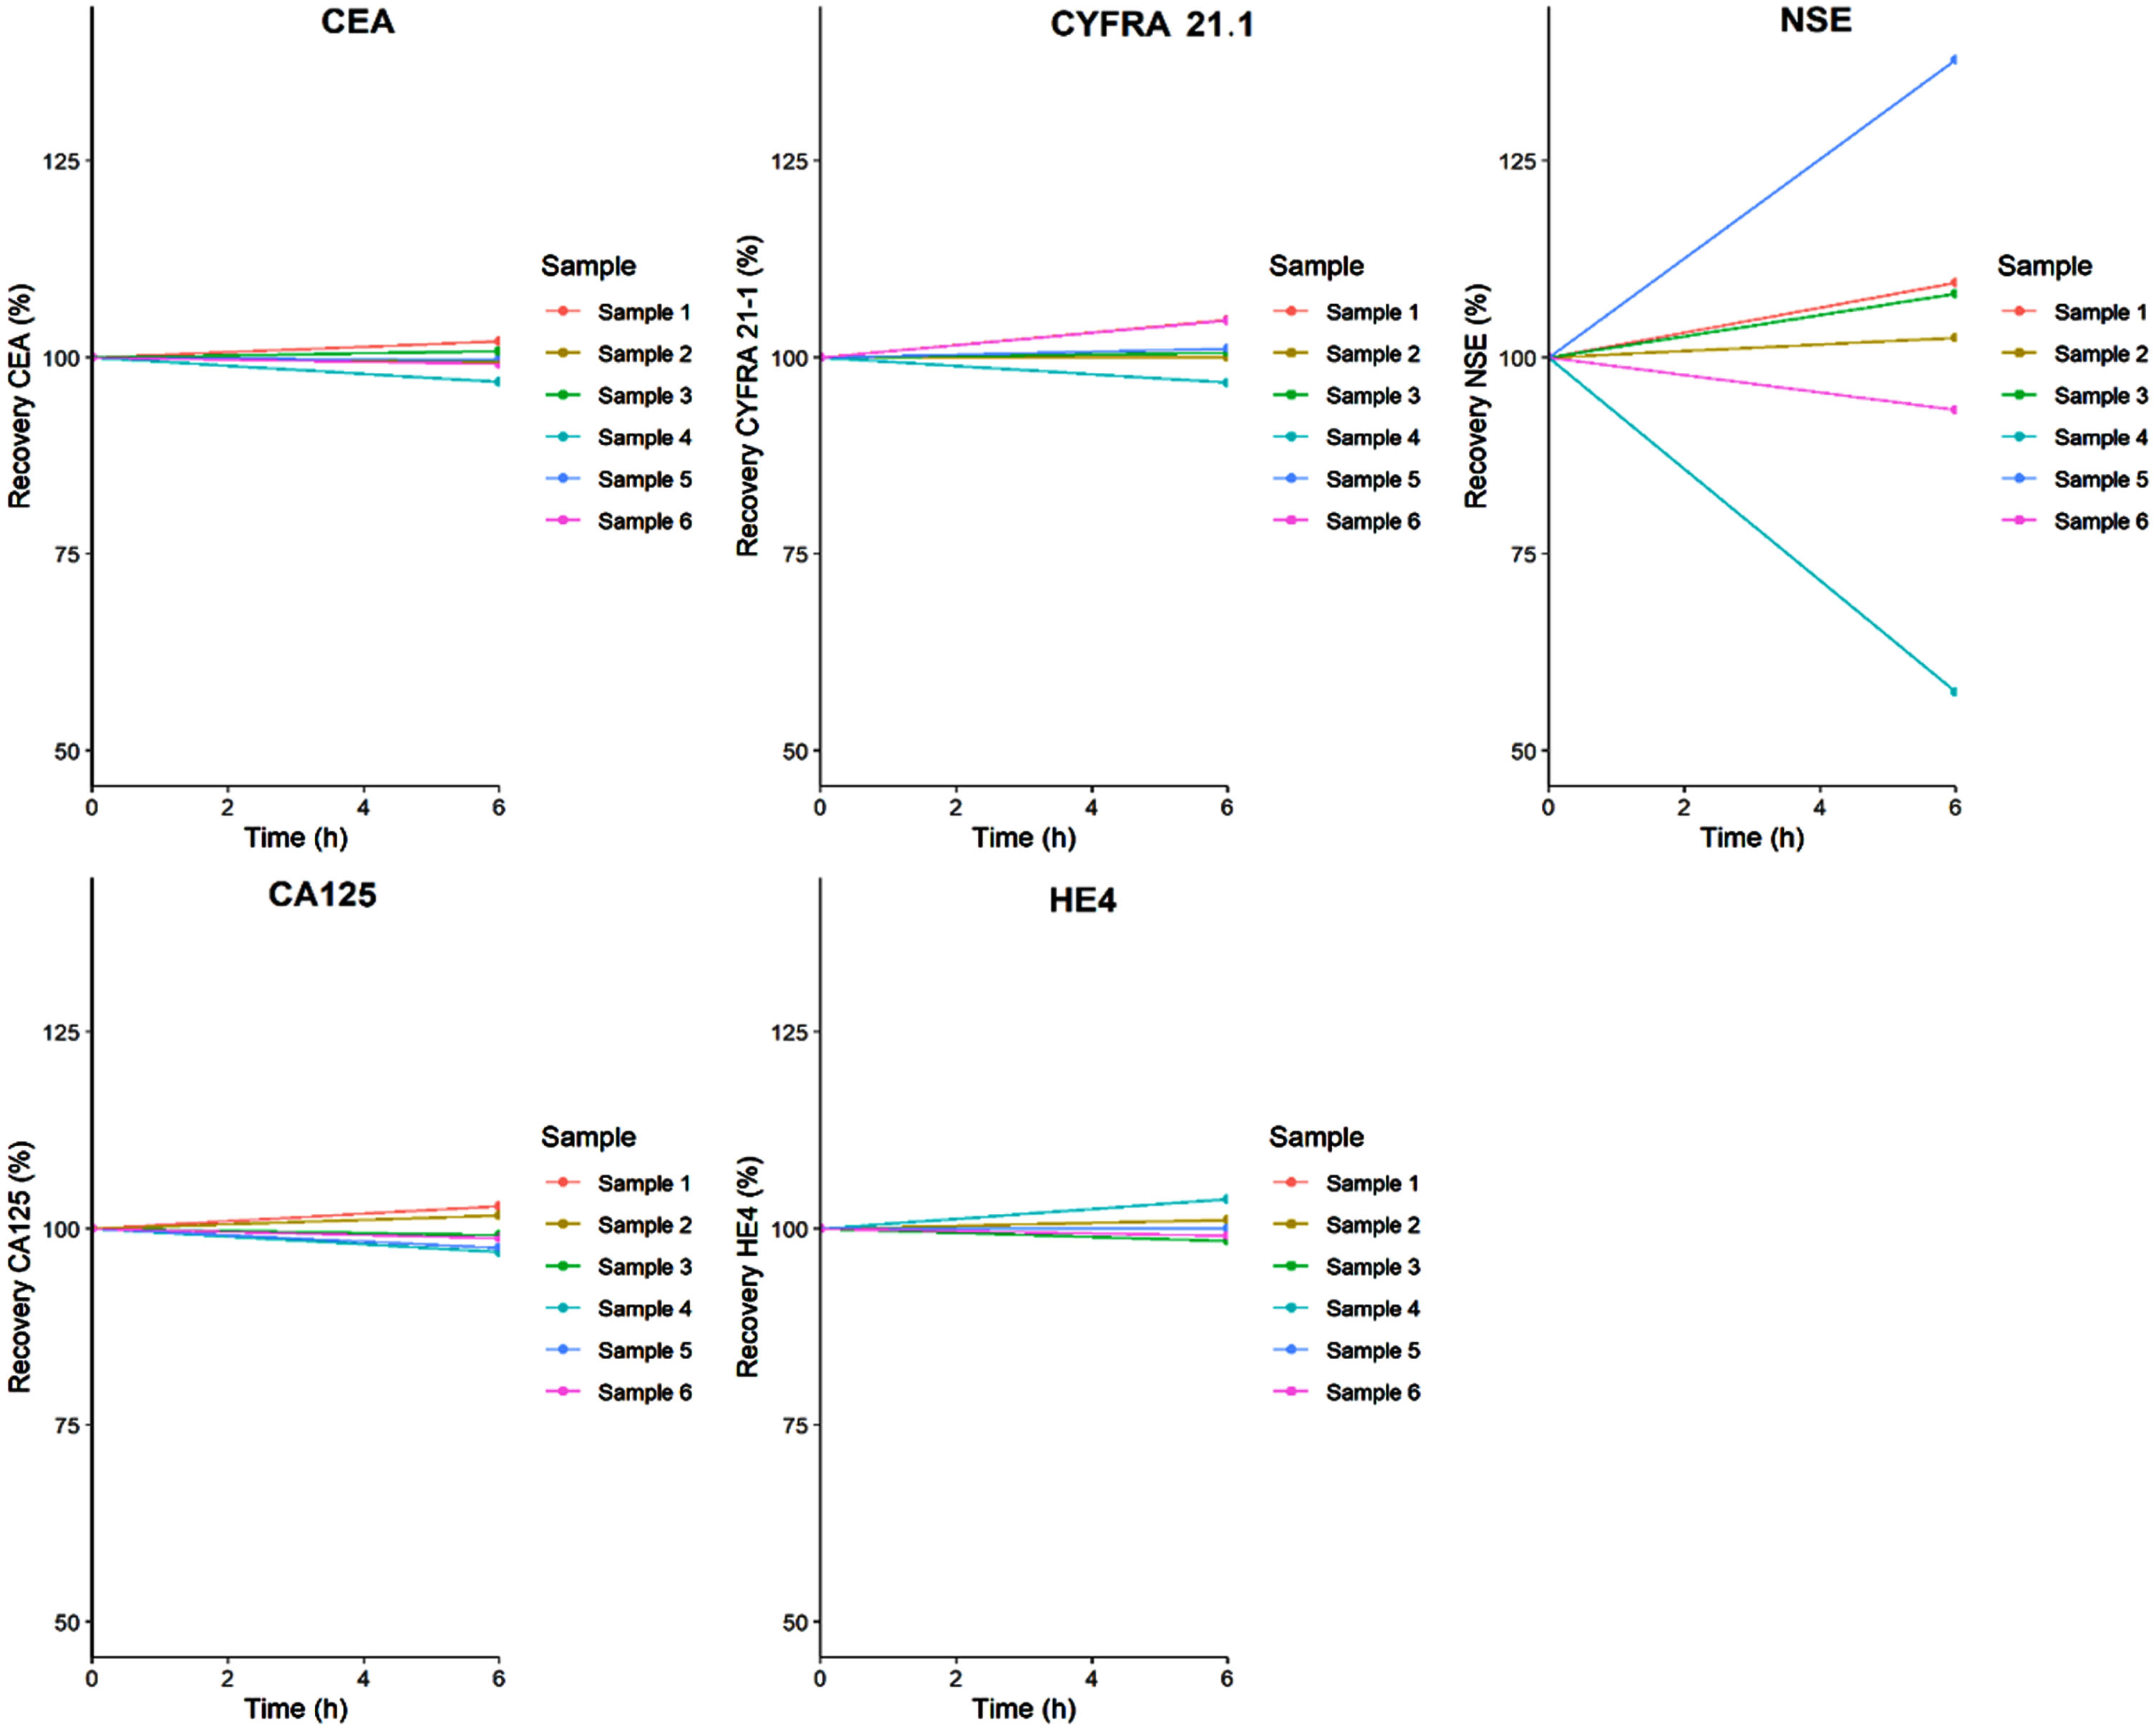
The analyte stability in whole blood tested for the TMs 6 hours after storage at RT is presented in Fig. 1. The recoveries of all TMs did not differ significantly from baseline measurements and, except two NSE samples, fell within the TBa.
Fig. 1
Whole blood stability. Tumor marker recovery in the whole blood after storage for 6 hours at RT.
3.2.Freeze-thawing stability
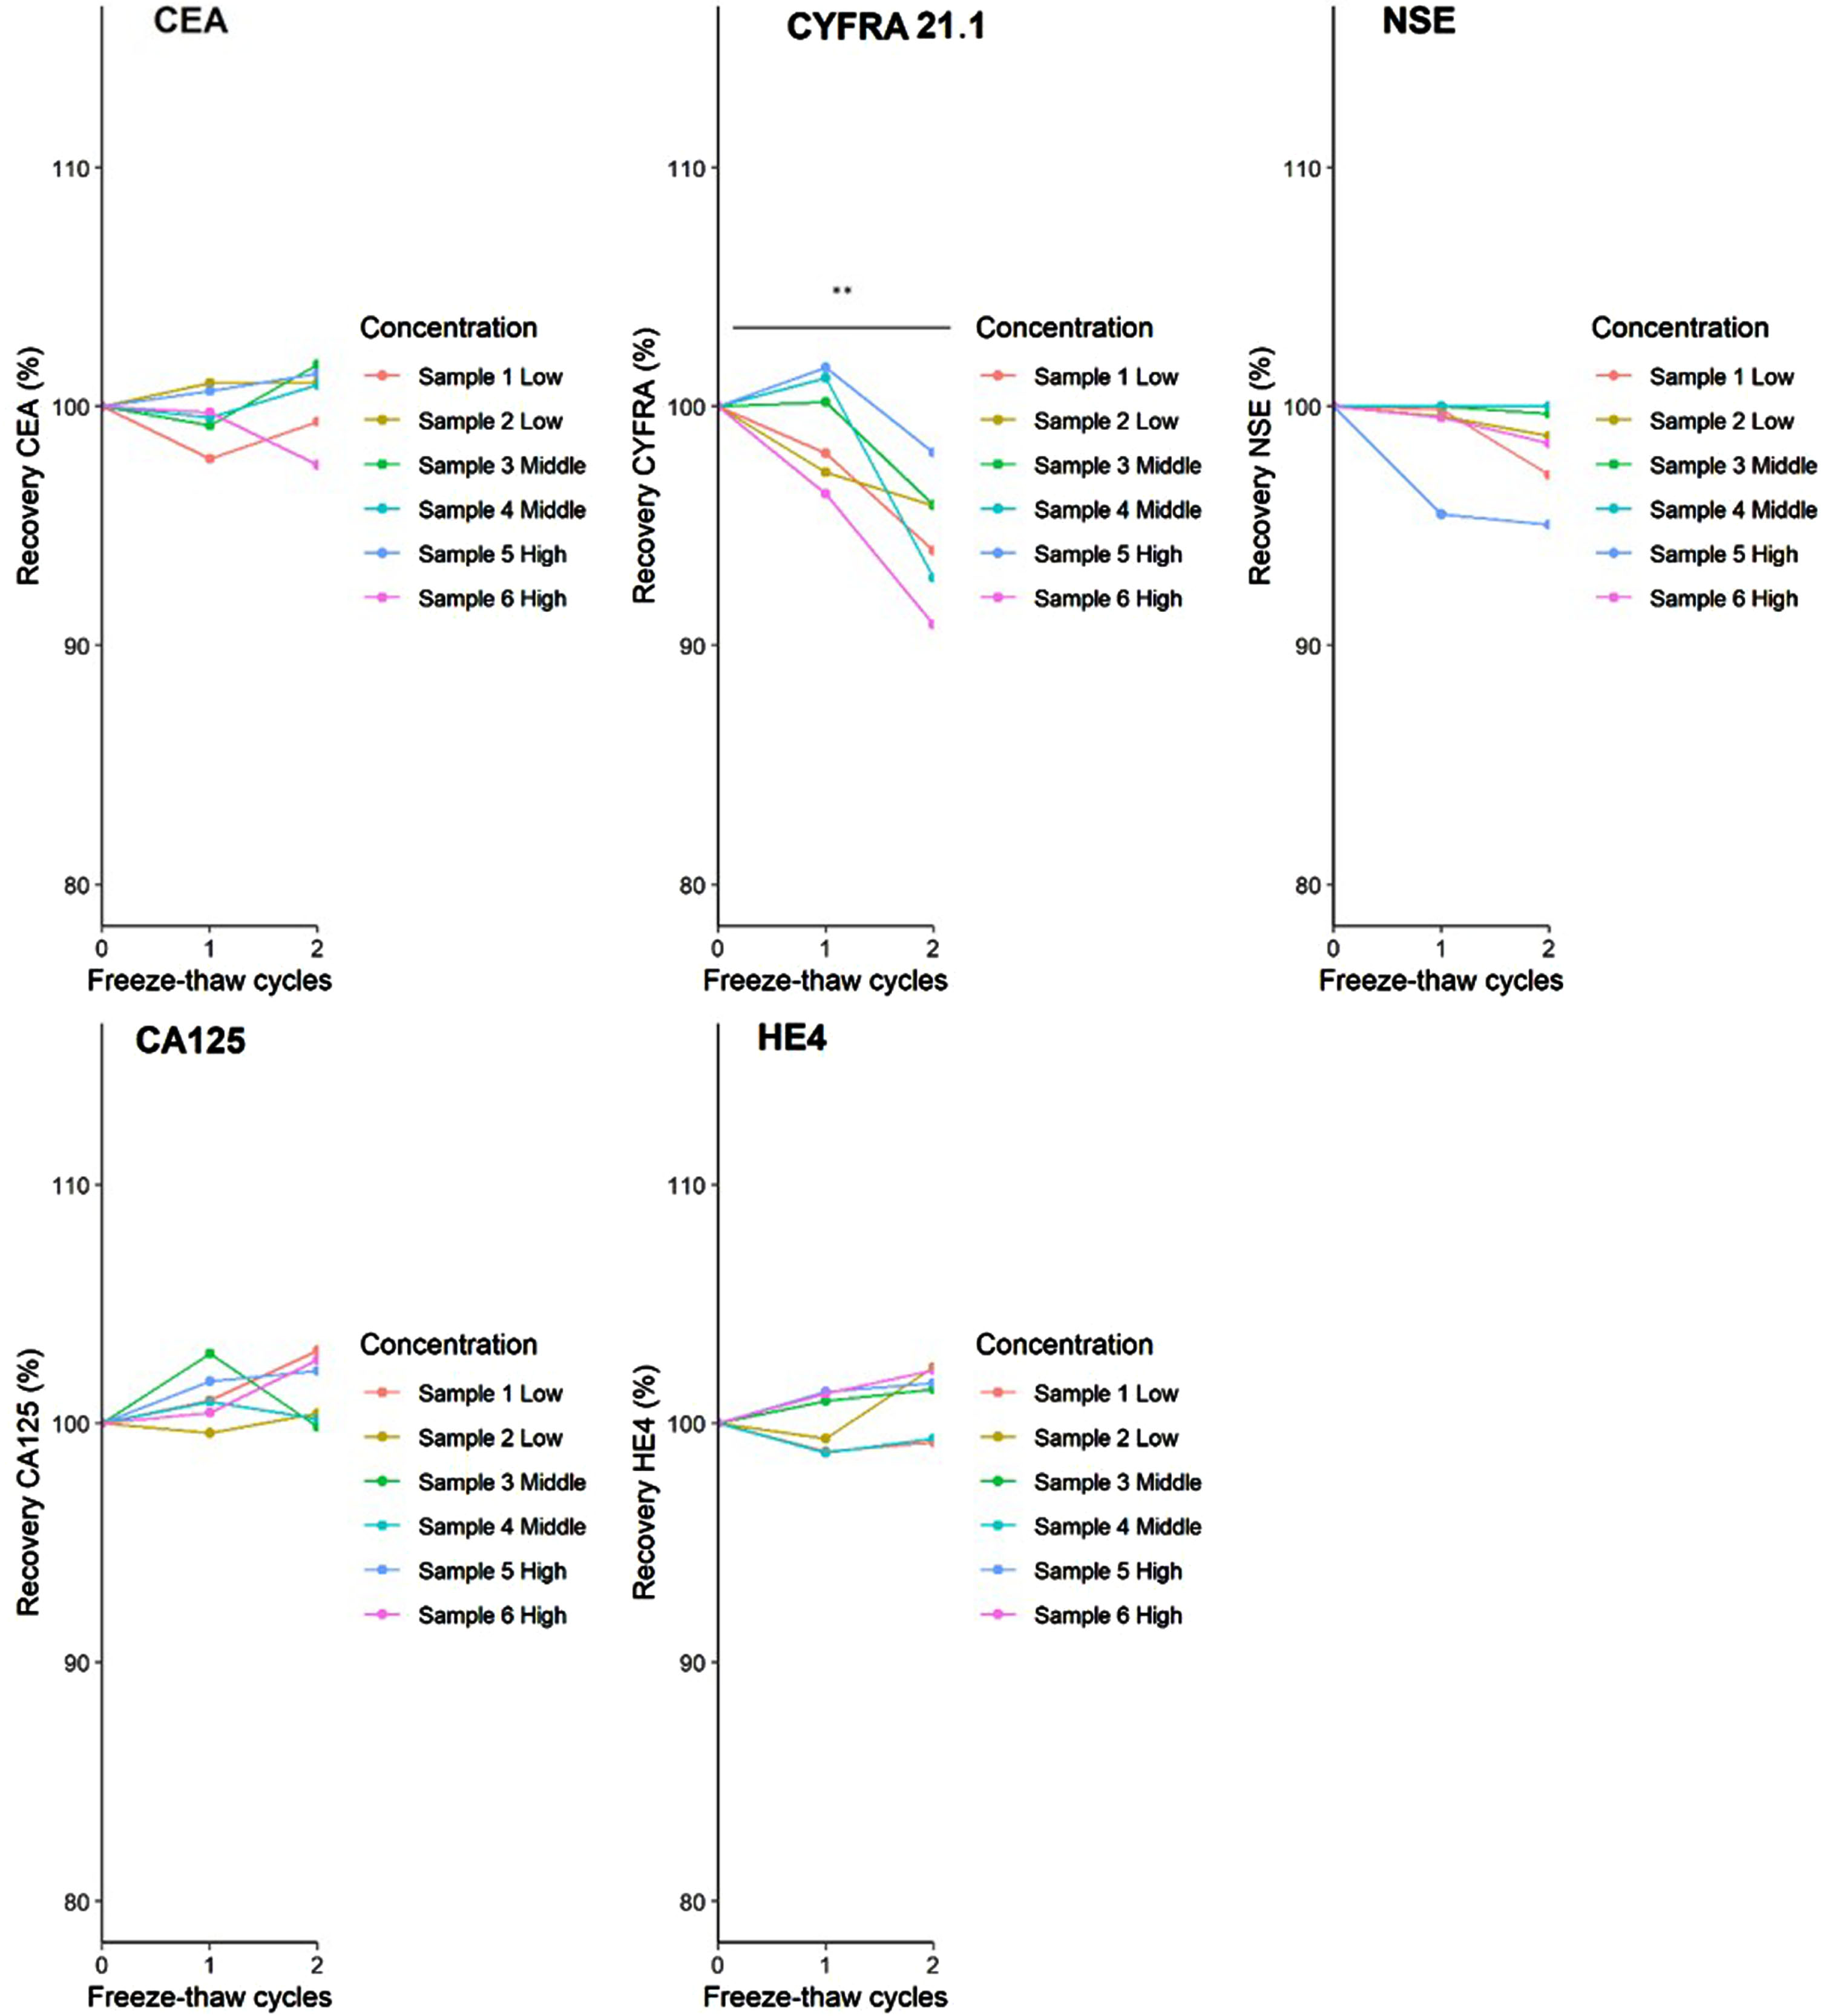
The recovery of the CA125, CEA, NSE and HE4 after two freeze-thaw cycles was not significantly different to the baseline values (Fig. 2). However, for CYFRA 21.1 a significant average concentration decreases of 5% were observed after two freeze-thaw cycles (p < 0.01). Although a significant decrease was seen, it did not exceed the TBa criterion.
Fig. 2
Freeze-thaw cycle stability. The recovery of the TMs after 1 and 2 freeze-thawing cycles (**p < 0.01).
3.3.Electric vibration mixing stability
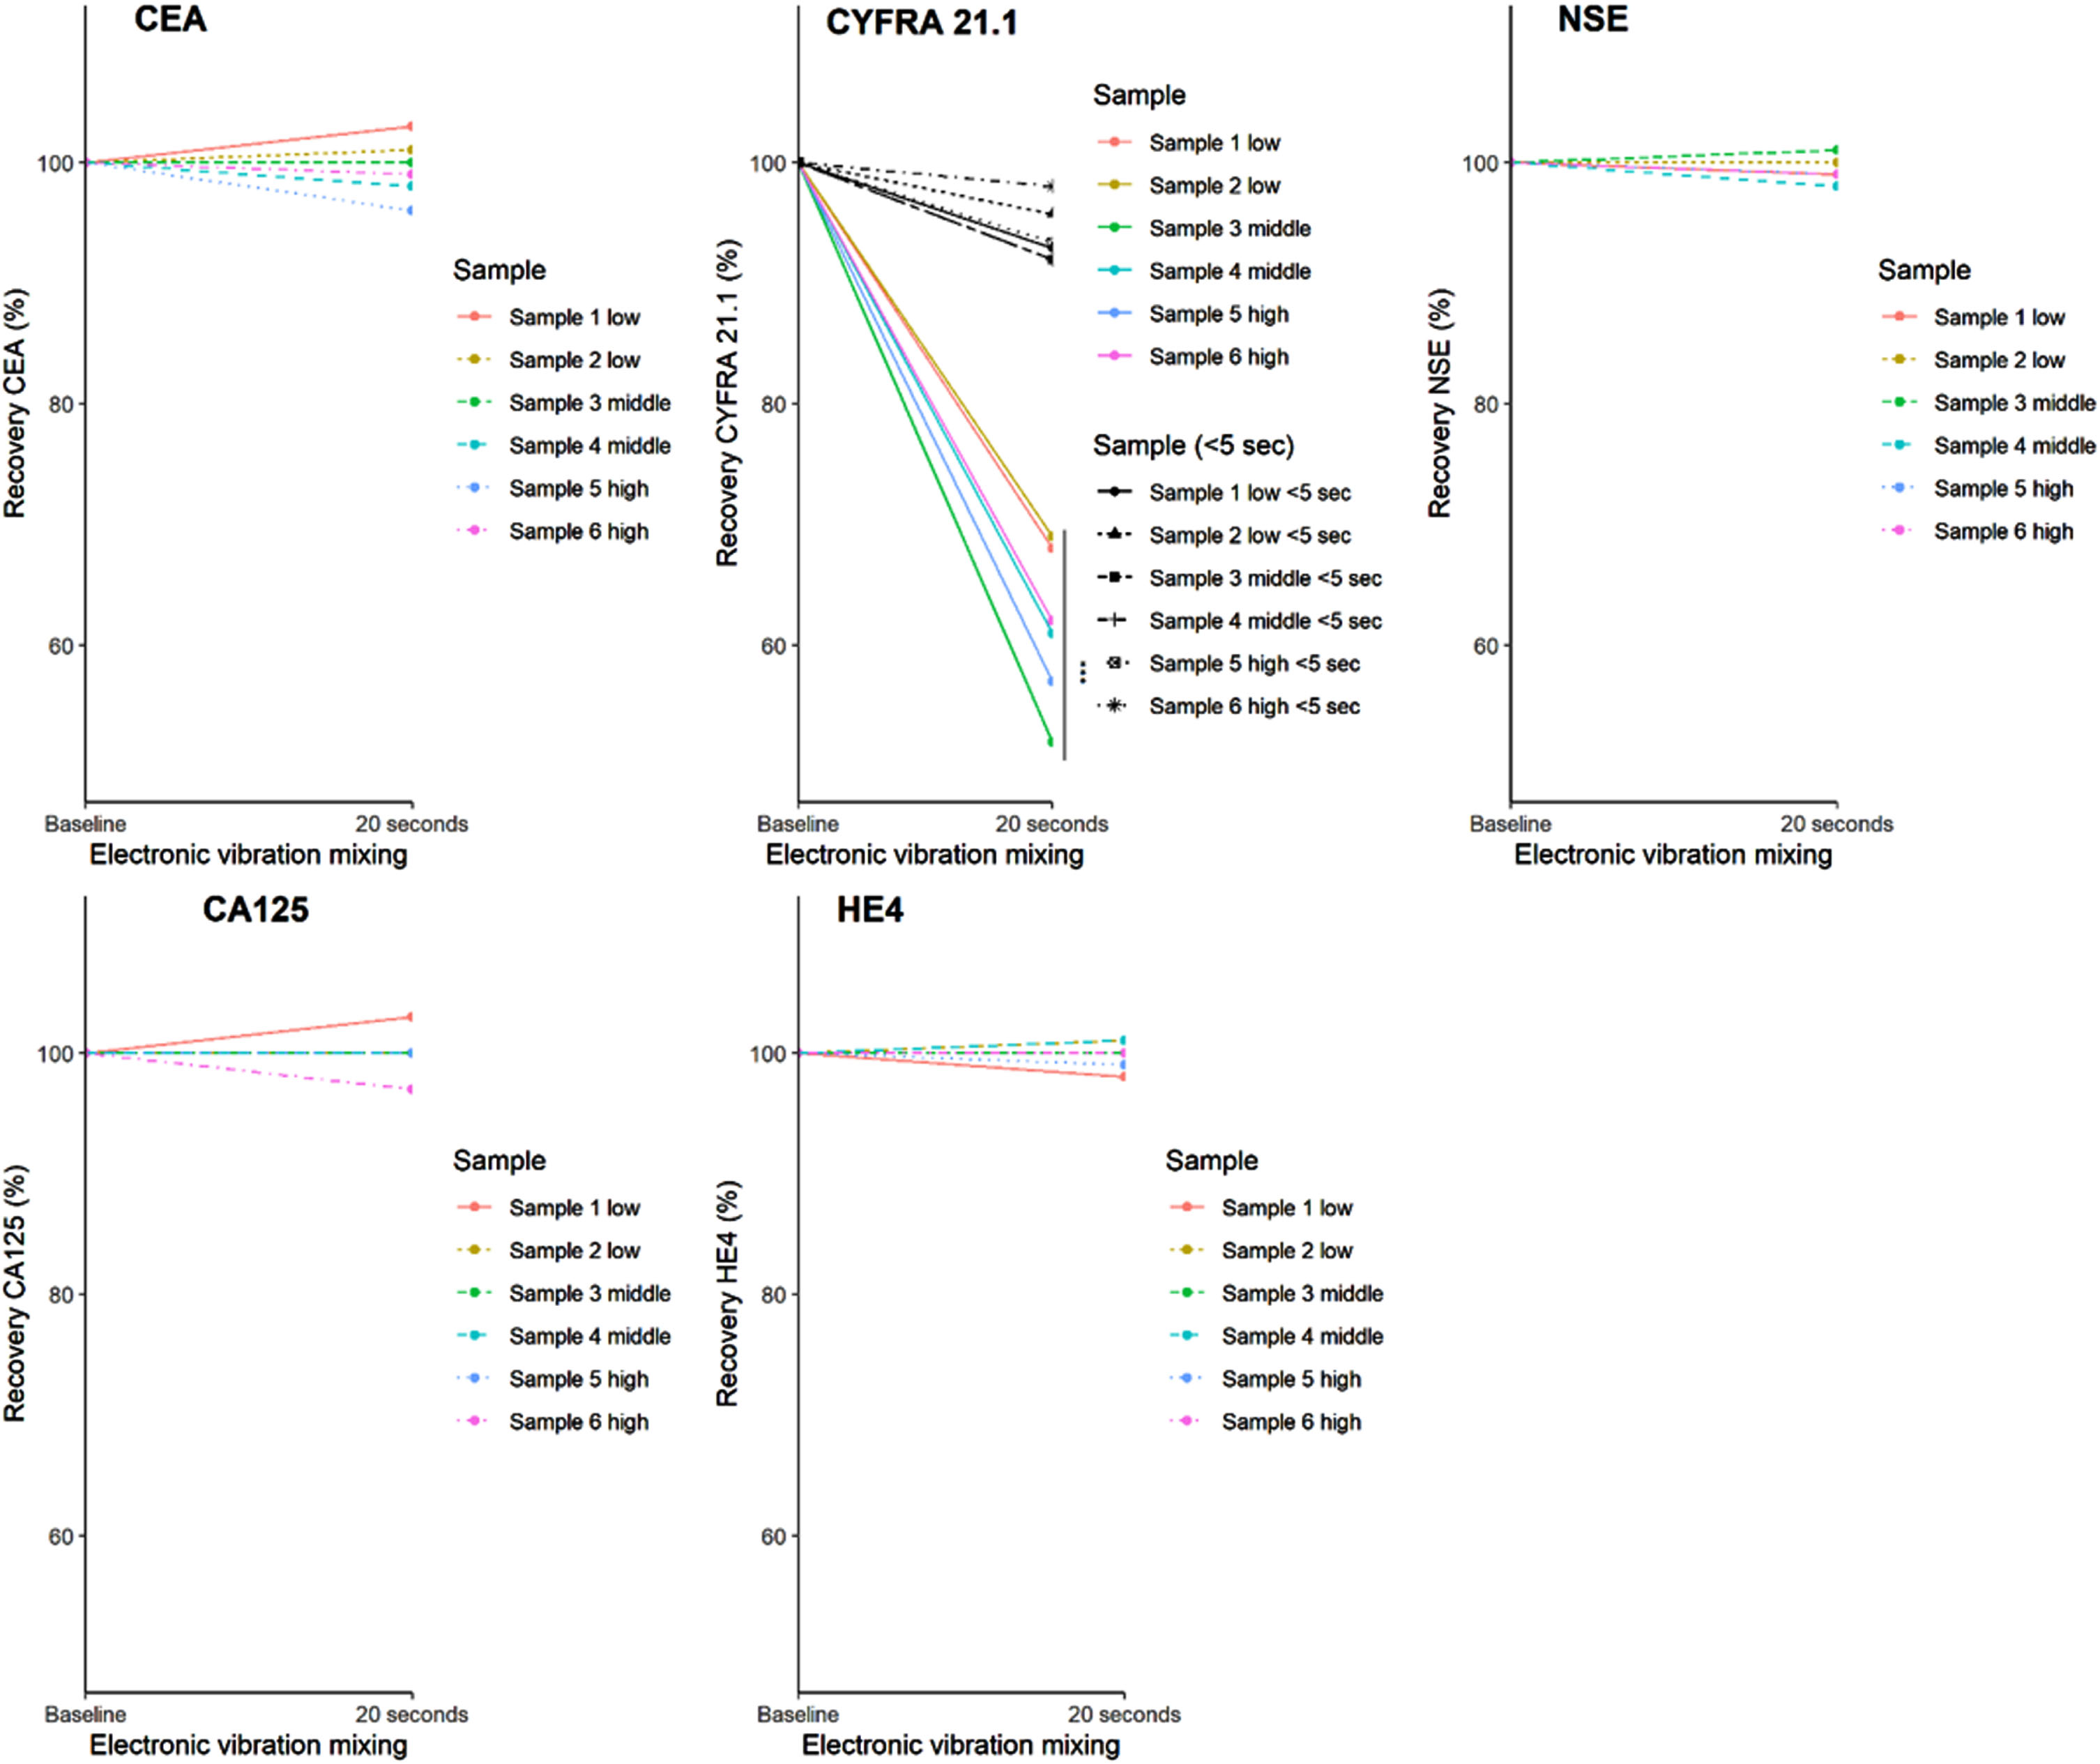
When serum was mixed by electric vibration mixing for 20 seconds after freeze-thawing, only CYFRA 21.1 decreased significantly in comparison to the inverted baseline measurement (Fig. 3, p < 0.001). This resulted in an average CYFRA 21.1 concentration reduction of 36%, which did exceed the TBa criterion. When CYFRA 21.1 was mixed for five seconds, a mean decrease of 7% was observed, but it was not statistically significant. The loss in recovery after electric mixing was independent of the CYFRA 21.1 concentration.
Fig. 3
Electric vibration mixing stability. The analyte recovery for each TM after 20 seconds of electric vibration mixing (vortex) (***p < 0.001). For CYFRA 21.1 also the TM recovery after 5 seconds of electric vibration mixing was investigated.
3.4.Serum storage stability
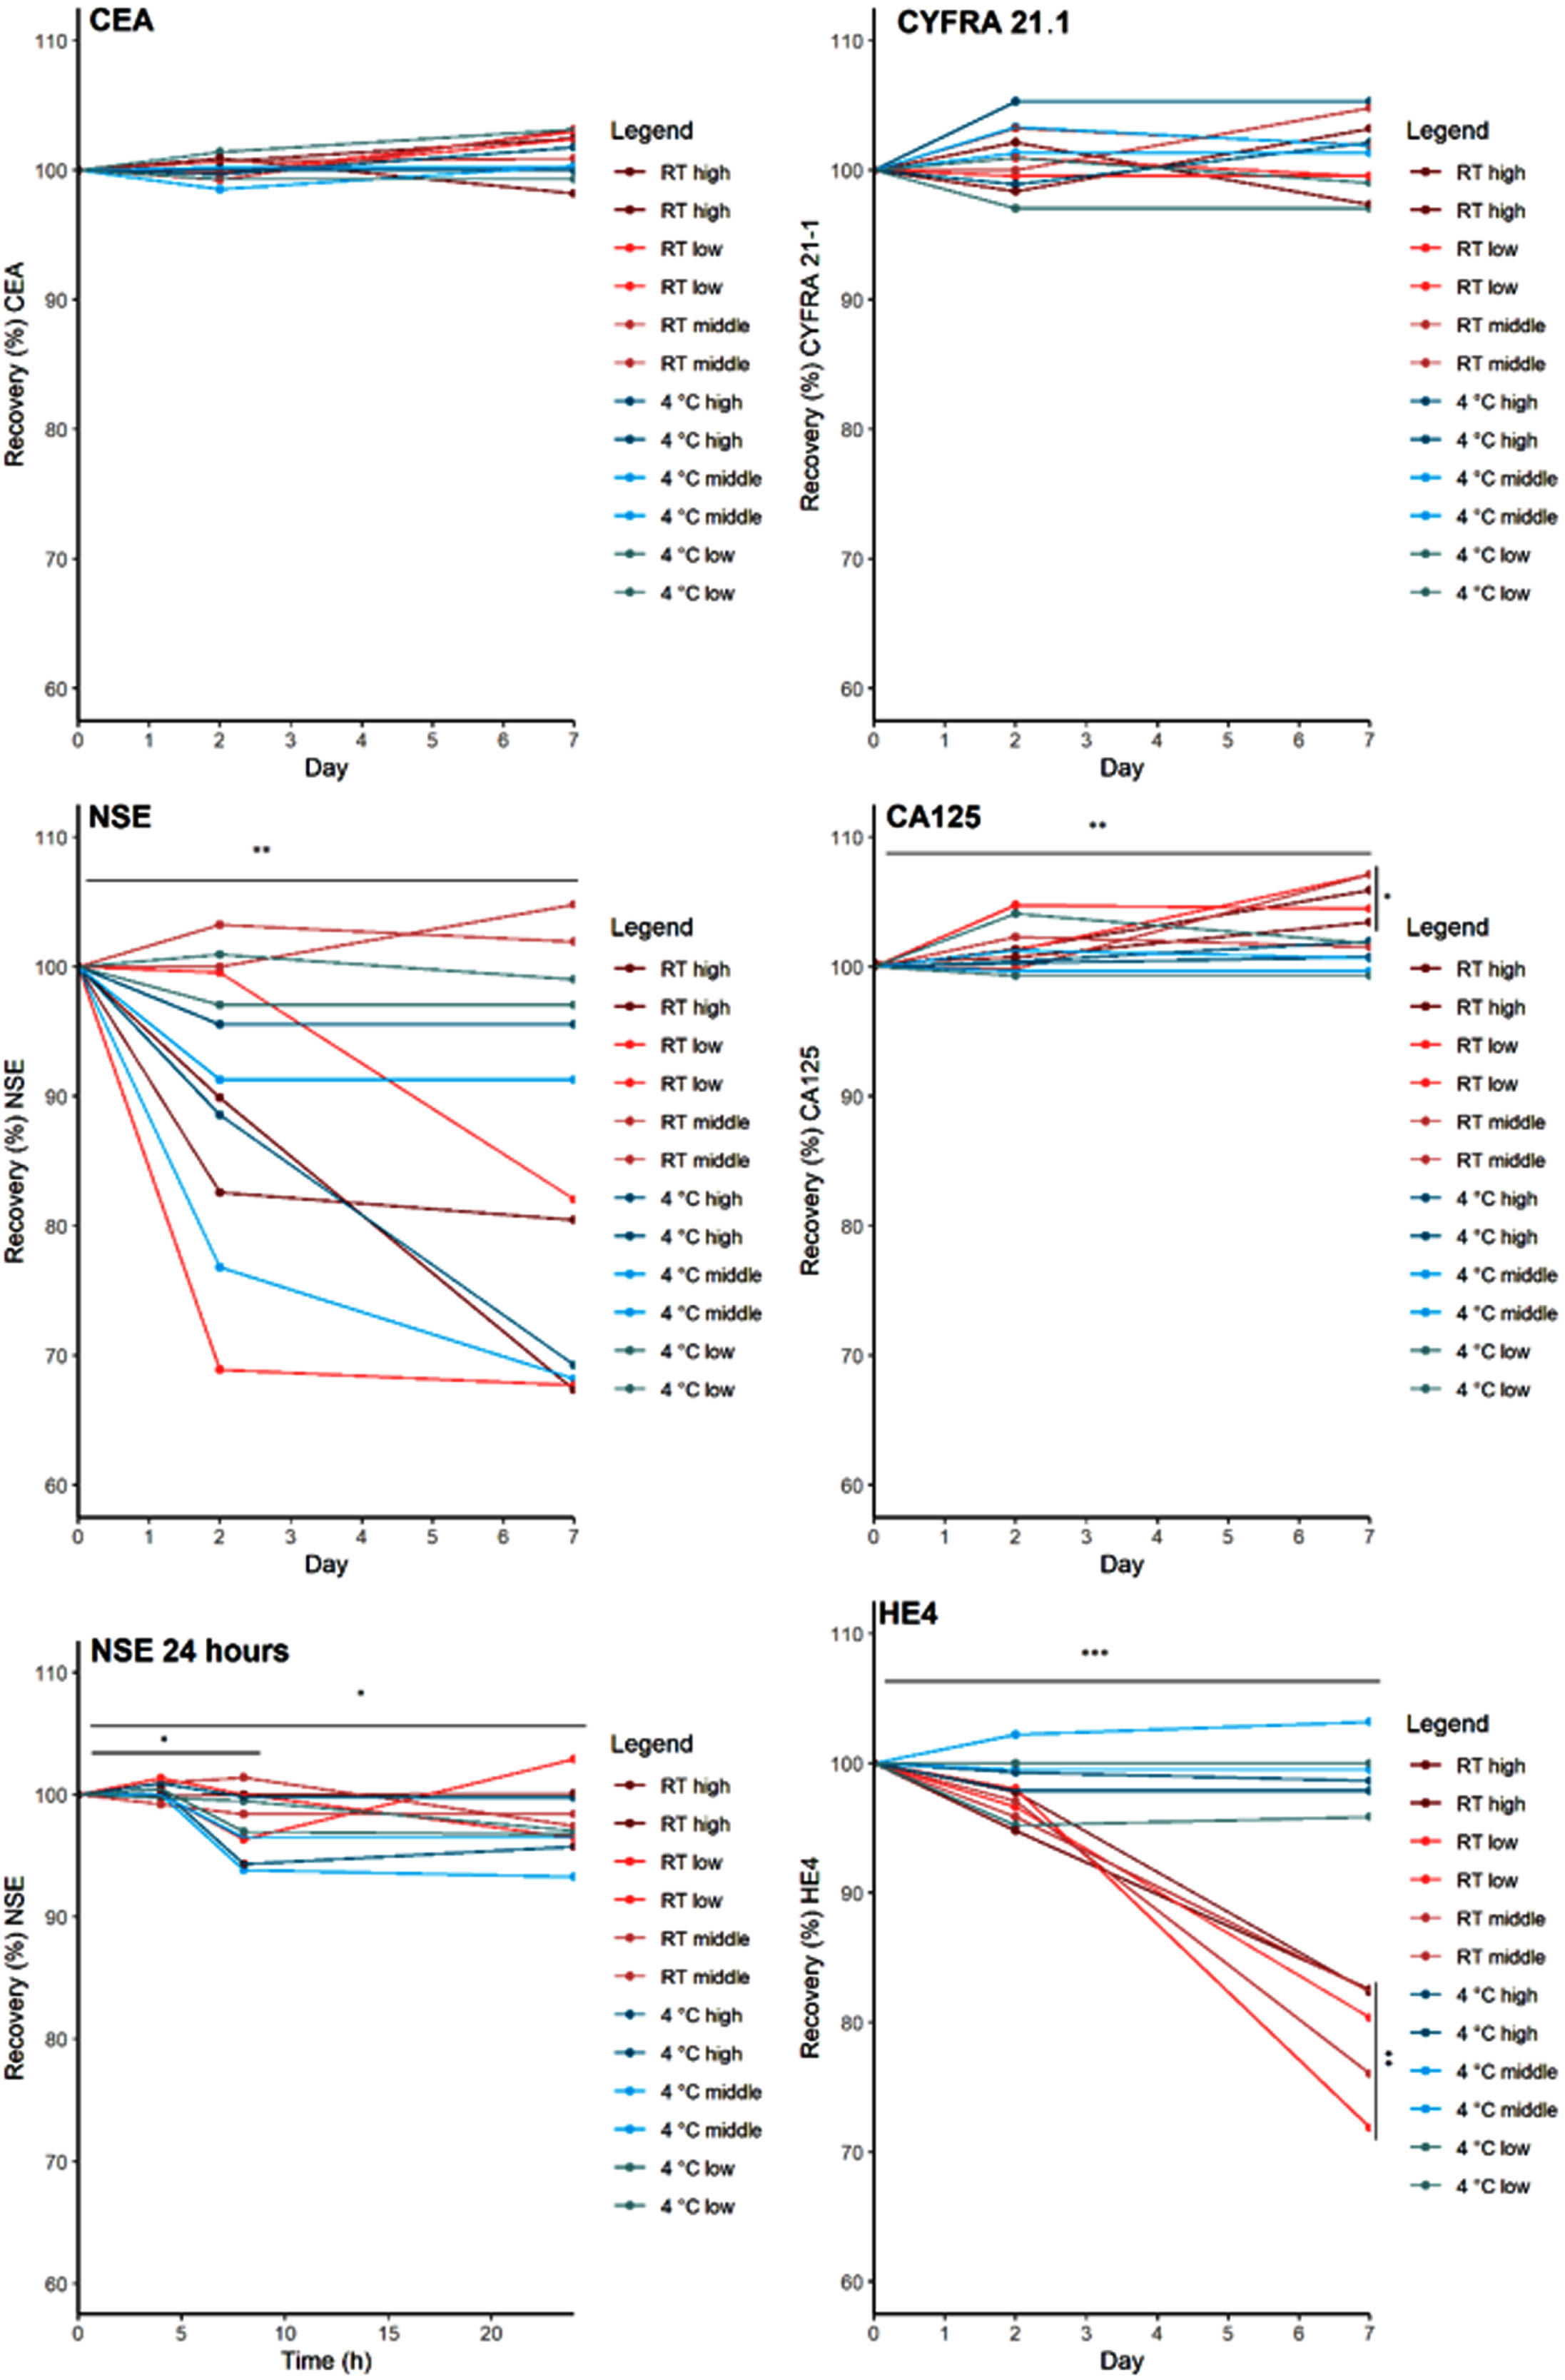
The TMs serum stability was tested for two storage temperature conditions (4°C and RT) and various durations up to 7 days. CEA and CYFRA 21.1 did not show a significant increase or decrease when stored at either 4°C or RT for 7 days (Fig. 4). CA125 showed a significant increase in concentration when stored at RT for 7 days (p < 0.01); which did not exceed the TBa criterion. HE4 significantly decreased, on average by 21%, when stored at room temperature for 7 days (p < 0.001). No significant decrease was seen for HE4 when stored at 4°C. NSE significantly decreased when stored for 2 and 7 days at RT and at 4°C (p < 0.01) with an average NSE decrease up to 33%. In a follow-up experiment, significant NSE decreases were observed when serum was stored for 8 and 24 hours (p < 0.05), exceeding the TBa.
Fig. 4
Serum storage stability. The effect of storage temperature and duration on the recovery of the TMs is presented. For NSE an additional experiment investigating the recovery after 4, 8 and 24 hours of storage was performed (*p < 0.05, **p < 0.01, *** p < 0.001).
4.Discussion
In order for laboratories and hospitals to use biomarkers in routine clinical practice, it is necessary to determine the pre-analytical disturbances that may affect biomarker concentrations in whole blood and serum. This study aimed to determine the pre-analytical variables and restrictions regarding storage and preparation of the samples for the TMs CEA, CYFRA 21.1, NSE, CA125 and HE4. A number of different pre-analytical processes were investigated and based on the results and the total allowable bias criterion, final recommendations regarding pre-analytical conditions were defined (Table 2).
First, the effect of two freeze-thaw cycles on TM concentration was determined. The results show that the CA125, CEA, HE4 and concentrations were not affected by two freeze-thaw cycles. For CYFRA 21.1 however, a significantly lower concentration was seen after two freeze-thaw cycles when compared to the baseline levels. This is in line with a study by Sandhu et al., who found that HE4 and CA125 concentrations were not affected when serum samples were subject to eight freeze-thaw cycles [17]. However, a study by Gao et al. determined that while serum samples were not affected by short freeze-thaw cycles, CEA and CA125 were affected when subjected to a long freeze duration of 10 months [18].
Next, we examined the influence of electric vibration mixing, a pre-analytical process that induce aggregation of certain proteins, and an increase in aggregation may, in rare cases, lead to a decrease in concentration of proteins [19]. CYFRA 21.1 decreased significantly after electric vibration mixing for 20 seconds compared to the baseline measurement. In contrast, the other TMs did not show any significant decrease after electric vibration mixing when compared to their baseline measurements. Shorter electronic mixing, 5 seconds, resulted in a lower decrease in CYFRA 21.1 concentration compared to the decrease after 20 second mixing.
Last, the stability of the TMs was assessed when serum was stored for two and seven days at different temperature conditions. Significant decrease was seen in both HE4 and NSE when compared to their baseline measurements. A temperature dependent instability was observed for HE4; long-term storage of HE4 sera at room temperature caused a decrease in HE4 concentration, but storage at 4°C did not. Serum storage for over 24 hours caused a significant decrease in NSE concentration, this effect was minimized when a sample was stored for less than 24 hours. A study by Sandhu et al. found no difference in HE4 concentrations between samples handled at 4°C and room temperature; however, their samples were stored for 72 hours only. Furthermore, in their study, CA125 showed a significantly lower concentration in the samples handled at a lower temperature [17]. In this study, there was no significant difference found in CA125 concentrations, following sample storage at ambient temperature and 4°C.
In this study, an experimental design was used that included the selection of three levels of TMs obtained from two independent blood samples. The idea was that this set-up should be able to detect potential TM concentration-dependent instability, and the requirement of 6 samples was based on the sample size calculation presented above. Furthermore, each sample was analyzed in duplicate, and each experiment was performed in one analytical run, in order to mark outliers and reduce potential random or systematic errors. The reason for self-designing the experiment was that, to our knowledge, there are no guidelines on how to design and perform pre-analytical stability studies for patient materials. There is a CLSI protocol (EP25) that describes the evaluation of stability of in vitro diagnostic reagents, and although some aspects are useful, it does not include all issues relevant to patient samples, such as those of different TM concentrations [20]. Also, the selected acceptance criterion used for defining stability, that did not allow a single result to exceed the TBa criterion and no significant difference with baseline, is debatable. As a start, the accuracy of the biological variation estimates for TMs is rather limited [21]. However, this - in our view - rather stringent criterion for defining pre-analytical stability, should avoid any potential clinical impact for the recommended tolerances of the individually investigated pre-analytical processing steps.
5.Conclusion
Critical pre-analytical processing steps have been assessed for the TM CA125, CEA, CYFRA 21.1, HE4, and NSE and the recommendations that should be taken into account when processing blood samples for these TM analyses are given in Table 2.
Author contributions
CONCEPTION: HvR, MvH, MS and TH
DATA CURATION: EC, TL and AvH
ANALYSIS OF DATA: EC
PREPARATION OF THE MANUSCRIPT: EC and HvR
REVISION FOR IMPORTANT INTELLECTUAL CONTENT: All authors
SUPERVISION: HvR
Conflict of interest
E. Canski, M. Schuurbiers, T. Linders, C. Korse and A. van Herwaarden declare no potential conflicts of interest. M.M. van den Heuvel has received research funding or honoraria from AbbVie, AstraZeneca, Bristol Myers Squibb, Eli Lilly, Janssen Pharmaceuticals, Merck & Co., Inc., Merck Sharp & Dohme, Novartis, PamGene, Pfizer, Roche, and Stichting Treatmeds. Moreover, Michel M. van den Heuvel is a guest editor in the special issue “Lung Cancer in Tumor Markers” but had no participation in the peer review process of this paper. H. van Rossum is owner and director of Huvaros B.V. and holds stock in SelfSafeSure Blood Collections B.V. Huub van Rossum is the editrorial board member of Tumor Biology but had no participation in the peer review process of this paper.
References
[1] | Hoseok I , Cho JY . Lung cancer biomarkers. Adv Clin Chem. (2015) ;72: :107–170. doi: 10.1016/bs.acc.2015.07.003. |
[2] | Ludwig JA , Weinstein JN . Biomarkers in cancer staging, prognosis and treatment selection. Nat Rev Cancer. (2005) ;5: :845–856. doi: 10.1038/nrc1739. |
[3] | Wojcik E , Kulpa JK . Pro-gastrin-releasing peptide (progrp) as a biomarker in small-cell lung cancer diagnosis, monitoring and evaluation of treatment response. Lung Cancer (Auckl). (2017) ;8: :231–240. doi: 10.2147/lctt.S149516. |
[4] | Nagy B Jr. , Bhattoa HP , Steiber Z , Csobán M , Szilasi M , Méhes G , Müller M , Lázár J , Kappelmayer J , Antal-Szalmás P . Serum human epididymis protein 4 (he4) as a tumor marker in men with lung cancer. Clin Chem Lab Med. (2014) ;52: :1639–1648. doi: 10.1515/cclm-2014-0041. |
[5] | Molina R , Filella X , Augé JM , Fuentes R , Bover I , Rifa J , Moreno V , Canals E , Viñolas N , Marquez A , Barreiro E , Borras J , Viladiu P . Tumor markers (cea, ca 125, cyfra 21-1, scc and nse) in patients with non-small cell lung cancer as an aid in histological diagnosis and prognosis. Comparison with the main clinical and pathological prognostic factors. Tumour Biol. (2003) ;24: :209–218. doi: 10.1159/000074432. |
[6] | Holdenrieder S , Wehnl B , Hettwer K , Simon K , Uhlig S , Dayyani F . Carcinoembryonic antigen and cytokeratin-19 fragments for assessment of therapy response in non-small cell lung cancer: A systematic review and meta-analysis. Br J Cancer. (2017) ;116: :1037–1045. doi: 10.1038/bjc.2017.45. |
[7] | Muller M , Hoogendoorn R , Moritz RJG , van der Noort V , Lanfermeijer M , Korse CM , van den Broek D , Ten Hoeve JJ , Baas P , van Rossum HH , van den Heuvel MM . Validation of a clinical blood-based decision aid to guide immunotherapy treatment in patients with non-small cell lung cancer. Tumour Biol. (2021) ;43: :115–127. doi: 10.3233/tub-211504. |
[8] | van Delft FA , Schuurbiers M , Muller M , Burgers SA , van Rossum HH , Ijzerman MJ , Koffijberg H , van den Heuvel MM . Modeling strategies to analyse longitudinal biomarker data: An illustration on predicting immunotherapy non-response in non-small cell lung cancer. Heliyon. (2022) :e1093. doi: 10.1016/j.heliyon.2022.e10932. |
[9] | Da RinG. Pre-analytical workstations: A tool for reducing laboratory errors. Clin Chim Acta. (2009) ;404: :68–74. doi: 10.1016/j.cca.2009.03.024. |
[10] | Kang HJ , Jeon SY , Park JS , Yun JY , Kil HN , Hong WK , Lee MH , Kim JW , Jeon JP , Han BG . Identification of clinical biomarkers for pre-analytical quality control of blood samples. Biopreserv Biobank. (2013) ;11: :94–100. doi: 10.1089/bio.2012.0051. |
[11] | PlebaniM. Errors in clinical laboratories or errors in laboratory medicine? Clin Chem Lab Med. (2006) ;44: :750–910.1515/cclm.2006.123. |
[12] | Genet S , Visser E , van den Borne B , Soud MY , Belderbos HNA , Stege G , de Saegher MEA , Eduati F , Broeren MAC , van Dongen J , Brunsveld L , van de Kerkhof D , Scharnhorst V . Correction of the nse concentration in hemolyzed serum samples improves its diagnostic accuracy in small-cell lung cancer. Oncotarget. (2020) ;11: :2660–8. doi: 10.18632/oncotarget.27664. |
[13] | Champley S. Basic functions for power analysis [internet]. 2020 [cited 2022 March 01]. Available from: cran.r-project.org/web/packages/pwr/pwr.pdf |
[14] | RCoreTeam. R: A language and environment for statistical computing., R Foundation for Statistical Computing, 2020 [cited 2022 March 01]. Available from: www.eea.europa.eu/data-and-maps/indicators/oxygen-consuming-substances-in-rivers/r-development-core-team-2006 |
[15] | Coşkun A , Aarsand AK , Sandberg S , Guerra E , Locatelli M , Díaz-Garzón J , Fernandez-Calle P , Ceriotti F , Jonker N , Bartlett WA , Carobene A . Within- and between-subject biological variation data for tumor markers based on the european biological variation study. Clin Chem Lab Med. (2022) ;60: :543–552. doi: 10.1515/cclm-2021-0283. |
[16] | AarsandAK F-CP, WebsterC, CoskunA, Gonzales-LaoE, Diaz-GarzonJ, JonkerN, MinchinelaJ, SimonM, BragaF, PerichC, BonedB, RoraasT, Marques-GarciaF, CarobeneA, AslanB, BarlettWA, SandbergS. The eflm biological variation database [internet]. 2021 [cited 2022 March 01]. Available from: https://biologicalvariation.eu |
[17] | Sandhu N , Karlsen MA , Høgdall C , Laursen IA , Christensen IJ , Høgdall EV . Stability of he4 and ca125 in blood samples from patients diagnosed with ovarian cancer. Scand J Clin Lab Invest. (2014) ;74: :477–484. doi: 10.3109/00365513.2014.903430. |
[18] | Gao YC , Yuan ZB , Yang YD , Lu HK . Effect of freeze-thaw cycles on serum measurements of afp, cea, ca125 and ca19-9. Scand J Clin Lab Invest. (2007) ;67: :741–747. doi: 10.1080/00365510701297480. |
[19] | Treuheit MJ , Kosky AA , Brems DN . Inverse relationship of protein concentration and aggregation. Pharm Res. (2002) ;19: :511–516. doi: 10.1023/a:1015108115452. |
[20] | CLSI. ClSI EP25-a. Evaluation of stability of in vitro diagnostic reagents. Approved guideline., Clinical Laboratory Standards Institute, 2009. |
[21] | Marques-Garcia F , Boned B , González-Lao E , Braga F , Carobene A , Coskun A , Díaz-Garzón J , Fernández-Calle P , Perich MC , Simon M , Jonker N , Aslan B , Bartlett WA , Sandberg S , Aarsand AK . Critical review and meta-analysis of biological variation estimates for tumor markers. Clin Chem Lab Med. (2022) ;60: :494–504. doi: 10.1515/cclm-2021-0725. |


