Erratum to: Silencing of ST6GalNAc I suppresses the proliferation, migration and invasion of hepatocarcinoma cells through PI3K/AKT/NF-κB pathway
Xiao Yu, Qiang Wu, Liping Wang, Yujie Zhao, Qingqing Zhang, Qingtao Meng, Pawan and Shujing Wang
[Tumor Biology, 37, 2016, 12213–12221, DOI: 10.1007/s13277-016-5086-y]
Subsequently to the publication of this article, the authors noticed that the published version of Fig. 3 contained incorrect data showing the expression of STn in the shNC group (Fig. 3D,E). The correct Fig. 3 and legend are given below. This error did not affect either the results or the conclusions reported in the paper. The authors apologize to the readers of Tumor Biology for any inconvenience caused.
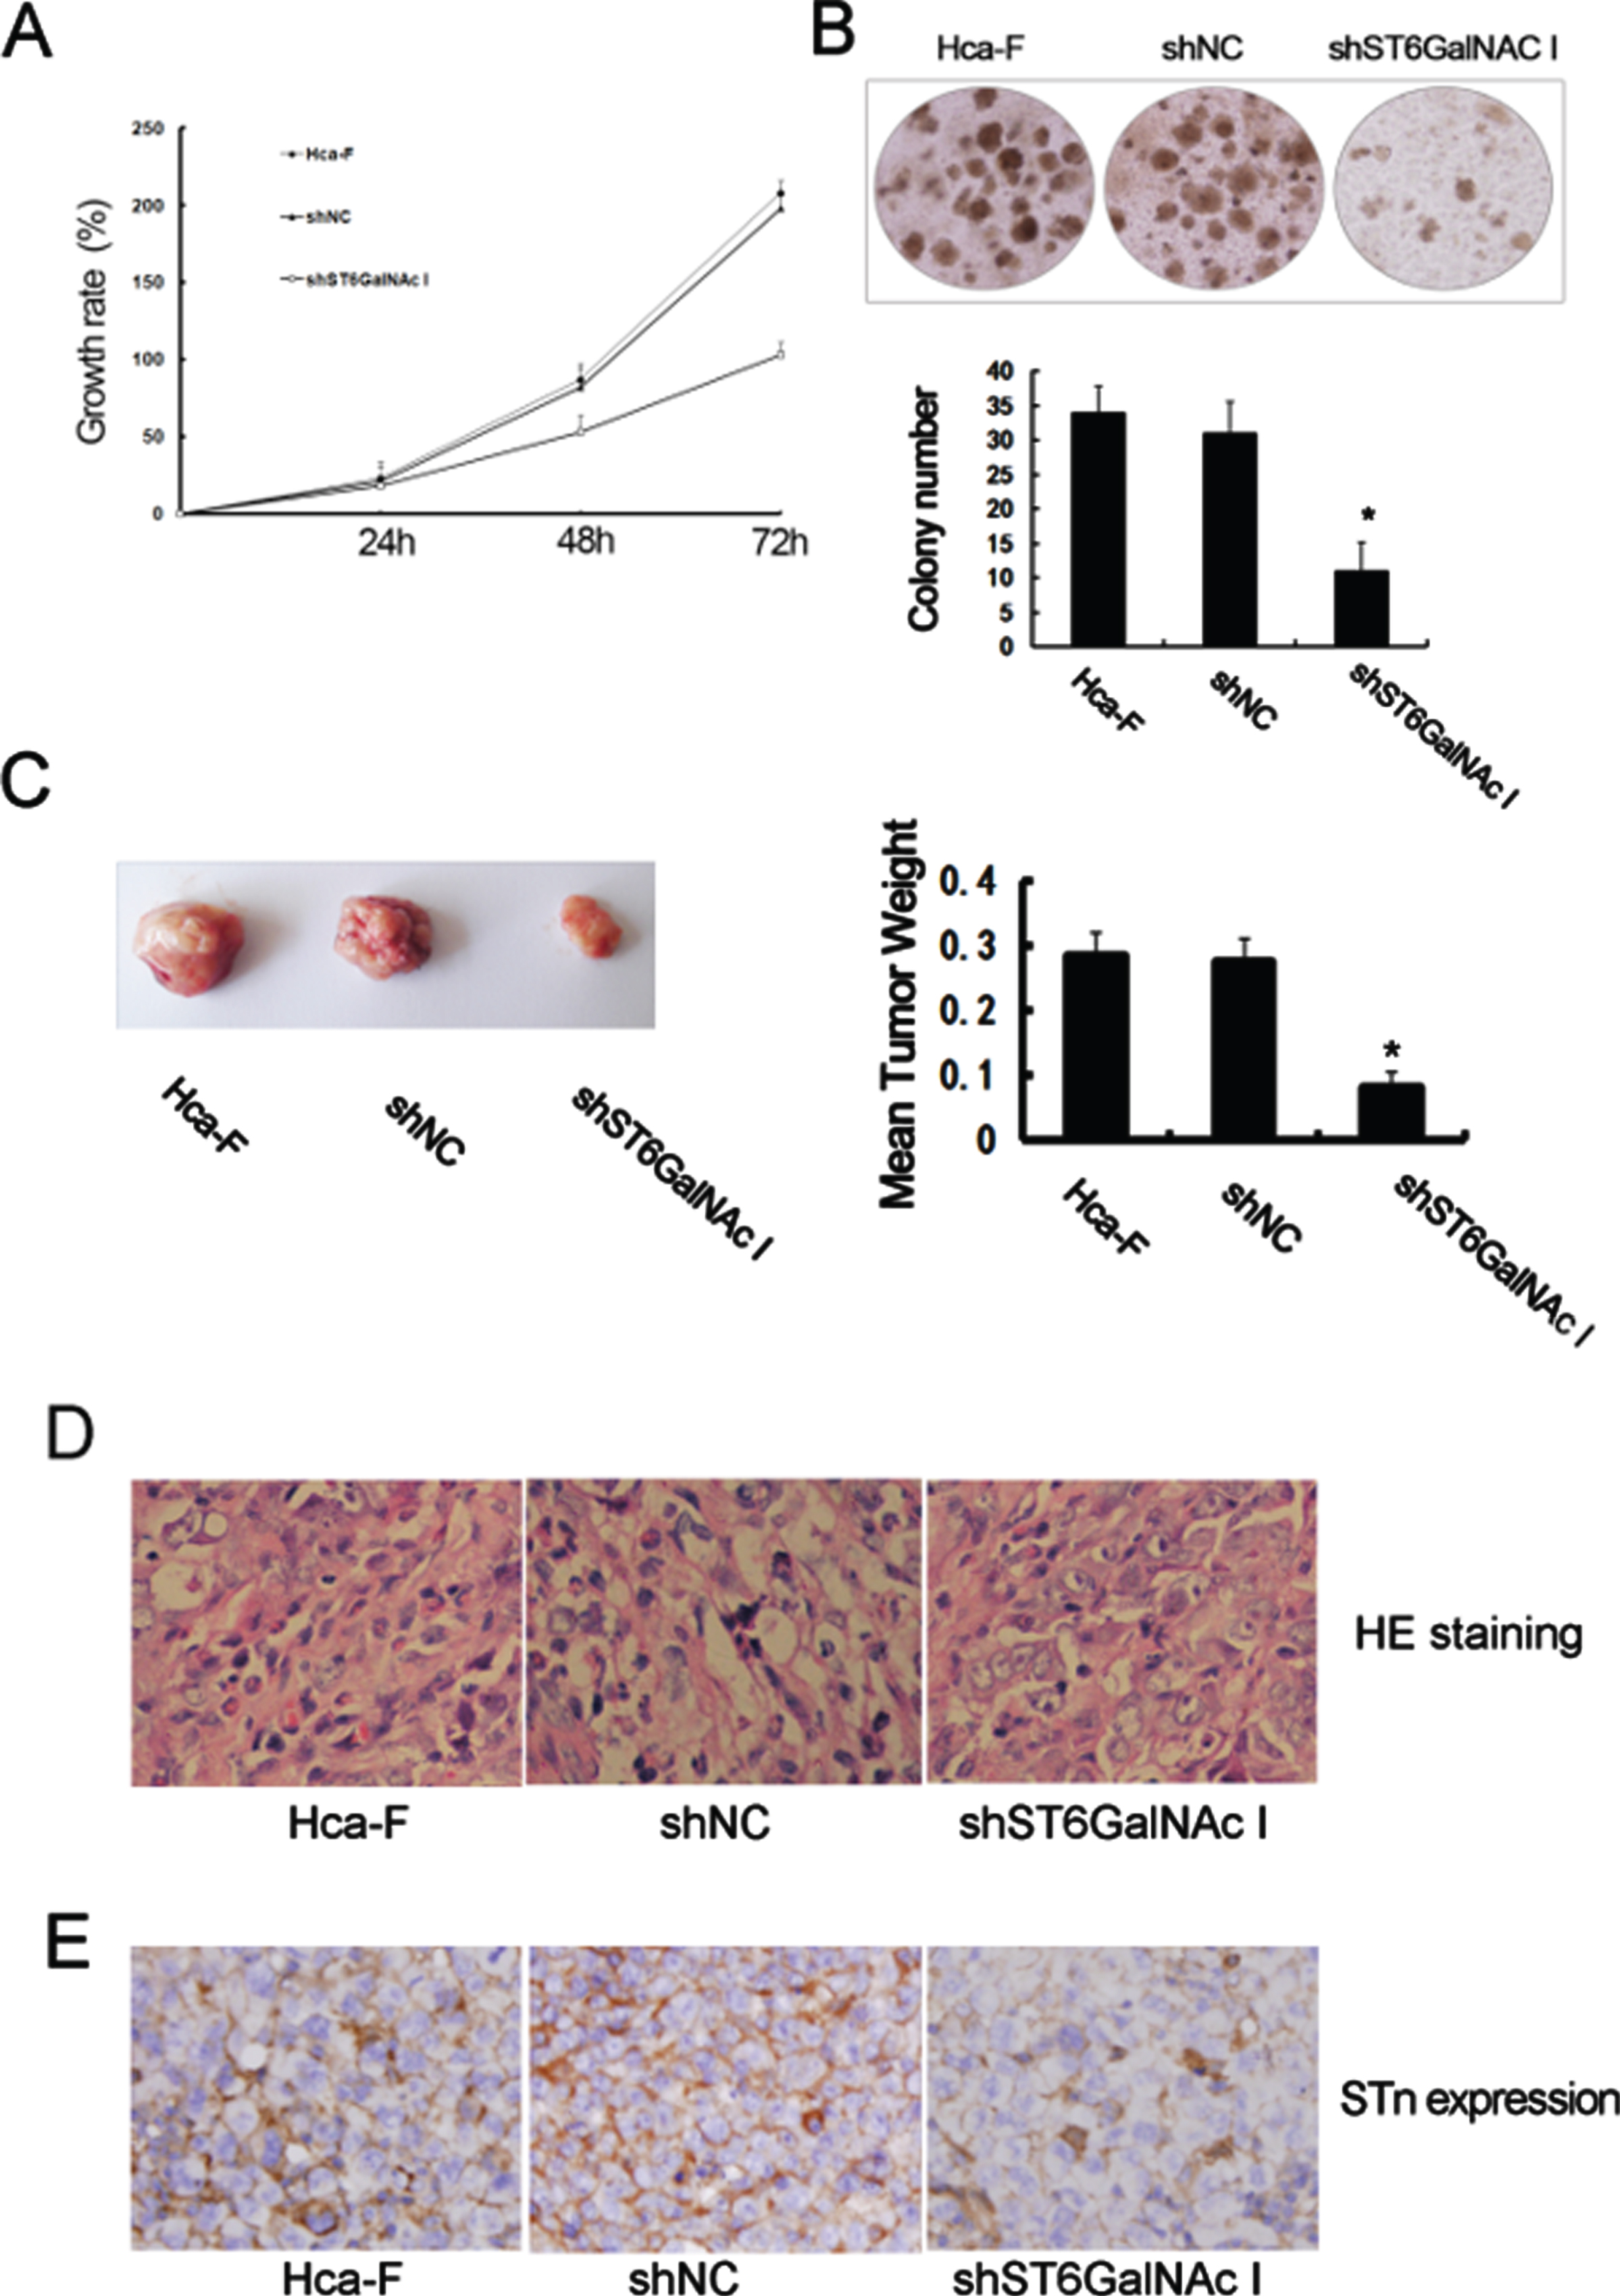
Fig.3
ST6GalNAc I silencing inhibits the proliferation and clonogenicity of Hca-F cells. a Cell proliferation was determined by the CCK8 assay. The numbers of Hca-F, shNC, and shST6GalNAc I cells were counted over a period of 3 days. The results represent mean values from three independent experiments±SD. P < 0.05. b Representative field photograph by colony-forming assay of Hca-F, shNC, and shST6GalNAc I cells (×100). Each value is the mean±standard deviation (SD) of ten different fields (*P < 0.05). c Weight of tumor was compared between Hca-F/shST6GalNAc I and Hca-F cells. Each value is the mean±SD (*P < 0.05). d, e HE staining for tumor tissues and STn expression in tumor tissues were assessed by immunohistochemistry. The data were obtained from three independent experiments.