
MicroRNA-99b-5p targets mTOR/AR axis, induces autophagy and inhibits prostate cancer cell proliferation
Abstract
OBJECTIVES:
MicroRNAs (miRNAs) are the small non-coding regulatory RNA molecules involved in gene regulation via base-pairing with complementary sequences in mRNAs. The dysregulation of specific miRNAs, such as miR-99b-5p (miR-99b), is associated with prostate cancer (PCa) progression. However, the mechanistic role of miR-99b in PCa remains to be determined. In this study, we aimed to investigate the functional and clinical significance of miR-99b in PCa.
STUDY DESIGN:
The expression of miR-99b and its downstream targets mTOR/AR in the PCa samples were analyzed by RT/qPCR. The effects of miR-99b overexpression/inhibition on PCa cell survival/proliferation, spheroid formation, and cell migration were examined by specific assays. Luciferase reporter assays were performed to determine the binding of miR-99b to 3′ untranslated region (UTR) of the mTOR gene. The effects of miR-99b on the expression of mTOR, AR, and PSA proteins, as well as on AKT/mTOR signaling, autophagy, and neuroendocrine differentiation markers were analyzed by western blotting. The expression of miR-99b, mTOR, AR, PSA in AR-negative PC3 and AR-positive LNCaP cells was analyzed by RT/qPCR. The effect of miR-99b on global gene expression in PC3 cells was analyzed by RNA-seq.
RESULTS:
The expression of miR-99b was downregulated in tumor samples from PCa patients, whereas the expression of mTOR and AR was upregulated. In PCa cell lines, overexpression of miR-99b inhibited cell proliferation and cell colony/spheroid formation; induced apoptosis, and increased sensitivity towards docetaxel (DTX). In contrast, inhibition of miR-99b by miR-99b inhibitor resulted in increased cell growth in PCa cells. Mechanistically, miR-99b inhibited the expression of the mammalian target of the rapamycin (mTOR) gene by binding to its 3′ UTR and induced autophagy. Furthermore, miR-99b inhibited androgen receptor (AR) activity in LNCaP cells and induced apoptosis. Activation of AR signaling by dihydrotestosterone (DHT) downregulated miR-99b expression and promoted cell PCa cell growth/survival, whereas inactivation of mTOR by rapamycin or AR by enzalutamide decreased miR-99b mediated PCa cell growth.
CONCLUSION:
Our data suggest that miR-99b functions as a tumor suppressor by targeting the mTOR/AR axis in PCa cells, implicating miR-99b as a novel biomarker and therapeutic target for PCa management.
1Introduction
Prostate cancer (PCa) is the second most commonly occurring cancer in men worldwide and in the United States and according to the American Cancer Society (ACS), over 248,530 cases and 34,130 deaths were estimated in the United States for 2021(https://cancerstatisticscenter.cancer.org/) [1, 2]. PCa displays a health disparity, affecting African American men disproportionally with a mortality rate almost 2.2 times higher compared to white men [3]. PCa incidence increases with age, and the disease may remain asymptomatic (indolent form) in the early stages, making early detection and prevention of progression to aggressive disease more difficult [3]. Aggressive PCa ultimately leads to metastatic disease and causes severe health consequences including death [4, 5].
Therapies based on Androgen Receptor (AR) inhibition such as abiraterone or enzalutamide are initially effective but eventually inherent or acquired resistance to androgen-deprivation therapies develops, a condition termed Castration-Resistant Prostate Cancer (CRPC) [6]. The advancement to CRPC typically results in incurable disease [7]. Identification of key biomarkers is a critical step in detecting and monitoring the progression of aggressive PCa to CRPC [8–10]. Both protein and nucleic acid-based biomarkers such as microRNAs are being sought in blood, serum/plasma, and urine of PCa patients for this purpose [11–14].
MicroRNAs (miRNAs) are a class of small non-coding RNA molecules (19–25 nucleotides) that regulate gene expression via base-pairing with complementary sequences within mRNA molecules, resulting in mRNA degradation or translational inhibition [15]. MiRNAs have been shown to regulate cell proliferation, differentiation, apoptosis, cellular metabolism, and stress pathways [16–18] and have been proposed as diagnostic, prognostic, and risk stratification biomarkers in human cancers [19–21]. In PCa, miRNAs from patient bio-fluids have been identified as potential diagnostic biomarkers [22], including miR-21, miR-125, miR-141, and miR-375, all of which are upregulated in PCa patient serum/plasma and urine, and miR-205 and miR-30c which are downregulated in serum [23]. Low expression of miR-141 has been reported in both xenograft and primary patient tumors as well as in several PCa stem/progenitor cell populations [24]. Enforced expression of miR-141 suppressed PCa stem cell growth and metastasis by targeting Rho GTPase family members (CDC42, CDC42EP3, RAC1, and ARPC5) and stem cell molecules (CD44 and EZH2), suggesting that miR-141 acts as a tumor suppressor in PCa [24].
Previous studies have shown that miR-99b plays a tumor suppressor role in gastric cancer (GC) and overexpression of miR-99b reduced GC cell proliferation and cell cycle progression by targeting insulin-like growth factor 1 receptor (IGF-1R) [25]. Recently Song et al. [26] identified several miRNAs by meta-analysis and showed that 10 miRNAs such as miR-18a, miR-34a, miR-106b, miR-141, miR-182, miR-183, miR-200a/b, miR-301a, and miR-375 were upregulated and 14 miRNAs, miR-1, miR-23b/27b, miR-30c, miR-99b, miR-139-5p, miR-152, miR-187, miR-204, miR-205, miR-224, miR-452, miR-505, and let-7c, were down-regulated in PCa. The study further indicates that the expression and regulation of these miRNAs in PCa can provide good diagnostic tools to discriminate PCa from benign prostatic hyperplasia (BPH) [26]. Similarly, Jalava et al. have identified several miRNAs, such as miR-21, miR-32, miR-99a, miR-99b, miR-148a, miR-221, and miR-950-5p, which were differentially expressed in CRPC compared with BPH, and their microarray data suggest that miR-99a and miR-99b was underexpressed in CRPC samples [27]. Expression of the miR-99 family (miR-99a, miR-99b, and miR-100) is downregulated in PCa tumors and miR-99a potentially targets mTOR/AR signaling to play a role in tumor suppression [28]. Moreover, in our earlier study, we demonstrated that the expression of miR-99b was significantly downregulated in PCa tissues with significantly lower expression in PCa tissues from African American patients when compared to PCa tissue samples from Caucasian American patients [29].
The mechanistic role of miR-99b in PCa remains poorly understood. In the present study, we investigated the role of miR-99b in modulating PCa cell hallmarks such as proliferation, colony-formation, spheroid formation, apoptosis, and sensitivity to anti-cancer drugs. We demonstrate that miR-99b targets mammalian Target of Rapamycin (mTOR), induces autophagy, and inhibits PCa cell growth.
2Materials and methods
2.1Cell culture
Prostate cancer LNCaP, PC3, and DU145 cells were obtained from the Georgetown University Lombardi Comprehensive Cancer Center cell culture repository. Cells were grown in RPMI medium (Invitrogen, Carlsbad, CA) containing 5% fetal bovine serum (FBS; Access Biologicals, Vista, CA), 2 mM glutamine, and 25μg/ml gentamicin (Invitrogen). RWPE1 normal prostate cells were obtained from ATCC and cultured in keratinocyte-serum-free medium (K-SFM) supplemented with 0.05 mg/ml bovine pituitary extract, epidermal growth factor (5 ng/ml), and 1% penicillin/streptomycin. PCa MDA-PCa-2b cells (African American donor) were obtained from ATCC and cultured in F-12K medium supplemented with 5% FBS. All cell lines were grown at 37°C and maintained in a humidified atmosphere containing 5% CO2 at least 24 h and used for experiments after they reached 70–80% confluence.
2.2miRNA transfection
PC3 and LNCaP cells were grown in 6-well plates (1×10⁵ cells/ well) for 24 h before transfection. Cells were transfected with mirVana miRNA, negative control #1 (NC) (Cat # 4464058), mirVana miRNA-99b-5p mimic (CACCCGUAGAACCGACCUUGCG) (Cat # 4464066) and mirVana miRNA-99b-5p inhibitor (miR-99b Inh.) (CACCCGUAGAACCGACCUUGCG) (Cat # 4464084) separately. All mirVana miRNA, negative control, miRNA mimic, and miRNA inhibitor were obtained from Ambion (Austin TX). PCa cells were transfected with 100 nM of negative control (NC) or miR-99b mimic or miR-99b inhibitor using Lipofectamine-2000 reagent (Invitrogen). After transfection for 30 h, cells were harvested and the expression of miR-99b or its targets were analyzed by RT/qPCR or immunoblotting.
2.3RT/qPCR
Total RNAs from RWPE1, PC3, LNCaP, DU145, and MDA-PCa-2b cells were isolated using TRIZOL reagent (Life Technology). In other experiments, PC3 and LNCaP cells were transfected with NC mimic or miR-99b mimic separately for 30 h. Cells were harvested, and total RNAs were isolated using TRIZOL reagent. Equal amounts of RNA (1μg) were reverse transcribed using a High Capacity cDNA Reverse Transcription kit (Applied Biosystems), cDNA was incubated with Power SYBR Green PCR master mix (Applied Biosystems) and mTOR forward primer 5′-ATGCTTGGAACCGGACCTG and reverse primer 5′-TCTTGACTCATCTCTCGGAGTT; AR forward primer 5′-CCAGGGACCATGTTTTGCC and reverse primer 5′-CGAAGACGACAAGATGGACAA; PSA forward primer 5′-CGGAGAGCTGTGTCACCAT and reverse primer 5′GTGGGCAGCTGTGAGGAC and GAPDH forward primer 5′-CCACCCAGAAGACTGTGGAT and reverse primer 5′-GTTGAAGTCAGAGGAGACCACC separately. GAPDH was used as an internal control.
For miR-99b expression analysis, total miRNAs from PCa cells were isolated using the mirVana microRNA Isolation Kit (Thermo Fisher Scientific). Total miRNAs (10 ng) were reverse transcribed using primers specific for miR-99b-5p and RNU44 (Assay ID 000436 and 001094, Applied Biosystems, Carlsbad, CA) and TaqMan Reverse Transcription reagents (Applied Biosystems). Expression of miR-99b and RNU44 was quantified by RT/qPCR using TaqMan PCR master mixture and Taqman expression assay primers. RNU44 expression was used as an internal control. The PCR reactions were run on a QuantStudio-3 PCR system (Applied Biosystems) and relative quantitation was analyzed according to the manufacturer’s protocols.
2.4PCa tumor RNA samples
RNA samples from PCa tissues (n = 17) and benign adjacent normal tissues (n = 17) were obtained from Prostate Cancer Biorepository Network (PCBN), Johns Hopkins University School of Medicine Baltimore MD. RNA samples that contain miRNAs were used for the analysis of miR-99b expression. RNA samples (10 ng) were reverse transcribed using primers specific for miR-99b-5p and RNU44 (Assay ID 000436 and 001094, Applied Biosystems, Carlsbad, CA) and TaqMan Reverse Transcription reagents (Applied Biosystems). Expression of miR-99b and RNU44 was quantified by RT/qPCR as described above.
2.5Western blotting
Western blotting was performed as described previously [30]. Briefly, after transfections or treatments, PCa cells were lysed in cell lysis buffer (Cell Signaling Technology, Danvers, MA) containing a protease inhibitor cocktail (Roche, Indianapolis, IN) and protein concentrations were measured using the Bio-Rad protein assay reagent (Bio-Rad, Hercules, CA). Forty to fifty micrograms of cell lysates were separated on NuPAGE 4–12% Bis-Tris-SDS gels (Invitrogen) and then transferred to a polyvinylidene difluoride (PVDF) membrane (Millipore, Billerica, MA). The membranes were blocked in 1x blocking buffer (Sigma-Aldrich, St. Louis, MO) and incubated with primary antibodies overnight at 4°C. The following antibodies were obtained from Cell Signaling Technology (Danvers, MA): anti-mTOR (Cat # 2983S), anti-pS2448-mTOR (Cat # 2971S), anti-AKT (Cat # 9272S), anti-pS473-AKT (Cat # 3787S), anti-AR (Cat # 5153S), anti-PSA (Cat # 2475S), anti-cleaved-PARP (Cat # 9541S), anti-caspase-3(Cat # 9662S), anti-Beclin1(Cat # 3495S), anti-ATG3(Cat # 3415S), anti-4EBP1(Cat # 9452S), anti-LC3B (Cat # 4108S), anti-GAPDH(Cat # 5174S), anti-β-tubulin (Cat # 2128S), and anti-β-actin (Cat # 4970S) antibodies. Anti-Neuron Specific Enolase (NSE) (Cat # NB110-58870), anti-Chromogranin A (Cat # NBP2-44774), anti-Synaphophysin (Cat # NBP2-25170SS) antibodies were purchased from Novus Biologicals (Littleton, CO, USA) and anti-CD56 (Cat # AF2408) from R&D Systems (Minneapolis, MN). All primary antibodies were used as per the manufacturers’ suggestions. After washing the membranes three times, the membranes were incubated in the appropriate secondary antibody (1:10000 dilution) (Jackson ImmunoResearch, PA) for 1 h at room temperature, and immunoreactive bands were visualized using ECL chemiluminescence detection reagents (Signagen Laboratories, Rockville, MD). The western blots were exposed to X-ray films or developed using Azure C-500 Bio-system.
2.6Cell survival/proliferation assay
PCa PC3 and LNCaP cells (1×10⁴ cells/well) were grown in 96 plates and transfected with NC or different concentrations of miR-99b (25–150 nM) for 48 h. The effect of miR-99b on cell survival was analyzed by MTT (3-(4,5-dimethylthiazol-2-yl)-2,5-diphenyltetrazolium bromide) reagent (MP Biochemicals, Santa Ana, CA). Similarly, cells were also transfected with NC or miR-99b alone or transfected cells were treated with vehicles or docetaxel (DTX; 5 nM), rapamycin (Rapa; 100 ng/ml), enzalutamide (Enz; 10μM), and dihydrotestosterone (DHT; 1–10 nM). After 48 h of transfection and drug treatments, cells were incubated with 5μl/well of MTT reagent (5 mg/ml) for 1 h at 37°C in a cell culture incubator. Cells were washed with PBS, formazan crystals were dissolved in DMSO, and cell survival was quantified by reading the plates at 570 nm using a Fluostar Omega plate reader. In other experiments, cells (1×10⁴) were seeded onto 96-well plates and transfected with NC and miR-99b or miR-99b inhibitor for 48 h. Cell proliferation was measured by adding 10μl of WST-1 reagent according to the manufacturer’s instructions (Roche Applied Science, Indianapolis, IN). Cell proliferation was measured by reading the plates at 450 nm using the Fluostar Omega plate reader (BMG Lab tech, Cary, NC). All experiments were repeated three times.
2.7Cell Colony formation assay
PC3 and LNCaP cells (1×10⁶ cells/well) were grown in a 6-well plate for 18 h and transfected with NC, miR-99b, or miR-99b inhibitor (100 nM). After 24 h of transfection, cells were trypsinized, counted, and live cells (4000 cells/well) were re-plated in 6-well plates in triplicate and allowed to grow for 7–10 days. Cells were washed with PBS, fixed with cold methanol, and stained with 0.1% crystal violet for 1 h. Cells were washed with distilled water and allowed to dry. Cell colony pictures were photographed, counted manually, and plotted.
2.8Cell migration assay
The effect of miR-99b on the migratory ability of PCa PC3 and LNCaP cells was determined by wound healing migration assay as described previously [30, 31]. Cells (1×10⁶ cells/well) were grown in a 6-well plate for 18 h and transfected with NC or miR-99b mimic or miR-99b inhibitor mimic for 24 h. After transfection, a cell monolayer was scraped using a micropipette tip (A0). At 24 h post-wounding (A24), cells were photographed, and the migration gap length was calculated using ImageJ software (https://imagej.nih.gov/ij/). The percent wound closure was calculated using the formula [(A0 – A24)/A0]×100 and plotted.
2.9Luciferase assay
The mTOR-3′UTR-Luciferase construct was obtained from OriGene Technology (SC211383; custom-designed). A 980 bp insert sequence of human mTOR-UTR (NM_004958) was cloned into pMirTarget vector (PS100062). PC3 and LNCaP cells (1×10⁴ cells/well) were transfected with 0.5μg of mTOR-3′UTR-Luciferase construct in 96 wells plates. After 18 h of transfection, cells were transfected with 100 nM of miR-99b and miR-99a wild-type mimics, or miR-99b and miR-99a mutant mimic (custom-designed from Integrated DNA Technologies) or NC mimic separately for an additional 24 h. Transfected cells were washed with PBS and mixed with luciferase substrate (Promega). Plates were covered with aluminum foil to protect from light and incubated at room temperature for 15 min. The plates were read by using a Fluostar Omega plate reader (BMG Lab Tech, Cary, NC) and relative luciferase activity was measured and plotted.
2.10Immunofluorescence
To determine the effect of miR-99b on LC3B mediated autophagy-related puncta formation, PC3 and LNCaP cells (1×10⁵) cells were grown on coverslips in 6-well plates and transfected with LC3B-GFP construct (1μg/well). After 24 h of transfection, cells were further transfected with NC or miR-99b mimic or miR-99b inhibitor for 24 h. After washing with PBS, cells were fixed with paraformaldehyde (4%) for 15 min and after washing with PBS cells were mounted with Vectashield-DAPI mounting medium (Vector Laboratories, Burlingame, CA, Cat # H-1500-10). Slides were observed under a Nikon fluorescence microscope type 120 and images were captured. The LC3B mediated puncta formation was quantified from cells (n = 6) and plotted.
2.11RNA-seq and analysis
PC3 cells were transfected with NC mimic or miR-99b mimic for 24 h and total RNA was isolated using TRIZOL reagents (Sigma) from triplicate samples according to the manufacturer’s instructions and sent to GENEWIZ, LLC. (South Plainfield, NJ, USA) for RNAseq analysis. RNA samples were quantified using Qubit 2.0 Fluorometer (Life Technologies, Carlsbad, CA, USA) and RNA integrity was checked using Agilent TapeStation 4200 (Agilent Technologies, Palo Alto, CA, USA). RNA sequencing libraries were prepared using the NEBNext Ultra RNA Library Prep Kit for Illumina following the manufacturer’s instructions (NEB, Ipswich, MA, USA). Genes with adjusted p-values < 0.05 and absolute log2 fold changes > 1 were called differentially expressed genes for each comparison. A gene ontology analysis was performed on the statistically significant set of genes by implementing the software GeneSCF. The goa_human GO list was used to cluster the set of genes based on their biological processes and determine their statistical significance. A PCA analysis was performed using the “plotPCA” function within the DESeq2 R package. The plot shows the samples in a 2D plane spanned by their first two principal components. The top 500 genes, selected by highest row variance, were used to generate the plot. The RNA-seq array data were submitted to Array Express with accession number E-MTAB-10350.
2.12Statistical analysis
Results from duplicate or triplicate independent experiments are presented as mean±SEM. Differences between groups were analyzed using a two-tailed Student’s t-test. A P value of < 0.05 was considered statistically significant. Statistical significance was determined by Graph Pad Prism 9 software (GraphPad Software Inc., La Jolla, CA).
3Results
3.1Expression of miR-99b in PCa
Fig. 1
miR-99b regulates mTOR/AR signaling in PCa cells (A) miR-99b expression in PCa tumor tissues (n = 17) and their adjacent normal tissues (n = 17) was analyzed by RT/qPCR. **P < 0.01 compared to normal tissues. (B & C) Expression of mTOR, AR, and PSA in PCa tumor samples and normal PCa tissues was analyzed by RT/qPCR. *P < 0.05 compared to adjacent normal tissues. ns- not significant. (D) Endogenous miR-99b expression in normal prostate RWPE1 cells and PCa PC3, LNCaP, DU145, and MDA-PCa-2b cells was determined by RT/qPCR. ***P < 0.001 compared to normal RWPE1 cells. (E) Endogenous mTOR expression from normal RWPE1 and PCa PC3, LNCaP, DU145, and MDA-PCa-2b cells was determined by immunoblotting. Fifty micrograms of lysates from normal and PCa cells were immunoblotted with anti-mTOR and anti-β-tubulin antibodies. (F) PC3 and LNCaP cells were transfected with NC (negative control) mimic or miR-99b mimic for 24 h and the expression of miR-99b was analyzed by RT/qPCR. ***P < 0.001, ###P < 0.001 compared to NC transfected cells. (G) Expression of mTOR mRNA after transfection of PC3 and LNCaP cells with NC and miR-99b mimic was analyzed by RT/qPCR. ***P < 0.001, ##P < 0.01 compared to NC transfected cells. (H) PC3 and LNCaP cells were transfected with NC, miR-99b mimic, and miR-99b inhibitor for 24 h, and cell lysates were immunoblotted with anti-mTOR, anti-phosphorylated serine-2448-mTOR (p-mTOR), anti-AR, anti-PSA, and anti-GAPDH antibodies. The band intensities were quantified using ImageJ software (https://imagej.nih.gov/ij/) and presented.
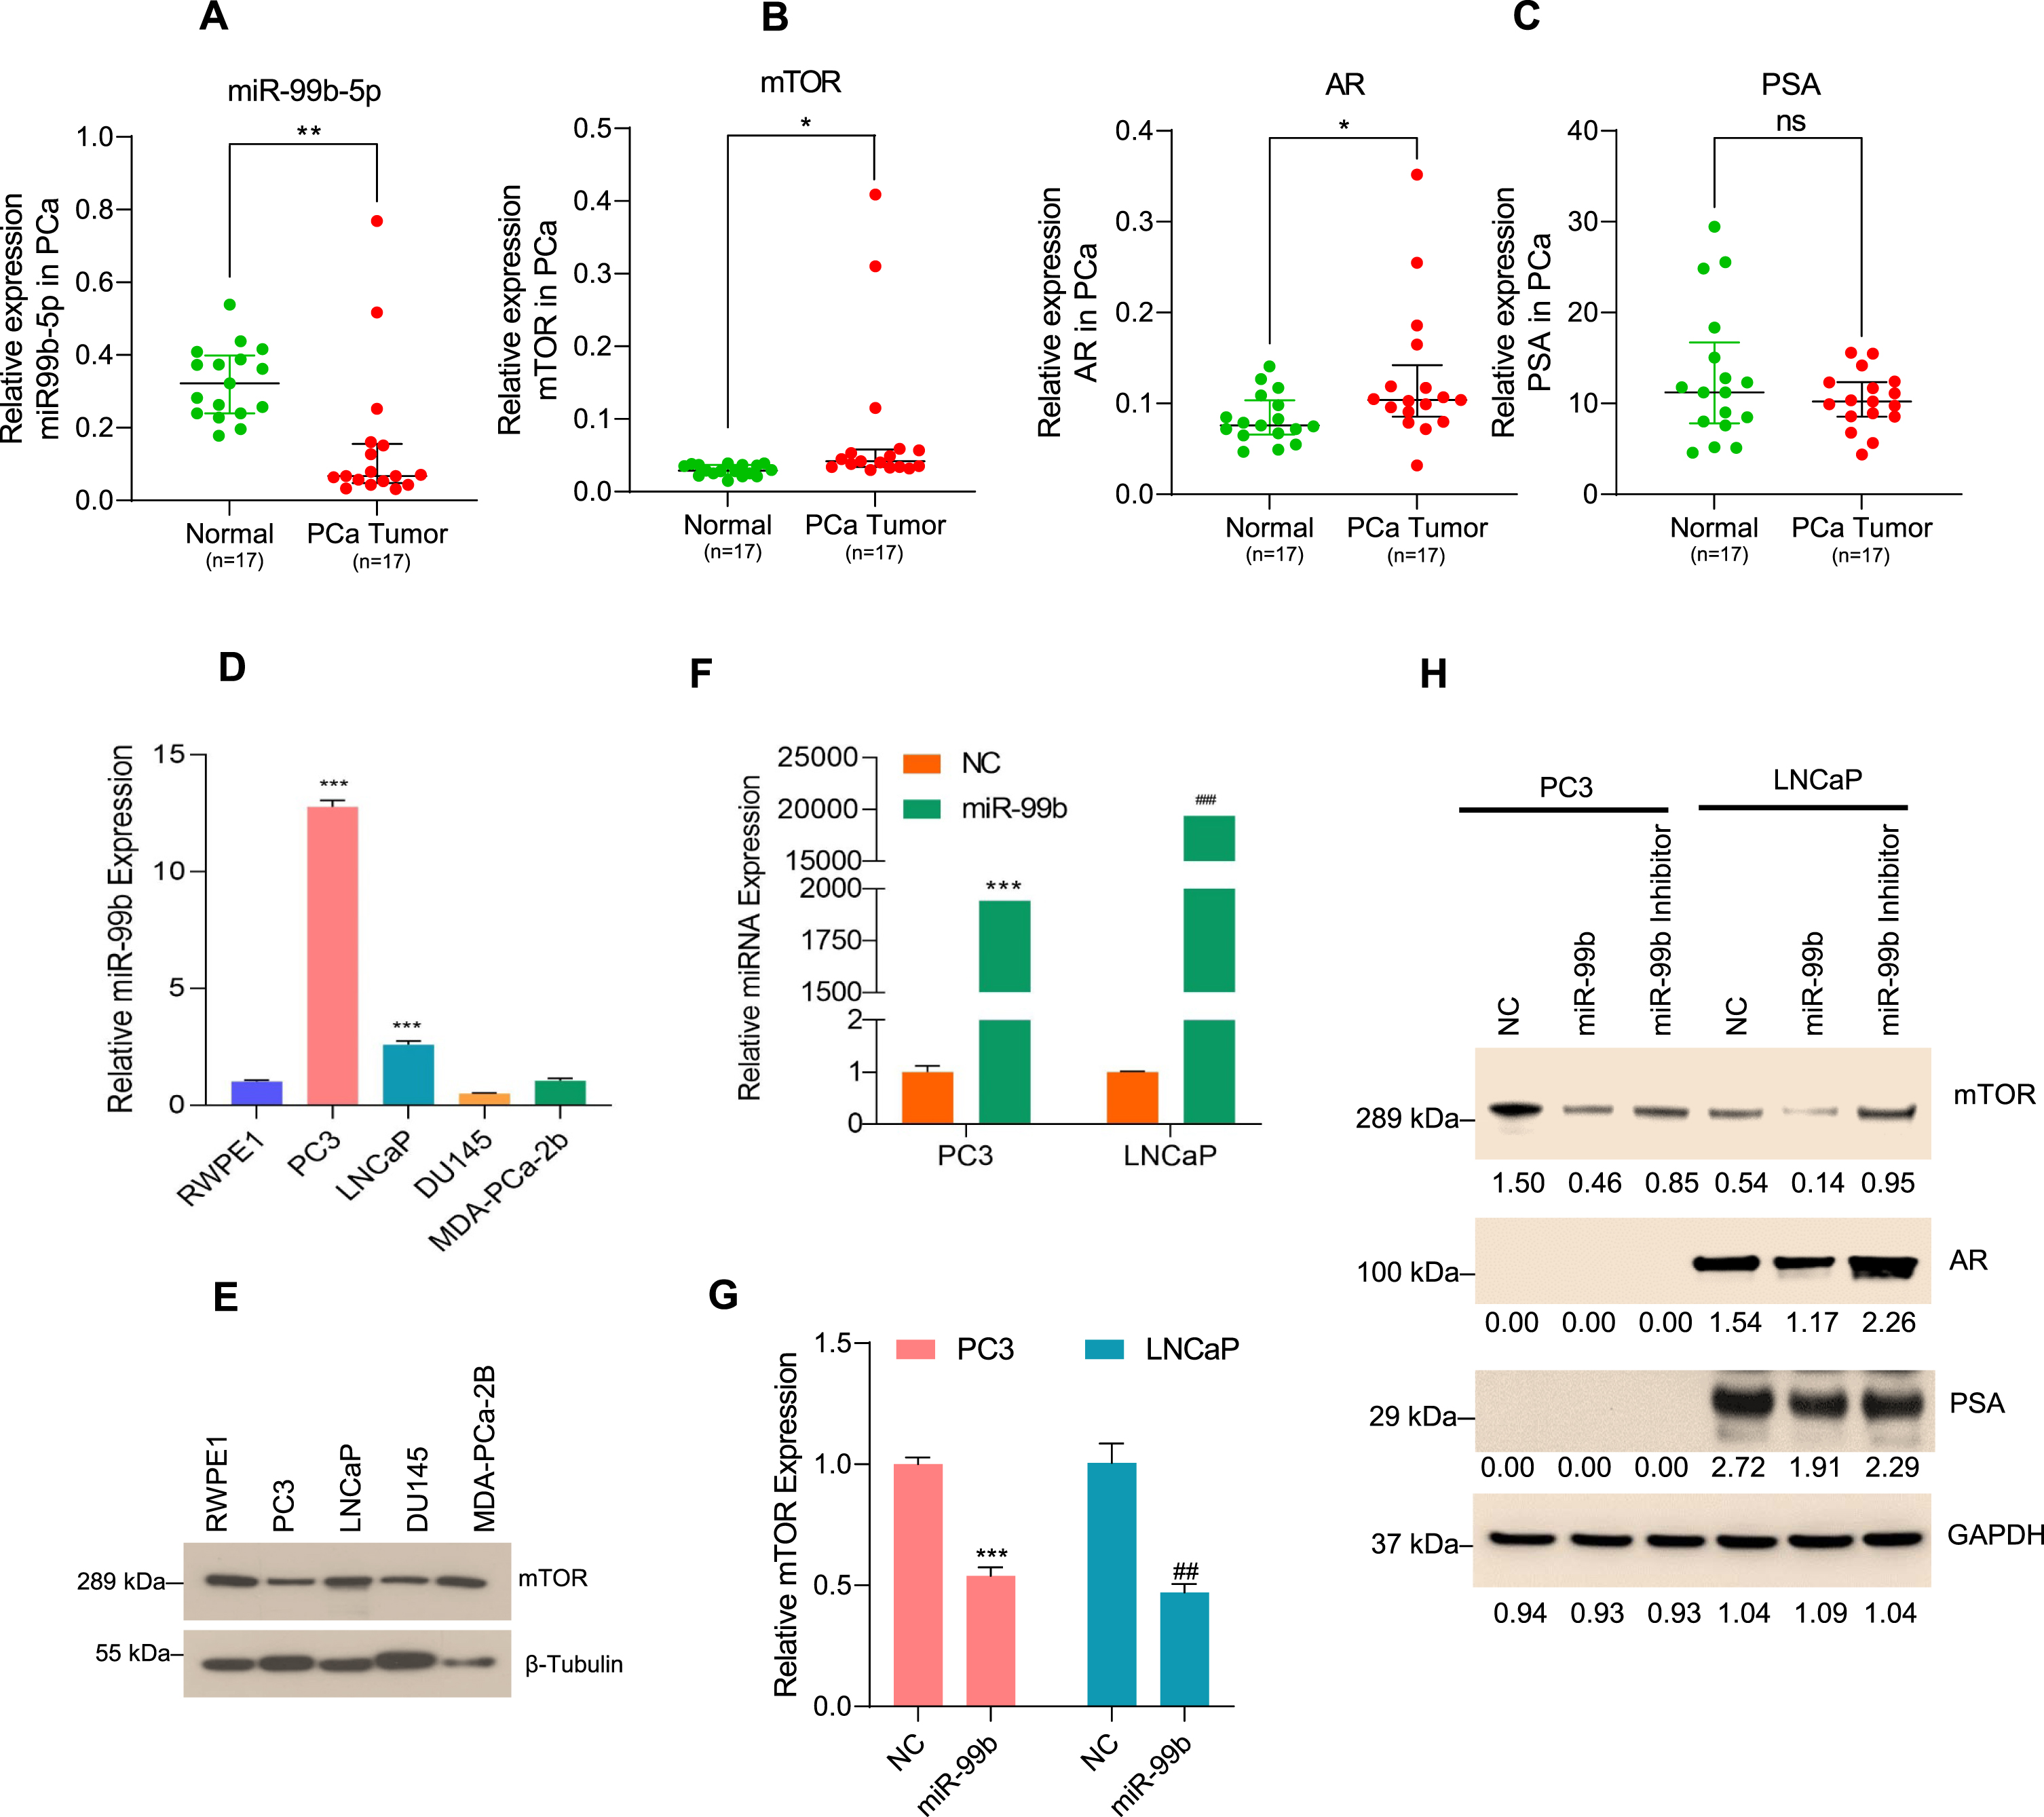
In earlier studies, we and others have demonstrated that miR-99b is significantly downregulated in PCa tumor tissues compared with their adjacent non-tumor tissues [28, 29]. We have recently analyzed the expression of miR-99b-5p and miR-99b-3p in prostate adenocarcinoma (PRAD) as reported in The Cancer Genome Atlas (TCGA) data set and as presented by MIR-TV (http://mirtv.ibms.sinica.edu.tw/analysis.php; access date 10 September 2021) (Supplementary Fig. S1). TCGA-PRAD data analysis revealed that a slight upregulation of miR-99b-5p expression (p = 0.047) in PRAD tumors (n = 494) compared with normal (n = 52), however, a significant downregulation of miR-99b-3p is reported in PRAD tumors (Supplementary Fig. S1A). Moreover, miR-99a-5p expression is not significantly changed between PRAD tumors (n = 494) compared with normal PCa tissues (n = 52), and significant upregulation of miR-99a-3p was reported (p = 0.0001) in PRAD tumors compared with normal prostate samples (Supplementary Fig. S1B).
Since the TCGA data set and earlier studies suggest the dysregulation of miR-99b expression in PCa tissues, to clarify the expression of miR-99b, we now extend these studies using RT/qPCR to further quantify the expression levels of miR-99b in prostate cancer patient tissues and adjacent benign normal/control tissues. Our data show that the expression of miR-99b is significantly downregulated in PCa tissues (n = 17) compared with normal tissues (n = 17) (p < 0.01) (Fig. 1A). Our RT/qPCR data indicated that in the same PCa tissues where there was downregulation of miR-99b, there was also increased expression of mTOR (p < 0.05), AR (p < 0.05), and AR downstream PSA gene compared with adjacent normal tissues (Fig. 1B & Fig. 1C left and right panels) suggesting that miR-99b regulates the expression of mTOR and AR expression and AR target genes such as PSA in PCa tissues.
To investigate the role of miR-99b in the regulation of mTOR and AR/PSA expression, we first analyzed the expression of miR-99b in RWPE1 cells (derived from normal prostate tissue) versus PCa cell lines PC3 and DU145 (AR-negative) and LNCaP and MDA-PCa-2b (AR-positive) (Fig. 1D). RT/qPCR data indicated that the expression of miR-99b is higher in PC3 cells (∼12.5 fold) and LNCaP cells (∼2.23 fold) compared with RWPE1 cells (Fig. 1D). No significant differences in miR-99b expressions were observed in DU145 and MDA-PCa-2b cells compared with RWPE1. Since miR-99b targets mTOR mRNA as reported earlier [28], we also evaluated the relationship between miR-99b expression and mTOR protein expression in PCa cell lines. Immunoblotting data demonstrated that in PC3 cells, where miR-99b expression was highest, the expression of mTOR protein was lower compared with other cell lines, indicating that the endogenous higher expression of miR-99b is inversely associated with the expression of mTOR (Fig. 1E). In addition, the lower expression on miR-99b in LNCaP cells were correlated with upregulation of mTOR protein expression (Fig. 1D &E).
To further investigate the role of miR-99b in mTOR regulation, we overexpressed miR-99b in PC3 and LNCaP cells (Fig. 1F). Overexpression of miR-99b resulted in significantly decreased mTOR mRNA expression in both cell lines compared with the negative control (NC) transfected PC3 and LNCaP cells (Fig. 1G). Immunoblotting data showed that overexpression of miR-99b in PC3 and LNCaP cells downregulated total mTOR protein expression including the activated form of phosphorylated serine-2448 mTOR (pS2448-mTOR) in both cell lines. We also assessed the impact of miR-99b overexpression on AR expression and AR downstream PSA protein expression by immunoblotting. Overexpression of miR-99b inhibited AR expression and AR downstream PSA protein expression in LNCaP cells (Fig. 1H). In contrast, transfection of miR-99b inhibitor inactivated endogenous miR-99b that activates pS2448-mTOR and increased mTOR levels in both cell lines, and AR/PSA levels in LNCaP cells (Fig. 1H). Collectively the data suggest that miR-99b controls mTOR and AR expression in PCa cells.
3.2miR-99b inhibits PCa cell proliferation/migration and increases sensitivity towards docetaxel (DTX) by inducing cell apoptosis
To investigate the effect of miR-99b in PCa cell proliferation, we transfected PC3 and LNCaP cells with NC or miR-99b mimic (three different concentrations) for 48 h and analyzed the effects on PCa cell proliferation by WST-1 assay (Fig. 2A). A dose-dependent expression of miR-99b in PC3 and LNCaP cells decreased cell proliferation (∼50%) compared with NC transfected cells (Fig. 2A). Also, overexpression of miR-99b significantly decreased cell survival activity (MTT assay) in PC3 (32 %) and LNCaP (22%) cells compared with NC transfected cells (Fig. 2B). In addition, the inactivation of miR-99b by miR-99b inhibitor restored PCa cell survival (Fig. 2B). We next analyzed the effect of miR-99b mimic and miR-99b inhibitor on cell colony formation (Fig. 2C). Overexpression of miR-99b in PC3 and LNCaP cells decreased (∼55%) cell colony formation ability compared with NC transfected cells and inactivation of miR-99b by miR-99b inhibitor restored PCa cell colony-forming ability (Fig. 2C, left and right panels). To test the effect of miR-99b on PCa cell migration, we performed a wound-healing assay (Fig. 2D). Overexpression of miR-99b significantly decreased cell migration compared with NC transfected PCa cells and inactivation of miR-99b restored cell migration (Fig. 2D, left and right panels). Overexpression of miR-99b also significantly decreased PCa cell spheroid formation in vitro (Fig. 2E, left and right panels). Finally, we analyzed the effect of miR-99b on cell apoptosis. PCa cells were transfected with two concentrations of miR-99b, and lysates were immunoblotted with apoptotic markers (Caspase 3 and Cleaved-PARP). The immunoblotting data demonstrated that expression of miR-99b decreased mTOR expression as expected and induced cleaved caspase 3 expression in PC3 cells and cleaved-PARP expression in LNCaP cells, suggesting that miR-99b induces cell apoptosis and inhibits cell proliferation (Fig. 2F).
Fig. 2
miR-99b inhibits PCa cell survival by inducing cell apoptosis. (A) PC3 and LNCaP cells were transfected with NC (150 nM) or increasing concentrations of miR-99b mimic as indicated for 48 h. The effect of miR-99b on PCa cell proliferation was determined by WST1 assay as described in the materials and methods section. ***P < 0.001, ###P < 0.001 compared to NC transfected cells. (B) PC3 and LNCaP cells were transfected with NC or miR-99b mimic or miR-99b inhibitor for 48 h and PCa cell survival was determined by MTT assay as described in the materials and methods section. ***P < 0.001, ###P < 0.001 compared to NC or miR-99b inhibitor transfected cells. (C) The effect of miR-99b mimic and miR-99b inhibitor on PCa cell colony formation was analyzed as described in the materials and methods section. The number of colonies was quantified and plotted (right panel). ***P < 0.001, ###P < 0.001 compared to NC or miR-99b inhibitor transfected cells. (D) The effect of miR-99b mimic and miR-99b inhibitor on PCa cell migration was analyzed by wound-healing assay. The percentages of wound closure were determined by ImageJ software and plotted. Representative images of the wound healing assay (left panels) and the calculated scratch area (right panels) are shown. **P < 0.01 compared to NC transfected cells. ns-not significant. (E) PC3 and LNCaP cells were transfected with NC or miR-99b mimic for 24 h, transfected cells were trypsinized, counted and cells (1×10³) were further grown in ultra-low attachment surface 96 well plate (Corning) for 72 h and cell spheroid formation was monitored, and images were captured under a light microscope using 4X objective. The effect of miR-99b on PCa cell spheroid formation was analyzed (left panels) and the spheroid area (n = 6) was calculated using ImageJ software (https://imagej.nih.gov/ij/) and plotted (right panels). ***P < 0.001, ##P < 0.01 compared to NC transfected cells. (F) PC3 and LNCaP cells were transfected with NC or miR-99b as indicated for 48 h and the expression of mTOR and apoptotic markers were analyzed by immunoblotting. (G) PC3 and LNCaP cells were transfected with NC or miR-99b alone or in combination with DTX (5 nM) as indicated for 48 h and PCa cell survival was determined by MTT assay (left and right panels). ***P < 0.001, ###P < 0.001, $$$ P < 0.001 compared to the untreated, NC and NC transfected and DTX treated cells respectively
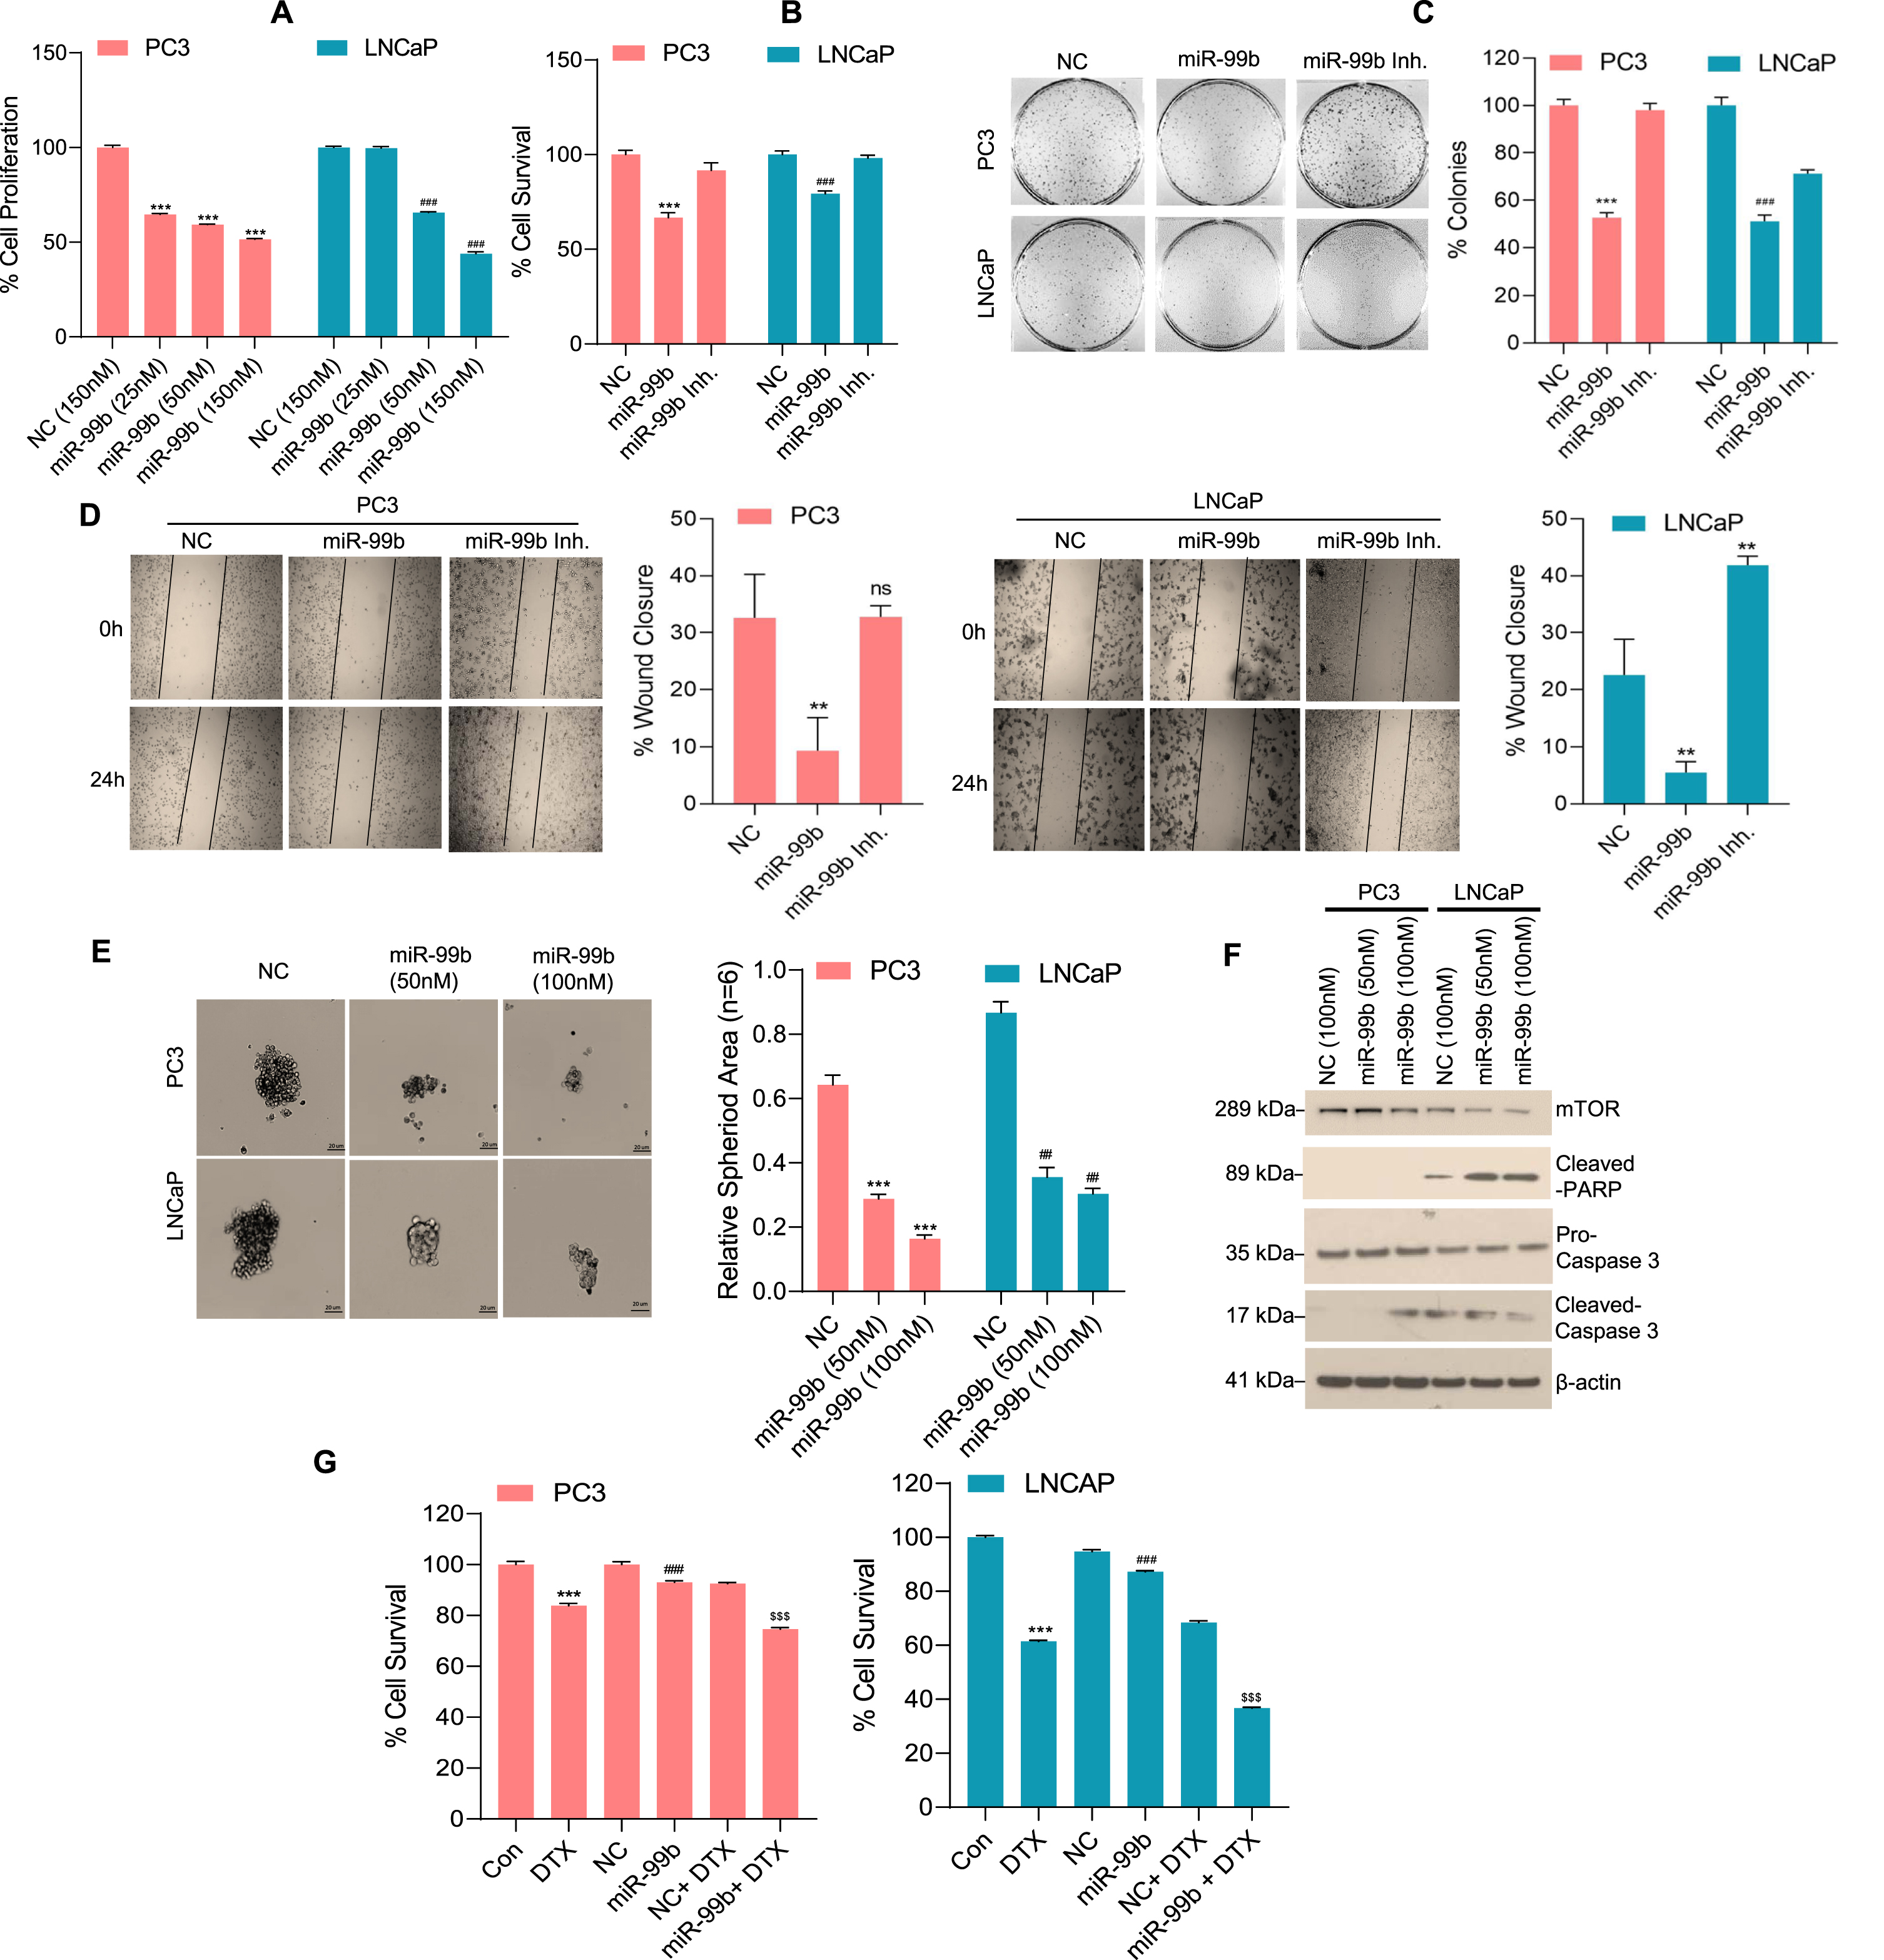
We analyzed the sensitivity of PCa cell lines PC3 and LNCaP towards the anti-PCa drug docetaxel (DTX) after transfection of miR-99b. DTX-resistance is a major challenge in PCa treatment and the mechanism of the resistance is not fully understood, however, a previous study demonstrated that PC3 cells show significantly more resistance to DTX compared with LNCaP or DU145 cells [32]. DTX treatment reduced cell survival in PC3 and LNCaP cells and LNCaP cells showed significantly higher susceptibility towards DTX as expected (Fig. 2G, left and right panels). Expression of miR-99b and DTX treatment significantly decreased cell survival compared with NC transfected and DTX treated PCa cells suggesting that overexpression of miR-99b increased sensitivity of PC3 and LNCaP cells towards the anti-PCa drug DTX (Fig. 2G, left and right panels). Collectively our data suggest that miR-99b inhibits PCa cell proliferation/spheroid formation, cell migration, and increases sensitivity to DTX by inducing cell apoptosis.
3.3miR-99b targets the mTOR-3′UTR and inhibits mTOR expression
Earlier reports suggest that miR-99b targets the 3′-UTR of mTOR gene in PCa cells and pancreatic cancer cells [28, 33]. Here we further analyzed the effect of miR-99a and miR-99b on mTOR activity through their binding with the 3′-UTR of the mTOR gene. We used TargetScan, an online software tool (http://www.targetscan.org/vert_72/: accessed November 28, 2020), to identify possible 3′-UTR-mTOR binding miRNAs. As predicted, TargetScan analysis revealed that miR-99a-5p (miR-99a) and miR-99b-5p (miR-99b) bind with the 3′ UTR of the mTOR gene (295–301) (Fig. 3A). Since both miR-99a and miR-99b show identical and conserved sequences that interact with 3′-UTR of the mTOR gene, we performed an mTOR-3′UTR luciferase reporter assay (Fig. 3B). PC3 and LNCaP cells were co-transfected with an mTOR-3′UTR-Luc plasmid for 18 h and then cells were transfected with NC and miR-99a and miR-99b mimic or mutant miR-99a or miR-99b mimic for 30 h and luciferase activity was quantified. Luciferase assay results demonstrated that, compared with negative control (NC) or mutant miR-99a and miR-99b, miR-99a and miR-99b mimics both significantly inhibited mTOR-3′UTR luciferase activity and the miR-99b mimic inhibited luciferase activity more effectively than miR-99a (Fig. 3B, left and right panels).
Fig. 3
miR-99b targets the 3′UTR of mTOR and inhibits mTOR expression. (A) The binding site of miR-99b and miR-99a in the 3′UTR of mTOR gene was analyzed by TargetScan (http://www.targetscan.org/vert_72/) and presented. We also generated a wild type and mutated nucleotides of miR-99b and miR-99a that bind with mTOR-3′UTR of the mTOR gene. The sequences of wild-type-miR-99b, wild-type-miR-99a, mutant-miR-99b and mutant-miR-99a custom-designed miRNAs are shown. (B) Luciferase reporter assay: PCa PC3 and LNCaP cells were transfected with mTOR-3′UTR-Luciferase reporter construct (0.5μg DNA) for 18 h and then cells were transfected with NC mimic or wild-type-miR-99b and miR-99a mimics or mutant-miR-99b and miR-99a mimic for an additional 24 h. Transfected cells were lysed, and luciferase activity was measured. Results are representative of three independent experiments. **P < 0.01, ***P < 0.001 compared with NC mimic. ns-not significant. (C & D) PCa cells were transfected with NC or miR-99a or miR-99b mimic for 30 h and the effect of NC or miR-99a or miR-99b mimic on mTOR, AR, and PSA expression was analyzed by RT/qPCR. *P < 0.05, ** P < 0.01, ***P < 0.001, #P < 0.05, ##P < 0.01, $$$ P < 0.001 compared with NC-transfected PC3 and LNCaP cells. (E) PC3 and LNCaP cells were transfected with NC mimic or miR-99a and miR-99b mimic for 30 h and expression of endogenous mTOR, AR, and PSA proteins were analyzed by western blotting. The band intensities were quantified using ImageJ software (https://imagej.nih.gov/ij/) and presented.
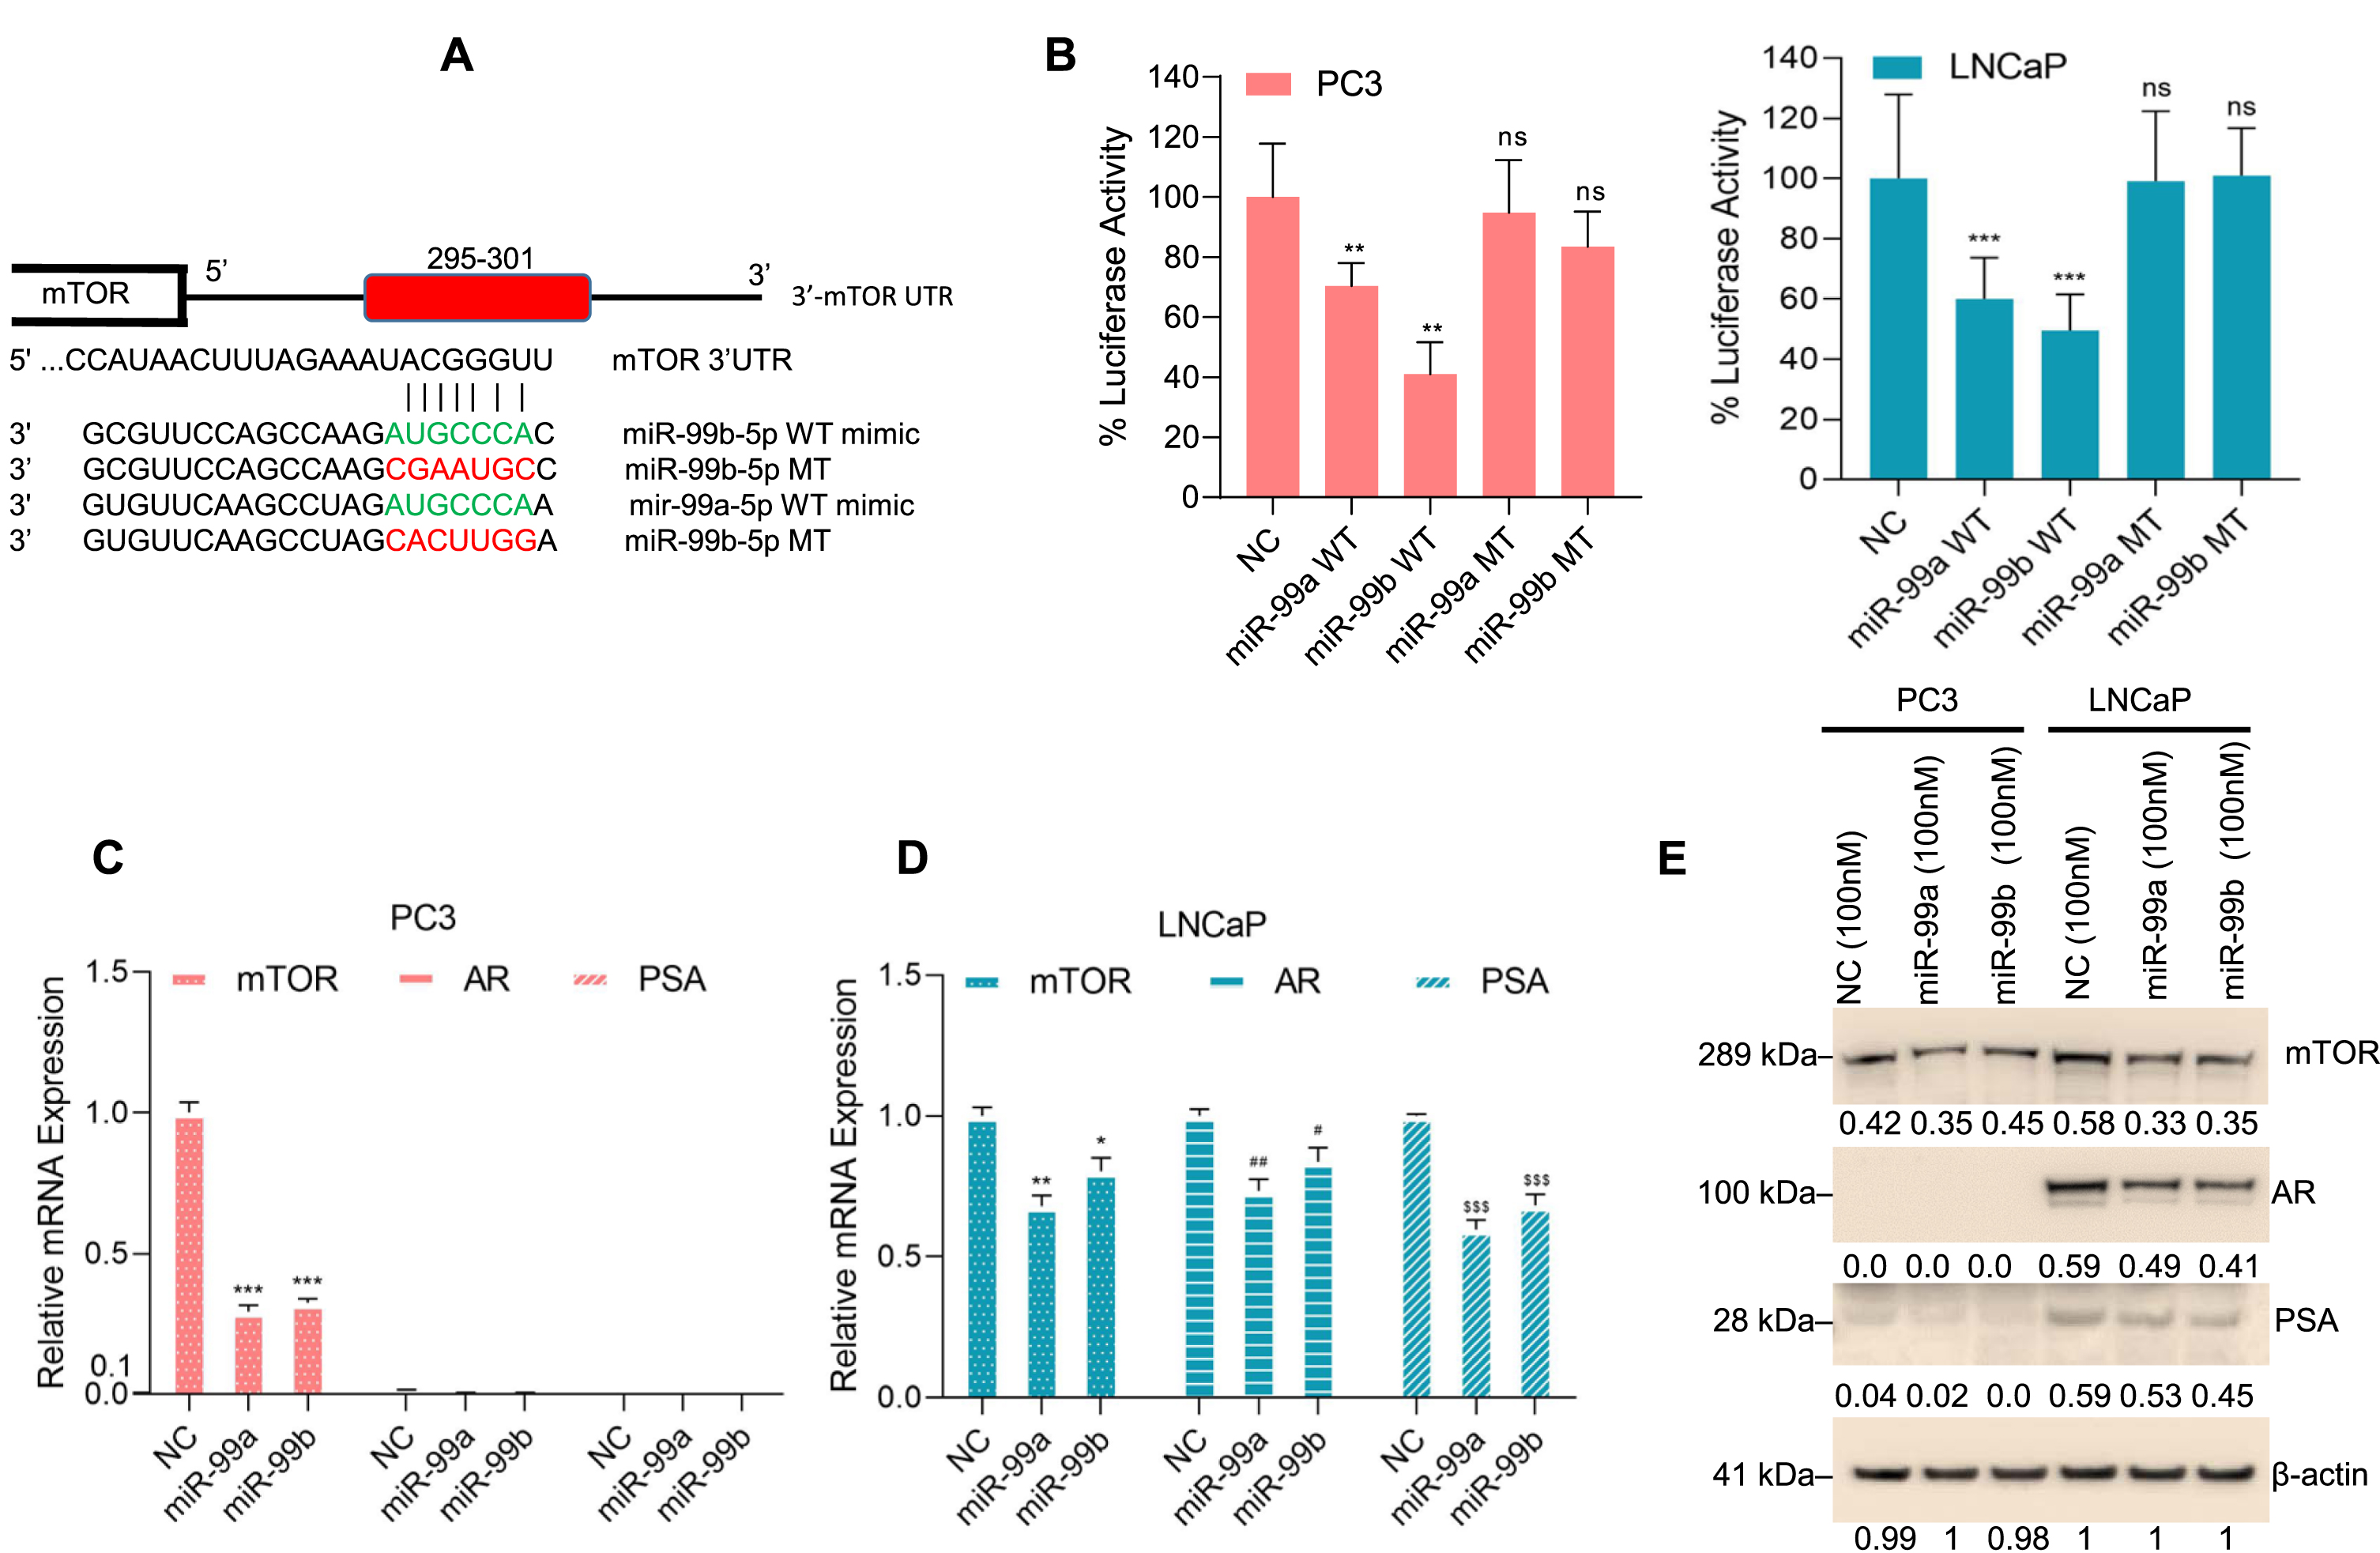
We next analyzed the effect of miR-99a and miR-99b on mTOR expression. RT/qPCR data showed that both miR-99a and miR-99b overexpression downregulated mTOR expression in PC3 and LNCaP cells and downregulated AR and PSA expression in LNCaP cells (Fig. 3C & D). In addition, we analyzed the effect of miR-99a and miR-99b on mTOR, AR, and PSA protein expression in PC3 and LNCaP cells (Fig. 3E). Immunoblotting data showed that overexpression of miR-99a or miR-99b decreased mTOR expression in both PC3 and LNCaP cells and AR and PSA expression in LNCaP cells as expected (Fig. 3E), suggesting that miR-99a or miR-99b targets the mTOR-3′UTR and inhibits mTOR protein expression. However, the mechanistic role of miR-99a and miR-99b on the downregulation of AR and its downstream PSA is unknown and needs further investigation.
3.4miR-99b inactivates mTOR, induces autophagy and cell death in PCa cells
First, to determine the impact of miR-99b on global gene expression in PCa cells, we transiently overexpressed miR-99b in PC3 cells (Supplementary figure 2A), and the effect of miR-99b on global gene expression was analyzed by RNA-seq. RNA-seq heat maps and volcano plots of differential gene expression, and gene ontology analysis revealed that overexpression of miR-99b in PC3 cells modulated global gene expression pathways that are involved in PCa cell signaling, cell proliferation, angiogenesis, and drug-response pathways (Supplementary figure 2B-D). We next specifically analyzed the impact of miR-99b on mTOR signaling and related gene expression (Fig. 4A). The RNA-seq data indicated that overexpression of miR-99b downregulated mTOR expression as expected, downregulated the mTOR complex regulatory genes DEPTOR and RHEB, and upregulated ULK1 expression. Moreover, miR-99b downregulated mTOR downstream genes including RPS6KA1, RPS6KL1, RPS6KA5, and upregulated HIF1A-AS2, HIF1AN, and GRB10 genes which are directly or indirectly involved in the cellular autophagic process (Fig. 4A).
Fig. 4
miR-99b targets mTOR and induces cellular autophagy in PCa cells. (A) RNA-Seq analysis: PC3 cells were transfected with NC mimic or miR-99b mimic for 30 h and the effect of miR-99b on differential global gene expression was analyzed as described in the materials and methods section. Effect of overexpression of miR-99b on the relative expression of mTOR complex 1 (mTORC1) and mTOR complex 2 (mTORC2) and autophagy-related gene expression was presented. *P < 0.05, ** P < 0.01, ***P < 0.001 compared with NC-transfected cells. (B) Effect of miR-99b and miR-99b inhibitor on mTOR and autophagy-related markers (Beclin1, ATG3, 4EBP1, and LC3B) expression was analyzed by western blotting. (C) Effect of miR-99b and miR-99b inhibitor on LC3B mediated puncta formation in PC3 and LNCaP cells were analyzed by immunofluorescence (left panel) and the number of LC3B mediated puncta formation was quantified and plotted (right panel). *** P < 0.001 compared with NC or miR-99b inhibitor transfected PC3 cells. #P < 0.01, ###P < 0.001 compared with NC or miR-99b inhibitor transfected LNCaP cells. (D, E & F) Effects of rapamycin and miR-99b on AKT/mTOR signaling and autophagy-related marker expression, AR signaling, and apoptotic markers were analyzed by immunoblotting. (G) Effects of rapamycin, miR-99b, and rapamycin plus miR-99b on PCa cell survival were analyzed by MTT assay. *P < 0.05, ** P < 0.01, ***P < 0.001 compared with NC-transfected PC3 cells. ##P < 0.01, ###P < 0.001 compared with NC-transfected LNCaP cells.
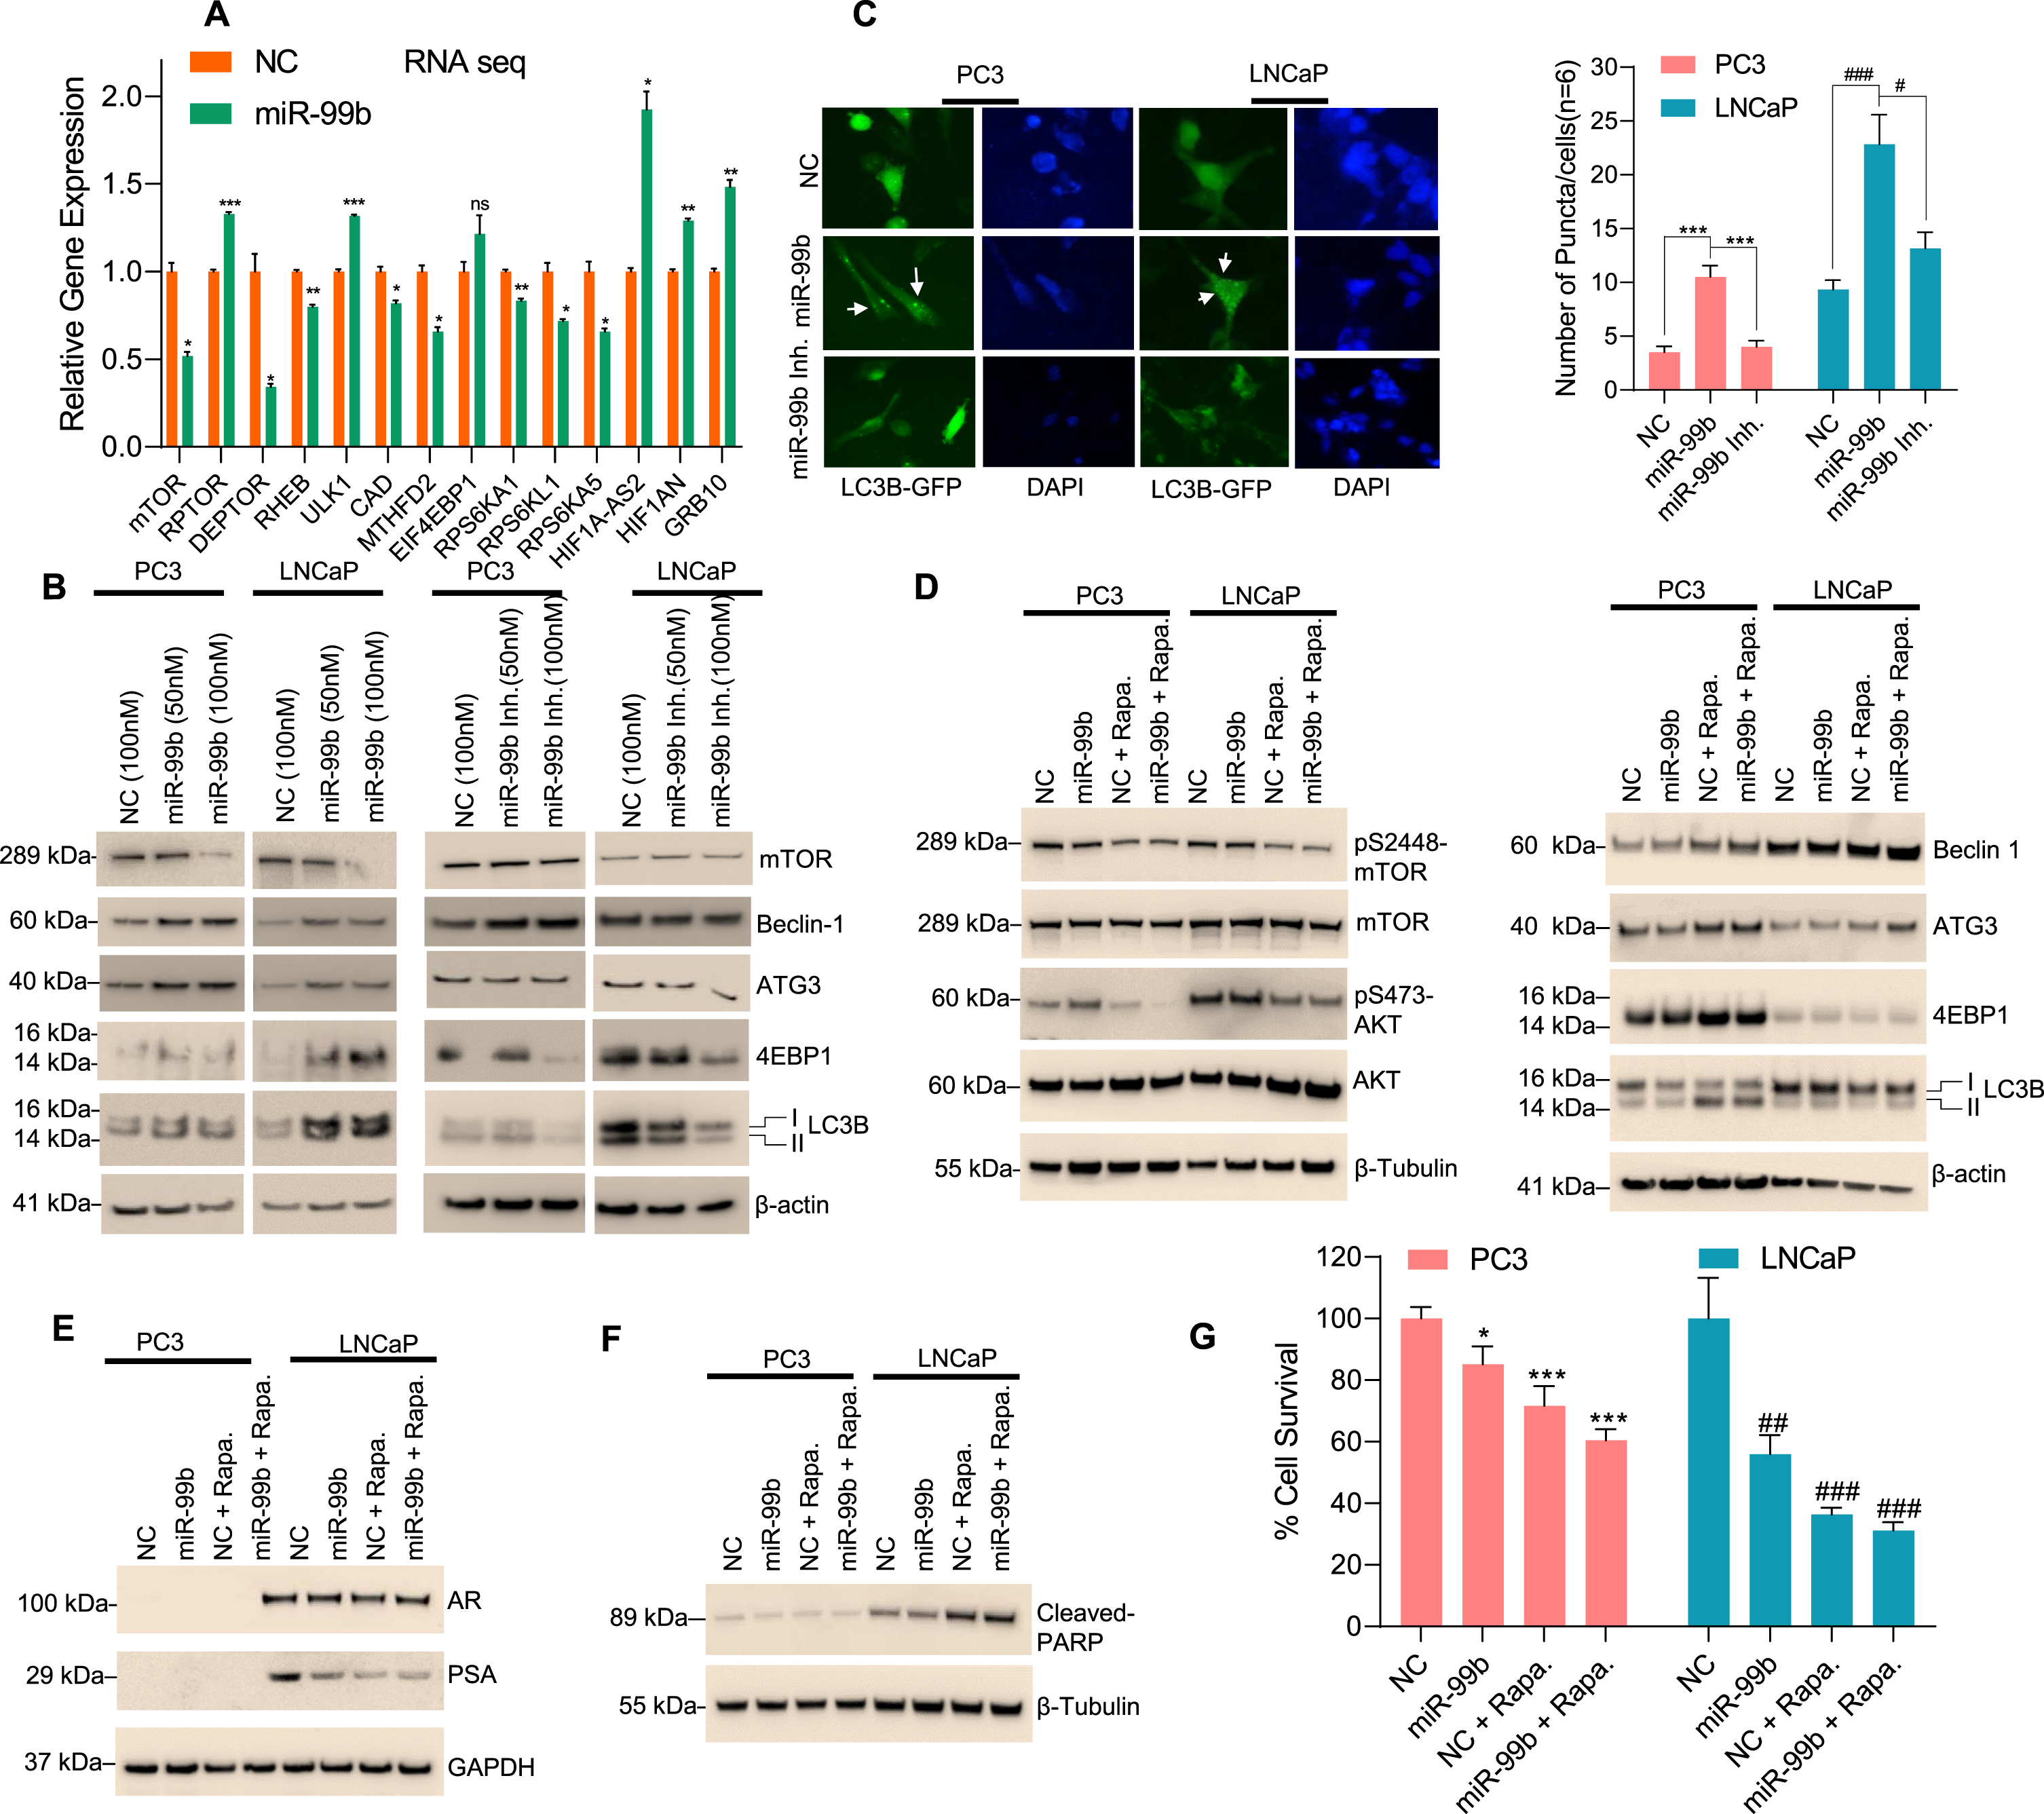
Since the induction of autophagy is controlled by the mTOR signaling pathways [34] and the expression of mTOR is controlled by miR-99b, we analyzed the role of miR-99b on the regulation of autophagy through mTOR. PC3 and LNCaP cells were transfected with two concentrations of miR-99b, and the expression of autophagic markers were analyzed by immunoblotting (Fig. 4B). Overexpression of miR-99b in PC3 and LNCaP cells decreased mTOR expression as expected and increased expression of autophagic biomarkers including Beclin1, ATG3, 4EBP1, and LC3B I/II (Fig. 4B, left two panels). In contrast, inactivation of miR-99b by miR-99b inhibitor stabilized endogenous mTOR and decreased expression of Beclin1, ATG3, 4EBP1, and LC3B I/II autophagy-related biomarkers (Fig. 4B, right two panels). To visualize the role of miR-99b in the induction of autophagy, we analyzed LC3B-related puncta formation in PC3 and LNCaP cells after co-transfection of LC3B-GFP plasmid and miR-99b mimic or miR-99b inhibitor (Fig. 4C). Immunofluorescence data showed that overexpression of miR-99b induced LC3B-related puncta formation in PC3 and LNCaP cells, whereas inactivation of miR-99b decreased LC3B-related puncta formation (Fig. 4C, left and right panels) suggesting that miR-99b induced cellular autophagy by inactivation of mTOR.
Further, the effect of miR-99b and the mTOR inhibitor rapamycin on AKT/mTOR signaling, autophagy biomarkers, and PCa cell death was analyzed (Fig. 4D-G). Treatment with rapamycin and overexpression of miR-99b inactivated phosphorylation of serine-2448 of mTOR (pS2448-mTOR) and phosphorylation of serine-473 of AKT (pS473-AKT) (Fig. 4D, left panel) and induced expression of Beclin1, ATG3, 4EBP1, and LC3B I/II autophagy markers in PC3 and LNCaP cells compared with NC transfected and rapamycin-treated cells (Fig. 4D, right panels). Moreover, treatment with rapamycin and overexpression of miR-99b inhibited AR and PSA expression and induced cleaved-PARP expression compared with NC transfected or miR-99b transfected LNCaP cells (Fig. 4E & F). Interestingly, treatment with rapamycin and overexpression of miR-99b significantly reduced cell survival in PC3 and LNCAP cells compared with NC transfected and rapamycin-treated or miR-99b transfected PCa cells (Fig. 4G). These data together suggest that miR-99b targets mTOR, as well as AR signaling pathways, induces autophagy and cell death in PCa cells.
3.5miR-99b/mTOR/AR axis modulates autophagy and cell death in PCa cells
Enzalutamide (ENZ) is an AR inhibitor that improves PCa patient survival in metastatic and hormone-sensitive prostate cancer [35]. Our data suggest that miR-99b downregulates AR expression in LNCaP cells (Fig. 1H, 3D, and 4E) and thus may affect PCa cell ENZ sensitivity. We first analyzed the effect of ENZ alone on AR, AKT/mTOR levels, and cell death in PCa cell lines. Treatment of two concentrations of ENZ for 24 h in LNCaP cells decreased AR expression and its downstream target PSA as expected (Fig. 5A). Interestingly no effect on AKT/mTOR signaling was observed when PC3 or LNCaP cells were treated with ENZ for 24 h. However, increased expression of LC3B II and cleaved-PARP were detected in PC3 and LNCaP cells (Fig. 5A). A time-dependent (24–72 h) treatment of ENZ (10μM) decreased expression of AR and PSA. Treatments of ENZ did not show any effect on AKT/mTOR signaling. However, ENZ treatments increased the expression of LC3B II and cleaved-PARP in a time-dependent manner (Fig. 5B). Further, a time-dependent treatment of ENZ affects miR-99b expression in PC3 cells but did not show any significant effect on miR-99b expression in LNCaP cell lines (Fig. 5C, upper and lower panels). Interestingly, immunoblotting data demonstrated that overexpression of miR-99b decreased AR and PSA levels and increased cleaved-PARP expression in LNCaP cells (Fig. 5D, right panel) and inactivation of miR-99b by miR-99b inhibitor in LNCaP cells specifically activated AR and PSA expression and decreased cleaved-PARP expression (Fig. 5D, right panel). Since miR-99b induced cleaved-PARP expression, we further analyzed the effect of miR-99b and ENZ on PCa cell survival. Compared with NC-transfected and ENZ treatment, overexpression of miR-99b and ENZ treatment decreased cell survival more efficiently in LNCaP cells compared with PC3 cells (Fig. 5E, right and left panels), suggesting that ENZ treatment and enforced expression of miR-99b suppresses LNCaP cell growth by inducing autophagy and cell death.
Fig. 5
miR-99b inhibits AR and decreases PCa cell survival. (A) PCa PC3 and LNCaP cells were treated with increasing concentrations of enzalutamide (ENZ) for 30 h and the effect of ENZ on the expression of AR, PSA, mTOR, AKT, LC3B, cleaved-PARP, and β-actin was analyzed by western blotting. (B) PCa PC3 and LNCaP cells were treated with ENZ (10μM) for 24-72 h (as indicated) and cell lysates were immunoblotted with indicated antibodies. (C) PCa PC3 and LNCaP cells were treated with ENZ (10μM) for 24-72 h and the effect of ENZ on the expression of miR-99b was analyzed by RT/qPCR (upper and lower panels). *P < 0.05, compared with vehicle-treated cells. ns-not significant. (D) PCa PC3 and LNCaP cells were transfected with NC or miR-99b or miR-99b inhibitor for 30 h and cell lysates were immunoblotted with AR, PSA, cleaved-PARP, and β-actin antibodies. (E) Effect of miR-99b, ENZ, and miR-99b plus ENZ of PCa cell survival was analyzed by MTT assay after 48 h of transfection/treatment. **P < 0.01, ###P < 0.001 compared with NC transfected or NC transfected plus ENZ-treated PC3 cells. ***P < 0.001, ###P < 0.001 compared with NC transfected or NC transfected plus ENZ-treated LNCaP cells.
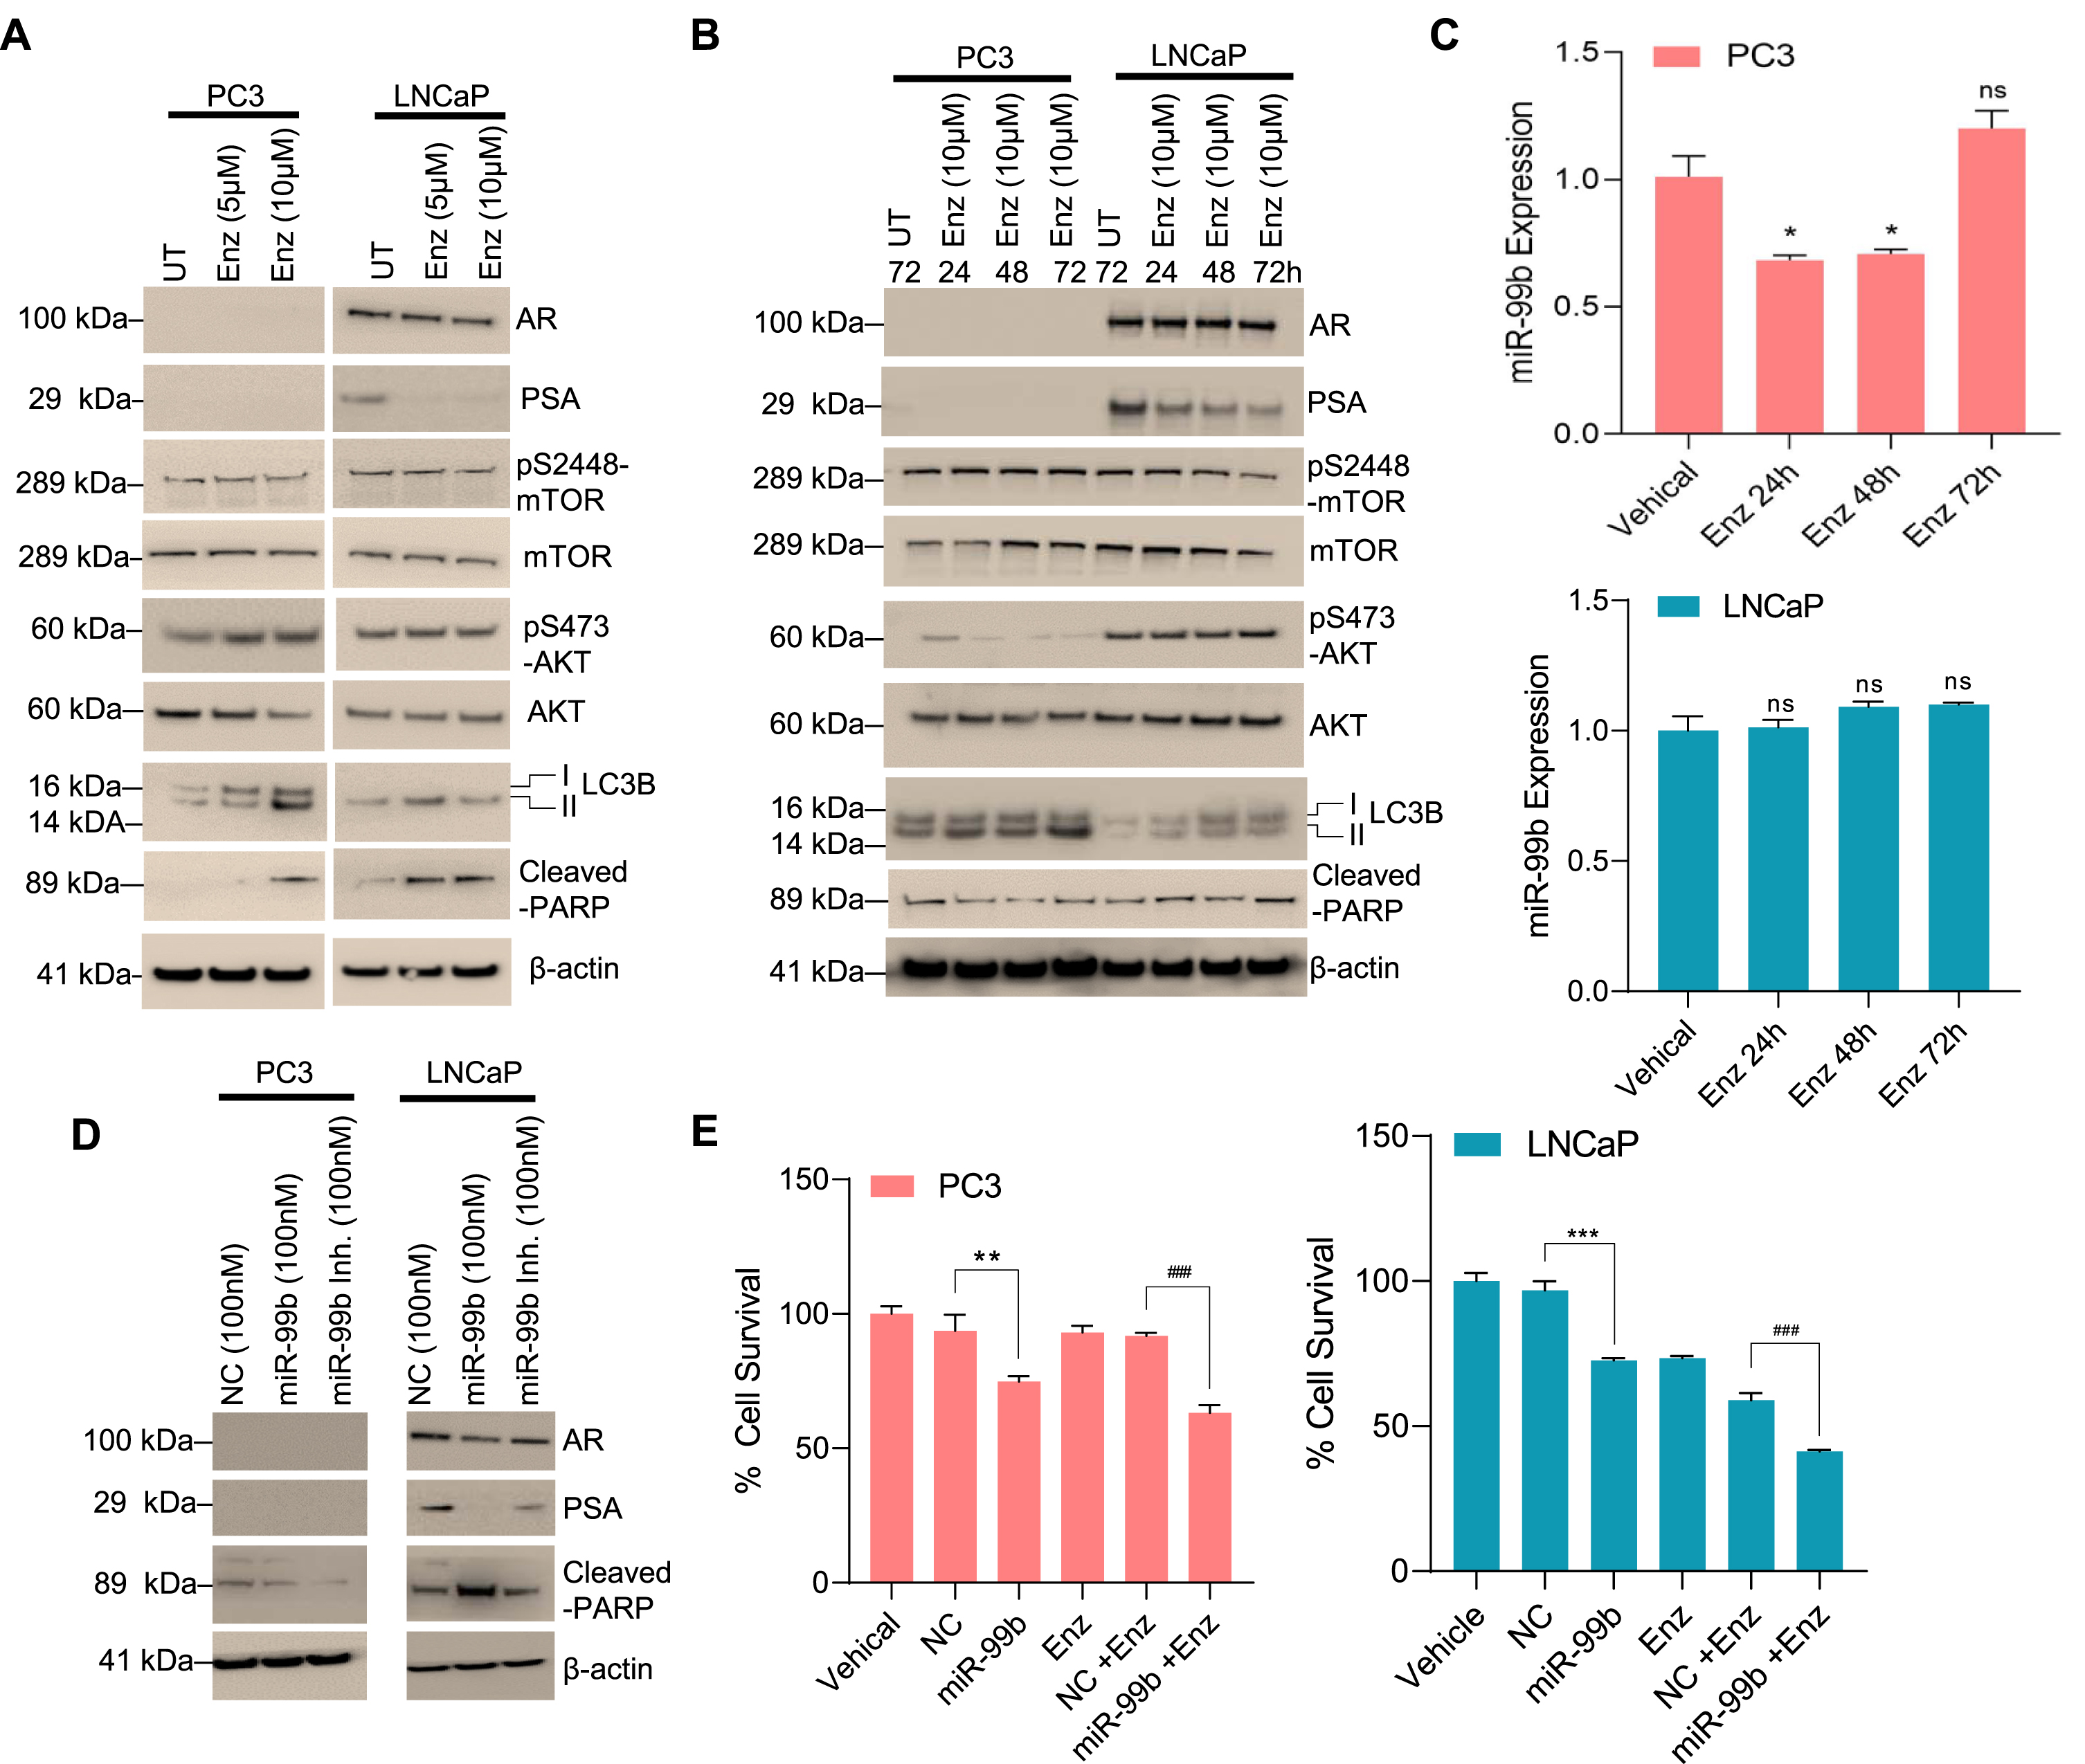
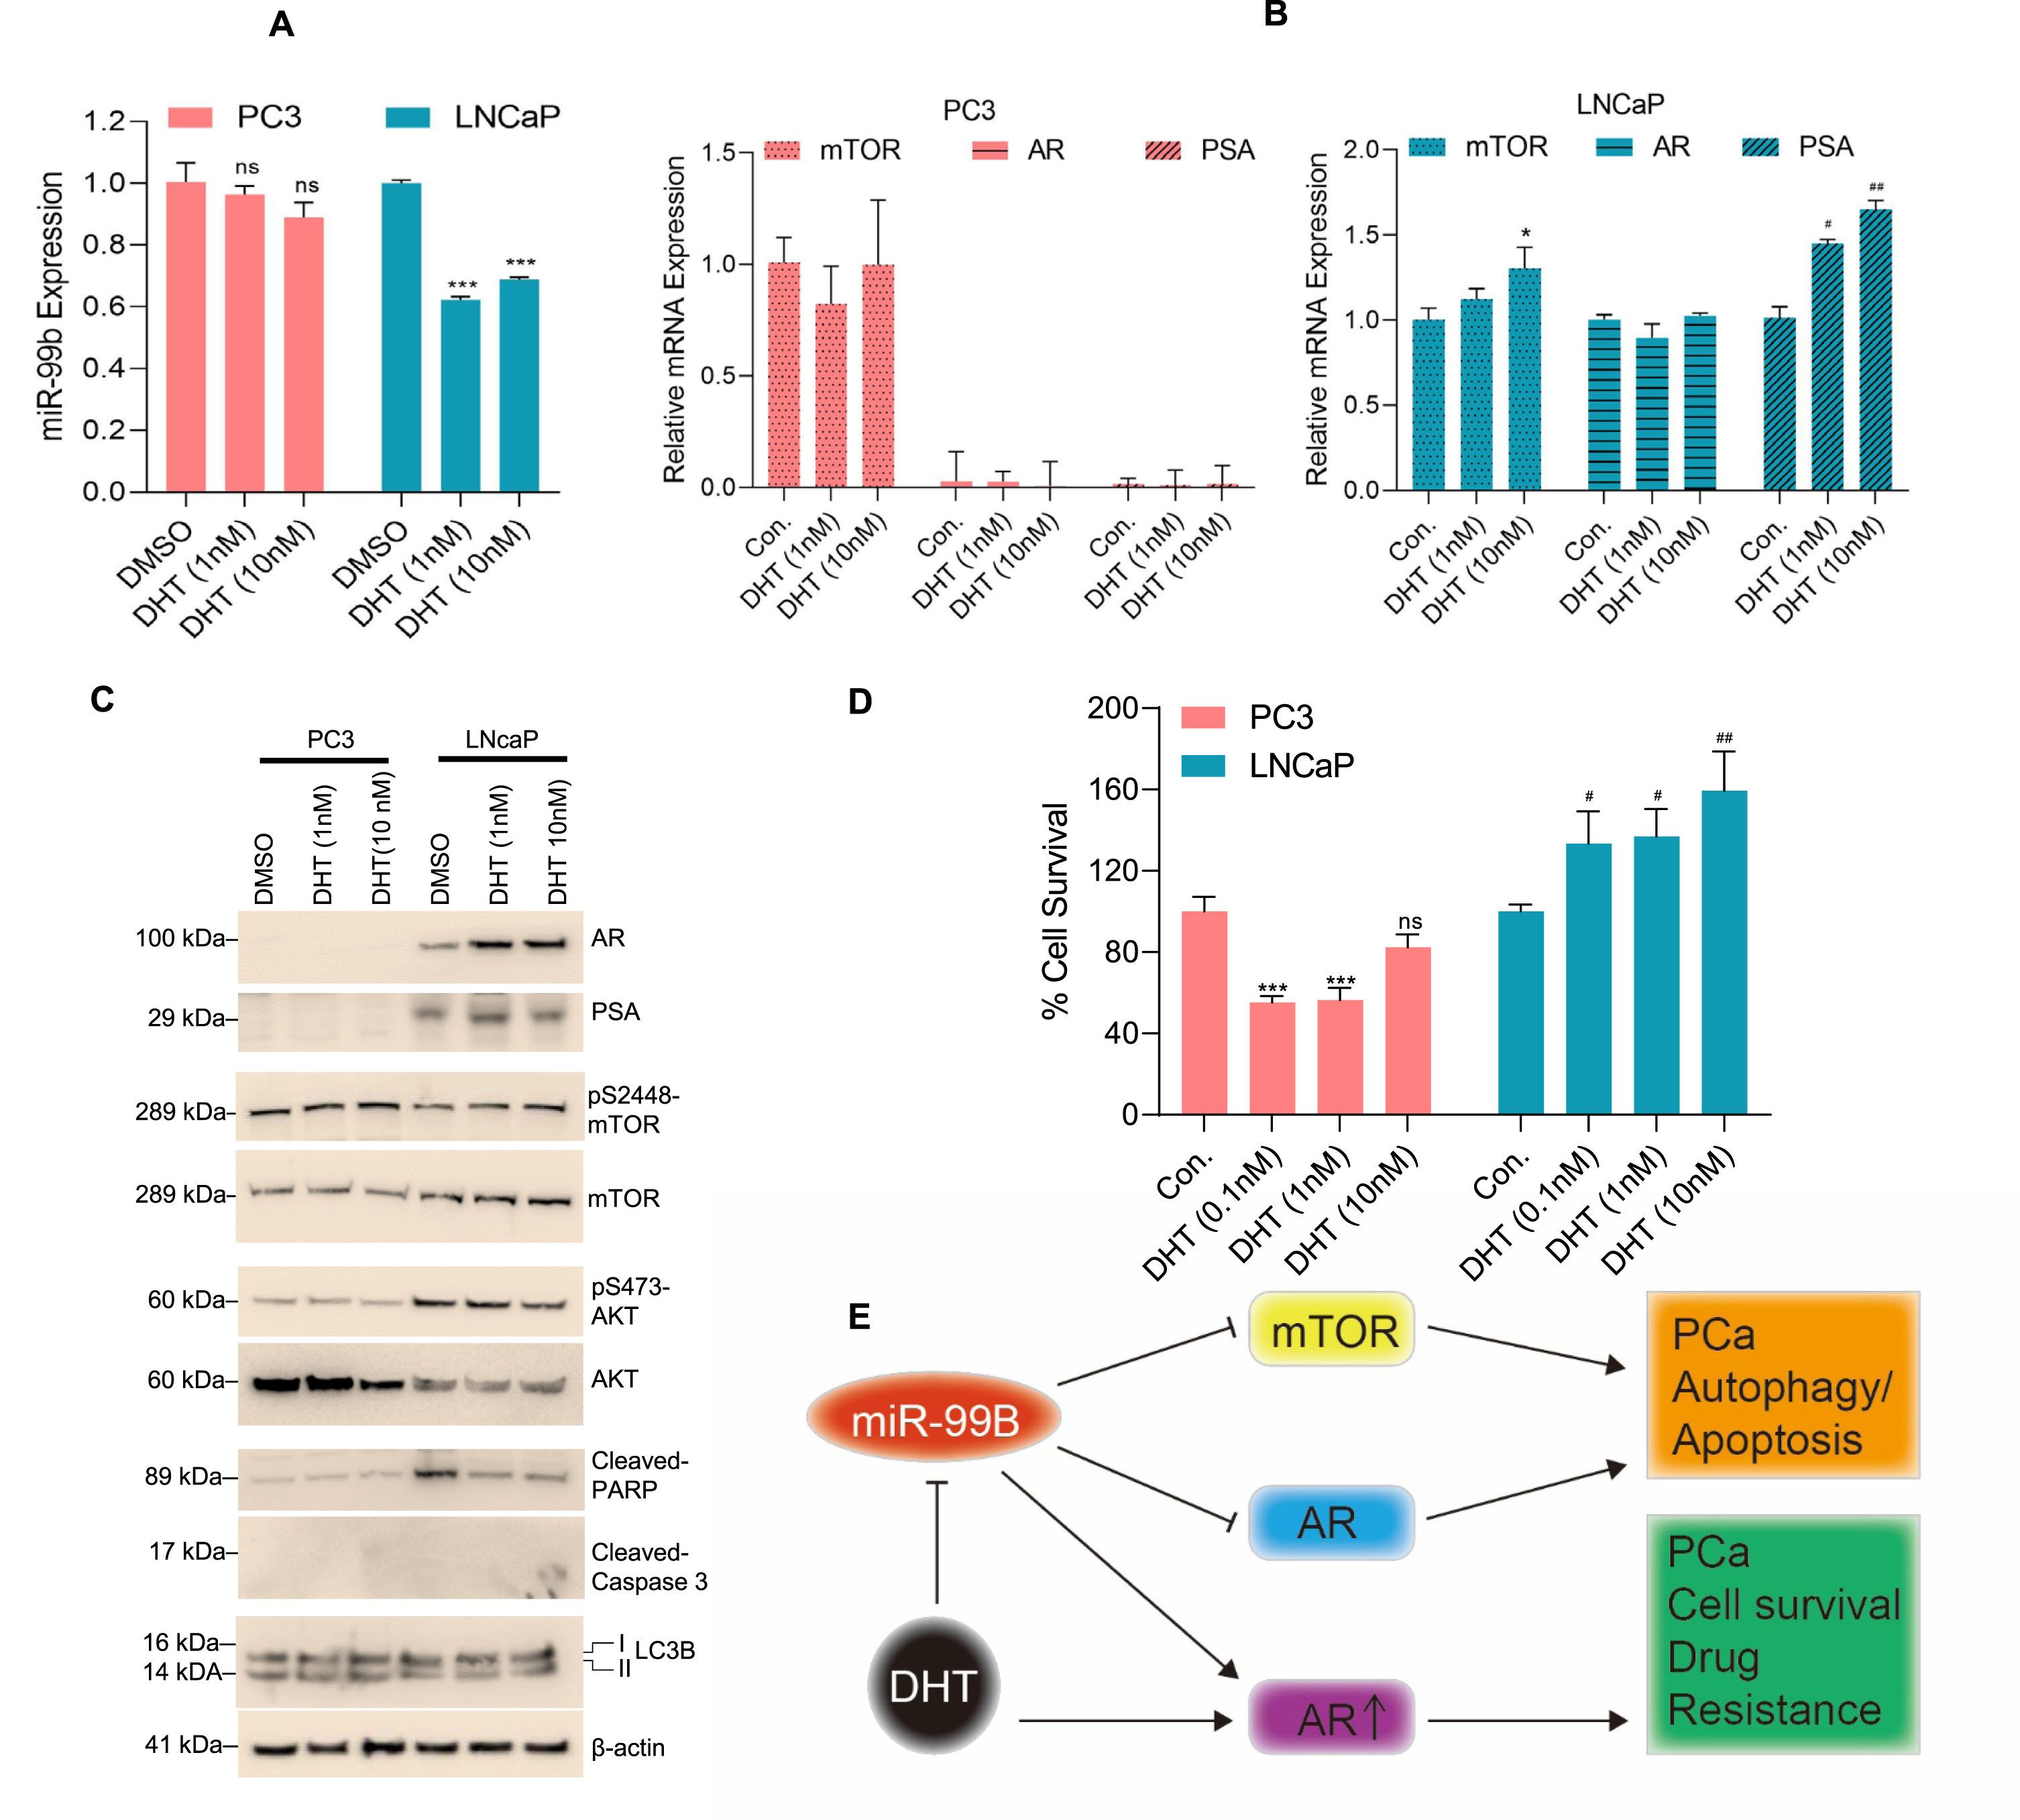
Dysregulation of the androgen DHT was reported in PCa and DHT is known to regulate AR signaling [36]. Here we investigated the role of DHT in the regulation of miR-99b. PC3 and LNCaP cells were treated with DHT for 30 h and the expression of miR-99b was analyzed. RT/qPCR data demonstrated that DHT treatments downregulated miR-99b expression in LNCaP cells, but no significant effect on miR-99b expression was observed in PC3 cells (Fig. 6A). DHT treatments also upregulated mTOR and PSA gene expression in LNCaP cells, but no significant change in mTOR expression was observed in PC3 cells (Fig. 6B, right and left panels). Similarly, immunoblotting data demonstrated that DHT treatment increased AR and PSA expression as well as pS2448-mTOR expression in LNCaP cells (Fig. 6C). Interestingly, DHT treatment decreased cleaved-PARP expression in LNCaP cells (Fig. 6C), and a dose-dependent DHT treatment increased cell survival in LNCaP compared with PC3 cells (Fig. 6D), suggesting that DHT downregulates miR-99b expression, activates mTOR/AR expression, and increases LNCaP cell survival.
Fig. 6
DHT downregulates miR-99b expression and increases AR-mediated cell survival. (A) PCa PC3 and LNCaP cells were treated with increasing concentrations of DHT for 30 h and the expression of miR-99b was analyzed by RT/qPCR. ***P < 0.001 compared with DMSO treated cells. ns-not significant. (B) Similarly, the effect of DHT on mTOR, AR, and PSA expression in PC3 and LNCaP cells was analyzed by RT/qPCR. *P < 0.05, #P < 0.05, ##P < 0.01 compared with untreated LNCaP cells. (C) The effect of DHT on AR, PSA, mTOR, AKT, cleaved-PARP, LC3B expression was analyzed by immunoblotting and presented. (D) The effect of DHT (0.1-10 nM) on PCa cell survival was analyzed by MTT assay after 48 h of treatment. ***P < 0.001 compared with untreated PC3 cells. #P < 0.05, ##P < 0.01 compared with untreated LNCaP cells. (E) The schematic model represents the role of miR-99b in the regulation of mTOR/AR signaling and PCa cell apoptosis and drug resistance.
3.6miR-99b regulates neuroendocrine differentiation (NED) in PCa cells
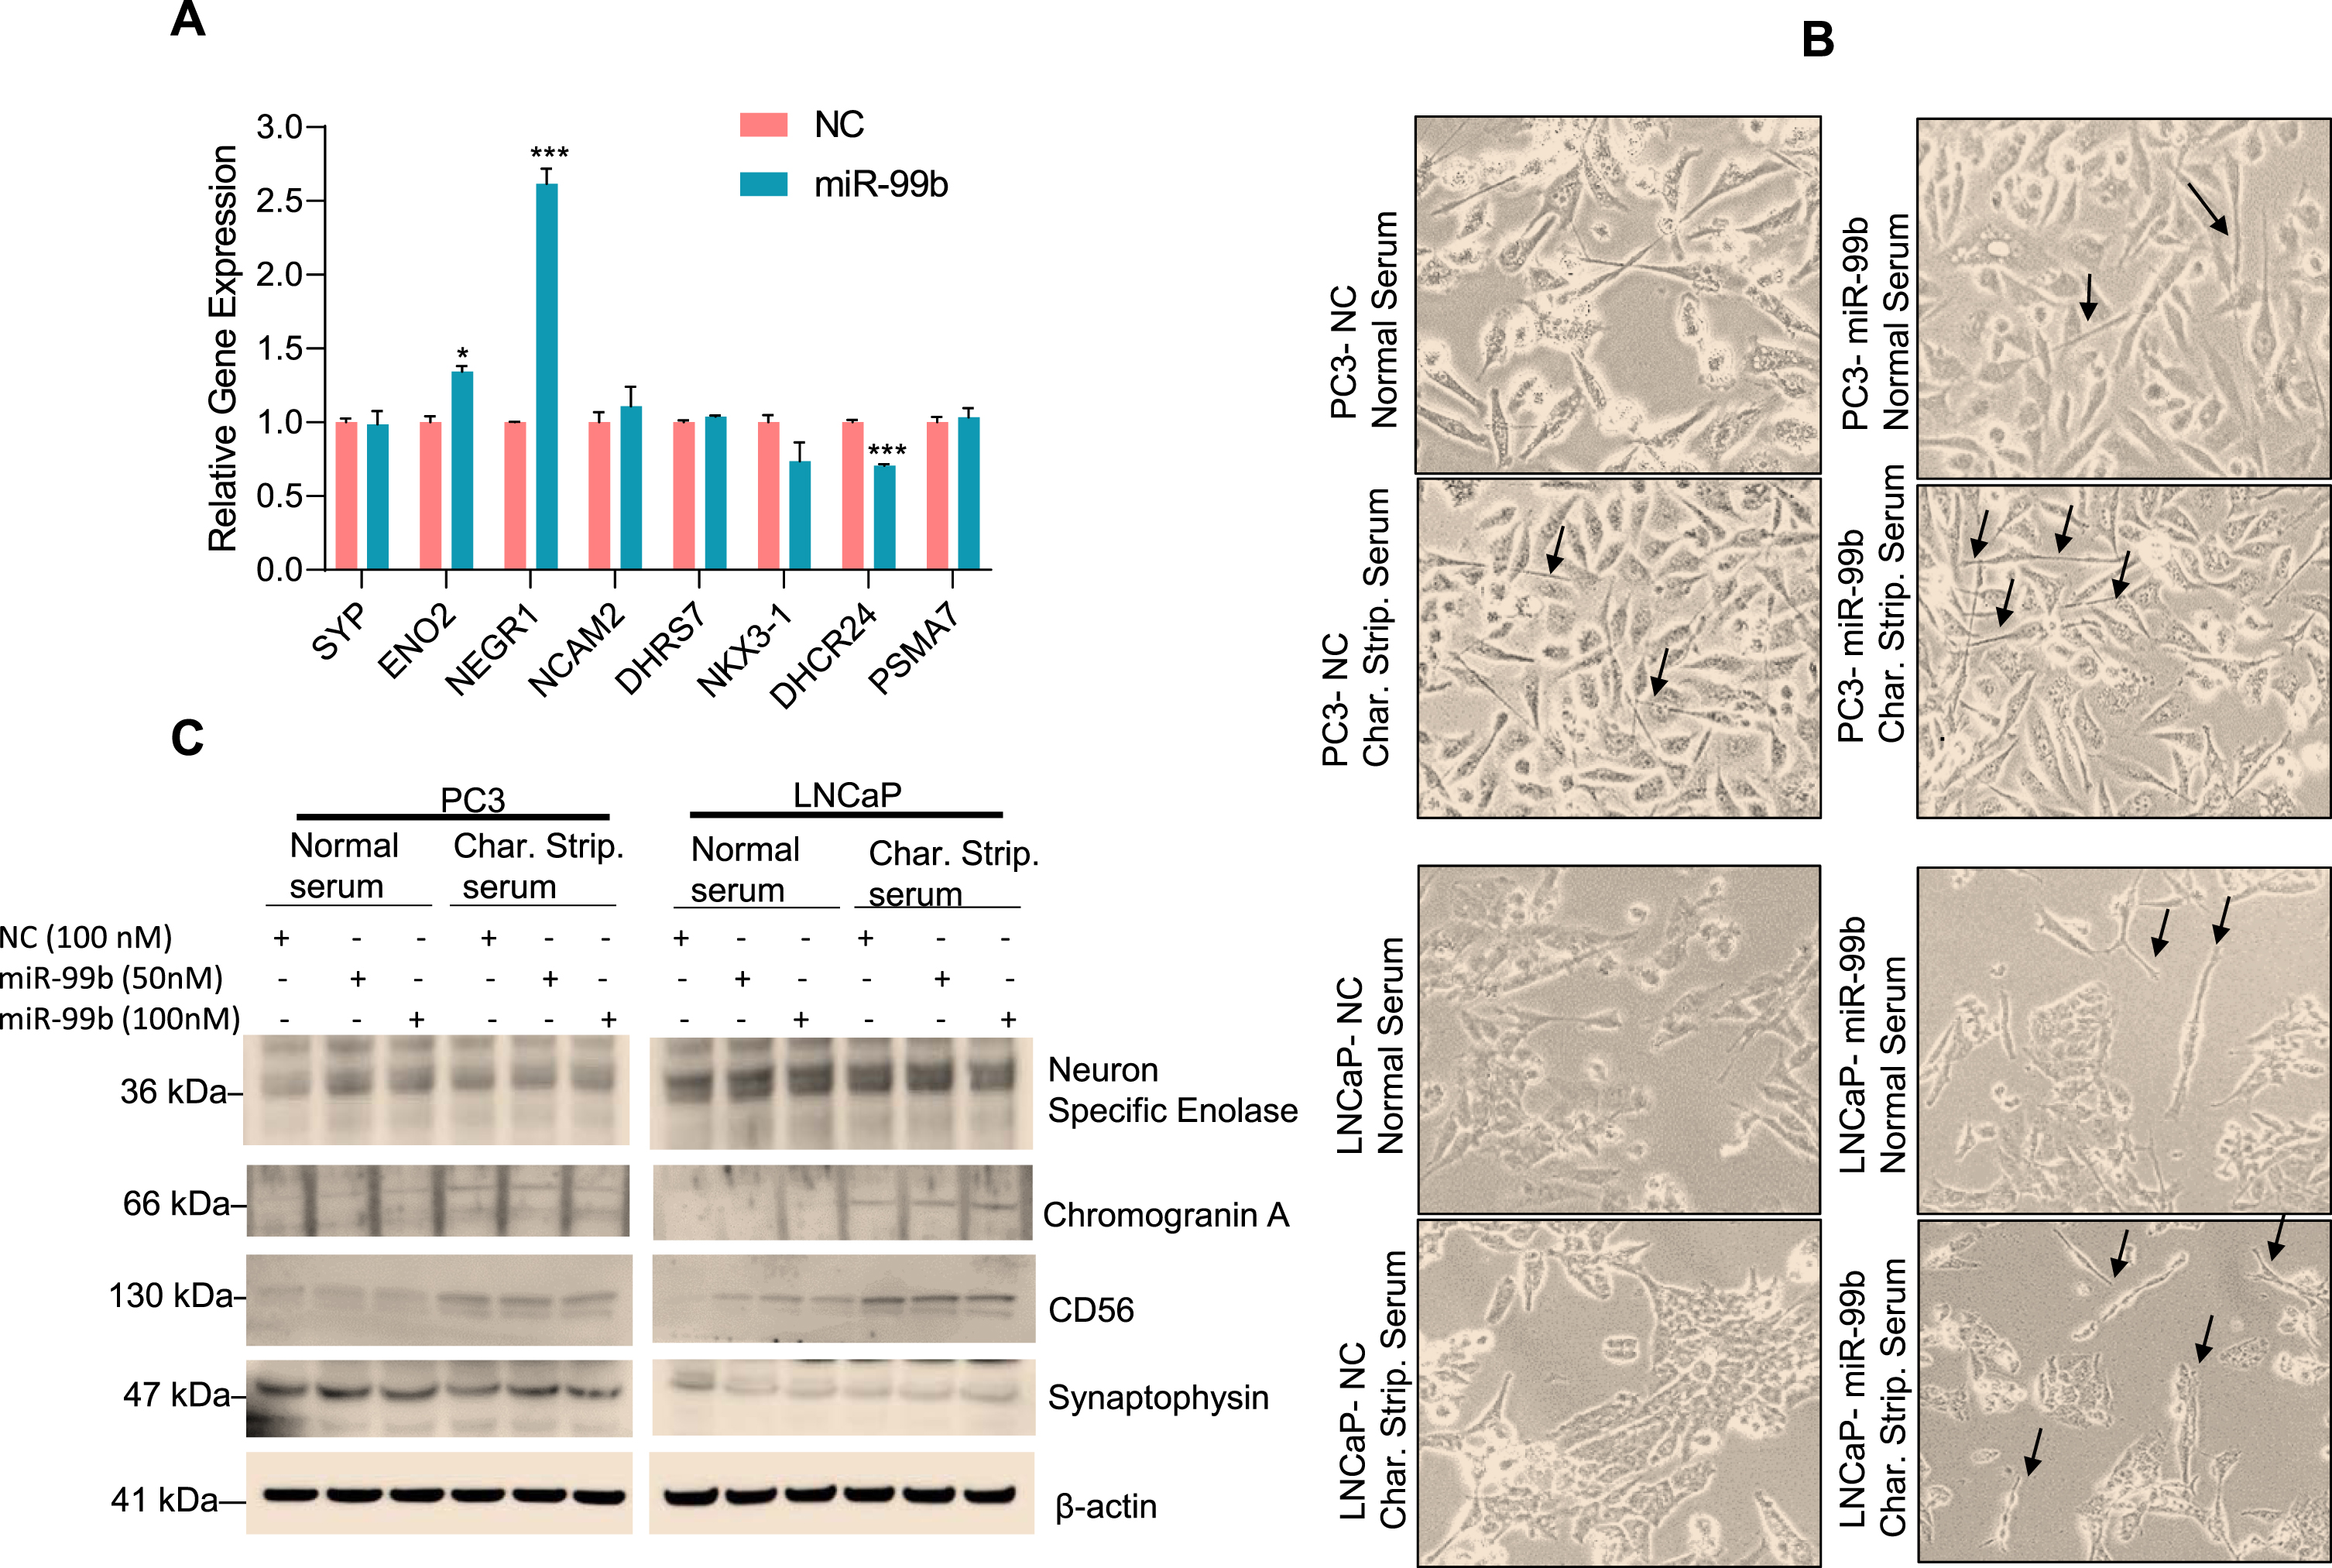
miRNAs are known to regulate neuroendocrine differentiation (NED). For example, previous studies have reported that miR-663 upregulates the expression of NED biomarkers such as chromogranin A (CHGA), synaptophysin (SYP), neuron-specific enolase (ENO2), dehydrogenase/reductase 7 (DHRS7), NK3 homeobox 1 (NKX3.1), 24-dehydrocholesterol reductase (DHCR24), and proteasome 20S subunit alpha 7(PSMA7) and induces NED in PC3, LNCaP, and DU145 cell lines [37–39]. Since our RNA-seq data suggested that miR-99b modulates cell proliferation and drug-response pathways (Supplementary Fig. S2D), we asked whether miR-99b is involved in NED. Using RNAseq microarray data, we analyzed the effect of miR-99b on the expression of NED-related markers. Our data showed that overexpression of miR-99b significantly up-regulated enolase 2 (ENO2) and neuronal growth regulator 1 (NEGR1) but had no significant effect on synaptophysin and neural cell adhesion molecule 2 (NCAM2), dehydrogenase/reductase 7 (DHRS7), NK3 homeobox 1 (NKX3.1), and proteasome 20S subunit alpha 7(PSMA7) expression (Fig. 7A). To test the effect of miR-99b on NED in PCa cells, we grew PC3 and LNCaP cells in normal serum or charcoal-stripped serum and, after transfection of NC and miR-99b for 48 h, the cells were observed under a microscope for neurite development (Fig. 7B). Our data show that expression of miR-99b induced neurite development in PC3 and LNCaP cells grown in charcoal-stripped serum compared with normal serum grown cells and transfected with miR-99b (Fig. 7B). Furthermore, we immunoblotted the cell lysates with NED markers and observed that overexpression of miR-99b upregulated the expression of synaptophysin, chromogranin A, and NCAM-1/CD56 in cells transfected with miR-99b and grown in charcoal-stripped serum media (Fig. 7C). These results suggest that miR-99b may be involved in the neuroendocrine differentiation in PCa cells.
Fig. 7
miR-99b induces NED marker expression in PC3 and LNCaP cells (A) PC3 cells were transfected with NC of miR-99b for 24 h in triplicate and the effect of overexpression of miR-99b on the regulation of NED markers expression in PC3 cells were analyzed by RNA-seq. *P < 0.05, ***P < 0.001 compared with NC transfected PC3 cells. (B) PCa PC3 and LNCaP cells were grown in normal serum or charcoal-stripped serum and transfected with NC or miR-99b mimic (100 nM) for 48 h. Cells were observed under a microscope and photographed. (C) Similarly, PC3 and LNCaP cells were grown in normal serum or charcoal-stripped serum and transfected with NC or miR-99b mimic for 48 h and cell lysates were immunoblotted with indicated antibodies.
4Discussion
In the current study, we investigated the role of miR-99b in PCa cells. Our data demonstrated that miR-99b targets the mTOR/AR axis and inhibits PCa cell proliferation. Multiple previous studies have demonstrated that miR-99b targets mTOR. For example, miR-99b targets mTOR and modulates neuroregeneration in mice after spinal cord injury [40], and downregulation of miR-99b in pancreatic cancer cells upregulates mTOR expression which leads to increased irradiation resistance [33]. Moreover, reports have demonstrated that miR-99b and miR-203a target mTOR and suppress gastric cancer growth [25]. Other studies have shown that the miR-99b family miRNAs (miR-99a, miR-99b, and miR-100) are downregulated in PCa tumors and miR-99a potentially targets mTOR and AR signaling and inhibits PCa growth [28]. Our data further support these studies as we have shown that miR-99b expression was downregulated in PCa tumor samples and that leads to up-regulation of mTOR and AR expression.
We also investigated the role of miR-99b in PCa cell growth/suppression and our data showed that miR-99b inhibits mTOR expression by binding with the 3′UTR of the mTOR gene and suppresses mTOR activity in both AR-negative PC3 and AR-positive LNCaP cells and miR-99b also inhibits AR signaling in LNCaP cells. By targeting mTOR and AR signaling, miR-99b inhibits cell proliferation, cell survival, cell migration, cell colony formation, and spheroid formation in PCa cells. Enforced expression of miR-99b also induced cell apoptosis in both PC3 and LNCaP cells. Interestingly, we found that miR-99b induced cellular autophagy by inactivation of mTOR and suppressed PCa cell growth.
Autophagy is an endogenous catabolic process that degrades damaged cell organelles and unfolded proteins through lysosomal degradation and thus maintain cellular homeostasis [41]. In cancer, autophagy regulates cell proliferation, differentiation, survival, and apoptosis and plays a dual role in tumor development as well as suppression [42]. Since mTOR signaling downregulates autophagy [43], here we demonstrated that by inactivation of mTOR, miR-99b induces expression of autophagy-related biomarkers including Beclin1, ATG3, 4EBP1, and LC3B. RNA-seq data further showed that enforced miR-99b expression dysregulates mTOR complex 1 and mTOR complex 2 gene expression, as well as affects mTOR downstream gene signaling cascades. Interestingly, reports also suggest that activation of cellular autophagy contributes to neuroendocrine differentiation (NED) in prostate cancer cells [44, 45]. In our studies, we have demonstrated that enforced expression of miR-99b increased expression of the NED biomarkers, chromogranin A, CD56, and synaptophysin, in prostate cancer cells. The exact mechanism by which miR-99b leads to increased NED in prostate cancer cells remains unclear.
Enzalutamide (ENZ) was approved in 2012 by the FDA for clinical use. Due to its robust effectiveness against PCa, it remains among the most prevalent first-line treatment for Castrate-Resistant Prostate Cancer (CRPC) [46], and underexpression of miR-99b and miR-99a is reported in CRPC [27]. Drug resistance mechanisms of CRPC in advanced-stage prostate cancer, are now better understood, but the mechanisms are not completely elucidated. ENZ resistance is believed to occur through one of three major paths; 1. Persistent activation of the androgen receptor, 2. Bypass of the AR pathway, and 3. Development of androgen receptor independence [46]. In our study, we demonstrated that to ENZ exposure, particularly in AR-positive LNCaP cells, did not show any effect of miR-99b expression. However, ENZ inactivated AR signaling and increased LC3B and cleaved-PARP expression in LNCaP cells, suggesting that ENZ up-regulates autophagy and cell apoptosis. In contrast, overexpression of miR-99b and ENZ treatment reduced LNCaP cell survival. As suggested earlier, the expression of miR-99 is downregulated in hormone native tissue, hormone-refractory prostate cancer (HRPC) tissue, and prostatic hyperplasia (BHP) tissue [47]. Our data suggest that exposure to LNCaP cells to DHT downregulates miR-99b expression, activates AR/mTOR signaling, downregulates autophagy and cell death, and increases cell proliferation.
Upregulation of the AKT/mTOR pathway can play a dominant role over AR signaling and drug resistance in PCa cells [48]. The constitutive activation of AR through mTOR upregulation makes it a critical pathway of interest in studying the circumvention of AR resistance [48]. More aggressive PC3 cells demonstrate a relatively rapid change in mTOR pathway overregulation, strongly indicating the importance of controlled exposure of enzalutamide in CRPC [49]. Prostate cancer cells already sensitized to enzalutamide and AR dysfunction may rapidly bypass AR through upregulation of mTOR pathway expression [50]. A recent study demonstrated that exposure to the AR agonist R1881 activates AR and enhanced the nuclear localization of mTOR [51]. The study indicated a paradigm shift from a focus on the central role of AR to an emphasis on mTOR/nuclear mTOR as the master transcriptional regulator of PCa cell metabolism [51]. Overall, the study suggests that the mTOR/AR axis plays an important role in PCa progression and miR-99b could be used as a therapeutic target to control AR/mTOR over-activation in PCa.
5Conclusion
Our study suggests that downregulation of miR-99b expression in PCa tumors activates mTOR and AR signaling. This is consistent with our results that overexpression of miR-99b in PCa cells suppressed PCa cell growth by targeting the mTOR/AR axis. In addition, miR-99b directly binds with 3′UTR of the mTOR gene and inhibits mTOR expression, resulting in the induction of cellular autophagy in PCa cells. Our data suggest that miR-99b also inhibits AR signaling and induces cell apoptosis. In contrast, activation of AR signaling by DHT downregulated miR-99b expression and promoted cell PCa cell growth/survival. Coupling these observations makes a strong case for a role for miR-99b in mTOR regulation and as a mechanism to bypass the AR pathway. The discovery of a role for miR-99b in mTOR/AR axis regulation suggests miR-99b is a promising molecule for PCa biomarker and therapeutic development.
Acknowledgments
This current study was supported by grants U01CA194730 from the National Cancer Institute/National Institutes of Health (NCI/NIH) and U54MD012392, R01MD012767 from National Institute on Minority Health and Health Disparities/National Institutes of Health (NIMHD/NIH) to D.K. This work is supported by the Department of Defense Prostate Cancer Research Program, Award No W81XWH-18-2-0013, W81XWH-18-2-0015, W81XWH-18-2-0016, W81XWH-18-2-0017, W81XWH-18-2-0018, and W81XWH-18-2-0019 Prostate Cancer Biorepository Network (PCBN). We are thankful to Dr. John Moore for critically editing the current manuscript.
Author contributions
CONCEPTION: S.N. and D. K.
DATA CURATION: S.N., L.T., Q.Q. and S.G.
ANALYSIS OF DATA: S.N., L.T., Q.Q., S.G. and K.H.
PREPARATION OF THE MANUSCRIPT: S.N.
SUPERVISION: D.K.
Conflict of interest
The authors declare that they have no conflict of interest.
SUPPLEMENTARY MATERIAL
[1] The supplementary material is available in the electronic version of this article: https://dx.doi.org/10.3233/TUB-211568.
References
[1] | Catalona WJ . Prostate Cancer Screening. Med Clin North Am. (2018) ;102: :199–214. doi: 10.1016/j.mcna.2017.11.001 |
[2] | Siegel RL , Miller KD , Fuchs HE , Jemal A . Cancer Statistics. CA Cancer J Clin. (2021) ;71: :7–33. |
[3] | Rawla P . Epidemiology of Prostate Cancer. World J Oncol(2019) ;10: :63–89. doi: 10.14740/wjon1191 |
[4] | Cyll K , Ersvaer E , Vlatkovic L , Pradhan M , Kildal W , Avranden Kjaer M , et al. Tumour heterogeneity poses a significant challenge to cancer biomarker research. Br J Cancer. (2017) ;117: :367–75. doi: 10.1038/bjc.2017.171 |
[5] | Zadra G , Loda M . Metabolic Vulnerabilities of Prostate Cancer: Diagnostic and Therapeutic Opportunities. Cold Spring Harb Perspect Med. (2018) :8. doi: 10.1101/cshperspect.a030569 |
[6] | Izumi K , Mizokami A , Namiki M , Inoue S , Tanaka N , Yoshio Y , et al. Enzalutamide versus abiraterone as a first-line endocrine therapy for castration-resistant prostate cancer (ENABLE study for PCa): a study protocol for a multicenter randomized phase III trial. BMC Cancer. (2017) ;17: :677. doi: 10.1186/s12885-017-3661-2 |
[7] | Loriot Y , Massard C , Fizazi K . Recent developments in treatments targeting castration-resistant prostate cancer bone metastases. Ann Oncol. (2012) ;23: (5):1085–94. doi: 10.1093/annonc/mdr573 |
[8] | Vanacore D , Boccellino M , Rossetti S , Cavaliere C , D’Aniello C , Di Franco R , et al. Micrornas in prostate cancer: an overview. Oncotarget. (2017) ;8: :50240–51. doi: 10.18632/oncotarget.16933 |
[9] | Rebbeck TR . Prostate Cancer Genetics: Variation by Race, Ethnicity, and Geography. Semin Radiat Oncol. (2017) ;27: :3–10. doi: 10.1016/j.semradonc.2016.08.002 |
[10] | Stephan C , Jung K . Advances in Biomarkers for PCa Diagnostics and Prognostics-A Way towards Personalized Medicine. Int J Mol Sci. (2017) :18: :2193. doi: 10.3390/ijms18102193 |
[11] | Stephan C , Jung K , Ralla B . Current biomarkers for diagnosing of prostate cancer. Future Oncol. (2015) ;11: :2743–55. doi: 10.2217/fon.15.203 |
[12] | Hendriks RJ , van Oort IM , Schalken JA . Blood-based and urinary prostate cancer biomarkers: a review and comparison of novel biomarkers for detection and treatment decisions. Prostate Cancer Prostatic Dis. (2017) ;20: :12–9. doi: 10.1038/pcan.2016.59 |
[13] | Tanase CP , Codrici E , Popescu ID , Mihai S , Enciu AM , Necula LG , et al. Prostate cancer proteomics: Current trends and future perspectives for biomarker discovery. Oncotarget. (2017) ;8: :18497–512. doi: 10.18632/oncotarget.14501 |
[14] | Matin F , Jeet V , Moya L , Selth LA , Chambers S , Australian Prostate Cancer. et al. A Plasma Biomarker Panel of Four MicroRNAs for the Diagnosis of Prostate Cancer. Sci Rep. (2018) ;8: :6653. doi: 10.1038/s41598-018-24424-w |
[15] | Bartel DP . MicroRNAs: genomics, biogenesis, mechanism, and function. Cell. (2004) ;116: :281–97. doi: 10.1016/S0092-8674(04)00045-5 |
[16] | Karp X , Ambros V . Developmental biology. Encountering microRNAs in cell fate signaling. Science. (2005) ;310: :1288–9. |
[17] | Cheng AM , Byrom MW , Shelton J , Ford LP . Antisense inhibition of human miRNAs and indications for an involvement of miRNA in cell growth and apoptosis. Nucleic Acids Res. (2005) ;33: :1290–7. doi: 10.1126/science.1121566 |
[18] | Lu S , Sun YH , Shi R , Clark C , Li L , Chiang VL . Novel and mechanical stress-responsive MicroRNAs in Populus trichocarpa that are absent from Arabidopsis. Plant Cell. (2005) ;17: :2186–203. doi: 10.1105/tpc.105.033456 |
[19] | Murray MJ , Huddart RA , Coleman N . The present and future of serum diagnostic tests for testicular germ cell tumours. Nat Rev Urol. (2016) ;13: :715–25. doi: 10.1038/nrurol.2016.170 |
[20] | Shen S , Lin Y , Yuan X , Shen L , Chen J , Chen L , et al. Biomarker MicroRNAs for Diagnosis, Prognosis and Treatment of Hepatocellular Carcinoma: A Functional Survey and Comparison. Sci Rep. (2016) ;6: :38311. doi: 10.1038/srep38311 |
[21] | Sierzega M , Kaczor M , Kolodziejczyk P , Kulig J , Sanak M , Richter P . Evaluation of serum microRNA biomarkers for gastric cancer based on blood and tissue pools profiling: the importance of miR-21 and miR-331. Br J Cancer. (2017) ;117: :266–73. doi: 10.1038/bjc.2017.190 |
[22] | Fendler A , Stephan C , Yousef GM , Kristiansen G , Jung K . The translational potential of microRNAs as biofluid markers of urological tumours. Nat Rev Urol. (2016) ;13: :734–52. doi: 10.1038/nrurol.2016.193 |
[23] | Abramovic I , Ulamec M , Katusic Bojanac A , Bulic-Jakus F , Jezek D , Sincic N . miRNA in prostate cancer: challenges toward translation. Epigenomics. (2020) ;12: :543–58. doi: 10.2217/epi-2019-0275 |
[24] | Liu C , Liu R , Zhang D , Deng Q , Liu B , Chao HP , et al. MicroRNA-141 suppresses prostate cancer stem cells and metastasis by targeting a cohort of pro-metastasis genes. Nat Commun. (2017) ;8: :14270. doi: 10.1038/ncomms14270 |
[25] | Wang Z , Zhao Z , Yang Y , Luo M , Zhang M , Wang X , et al. MiR-99b-5p and miR-203a-3p Function as Tumor Suppressors by Targeting IGF-1R in Gastric Cancer. Scientific Reports. (2018) ;8: :10119. doi: 10.1038/s41598-018-27583-y |
[26] | Song CJ , Chen H , Chen LZ , Ru GM , Guo JJ , Ding QN . The potential of microRNAs as human prostate cancer biomarkers: A meta-analysis of related studies. J Cell Biochem. (2018) ;119: :2763–86. doi: 10.1002/jcb.26445 |
[27] | Jalava SE , Urbanucci A , Latonen L , Waltering KK , Sahu B , Janne OA , et al. Androgen-regulated miR-32 targets BTG2 and is overexpressed in castration-resistant prostate cancer. Oncogene. (2012) ;31: :4460–71. doi: 10.1038/onc.2011.624 |
[28] | Sun D , Lee YS , Malhotra A , Kim HK , Matecic M , Evans C , et al. miR-99 family of MicroRNAs suppresses the expression of prostate-specific antigen and prostate cancer cell proliferation. Cancer Res. (2011) ;71: :1313–24. doi: 10.1158/0008-5472.CAN-10-1031 |
[29] | Srivastava A , Goldberger H , Dimtchev A , Ramalinga M , Chijioke J , Marian C , et al. MicroRNA profiling in prostate cancer–the diagnostic potential of urinary miR-205 and miR-214. PLoS One. (2013) ;8: :e76994. doi: 10.1371/journal.pone.0076994 |
[30] | Niture S , Lin M , Odera JO , Moore J , Zhe H , Chen X , et al. TNFAIP8 drives metabolic reprogramming to promote prostate cancer cell proliferation. Int J Biochem Cell Biol. (2021) ;130: :105885. doi: 10.1016/j.biocel.2020.105885 |
[31] | Cagle P , Niture S , Srivastava A , Ramalinga M , Aqeel R , Rios-Colon L , et al. MicroRNA-214 targets PTK6 to inhibit tumorigenic potential and increase drug sensitivity of prostate cancer cells. Sci Rep. (2019) ;9: :9776. doi: 10.1038/s41598-019-46170-3 |
[32] | Tamaki H , Harashima N , Hiraki M , Arichi N , Nishimura N , Shiina H ,et al. Bcl-2 family inhibition sensitizes human prostate cancer cells to docetaxel and promotes unexpected apoptosis under caspase-9 inhibition. Oncotarget. (2014) ;5: :11399–412. doi: 10.18632/oncotarget.2550 |
[33] | Wei F , Liu Y , Guo Y , Xiang A , Wang G , Xue X , Lu Z , et al. miR-99b-targeted mTOR induction contributes to irradiation resistance in pancreatic cancer. Mol Cancer. (2013) ;12: :81. doi: 10.1186/1476-4598-12-81 |
[34] | Dossou AS , Basu A . The Emerging Roles of mTORC1 in Macromanaging Autophagy. Cancers (Basel). (2019) ;11: :1422. doi: 10.3390/cancers11101422 |
[35] | Davis ID , Martin AJ , Stockler MR , Begbie S , Chi KN , Chowdhury S , et al. Enzalutamide with Standard First-Line Therapy in Metastatic Prostate Cancer. N Engl J Med. (2019) ;381: :121–31. doi: 10.1056/NEJMoa1903835 |
[36] | Kosaka T , Miyajima A , Oya M . Is DHT Production by 5alpha-Reductase Friend or Foe in Prostate Cancer? Front Oncol. (2014) ;4: :247. doi: 10.3389/fonc.2014.00247 |
[37] | Jiao L , Deng Z , Xu C , Yu Y , Li Y , Yang C , et al. miR-663 induces castration-resistant prostate cancer transformation and predicts clinical recurrence. J Cell Physiol. (2014) ;229: :834–44. doi: 10.1002/jcp.24510 |
[38] | Lin CJ , Lo UG , Hsieh JT . The regulatory pathways leading to stem-like cells underlie prostate cancer progression. Asian J Androl. (2019) ;21: :233–40. doi: 10.4103/aja.aja_72_18 |
[39] | Nam RK , Benatar T , Amemiya Y , Wallis CJD , Romero JM , Tsagaris M , et al. MicroRNA-652 induces NED in LNCaP and EMT in PC3 prostate cancer cells. Oncotarget. (2018) ;9: :19159–76. doi: 10.18632/oncotarget.24937 |
[40] | Cao F , Liu T , Sun S , Feng S . The role of the miR-99b-5p/mTOR signaling pathway in neuroregeneration in mice following spinal cord injury. Mol Med Rep. (2017) ;16: :9355–60. doi: 10.3892/mmr.2017.7816 |
[41] | Yorimitsu T , Klionsky DJ . Autophagy: molecular machinery for self-eating. Cell Death Differ.. (2005) ;12: (Suppl 2):1542–52. doi: 10.1038/sj.cdd.4401765 |
[42] | Singh SS , Vats S , Chia AY , Tan TZ , Deng S , Ong MS , et al. Dual role of autophagy in hallmarks of cancer. Oncogene. (2018) ;37: :1142–58. doi: 10.1038/s41388-017-0046-6 |
[43] | Rabanal-Ruiz Y , Otten EG , Korolchuk VI . mTORC1 as the main gateway to autophagy. Essays Biochem.. (2017) ;61: :565–84. doi: 10.1042/EBC20170027 |
[44] | Chang PC , Wang TY , Chang YT , Chu CY , Lee CL , Hsu HW , et al. Autophagy pathway is required for IL-6 induced neuroendocrine differentiation and chemoresistance of prostate cancer LNCaP cells. PLoS One. (2014) ;9: :e88556. doi: 10.1371/journal.pone.0088556 |
[45] | Lin TP , Chang YT , Lee SY , Campbell M , Wang TC , Shen SH , et al. REST reduction is essential for hypoxia-induced neuroendocrine differentiation of prostate cancer cells by activating autophagy signaling. Oncotarget. (2016) ;7: :26137–51. doi: 10.18632/oncotarget.8433 |
[46] | Linder S , van der Poel HG , Bergman AM , Zwart W , Prekovic S . Enzalutamide therapy for advanced prostate cancer: efficacy, resistance and beyond. Endocr Relat Cancer. (2018) ;26: :R31–R52. doi: 10.1530/ERC-18-0289 |
[47] | Porkka KP , Pfeiffer MJ , Waltering KK , Vessella RL , Tammela TL , Visakorpi T . MicroRNA expression profiling in prostate cancer. Cancer Res. (2007) ;67: :6130–5. doi: 10.1158/0008-5472.CAN-07-0533 |
[48] | Kaarbo M , Mikkelsen OL , Malerod L , Qu S , Lobert VH , Akgul G , et al. PI3K-AKT-mTOR pathway is dominant over androgen receptor signaling in prostate cancer cells. Anal Cell Pathol. (2010) ;32: :11–27. doi: 10.3233/CLO-2009-0487 |
[49] | Bitting RL , Armstrong AJ . Targeting the PI3K/Akt/mTOR pathway in castration-resistant prostate cancer. Endocr Relat Cancer. (2013) ;20: :R83–99. doi: 10.1530/ERC-12-0394 |
[50] | Watson PA , Arora VK , Sawyers CL . Emerging mechanisms of resistance to androgen receptor inhibitors in prostate cancer. Nat Rev Cancer. (2015) ;15: :701–11. doi: 10.1038/nrc4016 |
[51] | Audet-Walsh E , Dufour CR , Yee T , Zouanat FZ , Yan M , Kalloghlian G , et al. Nuclear mTOR acts as a transcriptional integrator of the androgen signaling pathway in prostate cancer. Genes Dev. (2017) ;31: :1228–42. doi: 10.1101/gad.299958.117 |


