
Bithiophene derivative induced apoptosis and suppression of Akt pathway in mouse leukemic model
Abstract
BACKGROUND:
Bithiophene derivatives show a promising anti-cancer potential. We previously showed that Bithienyl Fluorobenzamidine (BFB) has an anti-proliferative effect against several leukemia cell lines. Acute myeloid leukemia (AML) accounts for 18% of the total leukemia cases worldwide with heavier burden during the past 30 years. Therefore, the main aim remains the discovery of safe and effective medications.
OBJECTIVE:
The current research aims to investigate the anti-cancer efficacy of BFB and its effect on the apoptosis in the 7,12-Dimethylbenz[a]anthracene (DMBA) induced AML in mice.
METHODS:
AML was induced in mice by DMBA and then treated by 2 different doses of BFB. After BFB treatment, the hematological and histological pattern changes was examined. Furthermore, the molecular effect of BFB on apoptosis, cell cycle markers and Protein kinase B (Akt) pathway was examined using qPCR, Western blotting and ELISA.
RESULTS:
BFB treatment ameliorates leukemia histological and hematological markers significantly, despite non-significant changes in normal mice. This improvement exhibits cell cycle arrest and apoptosis induction, represented by elevation of tp53/p53, p21/p21, Caspase3 and downregulation of ckk1/Cdk1 in the bone marrow, as well as Akt pathway suppression.
CONCLUSIONS:
Our results establishes BFB as a promising therapeutic candidate against AML through cell cycle arrest, apoptosis induction and Akt pathway modulation.
List of abbreviations
Akt | Protein kinase B |
ANOVA | Analysis of variance |
ATP | Adenosine triphosphate |
BFB | Bithienyl Fluorobenzamidine |
BM | Bone marrow |
Cdk1 | Cyclin Dependent Kinase 1 |
Cdkn1a | Cyclin Dependent Kinase Inhibitor 1A |
cDNA | complementary DNA |
CV | Central vein |
gapdh | Glyceraldehyde 3-phosphate dehydrogenase |
Hb | Hemoglobin |
LD50 | Median Lethal Dose |
Mdm2 | Mouse double minute 2 homolog |
Meta | Metamyelocytes |
p53 | Tumor protein 53 |
PBS | phosphate buffered saline |
PI3K | Phosphatidylinositol-3-kinase |
PT | Portal tract |
Pten | Phosphatase and tensin homologue deleted on chromosome 10 |
PV | Portal vein |
qPCR | Quantitative real time PCR |
RBCs | Red blood cells |
REC | Research Ethics Committee |
ROS | Reactive oxygen species |
tp53 | Tumor protein 53 gene |
VACSERA | Egyptian Company for Vaccines and Sera |
WBCs | White blood cells |
1Introduction
Leukemias are a complex heterogeneous group of disorders, the classification of which has been aided by advances in diagnostic techniques into myeloid and lymphoid, according to the affected stem cell type [1]. Leukemia has two types, chronic and acute. Acute leukemia is a rapidly progressive type that starts in the bone marrow (BM) and causes large number of white blood cells to be produced and enter the blood stream [2]. Although the risk for cancer is multifactorial and often seems to have confusing causes with no easy cures, a substantial portion of cancer incidence rates is believed to be due to environmental factors [3]. One of the agents which have previously been identified to be responsible for the development of neoplasia is the polycyclic aromatic hydrocarbon (PAH), 7, 12-dimethylbenz[a]anthracene (DMBA), which is an immuno-suppressor as well as a potent carcinogen [4].
In the cell, tumor protein 53 (p53) binds DNA to stimulate the expression of cyclin dependent kinase inhibitor 1A (Cdkn1a; p21), that interacts with a cell division stimulating protein, the cyclin-dependent kinase 1 (CDK1). When p21 is complexed with CDK1 the cell cannot pass to the next stage of cell division. Mutant p53 can no longer bind DNA in an effective way, and as a consequence the p21 protein becomes unavailable to act as the stop signal for cell division. Thus, cells divide uncontrollably, and form tumors [5]. As important components of cell cycle activation and control, the cyclin-dependent kinase (Cdk) protein family contributes to tumor development [6]. It is well known that Cdk1 dysregulation stops cell division [7] and the cell cycle checkpoints should recognize any deviations in DNA replication and induce the repair mechanisms. If the damage is irreparable, p53 is elevated and plays a crucial role in resisting of the carcinogenesis and tumor growth by arresting cell cycle, inducing apoptosis, and/or blocking angiogenesis [8]. The p53 elevation stimulates apoptosis through activating initiator caspases, which in turn activates endonucleases resulting in DNA digestion [9]. Activation of phosphatidylinositol-3-kinase/protein kinase B/ mammalian target of rapamycin (PI3K/Akt/mTOR) is common in 50% –80% of acute myeloid leukemia (AML) cases [10]. Moreover, continuous stimulation of PI3K/Akt pathway has been involved in apoptosis inhibition and cell cycle progression through alteration of tp53 and p21 expression and activation in various types of cancer [10–13]. The PI3K/Akt/mTOR pathway dysregulation and abnormal stimulation lead to high proliferation and survival of the abnormal hematopoietic progenitors (blast cells), which induce leukemia initiation [14]. In addition, associated deletion of phosphatase and tensin homolog (Pten), which acts as an inhibitor for the PI3K/Akt pathway, has been recognized in different leukemia types along with PI3K/Akt pathway sustained activation [15].
The notorious side effects of conventional chemotherapeutic drugs, cytotoxic to both normal and cancerous cells, have been reported previously [16]. Drug resistance is regarded a key mechanism of treatment failure that contributs to AML’s short-term survival and relapse [17]. Thiophene belongs to a class of heterocyclic compounds containing a five membered ring with one sulfur hetero-atom. In medicinal chemistry, thiophene derivatives have been very well known for their therapeutic applications [18]. We have reported that thiophene-based compounds have antimicrobial [19, 20], anti-mutagenic [21], and anticancer [22–24] activities. The bithienyl fluorobenzamidine (BFB) is a novel bithiophene derivative that was previously synthesized and characterized by Hussin et al. (2014) [21]. BFB was reported to have an anti-proliferative effect against several leukemia cell lines, such as CCRF-CEM, HL-60(TB), K-562, MOLT-4, RPMI-8226 and SR cell lines [25]. However, the molecular mechanism of this anti-leukemic activity is not yet fully elucidated. The present study aimed to evaluate the in vivo antitumor activity of BFB and its effect on the apoptosis induction against DMBA-induced AML.
2Materials and methods
2.1Experimental animals
A total of 60 male Swiss albino mice aged 45 days and weighing 25–35 g were purchased from Egyptian Company for Vaccines and Sera (VACSERA, Giza, Egypt). The animals were left for one week without any treatment for adaptation at 22±2°C and 40–60% humidity with alternative 12 h light and dark cycles. The animals were housed in steel mesh cages, ten per each, with water and a commercial pellet diet (Feedmi Company, Cairo, Egypt) ad libitum. The experiment was performed in the animal house at the Department of Zoology, Faculty of Science, Ain Shams University. Research Ethics Committee (REC) for animal research at National Hepatology and Tropical Medicine Research Institute (NHTMRI) has approved the research protocol (A2 -2021).
2.2Experimental design
Treatment dosage was determined according to the median lethal dose (LD50) of BFB, which has been performed according to LeBeau [26] on four doses 8 mg/kg, 13 mg/kg, 16 mg/kg and 20 mg/kg body weight. Briefly, for each dose, twenty adult Swiss albino mice were used (10 males & 10 non-pregnant females) and injected with a 0.1 ml single intraperitoneal (ip) dose of BFB (dissolved in 10% dimethyl sulfoxide (DMSO); Sigma, USA diluted in phosphate buffered saline (PBS). Animals were kept under observation in cages with food and water. Two weeks after BFB injection, mortality was recorded (50% mortality). The observed LD50 was 13 mg/kg body weight.
The mice were randomly divided into six groups as follows:
• Group I (Normal control): 10 mice in this group were kept as control.
• Group II (DMBA treated): 10 mice were given 4 intravenous doses (i.v.) (30 mg/kg body weight) of DMBA (Sigma, USA) in 10% dimethyl sulfoxide (DMSO; Sigma, USA) at intervals of 10 days.
• Group III (BFB -treated 1/10): 10 mice were given 4 i.v. doses (30 mg/kg body weight) of DMBA in 10% DMSO at 10 days intervals, followed by administration of 17 intraperitoneal (i.p) doses of LD501/10 BFB in 10% DMSO over a month.
• Group IV (BFB -treated 1/5): 10 mice were given 4 i.v. doses (30 mg/kg body weight) of DMBA in 10% DMSO at 10 days intervals, followed by administration of 17 intraperitoneal (i.p) doses of LD501/5 BFB in 10% DMSO over a month.
• Group V (BFB -control 1/10): 10 mice were administrated with 17 intraperitoneal (i.p.) doses of LD501/10 BFB in 10% DMSO over a month at the 105th day after birth.
• Group VI (BFB -control 1/5): 10 mice were administrated with 17 i.p. doses of LD501/5 BFB in 10% DMSO over a month at the 105th day after birth.
The chemical structure of the BFB [21, 25] and the timeline of treatment are shown in Fig. 1.
Fig. 1
A) Schematic diagram of experimental design and B) Structure of Bithienyl fluorobenzamidine derivative (BFB) [25].
![A) Schematic diagram of experimental design and B) Structure of Bithienyl fluorobenzamidine derivative (BFB) [25].](https://content.iospress.com:443/media/tub/2022/44-1/tub-44-1-tub211538/tub-44-tub211538-g001.jpg)
2.3Bone marrow and blood sample collection
At the end of the experimental period, all animals were fasted for 12 hours, weighed and sacrificed using diethyl ether; blood was collected via heart puncture. Whole blood was collected on EDTA for hematological study including complete blood count (CBC) and preparation of blood smears. Both femurs were removed immediately; one was used for the preparation of BM smear. The BM was flushed out and stored at -80°C for the molecular analysis.
2.4Histopathological examination
Liver and spleen from different groups were weighed and fixed in 10% formalin solution (El Nasr Pharmaceutical Chemicals, Egypt). The samples then embedded in paraffin blocks and 4μm sections were cut for hematoxylin-eosin (H&E) staining (Sigma, USA). Examination of the slides was performed under light microscope (Olympus, Japan).
2.5Reverse-transcription quantitative polymerase chain reaction (RT-qPCR)
Total RNA was extracted from BM using RNeasy Mini Kit according to the manufacturer’s instructions (Qiagen, Germany). The purity of the extracted RNA was assessed at 260/280 nm using the UV-spectrophotometer (PG Instruments Limited, England). A total of 1μg of RNA was reverse transcribed into a single-stranded complementary DNA (cDNA) using (High-Capacity cDNA Reverse Transcription Kit Applied Biosystems, Life Technologies, USA). cDNA synthesis was performed using Gene Amp PCR System 9700 Applied Biosystems (Life Technologies, USA). The relative expression levels of tp53, cdk1 and p21 genes were assessed in BM by quantitative real time PCR (qPCR) using SYBR green master mix (Maxima SYBR Green/ROX qPCR Master Mix (Thermofisher Scientific, USA). Glyceraldehyde 3-phosphate dehydrogenase (gapdh) was used as a housekeeping gene for normalizing mRNA expression. qPCR was performed in an optical 96-well plate using thermal cycler (Agilent Stratagene MX3000P, USA) and cycling conditions (10 min at 95°C, followed by 40 cycles at 95°C for 15 sec, 60°C for 60 sec and 72°C for 15 sec). Primers for qPCR were obtained from (Invitrogen, Belgium) and are listed in Table 1. Gene expression was expressed as fold change (RQ = 2-ΔΔCT).
Table 1
Primers used for qPCR
| Gene symbol | Primers Sequence |
| tp53 | Forward primer: 5′-AAACTACTTCCTCCAGAAGATAT-3′ |
| Reverse primer: 5′-GCTTCACTTGGGCCTTCAAA-3′ | |
| cdk1 | Forward primer: 5′-AAATATAGTCAGCCTGCAGGAT-3′ |
| Reverse primer: 5′-AGTAACTCTTAACGAGTGAAGAAT-3′ | |
| p21 | Forward primer: 5′-GTACTTCCTCTGCCCTGCT-3′ |
| Reverse primer: 5′-TTGGAGTGATAGAAATCTGTCA-3′ | |
| gapdh | Forward primer: 5′-GCATCTTGGGCTACACTGAG-3′ |
| Reverse primer: 5′-TATTCATTGTCATACCAGGAAATG-3′ |
2.6Enzyme linked immunosorbent assay (ELISA)
BM homogenate was prepared as previously mentioned in [27], then p53 was assayed using an ELISA kit provided by MyBioSource (USA) (Cat. No. MBS721665), cyclin-dependent kinase 1 (Cdk1) was assayed using an ELISA kit provided by ELISAGenie (UK) (Cat. No. MOEB1754), p21 was assayed using an ELISA kit provided by MyBioSource (USA) (Cat. No. MBS2510310) and Caspase 3 was assayed using an ELISA kit provided by CUSABIO (USA) (Cat. No. CSB-E08858m), according to the manufacturer instructions.
2.7Immunoblotting investigation (Western blot)
Determination of relative protein expression of protein kinase (pAkt) and phosphatase and tensin homolog (Pten) was performed by Western blotting. Proteins were extracted from bone marrow and their concentration were measured according to [28]. Equal amounts of proteins were loaded onto an SDS-PAGE. Separated proteins were electroblotted to a nitrocellulose membrane (PVDF), then membranes were incubated with a specific antibody recognizing the target proteins, and subsequently with a HRP-conjugated secondary antibody. Proteins were detected through an optical documentation system, and band intensities were quantified using a densitometer to determine specific protein levels. β-actin was used as an internal loading control protein.
2.8Statistical analysis
Statistical analysis was performed using the Statistical Package for Social Science version 20 for Windows (SPSS software package, Chicago, USA). Distribution of data was tested using the Kolmogorov-Smirnov test. Individual data in experimental groups are presented as the mean±SD and their 95% confidence intervals were obtained by nonlinear regression. To compare the difference between the groups, post hoc testing was performed by Tukey’s test for multiple comparisons between the different treated groups and their respective controls. P values were considered significant at p < 0.05. The percentage of change was calculated in comparison with the normal control.
3Results
3.1BFB ameliorates the resulted hepatosplenomegaly and total body weight loss in leukemic mice
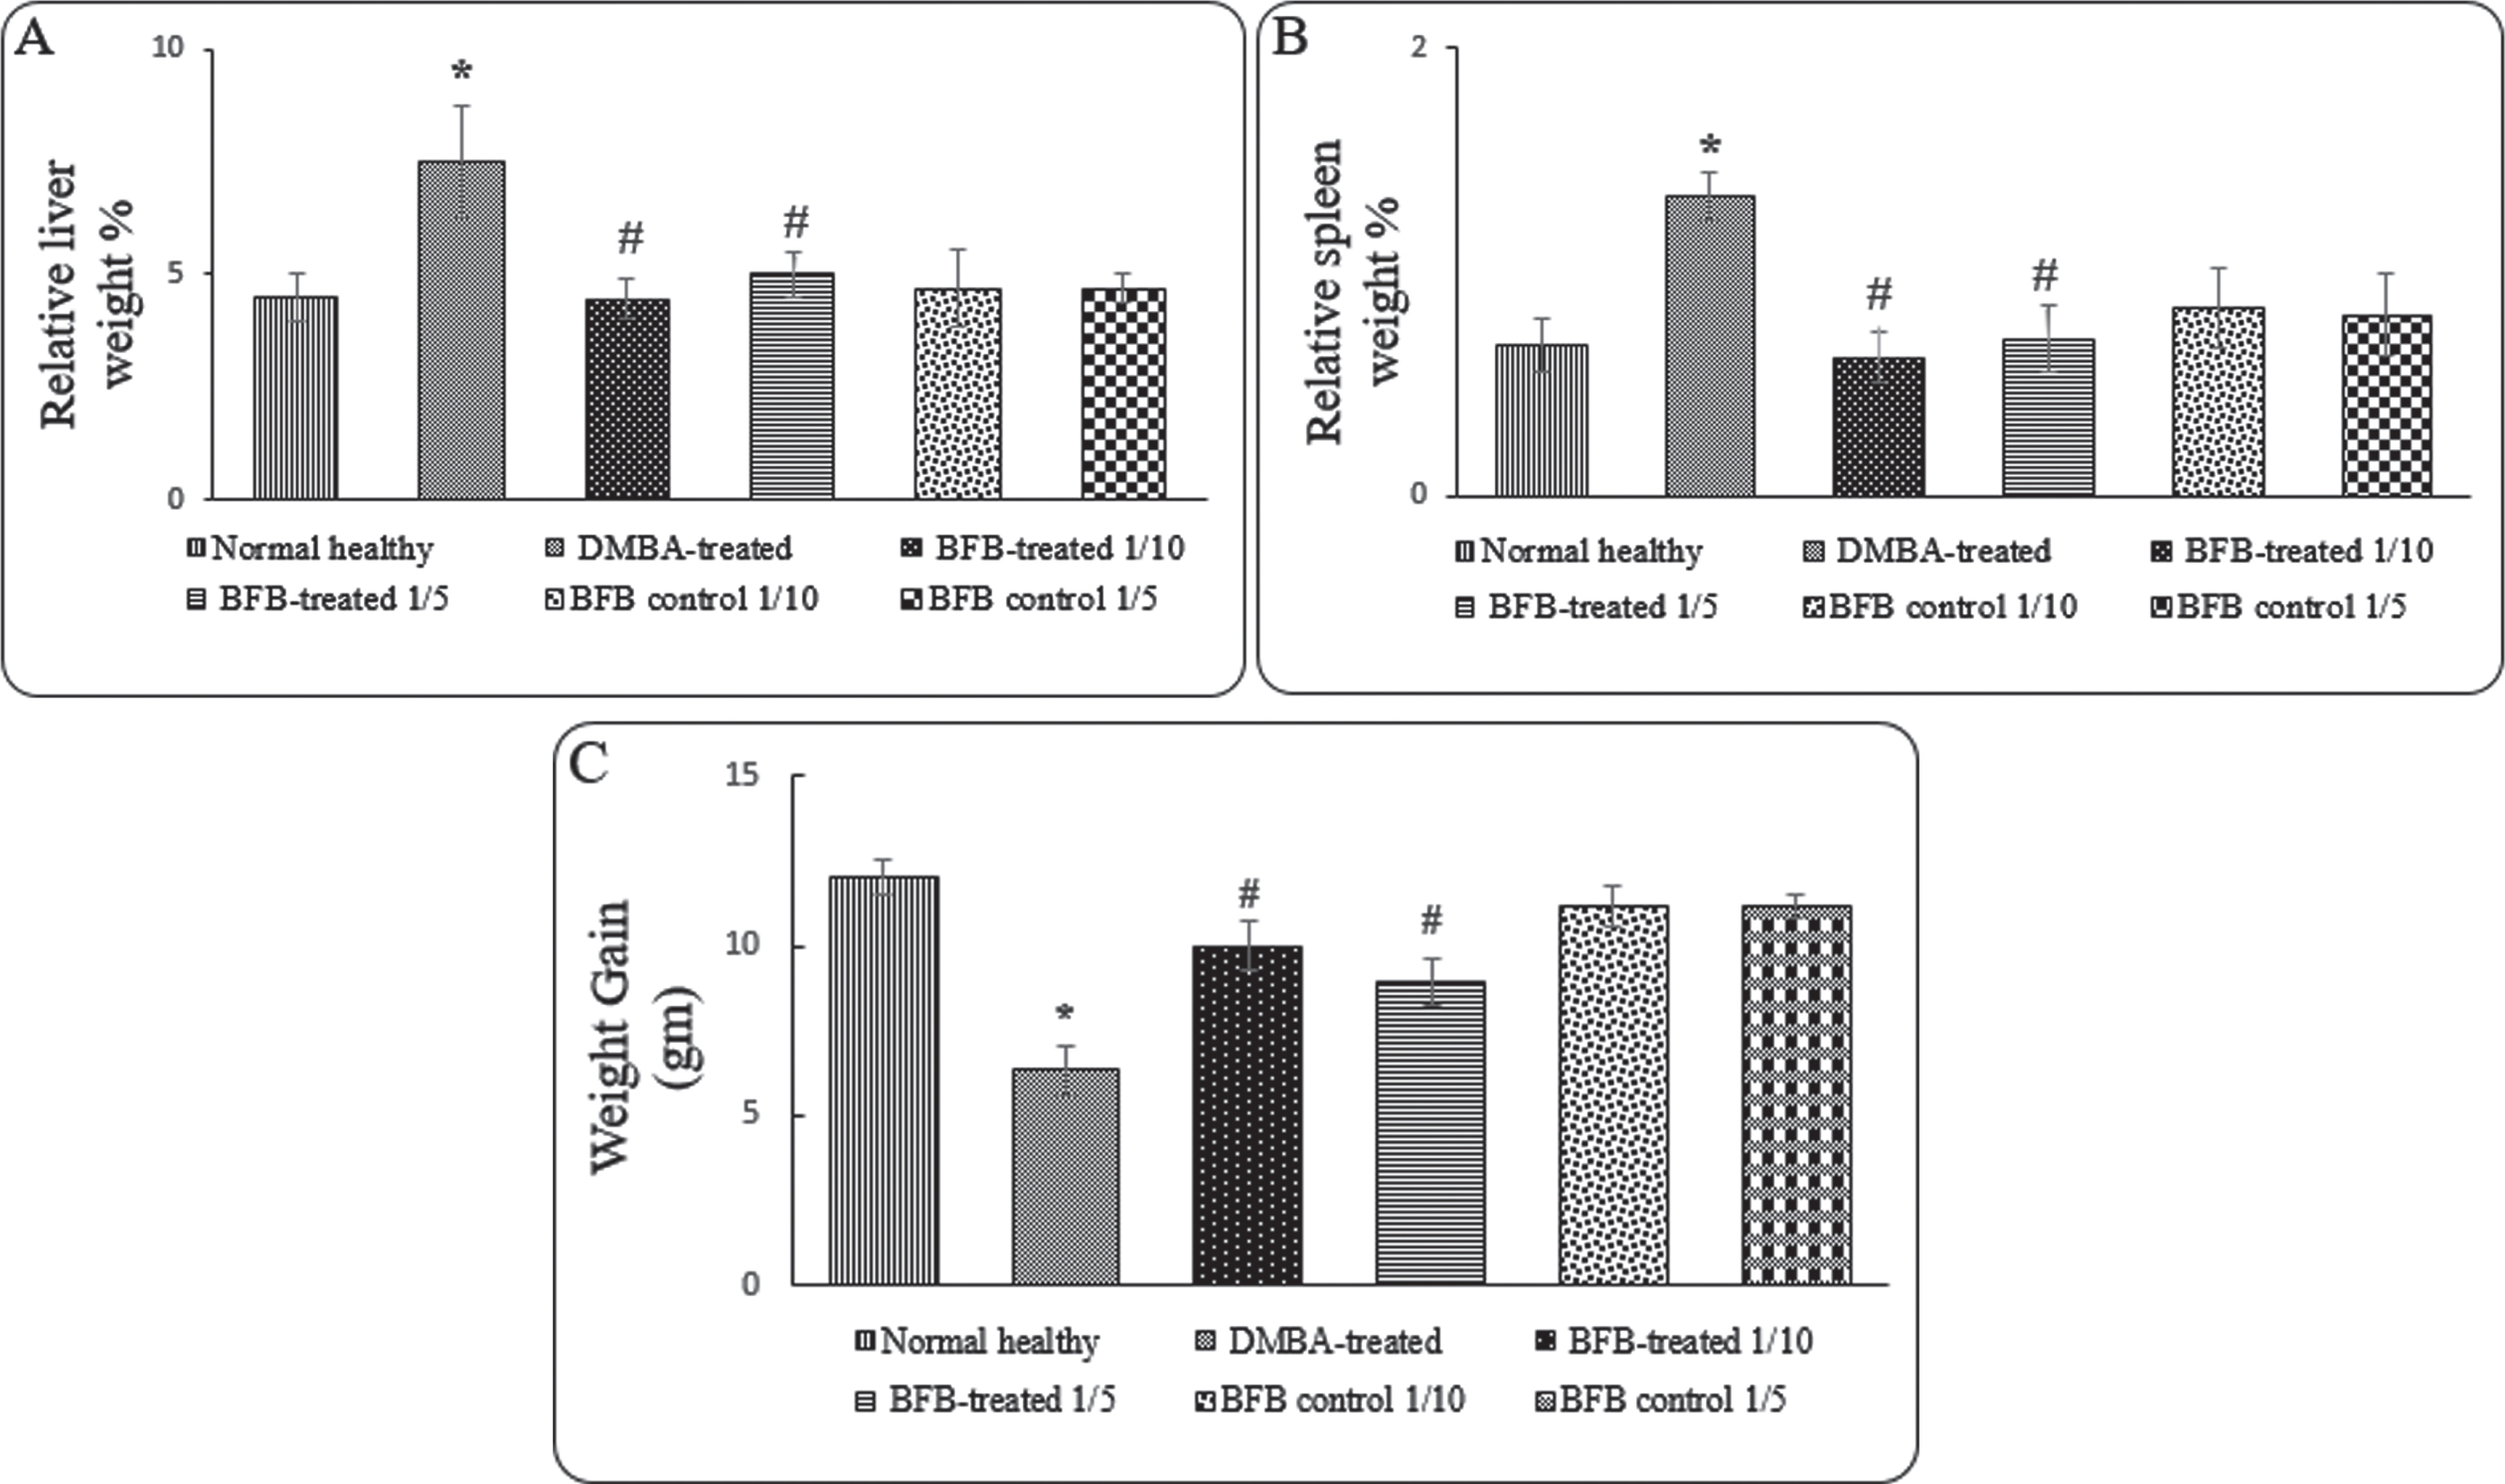
Administration of BFB with both doses to DMBA-treated mice causes significant (p < 0.05) reduction in relative liver (Fig. 2A) and spleen weight (Fig. 2B), but a significant gain in total body weight (Fig. 2C) compared to DMBA-treated group. On the contrary, DMBA-treated mice showed a significant increase in relative liver (66%, p < 0.05) (Fig. 2A) and spleen (100%, p < 0.05) weight (Fig. 2B), which indicates hepatosplenomegaly occurrence concomitant with a significant reduction (p < 0.05) in body weight (Fig. 2C).
Fig. 2
Effect of treatments on the relative organ weights of A) liver, B) spleen and C) total weight gain. Data are represented as Mean±SD, n = 10. (*) denotes significance (p < 0.05) against normal control and (#), denotes significance (p < 0.05) against DMBA-treated positive control.
3.2BFB improves the hematological and histological parameters in leukemic mice
To investigate the hematological effect of BFB treatment, BM smear examination and CBC were carried out. In comparison to DMBA-treated mice, which showed significant elevation of myeloid/erythroid ratio denoting the occurrence of AML, administration of BFB with both doses to DMBA-treated mice reversed the DMBA action causing a significant increase of lymphocytes and metamyelocytes (Meta) & band cells (p < 0.05) (Fig. 3A), in addition to significant reduction (p < 0.05) in myeloid/erythroid ratio (Fig. 3B). Table 2 shows the effect of DMBA and BFB on hematological parameters in the complete blood count (CBC). Treatment with both doses of (BFB) significantly (p < 0.05) alleviated DMBA effects of the significant reduction (p < 0.05) in red blood cells (RBCs), white blood cells (WBCs), platelet counts and in hemoglobin (Hb) as compared to normal healthy group.
Fig. 3
Effect of treatments on BM hematological cells count A) Lymphocytes and Metamyelocyte & Band cells, B) Myeloid / Erythroid ratio. Data are represented as Mean±SD, n = 10. (*) denotes significance (p < 0.05) against normal control, (#) denotes significance (p < 0.05) against DMBA-treated group. Data are represented as Mean±SD (standard deviation), (*) denotes significance (p < 0.05) against normal healthy control, (#) denotes significance (p < 0.05) against DMBA-treated positive control.
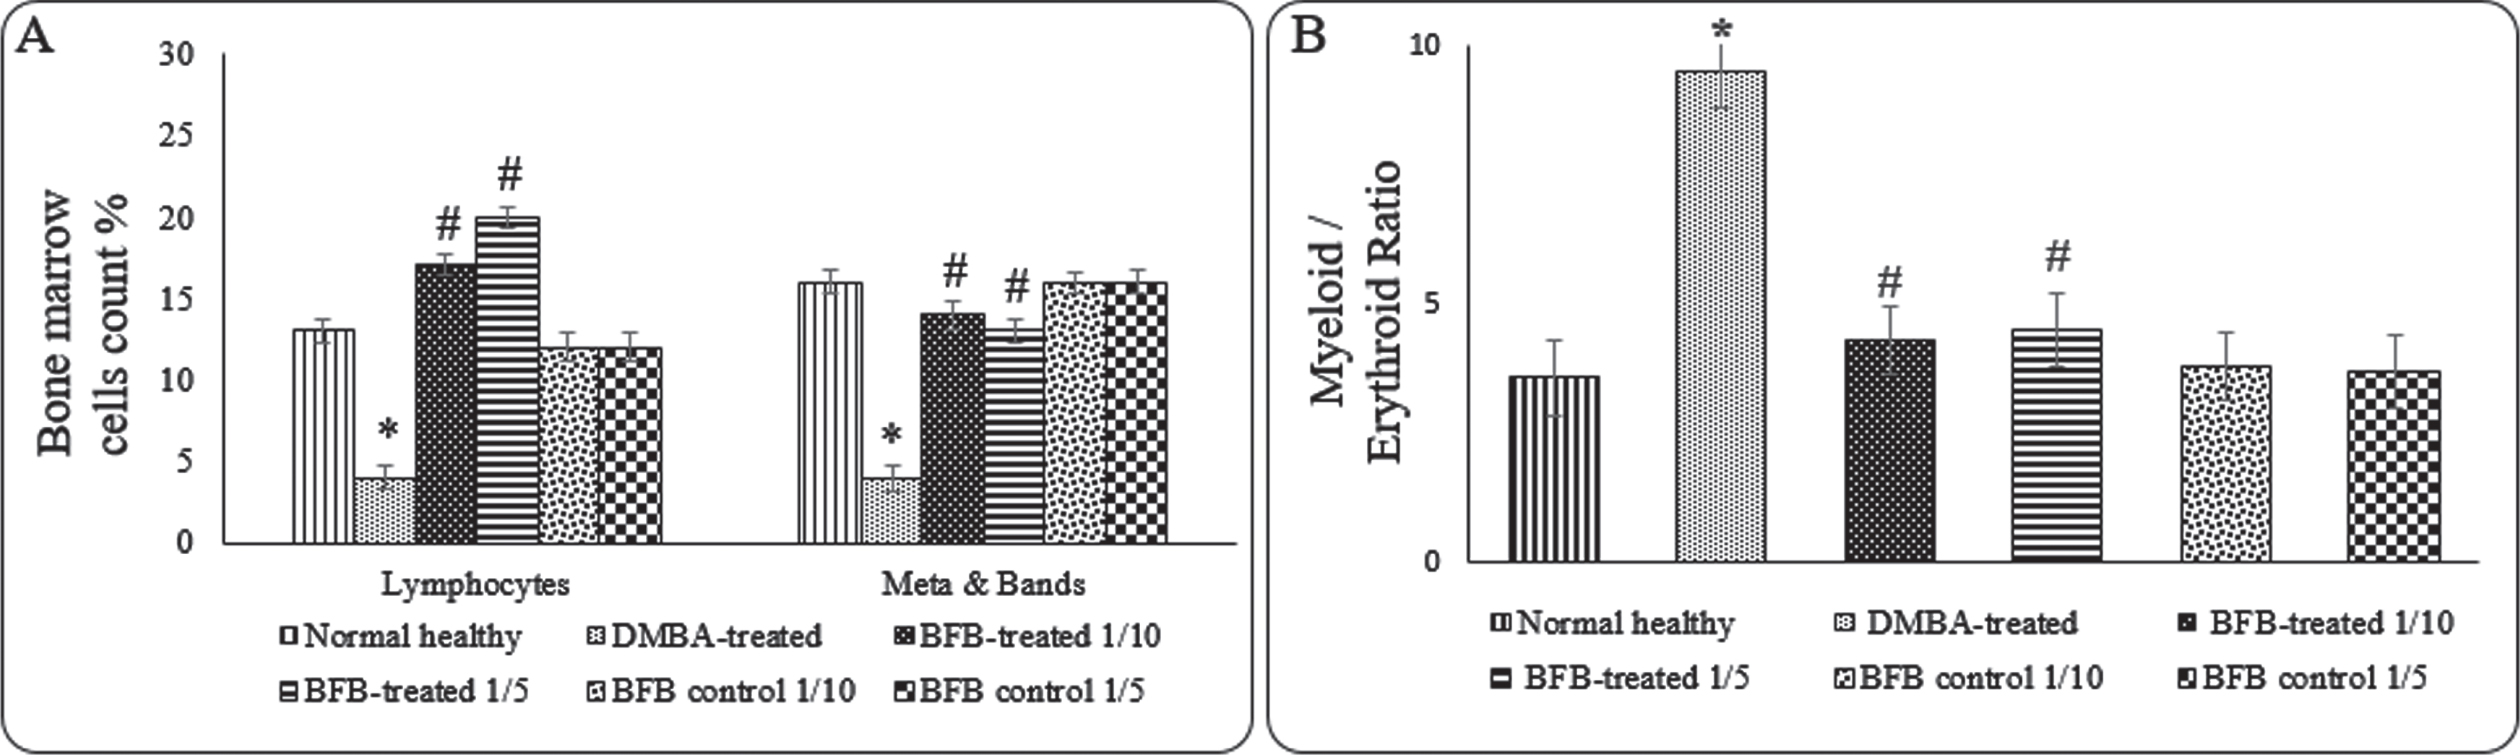
Table 2
Effect of treatments on WBCs, RBCs, Platelets count and Hb content
| Group | WBCs (103/mm3) | RBCs (106/mm3) | Hb (g/dL) | Platelets (105/mm3) |
| Normal healthy | ||||
| Mean±SD | 8.78±0.49 | 8.27±0.26 | 13.17±0.48 | 6.87±0.22 |
| DMBA-treated | ||||
| Mean±SD | 3.91±0.29* | 5±0.37* | 10.1±0.38* | 4.62±0.33* |
| BFB -treated 1/10 | ||||
| Mean±SD | 6.98±0.32# | 6.71±0.44# | 11.9±0.28# | 5.83±0.25# |
| BFB -treated 1/5 | ||||
| Mean±SD | 7±0.33# | 6.63±0.42# | 11.35±0.31# | 5.68±0.35# |
| BFB control 1/10 | ||||
| Mean±SD | 9.49±0.41 | 8.12±0.32 | 12.71±0.48 | 6.37±0.38 |
| BFB control 1/5 | ||||
| Mean±SD | 9.39±0.6 | 8±0.21 | 12.12±0.39 | 6.47±0.47 |
To investigate the histological effect of the BFB treatment on the liver and spleen, sections of both organs stained with H&E were examined (Fig. 4 & 5, Tables 3 & 4). BFB showed a significant amelioration in both liver and spleen histology in leukemic mice after treatment with both doses. Leukemic mice (DMBA-treated) showed dilated portal veins (Fig. 4B) and noticeable infiltration of markedly pleomorphic leukemic cells with large nuclei and prominent eosinophilic nucleoli in portal tracts and in blood sinusoid. There was mildly dilated central vein with minimal leukemic infiltrate in peri-venular area, preserved hepatocytes in the interface area (peri-portal area) and apoptotic hepatocytes in per-venular area (Fig. 4C). Treatment of leukemic mice with LD501/10 of BFB for a month showed mildly dilated central and portal veins and mild leukemic infiltrate in portal tracts (Fig. 4D), blood sinusoids and in peri-venular area. There were also distinct apoptotic hepatocytes in peri-venular and peri-portal areas (Fig. 4E). Treatment of leukemic mice with LD501/5 BFB for a month showed average central vein (Fig. 4F) with mild leukemic infiltrate in peri-venular area. In addition, mildly dilated portal veins and surrounding hepatocytes showing scattered apoptosis, karyomegaly and bi-nucleation have been observed (Fig. 4G).
Fig. 4
Photos of liver sections stained with hematoxylin and eosin. (A) Normal healthy group showing average CV (black arrows) with average PT showing average BD (red arrow) and average PV (blue arrow) (H&E x200). (B) DMBA-treated group showing dilated PV with marked leukemic infiltrate in PT (black arrows) and in blood sinusoids (red arrow) (H&E x200). (C) DMBA-treated group showing markedly pleomorphic leukemic cells (black arrows) with large nuclei and prominent eosinophilic nucleoli (red arrows), and preserved hepatocytes in the interface area (blue arrow) (H&E x1000). (D) BFB -treated 1/10 group showing average CV and mildly dilated PV (black arrows) with mild leukemic infiltrate in PT (red arrow) (H&E x200). (E) BFB -treated 1/10 group showing dilated CV with markedly apoptotic hepatocytes in perivenular area (black arrows) (H&E x400). (F) BFB -treated 1/5 group showing CV (black arrow) and mildly dilated PV (H&E x200). (G) BFB -treated 1/5 group showing average CV with scattered apoptotic (black arrow) and bi-nucleated hepatocytes (blue arrow) with mild leukemic infiltrate (red arrow) (H&E x400). (H) BFB control 1/10 group showing dilated CV with detached lining (black arrow) and mildly apoptotic hepatocytes in peri-venular area (blue arrow) with intra-parenchymal inflammatory infiltrate (red arrow) (H&E x200). (I) BFB control 1/5 group showing dilated CV with detached lining (black arrow) and dilated PV with apoptotic hepatocytes more marked in peri-venular area (blue arrow) (H&E x200).
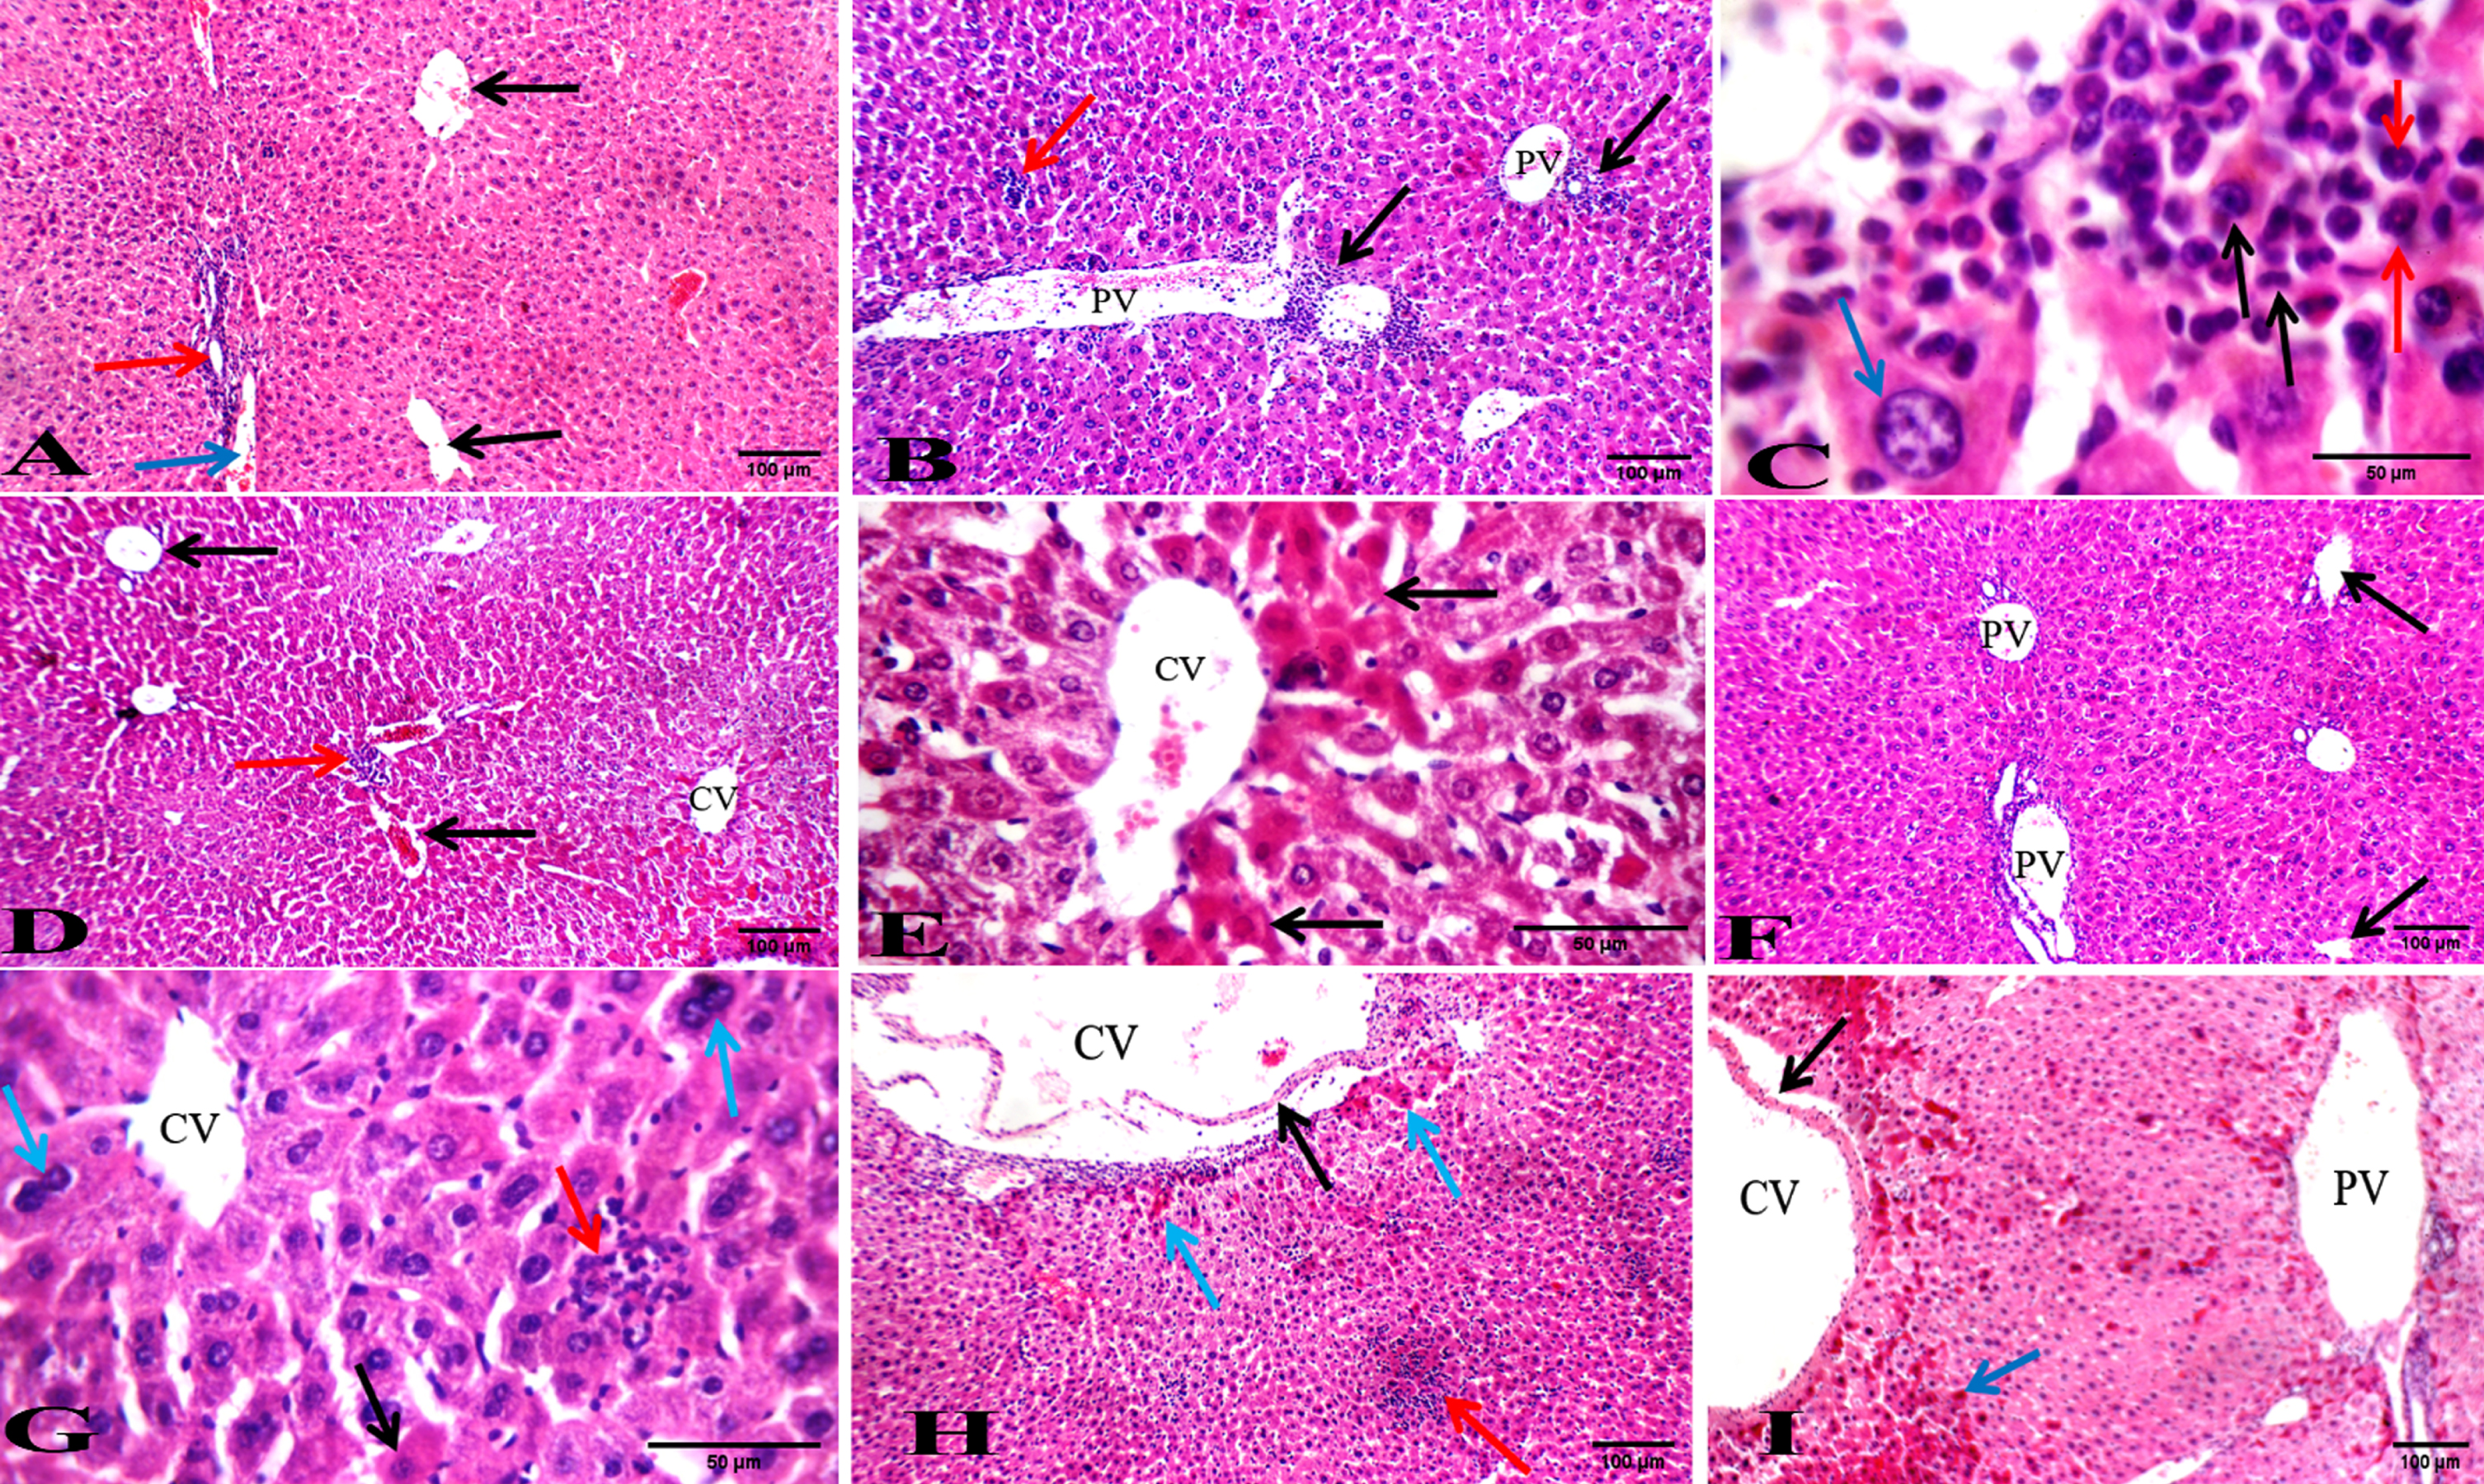
Fig. 5
Photos of spleen sections stained with hematoxylin and eosin. (A) Normal healthy group showing average lymphoid follicle (white bulb) with central arteriole (black arrow) and average blood sinusoids (red bulb) (red arrow) (H&E X200). (B) DMBA-treated group showing atrophied lymphoid follicles (black arrows) with markedly expanded red bulb showing leukemic cells with large nuclei (red arrows) (H&E X200). (C) DMBA-treated group showing part of atrophied lymphoid follicles with central arteriole (black arrow) and markedly expanded red bulb with leukemic blast cells with large convoluted nuclei (red arrows) (H&E X400). (D) BFB -treated 1/10 group showing average lymphoid follicles (white bulb) (black arrows) with mildly expanded red bulb (red arrow) (H&E X200). (E) BFB -treated 1/10 group showing expanded red bulb with leukemic infiltrate showing most of blast cells with faint apoptotic nuclei (black arrows) (H&E X400). (F) BFB -treated 1/5 group showing average lymphoid follicles with central arterioles (black arrows) and mildly expanded red bulb (red arrow) (H&E X200). (G) BFB -treated 1/5 group showing expanded red bulb showing necrotic cells (black arrow) with scattered bi-nucleated and multi-nucleated giant cells (red arrows) (H&E X400). (H) BFB control 1/10 group showing average lymphoid follicles (black arrows) with mildly expanded red bulb showing areas of necrosis (red arrow), and extra-capsular inflammatory infiltrate (blue arrow) (H&E X200). (I) BFB control 1/5 group showing red bulb with areas of necrosis (black arrows) and extra capsular inflammatory infiltrate (red arrow) (H&E X400). (J) BFB control 1/5 group showing atrophied lymphoid follicles (black arrow) with markedly expanded red bulb showing areas of necrosis (red arrows) (H&E X 200).
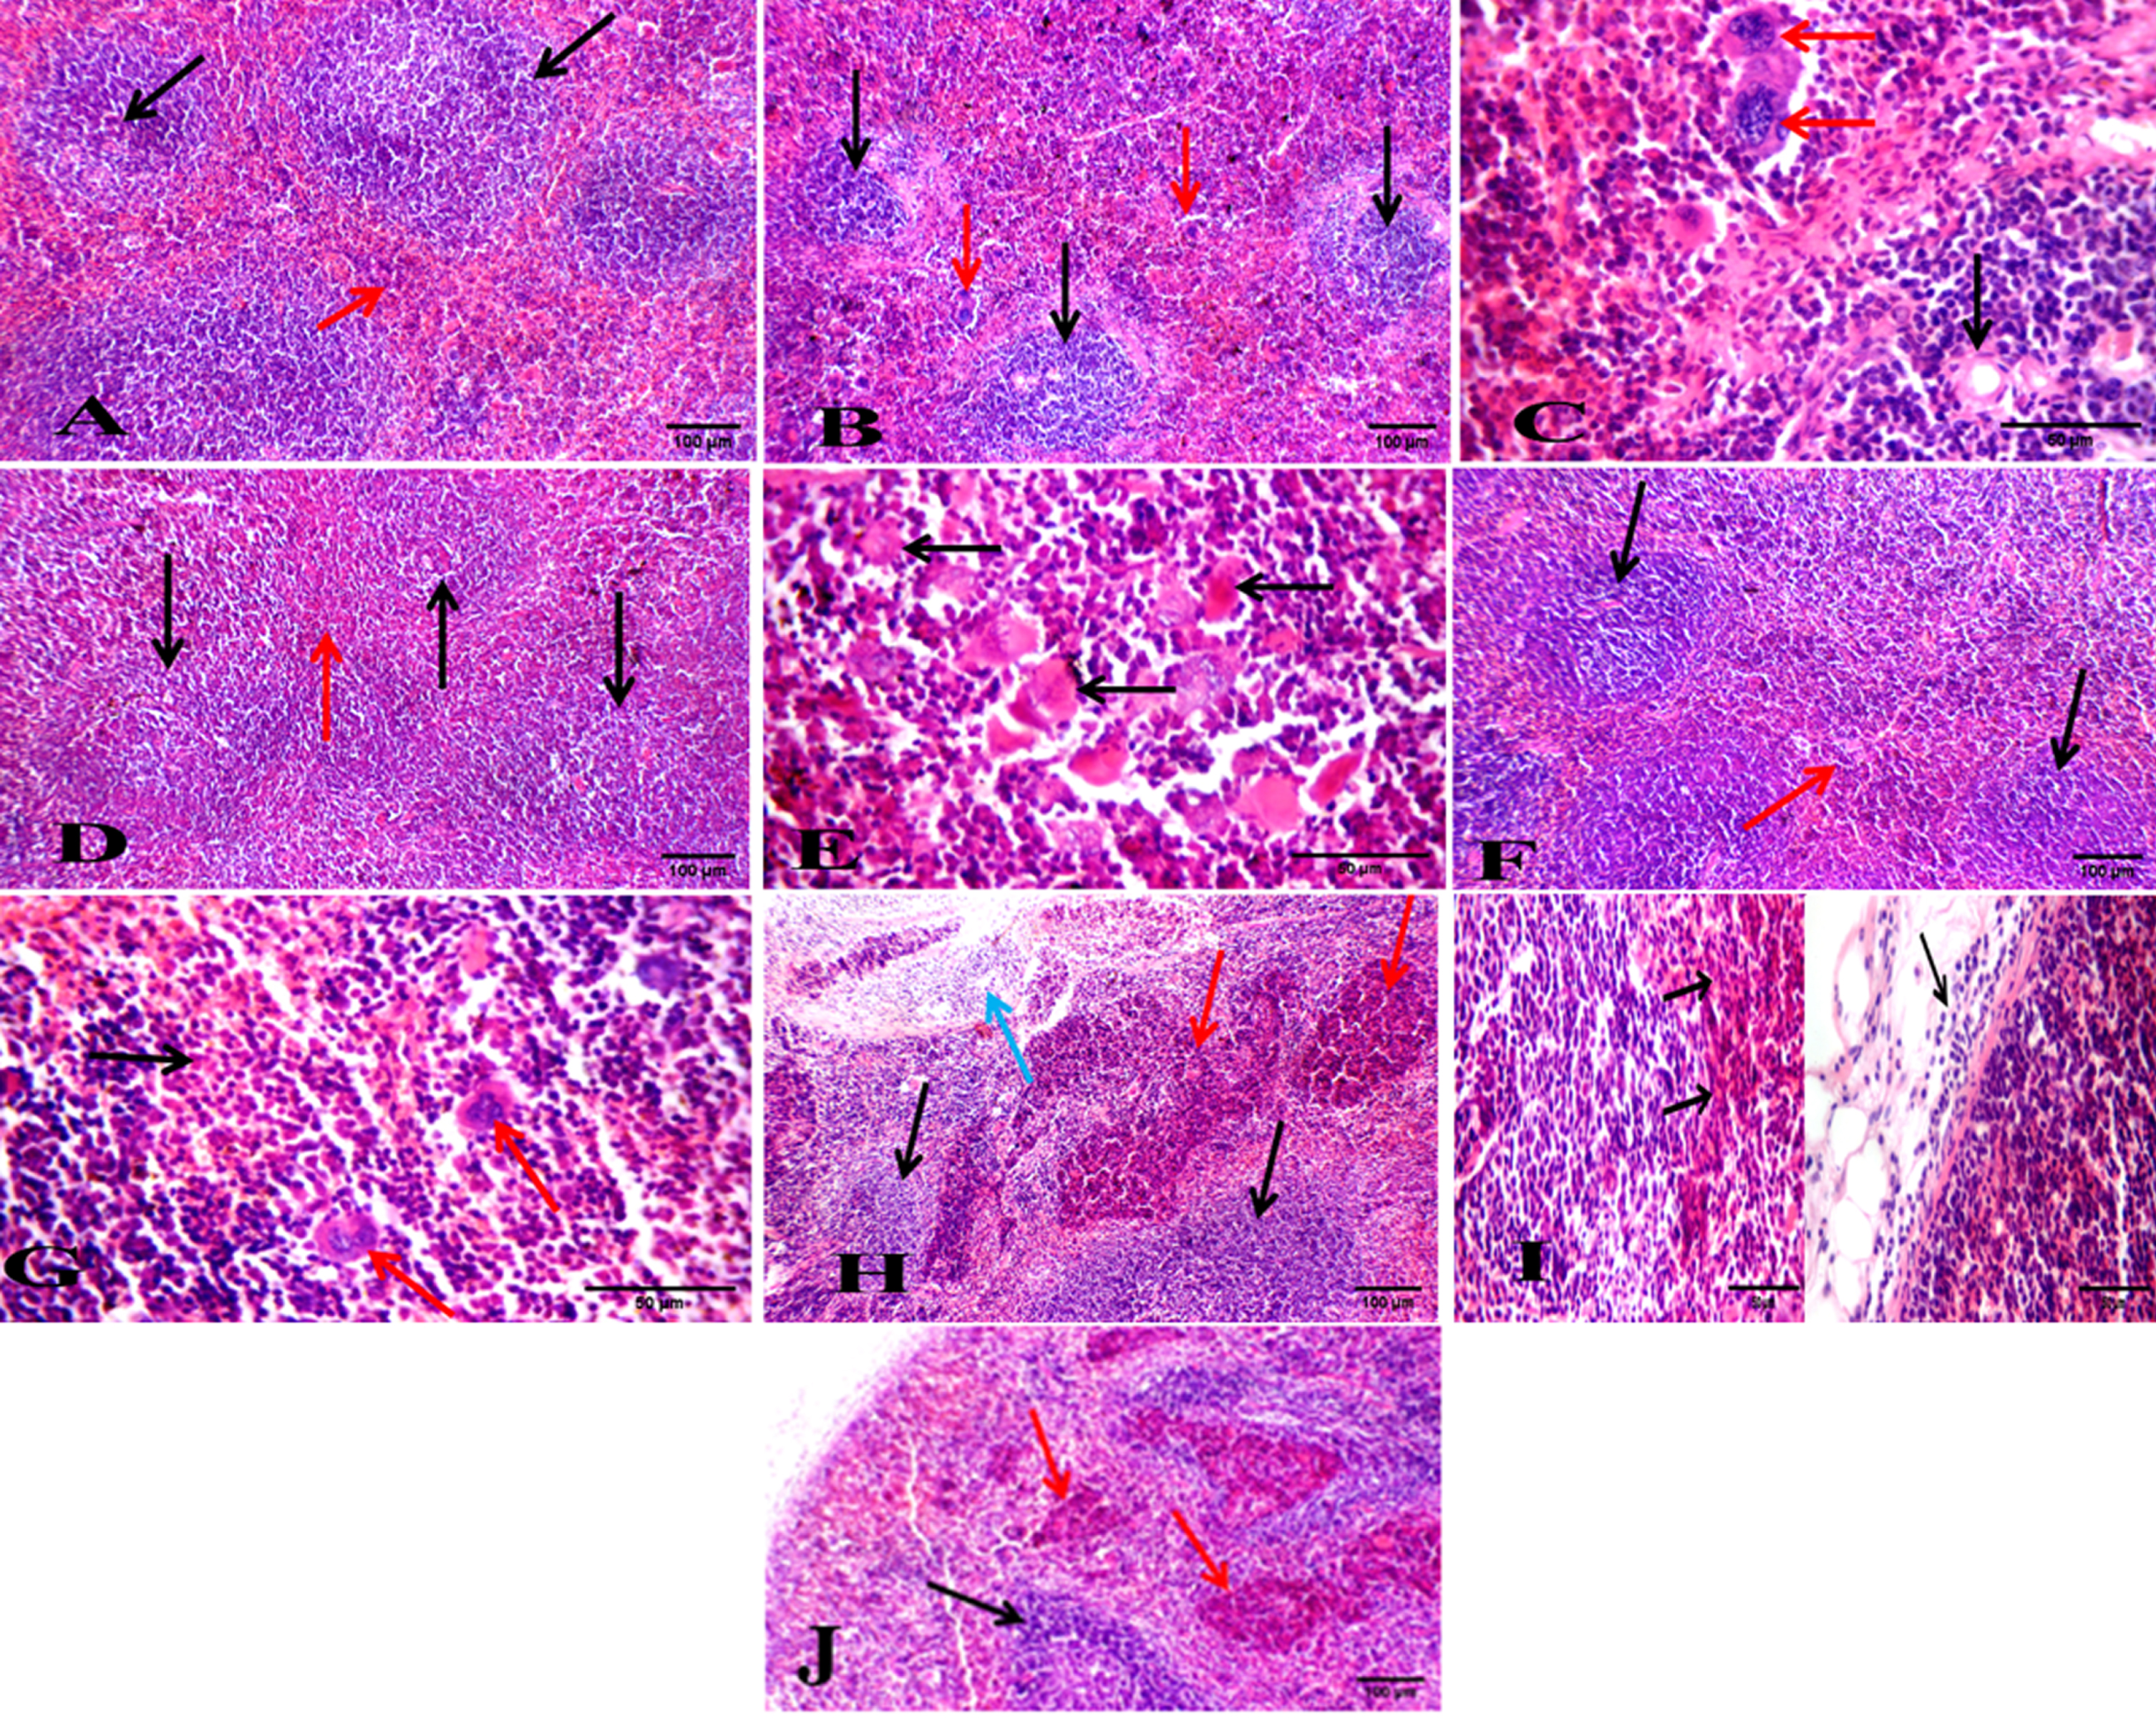
Table 3
Summary of the histologic abnormalities in liver of the different studied groups
| Abnormalities | Normal healthy | DMBA-treated positive control | BFB-treated 1∖10 | BFB-treated 1∖5 | BFB control 1∖10 | BFB control 1∖5 |
| Dilated central vein | None | +++ | + | None | ++ | ++ |
| Expanded portal tract | None | + | None | None | + | + |
| Dilated portal vein | None | +++ | + | + | + | + |
| Karyomegaly hepatocyte | None | None | None | + | None | None |
| Inflammatory infiltration | None | None | None | None | + | + |
| Binucleation | None | None | None | + | None | None |
| Leukemic infiltration | None | +++ | + | + | None | None |
| Apoptotic hepatocytes | None | ++ | +++ | +++ | + | + |
+ means mild, ++ means moderate, +++ means severe.
Table 4
Summary of the histologic abnormalities in spleen of the different studied groups
| Abnormalities | Normal healthy | DMBA-treated positive control | BFB-treated 1∖10 | BFB-treated 1∖5 | BFB control 1∖10 | BFB control 1∖5 |
| Atrophied lymphoid follicles | None | ++ | None | None | None | None |
| Expanded red bulb | None | ++ | + | + | + | + |
| Pleomorphic blast cells | None | ++ | None | + | None | None |
| Inflammatory infiltration | None | None | None | None | + | + |
| Leukemic infiltration | None | ++ | + | + | None | None |
| Necrotic cells | None | None | + | ++ | + | + |
+ means mild, ++ means moderate.
Spleen sections of DMBA-treated mice showed atrophied lymphoid follicles with markedly expanded red bulb infiltrated by distinct large pleomorphic leukemic blast cells (Fig. 5B & 5C) compared to normal healthy group sections (Fig. 5A). Administration of BFB in both doses to DMBA-treated mice ameliorated the spleen tissue architecture by showing average lymphoid follicles and mildly expanded red bulb with leukemic infiltrate showing few blast cells with faint and apoptotic nuclei, and scattered necrotic cells (Fig. 5D, 5E, 5F and 5G).
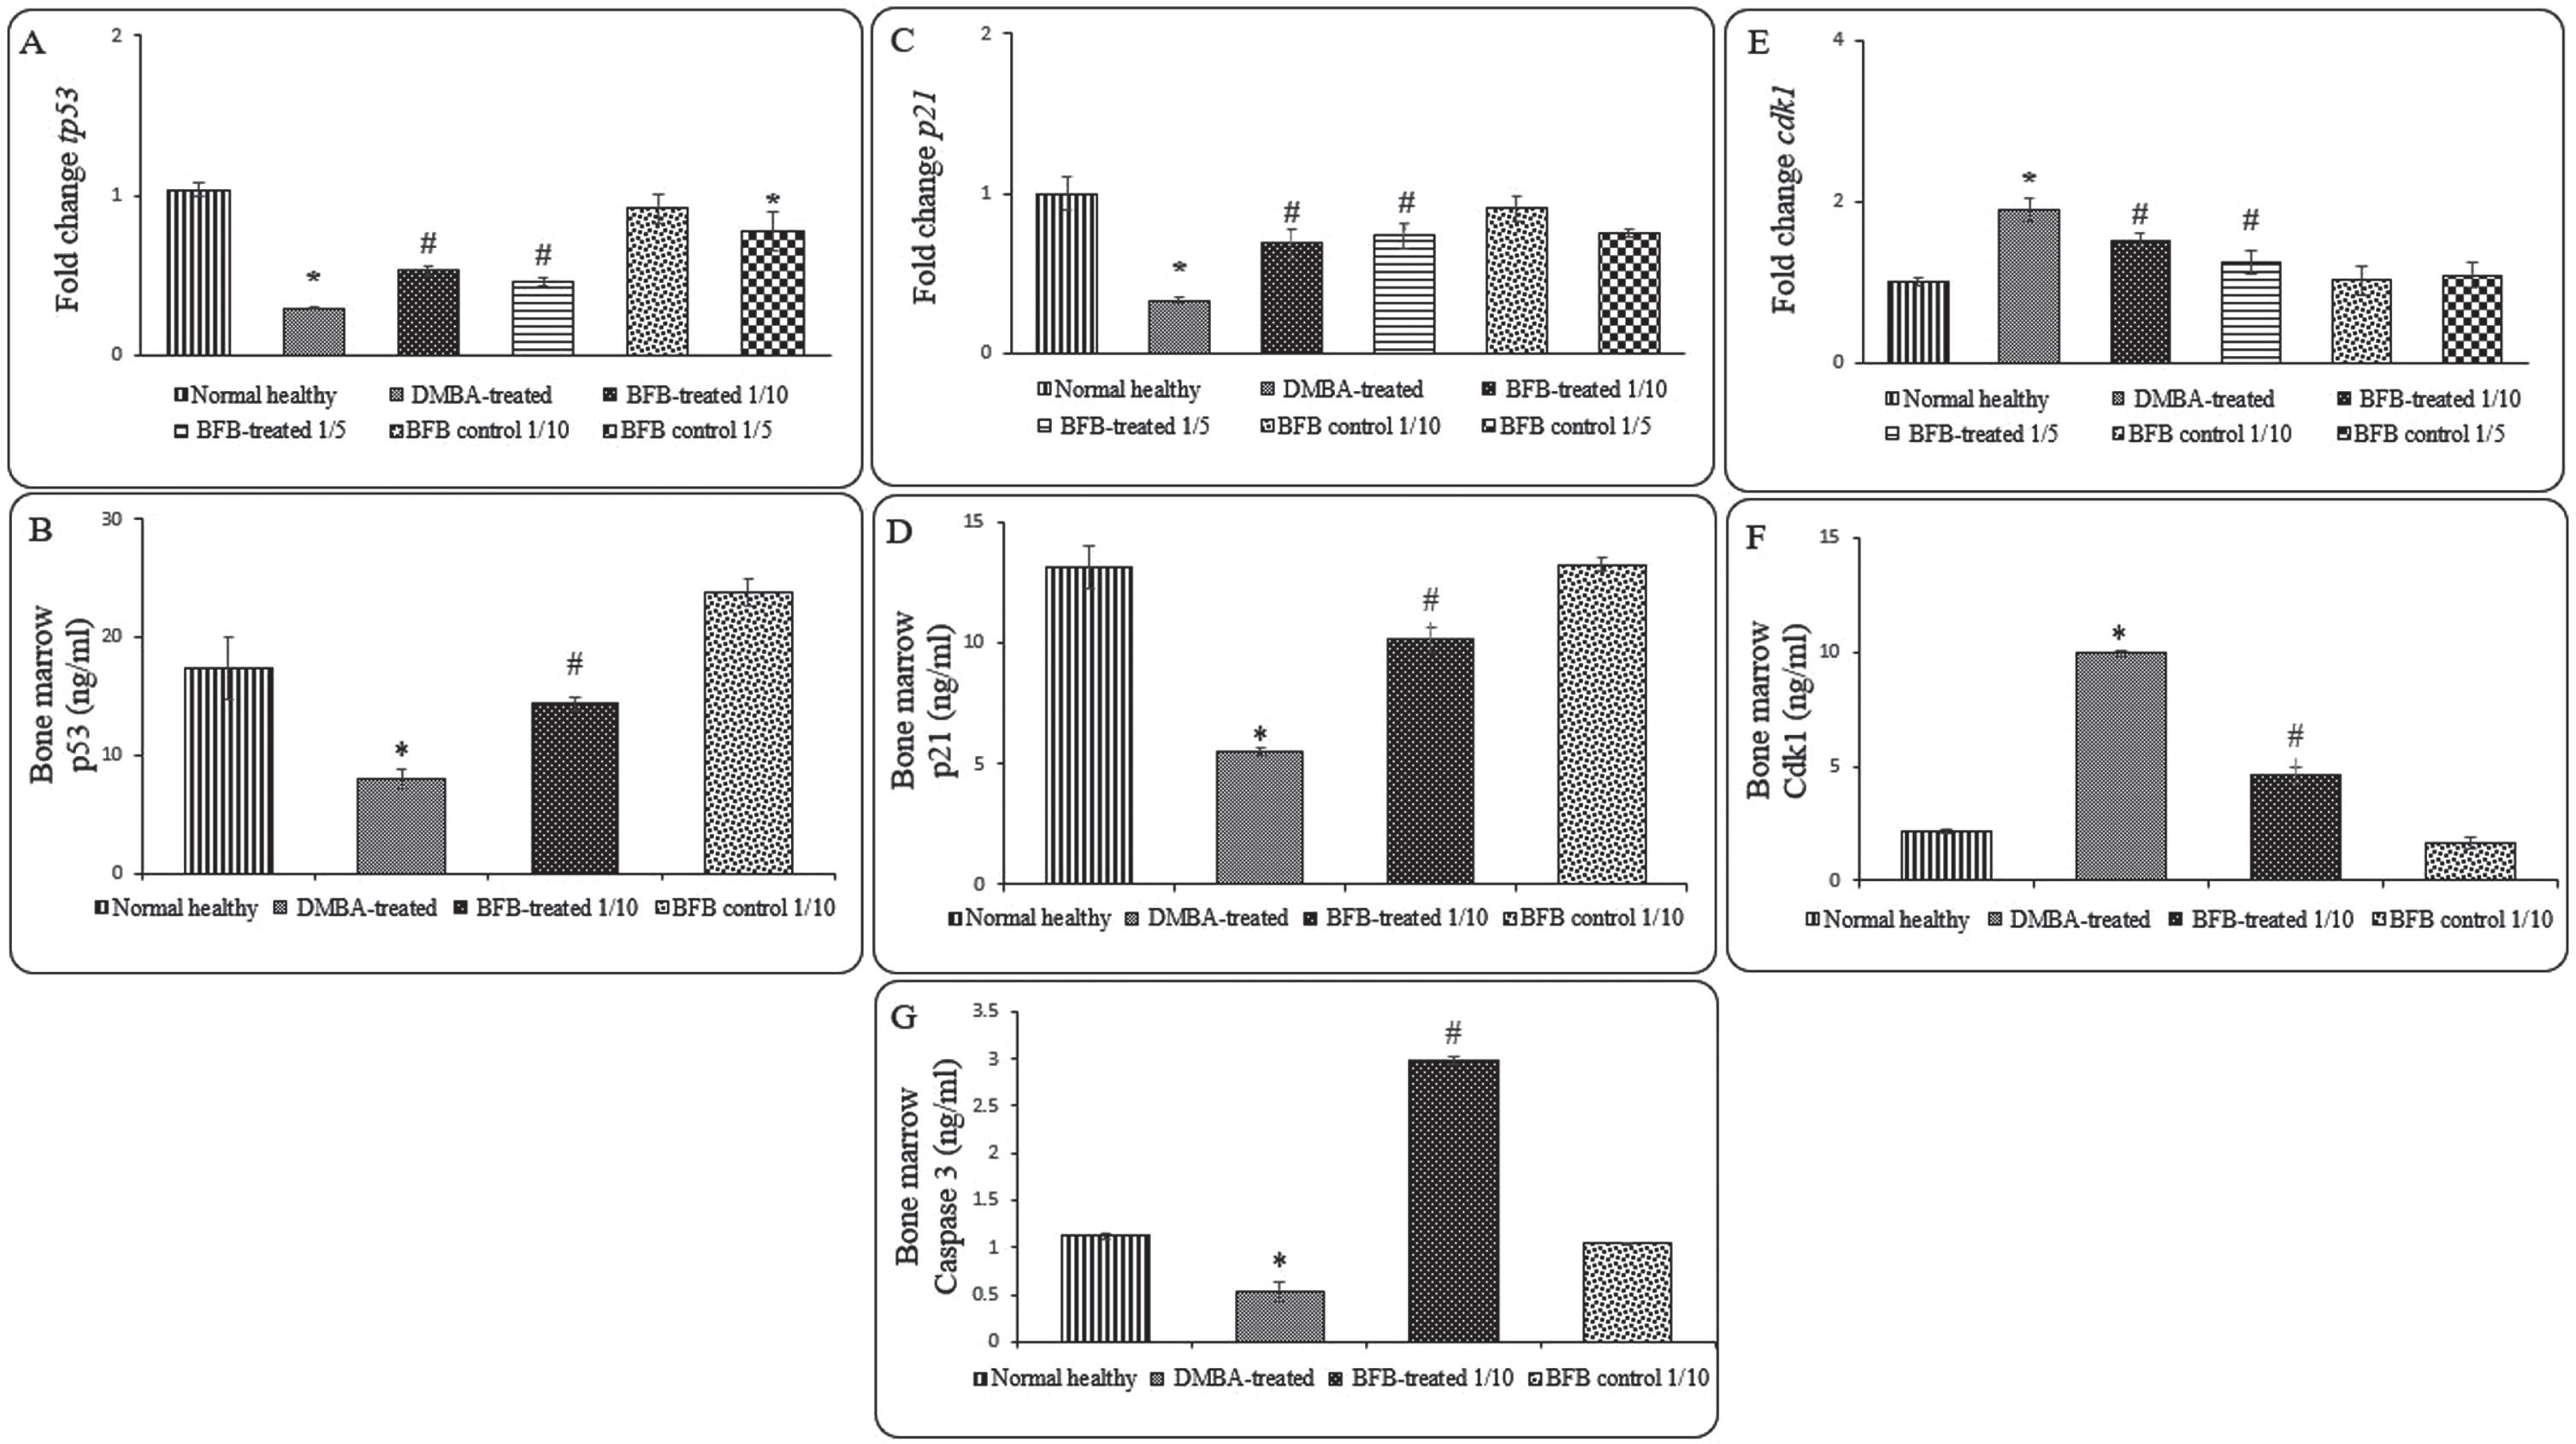
3.3BFB induces cell cycle arrest and apoptosis
To assess the molecular mechanism of BFB anti-leukemic effect, we investigated some cell cycle markers in the BM of all studied groups as represented in Fig. 6. When compared to DMBA-treated group, the BFB-treated groups showed significant up-regulation (p < 0.05) of the gene and protein expression of tp53 and p21 (Fig. 6A, 6B, 6C, 6D), while the expression of cdk1 was significantly down-regulated (p < 0.05) (Fig. 6E, 6F) after BFB treatment. To address the apoptotic BFB effect, Caspase-3 level was measured to show a significant increase in BFB-treated group compared to DMBA-treated group (Fig. 6G).
Fig. 6
Expression of cell cycle and apoptosis markers in the BM: (A) and (B) represent tp53 relative gene and protein expressions, respectively. (C) and (D) represent p21 relative gene and protein expressions, respectively. (E) and (F) represent cdk1 relative gene and protein expressions, respectively. (G) represents Caspase 3 level. Data are presented as Mean±SD of 6 values/group. (*) denotes significance (p < 0.05) against normal healthy control, (#) denotes significance (p < 0.05) against DMBA-treated positive control. Each result is representative of 3 independent experiments.
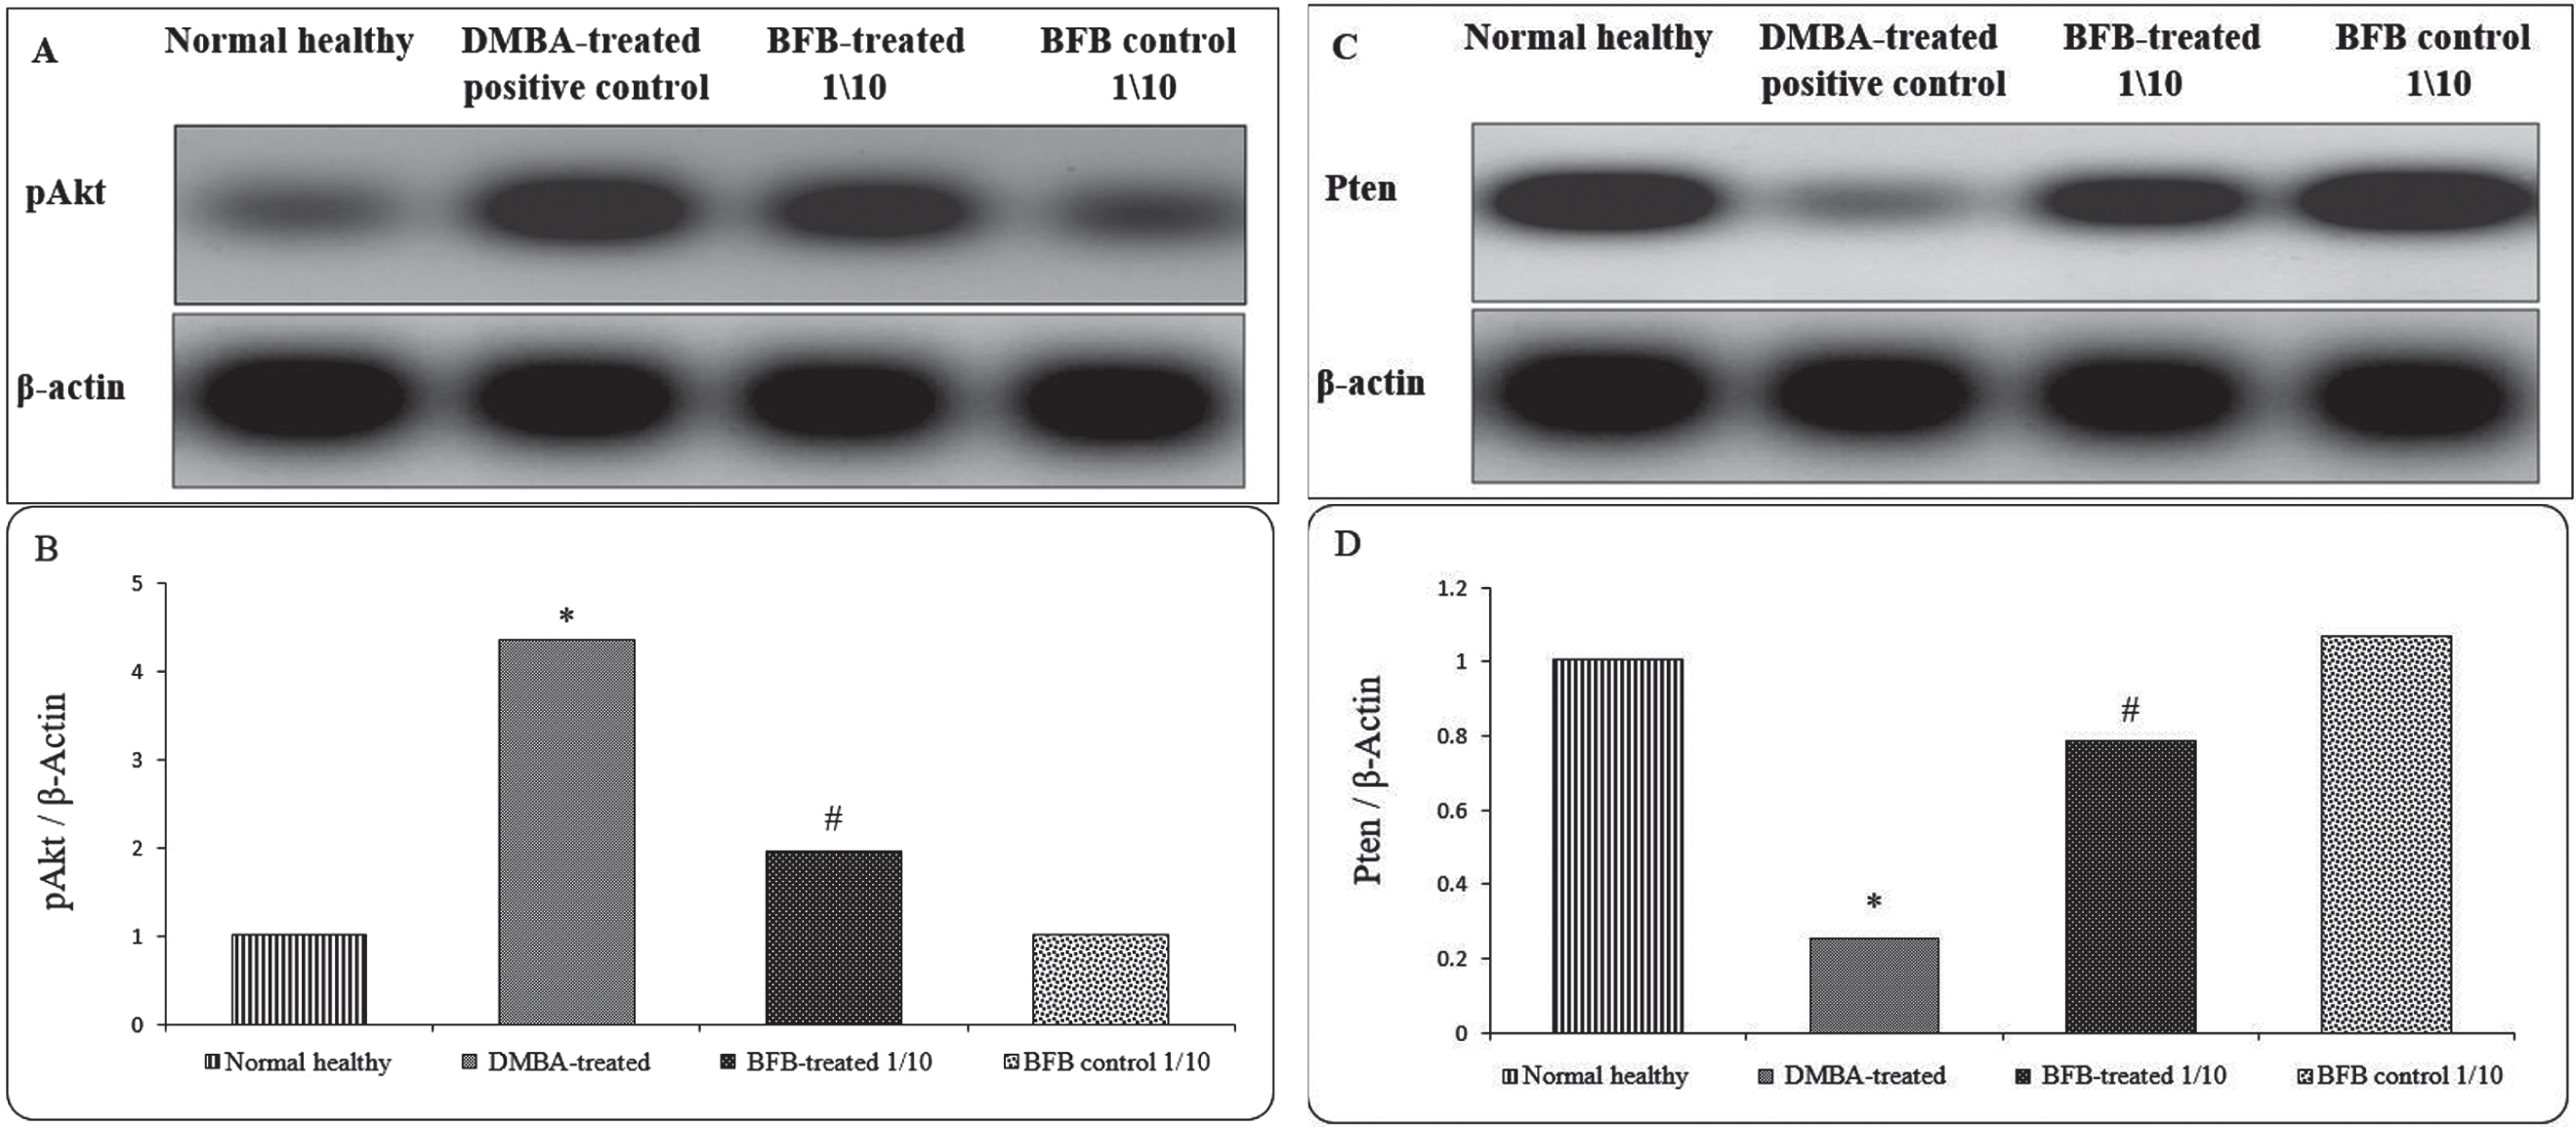
3.4BFB modulates Akt pathway
As the Akt pathway is directly correlated with cell cycle regulation and apoptosis in AML [11], we sought to investigate the BFB effect on Akt pathway. While LD501/10 BFB treatment markedly decreased the expression of pAkt; the active form of Akt [15, 29–31] (Fig. 7A & 7B), it resulted in an increase in Pten expression; the PI3K-Akt pathway inhibitor [32], (Fig. 7C & 7D) as compared to DMBA-treated positive controls.
Fig. 7
Protein expression of pAkt and Pten in the BM. (A) and (C) represent Western blot analysis for pAkt and Pten, respectively. (B) and (D) represent densitometric analysis of the ratio of pAkt and Pten to β-Actin, respectively. (*) denotes significance (p < 0.05) against normal healthy control, (#) denotes significance (p < 0.05) against DMBA-treated positive control. The result is representative of 3 independent experiments.
3.5The effect of BFB on normal mice
It was necessary to study the side effects and safety of BFB. BFB was intraperitoneally administered to normal mice as described in methods (Fig. 1). Administration of BFB in both doses caused a non-significant change in the body weight, as well as in relative liver and spleen weights, when compared to normal healthy group as shown in (Fig. 2). Also, administration of BFB in both doses caused a non-significant change in BM hematological parameters, including myeloblasts, erythroblasts, lymphocytes and metamyelocytes & bands, as well as in blood parameters such as RBCs, WBCs and platelets counts and in Hb, in comparison to normal healthy group as shown in (Fig. 3 & Table 2). Although the high BFB dose (LD501/5) caused necrotic/apoptotic and inflammatory changes, markedly dilated central veins with detached lining and expanded portal tracts (Fig. 4H, 4I, 5H, 5I, 5J & Table 3 and 4), the administration of BFB low dose (LD501/10) to normal mice caused fewer histological changes. Administration of LD501/10 BFB had no significant effect on the expression of either p53, Cdk1 or p21 (Fig. 6), when compared to normal mice. On the other hand, administration of LD501/5 BFB significantly (p < 0.05) down-regulated the relative expression of tp53 (Fig. 6). BFB showed no effect on pAkt, Pten and Caspase-3 expression as shown in (Fig. 6 & 7). All the above results showed that the low BFB dose (LD501/10) caused minimal damage in the BFB-control mice.
4Discussion
In the present study, we have investigated the role and molecular mechanism of a novel bithiophene derivative in inducing apoptosis in DMBA-induced AML mouse model. Here, the administration of BFB to DMBA-treated mice showed comparable hematological parameters to the control groups. Pulsed DMBA doses have proven to show carcinogenic effects as it is weakening BM stem cells, diminishing peripheral WBCs count and inducing leukemia in rats [33, 34] and clearly showed AML hematopoiesis impairment along with the immature myeloid blasts move to blood and to other body organs [35, 36]. DMBA here showed myeloid nature with similarities with human AML as demonstrated by marked hypocellularity with increased granulocytic immature precursors, lower erythroid precursors and confirmed by a decline in the peripheral blood cells. In our study, BFB showed an ameliorative effect on liver and spleen relative weights and total body weight, as well as the leukemia histological alterations through opposing DMBA action [37–39]. The ameliorative effect of BFB here might be explained by its antioxidant and anti-proliferative characteristics as we previously reported by testing BFB on AML cell line HL-60(TB) [25].
The histological examinations in our study indicated marked apoptotic cells in both liver and spleen following treatment with BFB. Therefore, it was rational to investigate cell cycle and apoptotic markers in order to examine the impact of BFB on the expression of the involved essential genes namely, tp53, cdk1, p21 and Caspase 3 protein. Cell cycle mediators drives cell growth and differentiation and its disturbances may lead to transformation from normal to cancerous cell [40]. This is apparent here in the DMBA induction of AML by the DMBA adducts causing DNA mutations in growth-responsible oncogenes, such as tp53 [41, 42]. Our results revealed that the expression level of tp53 and p21 genes were significantly upregulated in BFB-treated groups. On the contrary, the expression level of cdk1 gene was significantly downregulated in these groups. cdk1 downregulation along with tp53 upregulation anticipate cell cycle arrest [43], while p21 is a universal cell-cycle inhibitor through Cdk inhibition, which is directly activated by the action of p53 [44]. Our results were in agreement with the findings of the anti-proliferative role of another novel bithiophene derivative, which caused significant upregulation of tp53 expression and caspases activity, along with cdk1 downregulation [45].
In the pathogenesis of AML, PI3K/Akt/mTOR plays a crucial role, and its activation is common in 50% –80% of AML cases, particularly in the immature leukemic population. We are suggesting here that the anti-leukemic effect of BFB is exerted by acting as Adenosine triphosphate (ATP) competitive inhibitors for Akt pathway, which is known to be involved in phosphorylation and nucleus translocation of the oncoprotein Mouse double minute 2 homolog (Mdm2) and a consequent enhancement of Mdm2-mediated p53 proteasomal degradation [10], as well as regulation of p21 expression as a Cdks inhibitor [12, 13]. In multiple types of leukemia and different solid cancers, thiophene derivatives showed high efficacy through inhibition of Akt with very low adverse effects in high grade patients [13], which is compatible with our results that showed the BFB as a potentially safe prospective anti-leukemic drug, especially at a low dose. Hence, this anti-cancer effect of BFB can also be expected in multiple cancer therapies. We have shown here that, while low dose of BFB LD501/10 caused mildly apoptotic hepatocytes in peri-venular area with intra-parenchymal inflammatory infiltrate, the higher dose LD501/5 caused dilated PV, with more marked apoptotic hepatocytes in peri-venular area. More studies are required with more doses to identify the safest dose to be used with the highest therapeutic potential. Also, further studies are necessary in order to explore detailed effects of BFB in AML and other cancer types. In conclusion, here we present evidence on chemo-therapeutic anti-AML potential of BFB, which boosts cell cycle arrest and apoptosis and modulates Akt pathway with minimal cytotoxic effects.
Acknowledgments
Authors gratefully acknowledge Dr. Sayed Abdel Raheem, Assistant Professor of Histopathology, Faculty of Medicine, Al Azhar University for Boys, Cairo, Egypt, for his assistance with the histological study.
Authors gratefully acknowledge Dr. Samer Abbass, Professor of Clinical Pathology, Faculty of Medicine, Ain Shams University, Cairo, Egypt, for his assistance with the pathological study.
Author contributions
CONCEPTION: A.S.A and A.B.A
DATA CURATION: A.S.A
ANALYSIS OF DATA: A.S.A and R.H.M.
PREPARATION OF THE MANUSCRIPT: A.S.A. and R.H.M.
REVISION FOR IMPORTANT INTELLECTUAL CONTENT: R.H.M, A.B.A., M.A.I. and G.M.S.
SUPERVISION: G.M.S
Conflict of interest
The Authors has no conflict of interest to report.
Data availability
All relevant data are within the paper.
References
[1] | Lightfoot T , Smith A and Roman E . Leukemia. In: International Encyclopedia of Public Health. 2017, pp. 410-418. |
[2] | San Turgay A , Sari D and Türkistanli EÇ . Knowledge, attitudes, risk factors, and early detection of cancer relevant to the schoolteachers in İzmir Turkey. Prev Med (Baltim). (2005) ;40: :636–41. |
[3] | Chow LWC , Cheung MNB , Loo WTY , et al. A rat cell line derived from DMBA-induced mammary carcinoma. Life Sci. (2003) ;73: :27–40. |
[4] | Miyata M , Furukawa M , Takahashi K , et al. Mechanism of 7,12-dimethylbenz[a]anthracene-induced immunotoxicity: Role of metabolic activation at the target organ. Jpn J Pharmacol. (2001) ;86: :302–9. |
[5] | Haferlach C , Dicker F , Herholz H , et al. Mutations of the TP53 gene in acute myeloid leukemia are strongly associated with a complex aberrant karyotype. Leukemia. (2008) ;22: :1539–41. |
[6] | Malumbres M and Barbacid M . Mammalian cyclin-dependent kinases. Trends in Biochemical Sciences. (2005) ;30: :630–41. |
[7] | Jingwen B , Yaochen L and Guojun Z . Cell cycle regulation and anticancer drug discovery. Cancer Biol Med. (2017) ;14: :348. |
[8] | Teodoro JG , Evans SK and Green MR . Inhibition of tumor angiogenesis by p A new role for the guardian of the genome. J Mol Med. (2007) ;85: :1175–86. |
[9] | Schuler M , Bossy-Wetzel E , Goldstein JC , et al. P53 Induces Apoptosis By Caspase Activation Through Mitochondrial Cytochrome C Release. J Biol Chem. (2000) ;275: :7337–42. |
[10] | Chibaya L , Karim B , Zhang H , et al. Mdm2 phosphorylation by Akt regulates the p53 response to oxidative stress to promote cell proliferation and tumorigenesis. Proc Natl Acad Sci. (2021) ;118: :4. |
[11] | Xu Q , Simpson SE , Scialla TJ , et al. Survival of acute myeloid leukemia cells requires PI3 kinase activation. Blood. (2003) ;102: :972–80. |
[12] | Zhou Y and Ho WS . Combination of liquiritin, isoliquiritin and isoliquirigenin induce apoptotic cell death through upregulating p53 and p21 in the A549 non-small cell lung cancer cells. Oncol Rep. (2014) ;31: :298–304. |
[13] | Nitulescu GM , Margina D , Juzenas P , et al. Akt inhibitors in cancer treatment: The long journey from drug discovery to clinical use (Review). International Journal of Oncology. (2016) ;48: :869–85. |
[14] | Park S , Chapuis N , Tamburini J , et al. Role of the PI3K/AKT and mTOR signaling pathways in acute myeloid leukemia. Haematologica. (2010) ;95: :819–28. |
[15] | Liang H , Zheng QL , Fang P , et al. Targeting the PI3K/AKT pathway via GLI1 inhibition enhanced the drug sensitivity of acute myeloid leukemia cells. Sci Rep. (2017) ;7: :1–10. |
[16] | El-Metwally SA , Khalil AK and El-Sayed WM . Design, molecular modeling and anticancer evaluation of thieno[2,3-d]pyrimidine derivatives as inhibitors of topoisomerase II. Bioorg Chem. (2020) ;94: :103492. |
[17] | Zhang J , Gu Y and Chen B . Mechanisms of drug resistance in acute myeloid leukemia. OncoTargets and Therapy. (2019) ;12: :1937–45. |
[18] | Shah R and Verma PK . Therapeutic importance of synthetic thiophene. Chemistry Central Journal. (2018) ;12: :137. |
[19] | El-Sayed W , Alzahrani A and Ismail M . Evaluation of the biological activity of novel monocationic fluoroaryl-2,2’-bichalcophenes and their analogues. Drug Des Devel Ther. (2014) ;8: :963. |
[20] | Farahat AA , Ismail MA , Kumar A , et al. Indole and Benzimidazole Bichalcophenes: Synthesis, DNA Binding and Antiparasitic Activity. Eur J Med Chem. (2018) ;143: :1590–6. |
[21] | Hussin WA , Ismail MA , Alzahrani AM , et al. Evaluation of the biological activity of novel monocationic fluoroaryl-2,2′-bichalcophenes and their analogues. Drug Des Devel Ther. (2014) ;8: :963–72. |
[22] | Depauw S , Lambert M , Jambon S , et al. Heterocyclic Diamidine DNA Ligands as HOXA9 Transcription Factor Inhibitors: Design, Molecular Evaluation, and Cellular Consequences in a HOXA9-Dependant Leukemia Cell Model. J Med Chem. (2019) ;62: :1306–29. |
[23] | Ismail MA , Youssef MM , Arafa RK , et al. Synthesis and antiproliferative activity of monocationic arylthiophene derivatives. Eur J Med Chem. (2017) ;126: :789–98. |
[24] | Wilson WD , Nguyen B , Tanious FA , et al. Dications that target the DNA minor groove: Compound design and preparation, DNA interactions, cellular distribution and biological activity. Curr Med Chem - Anti-Cancer Agents. (2005) ;5: :389–408. |
[25] | Ismail MA , Arafa RK , Youssef MM , et al. Anticancer, antioxidant activities, and DNA affinity of novel monocationic bithiophenes and analogues. Drug Des Devel Ther. (2014) ;8: :1659–72. |
[26] | LeBeau JE . The role of the LD50 determination in drug safety evaluation. Regul Toxicol Pharmacol. (1983) ;3: :71–4. |
[27] | Rosenberg IM . Protein analysis and purification: Benchtop techniques: Second edition. Birkhauser Boston, 2005. DOI: 10.1007/b138330. |
[28] | Kma L and Sharan RN . In vivo exposure of Swiss albino mice to chronic low dose of dimethylnitrosamine (DMN) lowers poly-ADP-ribosylation (PAR) of bone marrow cell and blood lymphocyte proteins. Mol Cell Biochem. (2006) ;288: :143–9. |
[29] | Ahmed ESA , Ahmed NH , Medhat AM , et al. Mesenchymal stem cells targeting PI3K/AKT pathway in leukemic model. Tumor Biol. (2019) ;41: :1–11. |
[30] | Bender A , Opel D , Naumann I , et al. PI3K inhibitors prime neuroblastoma cells for chemotherapy by shifting the balance towards pro-apoptotic Bcl-2 proteins and enhanced mitochondrial apoptosis. Oncogene. (2011) ;30: :494–503. |
[31] | Luo Y , Li X , Chen T , et al. Synthesis of a novel thiophene derivative that induces cancer cell apoptosis through modulation of AKT and MAPK pathways. Medchemcomm. (2012) ;3: :1143–6. |
[32] | Carnero A and Paramio JM . The PTEN/PI3K/AKT Pathway in vivo, cancer mouse models. Front Oncol. (2014) ;4: :1–10. |
[33] | Sugiyama T , Osaka M , Koami K , et al. 7,12-DMBA-induced rat leukemia: A review with insights into future research. Leuk Res. (2002) ;26: :1053–68. |
[34] | Uno S , Dalton TP , Derkenne S , et al. Oral exposure to benzo[a]pyrene in the mouse: Detoxication by inducible cytochrome P450 is more important than metabolic activation. Mol Pharmacol. (2004) ;65: :1225–37. |
[35] | Estey EH . Acute myeloid leukemia: update on risk-stratification and management. Am J Hematol. (2018) ;93: :1267–91. |
[36] | Wouters BJ and Delwel R . Epigenetics and approaches to targeted epigenetic therapy in acute myeloid leukemia. Blood. (2016) ;127: :42–52. |
[37] | Anbuselvam C , Vijayavel K and Balasubramanian MP . Protective effect of Operculina turpethum against 7,12-dimethyl benz(a)anthracene induced oxidative stress with reference to breast cancer in experimental rats. Chem Biol Interact. (2007) ;168: :229–36. |
[38] | Lane HW , Keith RE , Strahan S , et al. The effect of diet, exercise and 7,12-dimethylbenz(a)anthracene on food intake, body composition and carcass energy levels in virgin female BALB/c mice. J Nutr. (1991) ;121: :1876–82. |
[39] | Kadir Batcioglu . Comparison of in vivo chemoprotective and in vitro antimicrobial activity of different garlic (Allium sativum) preparations. J Med Plants Res. (2012) ;6: :2885–94. |
[40] | Hanahan D and Weinberg RA . The Hallmarks of Cancer Review Douglas. Cell. (2000) ;100: :57–70. |
[41] | Huggins E . Hundred day leukemia: Preferential induction in rat by pulse-doses of 7,8,12-trimethylbenz(a)anthracene. J Exp Med. (1970) ;131: :321–30. |
[42] | Heidel SM , MacWilliams PS , Baird WM , et al. Cytochrome P4501B1 Mediates Induction of Bone Marrow Cytotoxicity and Preleukemia Cells in Mice Treated with 7,12-Dimethylbenz[a]anthracene. Cancer Res; 60(13):3454-60. |
[43] | Hekal MH , El-Naggar AM , Abu El-Azm FSM , et al. Synthesis of new oxadiazol-phthalazinone derivatives with anti-proliferative activity; Molecular docking, pro-apoptotic, and enzyme inhibition profile. RSC Adv. (2020) ;10: :3675–88. |
[44] | El-Deiry WS . p21(WAF1) mediates cell-cycle inhibition, relevant to cancer suppression and therapy. Cancer Research. (2016) ;76: :5189–91. |
[45] | Ismail MA , Negm A , Arafa RK , et al. Anticancer activity, dual prooxidant/antioxidant effect and apoptosis induction profile of new bichalcophene-5-carboxamidines. Eur J Med Chem. (2019) ;169: :76–88. |


