
Breast cancer suppression by curcumin-naringenin-magnetic-nano-particles: In vitro and in vivo studies
Abstract
BACKGROUND:
The limitations of surgery, radiotherapy, and chemotherapy in cancer treatment and the increase in the application of nanomaterials in the field of biomedicine have promoted the use of nanomaterials in combination with radiotherapy for cancer treatment.
OBJECTIVE:
To improve the efficiency of cancer treatment, curcumin-naringenin loaded dextran-coated magnetic nanoparticles (CUR-NAR-D-MNPs) were used as chemotherapy and in combination with radiotherapy to verify their effectiveness in treating tumors.
METHODS:
CUR-NAR-D-MNPs were prepared and studied by several characterization methods. Median inhibitory concentration (IC50) and cellular toxicity were evaluated by 3-(4,5-dimethylthiazolyl-2)-2,5-diphenyltetrazolium bromide (MTT) assay. The cell death and radiosensitization were studied by acridine orange/ethidium bromide dual staining of MCF-7 human breast cancer cells.
RESULTS:
CUR-NAR-D-MNPs induce apoptosis and inhibited cell proliferation through reactive oxygen species (ROS) generation. CUR-NAR-D-MNPs used alone had a certain therapeutic effect on tumors. CUR-NAR-D-MNPs plus radiotherapy significantly reduced the tumor volume and led to cell cycle arrest and induction of apoptosis through modulation of P53high, P21high, TNF-αlow, CD44low, and ROShigh signaling
CONCLUSIONS:
CUR-NAR-D-MNPs are effective in the treatment of tumors when combined with radiotherapy, and show radiosensitization effects against cancer proliferation in vitro and in vivo.
1Introduction
Breast cancer is the most prevalent cancer and one of the leading causes of death among women worldwide [1]. 7,12-dimethylbenz(a) anthracene (DMBA) is a polycyclic aromatic hydrocarbon with both carcinogenic and immunosuppressive effects and has been successfully used to induce mammary tumors in animals; that is by using young rodents when mammary glands are undifferentiated [2]. It has been shown that medroxy progestin acetate (MPA) promotes the incidence of DMBA-induced mammary tumors in rats [3]. Surgery, radiation, and chemotherapy are the most known therapeutic approaches for the treatment of breast cancer, which are expensive and, unfortunately, inefficient in some cases wherein rates of cancer death remain to be high [4]. Plant-derived compounds or secondary metabolites in a combination of active constituents can serve as attractive agents in breast cancer treatment owing to the low side effects compared with other medicines [5]. Nowadays, modern phytopharmaceutical research used herbal drugs in the application of a controlled drug delivery system as a central strategy to enhance the therapeutic efficacy and safety of therapeutic molecules [6]. Various natural polyphenols, including curcumin (CUR), [7] and naringenin (NAR), [8]. have potential in developing anticancer therapy, [9] and are very safe product for human use [10, 11] Moreover, CUR or NAR inhibits the proliferation of tumor growth, arrests the cell cycle and induces apoptosis through the hyperproduction of reactive oxygen species (ROS). [12, 13]. However, the clinical use of these compounds was frequently limited owing to instability, poor bioavailability, poor solubility, and poor absorption in the body [14]. Nanomedicines have revolutionized drug-delivery, allowing for therapeutic agents to selectively target cancer cells while minimizing toxicity to normal cells, [15]. Because of the capability of nanomedicine to ensure a longer duration of drug bioavailability, its therapeutic efficacy, is enhanced, allowing for the delivery of these natural pharmaceuticals [16, 17]. Design and developing drug delivery systems (DDSs) has received tremendous attention in the last decade [18]. These DDSs could enhance compatibility and bioavailability as well as cell uptake. More importantly, the DDSs could be functionalized using different stimuli-responsive chemicals and behave like a smart gate, where the drug only be released under certain conditions triggered by a stimulus such as temperature, pH or magnetic field [18, 19]. Among them, the magnetic field-responsive nanocarriers are of interest in cancer therapy, due to the difference between the normal cells and cancerous cells, where the cancer cells have substantially lower values of the potential compared to that of the normal cells [19]. Additionally, iron-based magnetic nanoparticles (IONPs) can potentially be used to direct the drug toward tumor sites by the employment of an external magnetic field. However, IONPs suffer from two significant issues: rapid agglomeration, and physiological environment oxidation. The covering method is the most popular surface modification method to prevent the oxidation and agglomeration of IONPs [20]. Dextran (D) is a polysaccharide with good water solubility, and can decrease the saturation magnetization and cytotoxicity of IONPs, therapy enhancing their biocompatibility [21]. Some tumor types are treated by gamma-rays. Gamma rays exert ionizing effects by transferring certain amounts of energy to the irradiated cells, producing cellular DNA damage, and thereby killing cancer cells, or by tumor stromal modulation, resulting from exposure to a low dose of radiation (LDR) [22]. Cancer cells have varying levels of radiosensitization. In general, cells that have more growth are more sensitive to radiation. Previous studies have shown the moderate radiosensitization effect by polyphenolic compounds such as CUR and NAR suppressing proliferation and inducing apoptosis of cancer cells [22–24]. However, to the best of our knowledge, the effects of two natural compounds in nanoformulation in breast cancer model in vivo and as a radiosensitizer have not yet been evaluated. This study aimed to investigate CUR-NAR-D-MNPs as a chemotherapeutic agent and as a radiosensitizer in vitro and in vivo.
2Materials and methods
Iro-(II)-chloride-tetrahydrate (Cl2FeH8O4), iron-(III)-chloride-hexahydrate (Cl3FeH12O6), NH4OH (25%of ammonia), D-(20kDa) (Sigma-Aldrich (St.Louis,MO); ethanol (Merck,Darmstadt,Germany); CUR 95%(total curcuminoid content), NAR-triethylsilane (Alfa-Aesar, Thermo Fisher Scientific, Loughborough, United Kingdom), human breast cancer cell lines (MCF-7) (VACSERA, Giza Governorate, Egypt), fetal bovine serum, L-glutamine, penicillin-G-sodium, streptomycin-sulfate, amphotericin-B (Lonza, USA); 3-(4,5-dimethylthiazol-2yl)-2,5-diphenyl-tetrazolium-bromide (MTT), acridine-orange (AO), ethidium-bromide (EB) (Sigma-Aldrich, St. Louis, MO), and 1–7,12-Dimethylbenz[a]anthracene (DMBA) (Sigma-Aldrich, Egypt); MPA 150 mg MPA/1 mL/vial (local pharmacies, DEPO-PROVERA). The kits for alanine transaminase (ALT), aspartate aminotransferase (AST), cholesterol and triglycerides (TGs) were purchased from Bio-Diagnostic, Giza, Egypt. The kits for albumin and globulin were purchased from SPINREACT (Girona-Spain). Animals were obtained from Nile-Pharmaceutical and Chemical Industries, Cairo, Egypt. Gamma cell-40 (Cesium-137), was manufacture by the National Center for Radiation Research and Technology (NCRRT), Egyptian Atomic Energy Authority (EAEA) (Cairo, Egypt). All other chemicals and solvents used in this work were of an analytical grade.
2.1Preparation of CUR-NAR-D-MNPs
2.1.1Preparation of magnetic nanoparticles
Magnetic nanoparticles (MNPs) were prepared by controlled chemical coprecipitation of the magnetite phase from aqueous solutions containing suitable salts of Fe2+ and Fe3+ under an inert atmosphere according to the following procedure: first, a freshly prepared mixture of 4.32 g FeCl3-6H2O and 1.60 g FeCl2-4H2O was dissolved in 80 mL deionized (DI) water, and stirred at a speed of 600 rpm under nitrogen flow. After, 5 mL ammonia was added dropwise to the mixture. The mixed solution was preheated to 80°C before the coprecipitation reaction. After the mixture was cooled to room temperature the precipitate was collected and removed from the solution by applying an external magnetic field. The supernatant solution was removed from the precipitate after decantation. DI water was added to wash the precipitate twice after the supernatant solution was centrifuged at 4000 rpm for 10 min. The synthesized MNPs were then dried at 37°C under vacuum overnight [25].
2.1.2Synthesis of D-coated magnetite (Fe3O4) nanoparticles
FeCl3.6H2O and FeCl2.4H2O were combined in a 2 : 1 M ratio (2.2 and 0.8 g, respectively), dissolved in 40 mL DI water and sealed in a three-neck flask under vigorous stirring and an inert nitrogen environment. Five grams of D were solubilized in 20 mL of DI water. The reaction solution was heated to 85°C at which 5 mL of NH4OH was added to the D solution and the combined solution was injected dropwise into the vessel. The reaction was performed out for 1 h at 85°C. The particles were magnetically decanted and washed three times with DI water. The nanoparticles were then resuspended in DI water and dialyzed against DI water for 24 h. The nanoparticles were probe sonicated for 10 min and then centrifuged at 1000 rpm for 5 min to remove large agglomerates [26].
2.2Preparation of CUR-NAR-D-MNPs nanoparticles
D-coated MNPs (20 g) were added into 2 g of CUR + 2 g of NAR (preliminarily solubilized in 750 mL ethanol), stirred for 20 h, separated by centrifugation at 14000 rpm and subsequently washed three times with water. The nanoparticles were dried in a vacuum oven at 30°C for 12 h [27].
2.3Characterization of the prepared CUR-NAR-D-MNPs
The structure of the prepared nanosystem was characterized by Fourier transform infrared spectroscopy (FTIR), wide angle X ray diffraction (WAXD), vibrating sample magnetometer (VSM); High resolution transmission electron microscopy (HRTEM) and zeta potential; malvern zetasizer nano series (ZS).
2.4Gamma-ray irradiation
MCF-7 cells were treated with a single-dose 6 Gy γ radiation [28]. Whole bodies of rats were exposed to 0.25 Gy γ radiation, [29] delivered once every week for 6 weeks, using cesium-137 source (Gammacell 40 Exactor; NCRRT, AEA, Cairo, Egypt). The dose rate used was 0.423 Gy/min. The dosimetry was used for all experiments to ensure uniformity of dose and dose rate delivered using the Fricke reference standard dosimeter [30].
2.5In-vitro study
2.5.1Cell line and culturing
MCF-7-cells were preserved in RPMI-1640 medium (Gibco, NY, USA), enriched with 10%fetal calf serum (Gibco), penicillin (100 units/ml), and streptomycin (100 mg/ml). The cultures incubated at 37°C in a humidified environment with 5%CO2. Every 2-3-days, passaged cells to obtain exponential growth.
2.5.2MTT assay
Cellular toxicity was evaluated by MTT (3-(4,5-dimethylthiazolyl-2)-2,5-diphenyltetrazolium bromide) assay and, the concentration that produced 50%growth inhibition (IC50) was measured by the modified Kärbers-method [31]. According to the formula: IC50 = log-1[Xk-i(ΣP-0.5)], wherein Xk represents the highest drug concentration logarithm, i represents the ratio of adjacent concentration; and ΣP is the sum of the percentage of growth repression at several concentrations. All experiments were duplicated five times, from which the mean and standard error of IC50 were recorded.
2.5.3Cell death and radiosensitization effect on MCF-7 cells by CUR-NAR-D-MNPs
The cell death and radiosensitization effect on MCF-7 cells by CUR-NAR-D-MNPs was qualitatively and quantitatively evaluated by AO/EB dual staining. The following were four sets of cells prepared: i) the cells were served as the control without any treatment, ii) cells were incubated with 59.7μg/ml of CUR-NAR-D-MNPs for 48 h, iii) cells were exposed to a single irradiation dose of 6 Gy, and iv) cells were exposed to CUR-NAR-D-MNPs followed 24 h by exposed to a single irradiation dose of 6 Gy. The cells of all sets were stained by AO/EB, [32] and visualized immediately under a fluorescence microscope (Nikon-Eclipse-Ti, Tokyo, Japan).
2.12.6 In-vivo studies
The study was approved by the research ethics committee for experimental studies (Human and Animal subjects) at NCRRT, EAEA, (Cairo, Egypt), following the 3Rs principle for animal experimentation (Replace, Reduce and Refine) and is organized and operated according to Council for International Organizations of Medical Sciences and International Council for Laboratory Animal Science International Guiding Principles for Biomedical Research Involving Animals 2012 (serial number: A3-20).
2.7LD50 and toxicity estimation of CUR-NAR-D-MNPs
Eighteen rats were randomly divided into six groups (n = 3 rats) as follows: i) control: animals were received the vehicle of CUR-NAR-D-MNPs, ii) 500: animals were received a single oral-dose (500μg/kg) of CUR-NAR-D-MNPs, iii) 1000: animals were received a single oral-dose (1000μg/kg) of CUR-NAR-D-MNPs, iv) 2000: animals were received a single oral-dose (2000μg/kg) of CUR-NAR-D-MNPs, v) 4000: animals were received a single oral-dose (4000μg/kg) of CUR-NAR-D-MNPs, vi) 4000: animals were received a repeated oral-dose (1000μg/kg per week for 4 weeks) of CUR-NAR-D-MNPs. All groups were continuously followed for 4 h after dosing, 24 h, and then daily for 4 weeks to evaluate morphological states; the rats were then sacrificed. The liver and kidney were separated to examine the histological effect of the CUR-NAR-D-MNPs (4000μg/kg; single-dose and 4000μg/kg; repeated-dose). Blood was separated into two parts: 1) with an anticoagulant agent to examine complete blood count, 2) plasma was separated to examine the biochemical effect of the CUR-NAR-D-MNPs (4000μg/kg; repeated-dose).
2.7.1Experimental design and tumor induction
Female Sprague Dawley rats (n = 110) of aged 45–50-days were randomly categorized into two main groups (Fig. 4(a): group I (n = 10 rats): which served as the control, and group II (n = 100), wherein a single dose of 100 mg/ kg body weight of DMBA in sesame oil was orally administrated to the rats on zero day [33]. Four weeks after the gastric intubation of DMBA, the rats received 5 ppm subcutaneous injection of MPA (0.5 mg/rat) every week for 4 weeks, [34] to promote DMBA-induced mammary tumor. The animals were palpated weekly beginning 4 weeks after DMBA treatment to detect early development of any abnormal masses. When tumor size reached 0.5 cm in the largest dimension (60 rats had this inclusion criterion), group III was randomly divided into four groups (n = 15 each):
• Tumor control group (tumor): animals received the vehicle of CUR-NAR-D-MNPs.
• CUR-NAR-D-MNPs: tumor-bearing animals were received a dose of 1 mg/kg of CUR-NAR-D-MNPs via gastric intubation, thrice per week, which started after the latency period (the last tumor was observed at 108 days) and continued for 8 weeks.
• LDR group: tumor-bearing animals were exposed to LDR (0.25 Gy) once every week for 6 weeks.
• CUR-NAR-D-MNPs + LDR: tumor-bearing animals were treated with CUR-NAR-D-MNPs, after 24 h from the third dose each week, and animals were exposed to LDR (0.25 Gy).
Mortality and body weight gain were recorded weekly. Tumor volumes and weights were calculated using the following formula: L/2×W/2×π [35]. At the end of the experimental study (day 168), the animals were sacrificed; blood was collected, and breast tissues were separated to examine the hematological, biochemical and histological changes.
2.7.2Histopathological examination
The livers and kidneys and part of breast tissues were fixed in 10%formol saline for 24 h, washed in tap water, and followed for dehydration by serial dilutions of alcohol (methyl, ethyl, and absolute ethyl). Samples were embedded in paraffin after being cleared in xylene and at 56°C in a hot air oven for 24 h. By slides microtome, paraffin beeswax tissue blocks were prepared for sectioning at 4μ thickness. The obtained sections were collected on glass slides, deparaffinized, and stained using hematoxylin and eosin (H and E) for routine light electronic microscope examination [36].
2.7.3Biochemical and hematological estimations
Biochemical investigation in plasma included the activities of (ALT), (AST), [37] (Alb) and globulin, [38] total cholesterol concentration, [39] TG concentration, [40] total bilirubin, [41] superoxide dismutase (SOD), [42] reduced glutathione (GSH), [43] Catalase (CAT), [44] and malondialdehyde (MDA) [45]. The analysis of hematological parameters was performed using an automatic-hematological-analyzer (Coulter-STKS, Beckman).
2.7.4Flow-cytometry analysis of the cell cycle, Bcl-2, Bax, caspase-3, P53, P21, CD44 and TNF-α
Isolated tissues for all groups were processed immediately. Breast tissues were cut into pieces of 2 to 5 cm thickness, rinsed, and cleaned with PBS. Fresh tissues were mechanically dispersed, sequentially using 100 and 35μm nylon cell-strainers (mesh) (BD-Falcon:0877119). Specimens were pressed through the 100μm mesh, which placed in a tissue culture dish containing PBS/EDTA. The mesh was rinsed several times at 4°C cold PBS/EDTA, and centrifuged for cell-suspension (310 g; 4°C; 6 min). The supernatant was removed, and 5 ml cold ethanol (80%, –20°C) was added dropwise under constant, gentle, vortexing to fixed cells. Before staining, cells were kept at –20°C overnight. For the cell cycle analysis, cells were treated with an appropriate volume of staining solution containing 30μg/ml PBS, and 0.3 mg/ml RNase free DNase. For the cell surface markers (Bcl-2, Bax, Caspase-3, P53, P21, CD44 and TNF-α), cells were stained with 10μl monoclonal antibody in the dark for 30min at room temperature. (BD-Pharmingen™, Cat. Nos. (556537, 556467, 550480, 557027, 556431, 559250 and 559503 respectively). The cell cycle and cell surface marker data were analyzed by BD Accuri-C6-Plus software (Biosciences,CA, USA) [46].
2.8Measurement of intracellular ROS levels by ELISA assay
ROS levels were determined by using the markers assay kit (MyBiosource; Cat. No:MBS166870), following a modification of the manufacturers protocol. Cells were seeded in 150 mm plates, treated as described above, collected and homogenized (2×10⁶) in 100μL of ice-cold water. Briefly, 10%tissue homogenate was obtained from the mammary tissue samples in PBS consisting of a 1%protease inhibitor cocktail. Further, homogenates were underwent centrifugation (12,000 g) approximately 15 min, and the resulting supernatants attained were collected. Reactions were performed following the manufactures protocol and absorbance was measured at 570 nm using an automatic microplate reader (Quant, BioTek Instruments, Inc.,Winooski, VT, USA).
2.9Statistical analysis
All experiments were performed at least in triplicate and the results were expressed as the mean±standard error (SEM). The statistical software package (SPSS, 20, Inc., Chicago, IL) was used for analysis. Statistical significance between all groups was analyzed by using the P < 0.001, P < 0.01 and P < 0.05. Statistical analyses were performed using Prism, version 7 (GraphPad Software, La Jolla, CA)
3Results
3.1Structural analysis
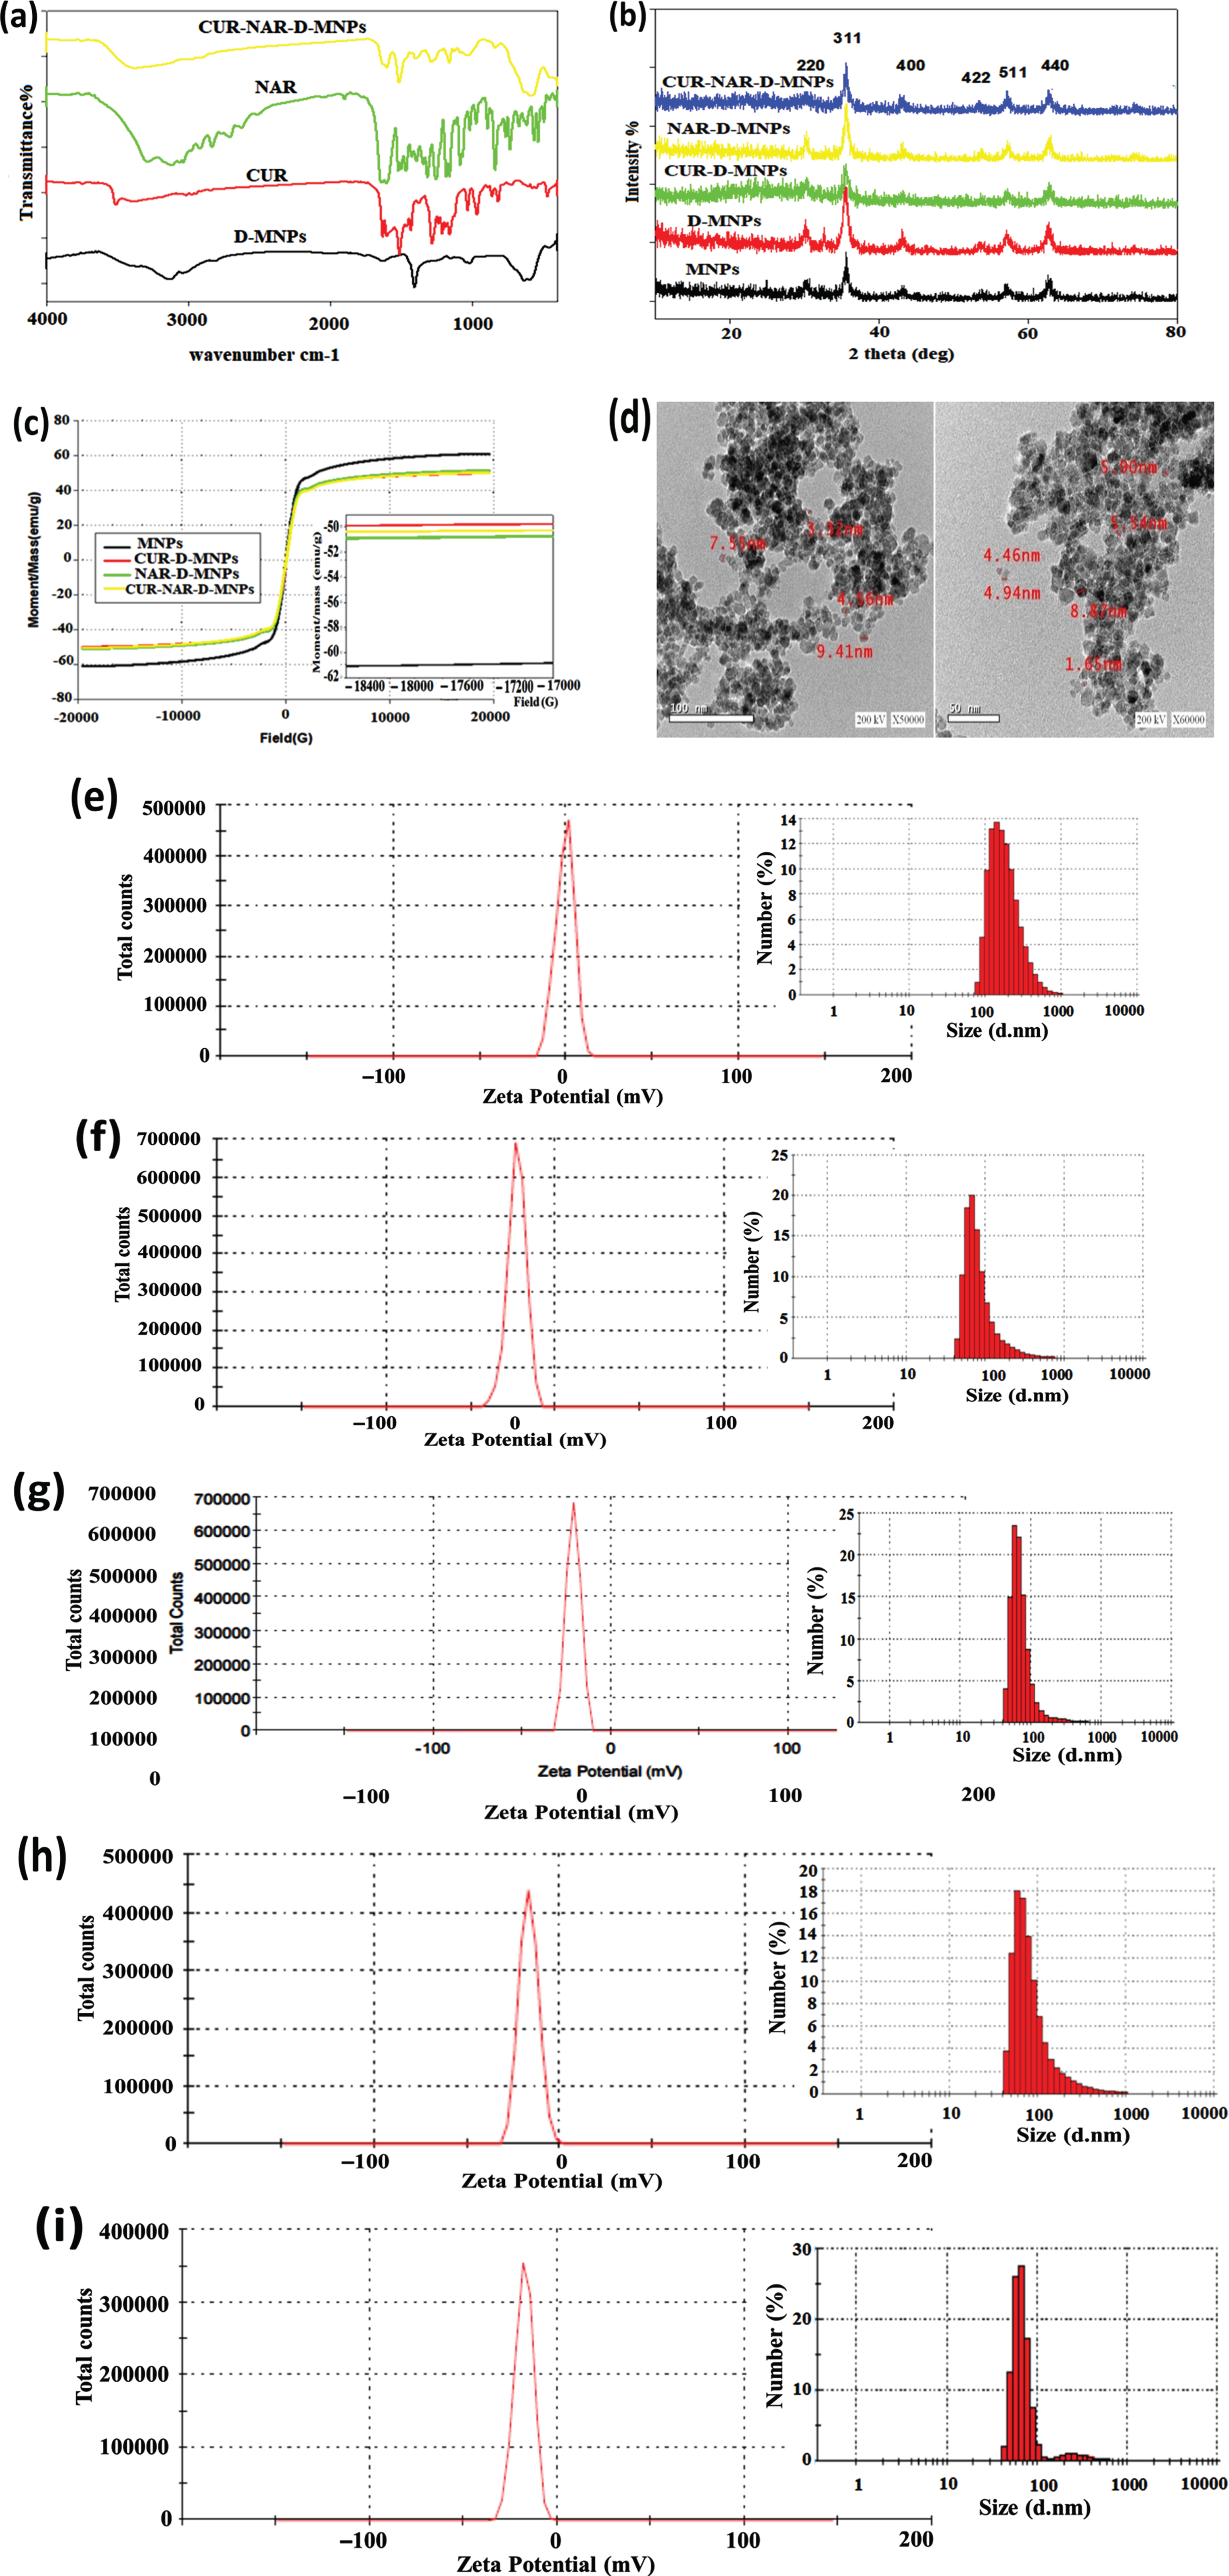
FTIR spectrum showed the characteristic peak of CUR, NAR and CUR-NAR-D-MNPs (Fig. 1(a). reveals distinguishable beaks of CUR, NAR and CUR-NAR-D-MNPs even the main region of the spectra is overlapped suggesting that CUR and NAR are successfully entrapped in D-coated MNPs. The phase analysis and crystalline nature for the pristine of MNPs, MNP-D, MNP-D-CUR, MNP-D-NAR and MNP-D-CUR-NAR had been confirmed by XRD analysis (Fig. 1(b). The data identified six diffraction peaks corresponding to the six faces which were characteristic for the single phase spinal structure of Fe3O4; (220), (311), (400), (422), (511) and (440). The full width at half maximum (FWHM) of the major diffraction peak (311) was used to calculate the average of particle size. The estimated average of the particle-sizes using the Scherrer formula was D = 0.9 λ/β cosθ where λ is the wavelength of X ray (0.1541 nm), β is the full width at half maximum (FWHM), θ is the diffraction angle and ‘d’ is the particle diameter size. For the pristine, dextran coated, CUR-D, NAR-D and CUR-NAR-D-MNPs were 17.7, 11.95, 21.26, 21.26 and 15.17 nm, respectively. The magnetic behavior of the synthesized magnetic nanoparticles was examined using a vibrating sample magnetometer (VSM) (Fig. 1(c). The results showed that all samples exhibited superparamagnetic properties. The saturation magnetization-values (M) of the MNPs, MNP-D-CUR, NAR-D-MNPs, and MNPs-D-CUR-NAR were 61.145, 49.945, 51.261 and 50.52 5emu/g, respectively. TEM-micrographs presented in (Fig. 1(d), show the morphology and size of nanoparticles which appeared spherical aggregates, with smooth surfaces, and with sizes < 10 nm. The hydrodynamic size distributions of the nanoparticles were investigated by DLS analysis. The nanoparticles size was approximately 193 nm in the case of naked MNPs (Fig. 1(e). Particle size distribution curves exhibited only one-peak with a relatively high polydispersity index indicating the MNPs aggregation in the solution. The size of D-MNPs was decreased to 90 nm (Fig. 1(f), which could be contributed to the impact of D-coating on protecting MNPs from aggregation and consequently results in the high dispersion capability of MNPs. The particles size of CUR-D (Fig. 1(g), NAR-D (Fig. 1(h) and CUR-NAR-D-MNPs (Fig. 1(i) were 76, 95 and 88 nm, respectively. Zeta potential average (ZPA) estimates the surface charge of nanoparticles and can be indicative to the extent of their stability. Regarding MNPs and D-MNPs, the zeta potential values were –0.896 and –23.1 mV, respectively (Fig. 1(e and f). Coating MNPs with D caused a significant decrease in the zeta potential. It is considered that the negative value of zeta potential for MNPs emphasized the existence of OH-groups on the surface of MNPs. Thereby, reducing surface charge after D coating confirmed the presence of hydrogen bonding between the O-groups of D and the hydroxyl group of MNPs. The ZPA values were –21.2 mV for CUR-D-MNP (Fig. 1(g), –16.9 mV for NRG-D-MNP (Fig. 1(h), and –17.8 mV for CUR-NAR-D-MNP - (Fig. 1(i).
Fig. 1
Structural characterization of nanoparticles, (a) FT-IR spectra, (b) XRD analysis, (c) vibrating sample magnetometer (VSM) analysis, (d) TEM micrograph images, (e-i) the hydrodynamic size distributions and zeta potential of the nanoparticles were investigated by DLS analysis. The nano-particles size was about 193 nm in the case of naked MNPs (e). The particle size distribution curves exhibited only one-peak with a relative high polydispersity index indicating the MNPs aggregation in solution. The size of D-MNPs was decreased to 90 nm (f), which could be contributed to the impact of dextran coating on protecting MNPs from aggregation and consequently results in high dispersion capability of MNPs. While the particles size of CUR-D (g), NAR-D (Fig. 1h) and CUR-NAR-D-MNPs (i) are 76, 95 and 88nm, respectively. ZPA estimates the surface charge of nanoparticles and can be indicative to the extent of their stability. Regarding MNPs and D-MNPs, the zeta potential values were –0.896 and –23.1 mV, respectively (e and f). Evidently, coating MNPs with dextran caused a significant decrease in zeta potential. It is considered that the negative value of zeta potential for MNPs pointed out to the existence of OH-groups on the surface of MNPs. Thereby, reducing in surface charge after dextran coating confirming the presence of hydrogen bonding between the O-groups of dextran and hydroxyl group of MNPs. ZPA for CUR-D-MNP –21.2 mV (g), NRG-D-MNP –16.9 mV (h) and CUR-NAR-D-MNP –17.8 mV (i).
3.2In vitro results
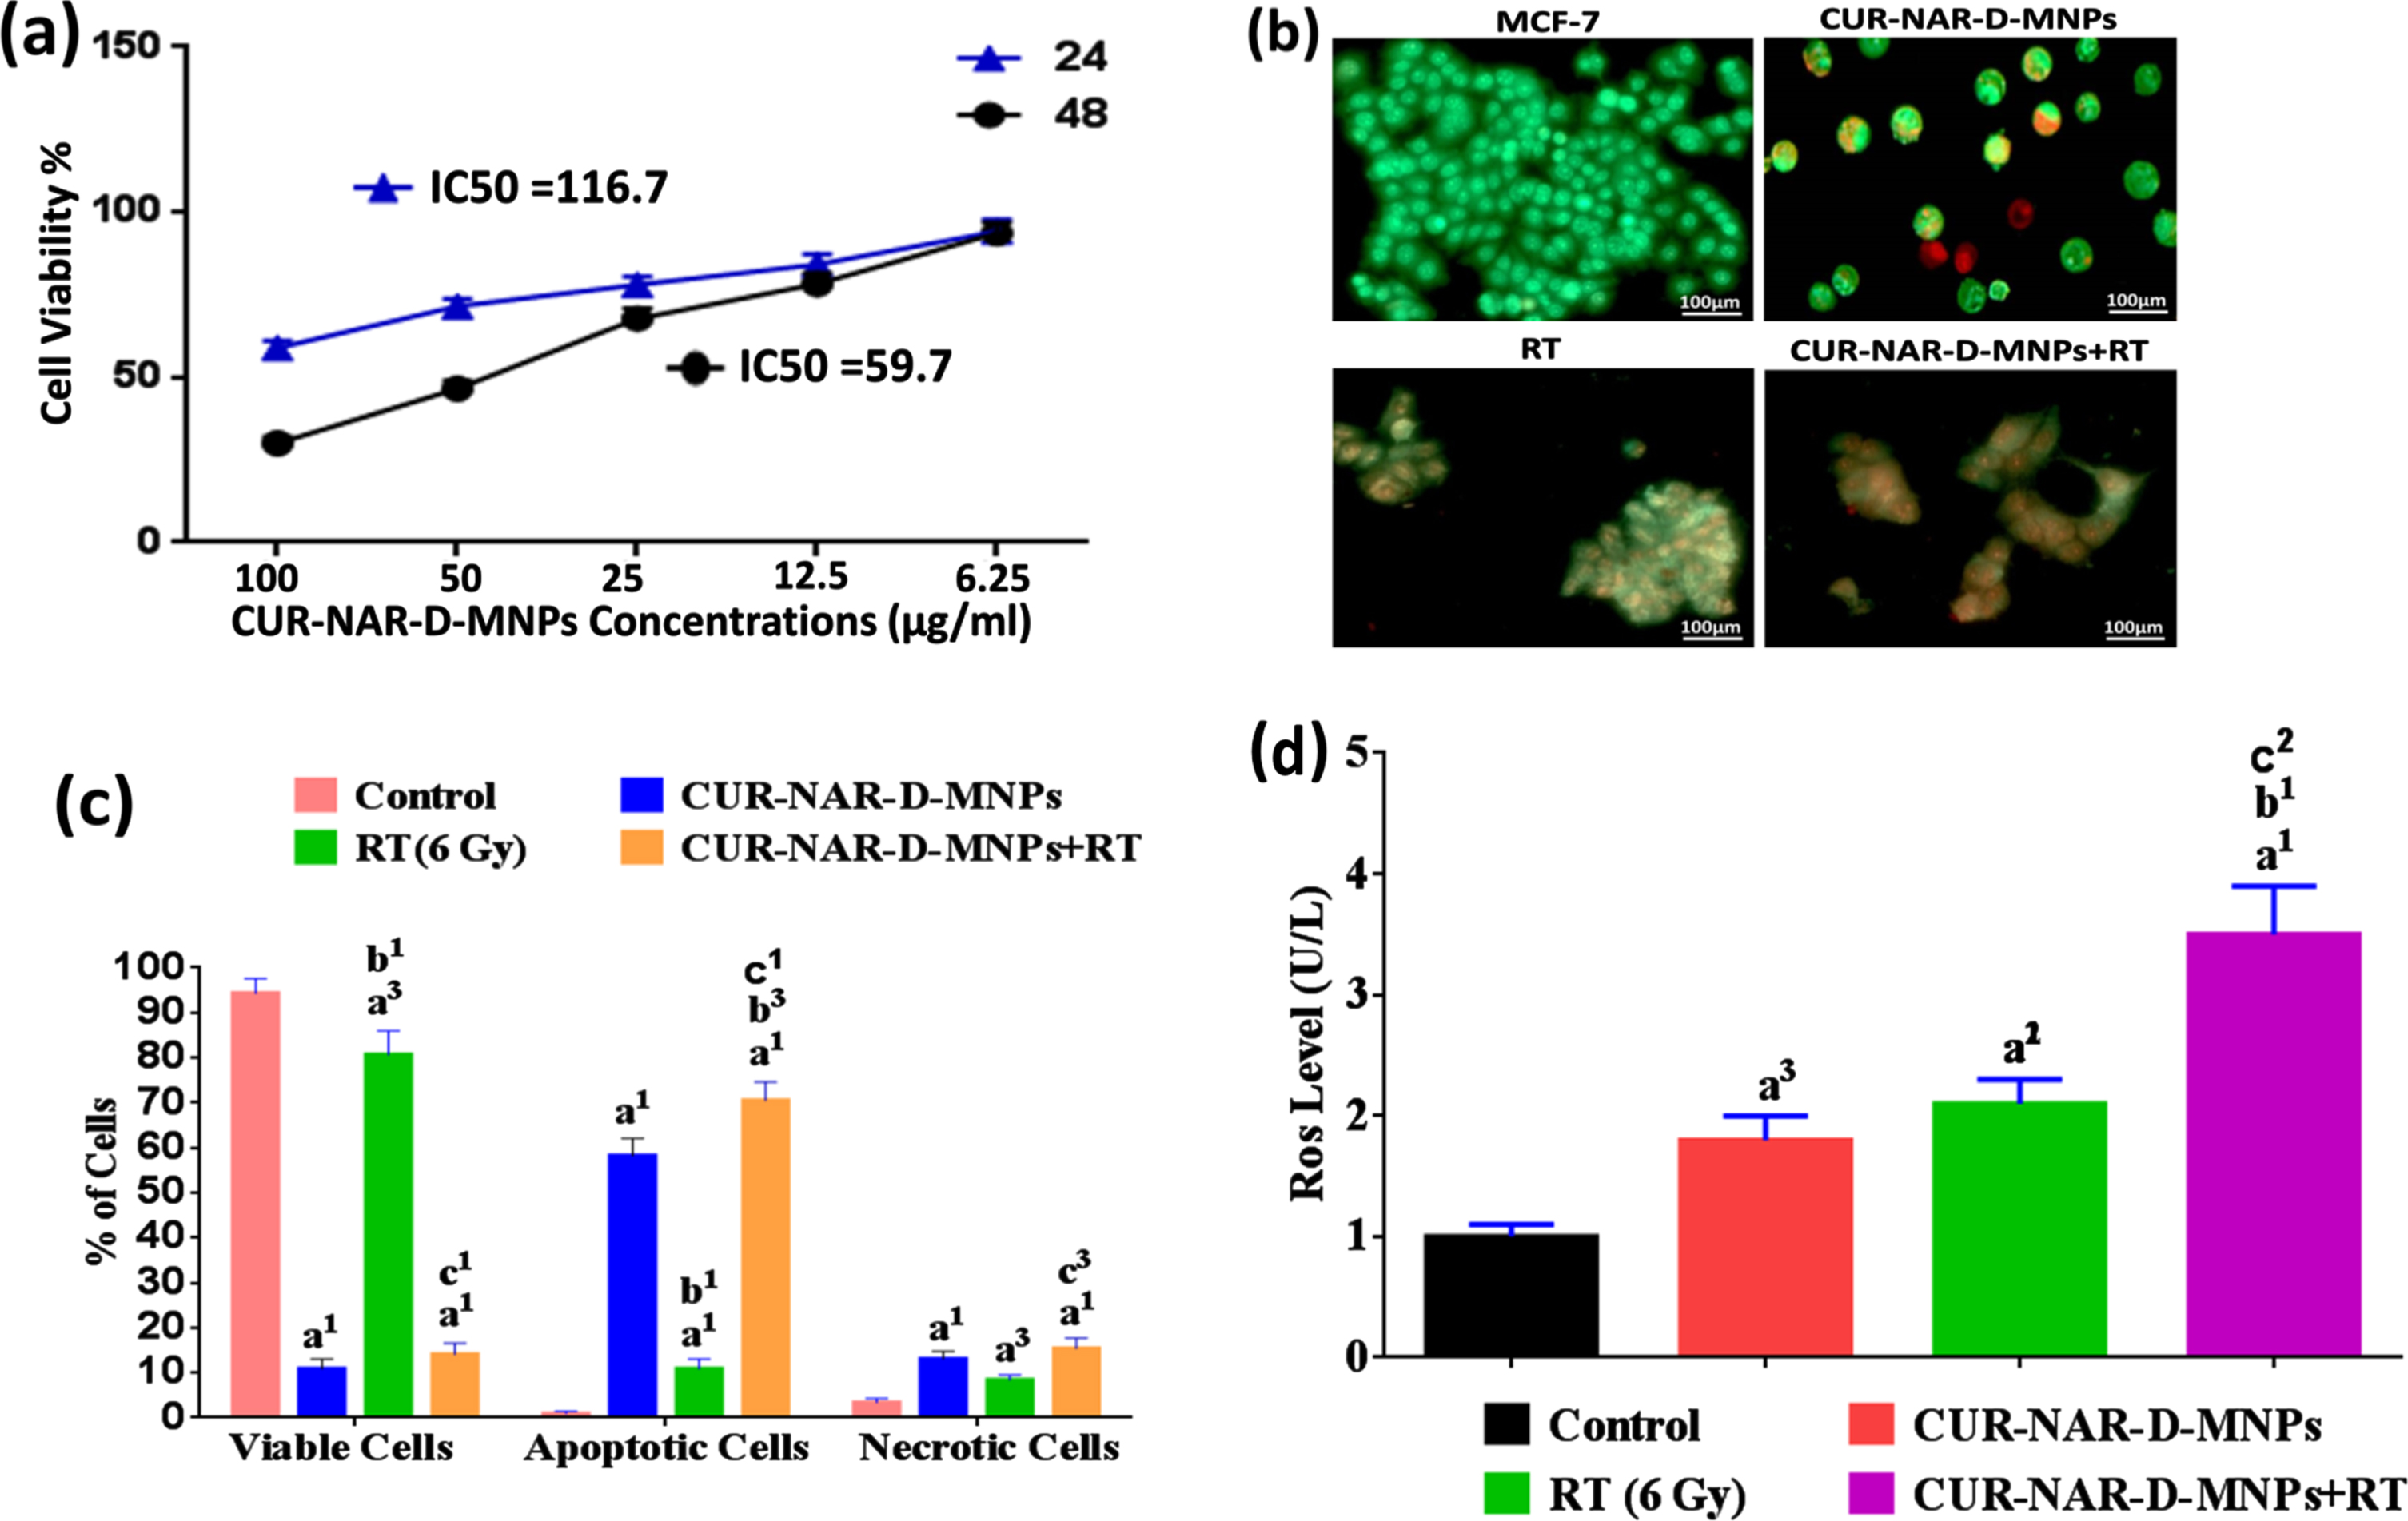
In the present study, two in vitro experiments were conducted. The MTT cell viability assay was examined on MCF-7-cells. Cells were treated with different concentrations of the CUR-NAR-D-MNPs ranging from 6.25 to 100μg/ml for 24 and 48 h of initial treatment to clarify the role of time exposure. Results were expressed as means±SEM for three independent determinations. Viable cells were 58.9±3.4 and 30.1±3.4 %at the high concentration (100μg/ml) and IC50 values recorded 116.7±4.9 and 59.7±4.9 after 24 and 48 h of initial incubation, respectively (Fig. 2(a). Based on our observation, the great inhibition of cell viability was obtained after 48 h of incubation, indicating that time is the most effective for anti-proliferative effects. Therefore the 59.7μg/ml concentration of CUR-NAR-D-MNPs was used in the rest of the in vitro studies. The second in vitro experiment aimed to determine whether the inhibition of cell proliferation by CUR-NAR-D-MNPs (59.7μg/ml) was due to the induction of cell death, considering apoptosis and necrosis, and also to examine the radiosensitization effect of CUR-NAR-D-MNPs using AO/EB method. Fluorescence microscopy images indicated that the untreated cells appeared green (Fig. 2). After 48 h of initial incubation, CUR-NAR-D-MNPs caused early apoptotic cells (bright green to yellow), late apoptotic cells (orange) and necrotic cells (red) (Fig. 2(b). Quantitative analysis recorded 94.3±3.2, 0.3±0.05 and 3.4±0.9 of viable, apoptotic, and necrotic cells, respectively in the control cells. The CUR-NAR-D-MNPs treatment for 48 h significantly increased the percentage of apoptotic and necrotic cells to 58.5±3.9 and 13.1±1.7, respectively, compared with control cells. A single dose of radiotherapy (6 Gy) resulted in late apoptosis, which appeared as cell aggregation (orange), and the percentage of apoptotic and necrotic cells significantly increased by 10.9±2.2 and 8.4±1.1, respectively, compared with control cells. However, the 48 h incubation with CUR-NAR-D-MNPs before RT caused a higher significant increase in the percentage of apoptosis and necrosis by 70.5±4.1 and 15.4±2.3 respectively, than did the RT and CUR-NAR-D-MNPs groups (Fig. 2(b and c) which indicated an enhanced killing efficacy by CUR-NAR-D-MNPs as radiosensitizing agent. Therefore, the anticancer effect and radiosensitization of primary therapeutic drugs may be potentiated with ROS generation by CUR-NAR-D-MNPs. To test this hypothesis, we used MCF-7 cells and analyzed the ROS expression (Fig. 2(d). After treatment with CUR-NAR-D-MNPs or RT for 48 h, we showed a significant increase in the ROS level compared with that in the control group. The combination of CUR-NAR-D-MNPs+RT showed a significant increase in ROS level compared with that in all treatments indicating that CUR-NAR-D-MNPs has a dual effect of anti-proliferative and radiosensitization.
Fig. 2
(a) Dose dependent cytotoxicity and IC50 values of CUR-NAR-D-MNPs on MCF-7 cell lines at 24 h and 48 h treatment. (b) Fluorescence microscopic images for viable cells, apoptotic cells and necrotic cells of different groups at 48 hr. (c) bar chart of %of viable, apoptotic, necrotic cells at 48 h, (d) bar chart of ROS level. Values expressed as the mean±SEM, n = 5. a1p < 0.001, a3p < 0.05 vs. control; b1p < 0.001, b3p < 0.05 vs. CUR-NAR-D-MNPs group; c1p < 0.001, c3p < 0.05 vs. RT group.
3.3In vivo Results
3.3.1Acute toxicity study of CUR-NAR-D-MNPs: estimation of LD50, gross visual and histological examination
No mortality, adverse effects, and clinical signs after treatment were noted with any of the concentrations used (500, 1000, 2000 and 4000μg/kg single dose or repeated dose) of CUR-NAR-D-MNPs suggesting that the LD50 appeared to be higher than 4000μg/kg.
Gross visual examination revealed no changes in the morphology of the internal organs of animals of the treated group compared with that of the control (Fig. 3(a). Histological findings recorded no difference in liver and kidney tissues after the single-dose of CUR-NAR-D-MNPs (4000μg/kg) compared with that of the control (Fig. 3(b).
Fig. 3
Cytotoxicity of CUR-NAR-D-MNPs (single dose or repeated dose). (a) Morphological state, (b) Histopathology of tissues were observed by hematoxylin and eosin stain (H&E, upper panel, 400X), c) hematological indices, (d, e, f) biochemical parameters. Values are expressed as the mean±SEM, n = 5. a2p < 0.01, a3p < 0.05 vs. control.
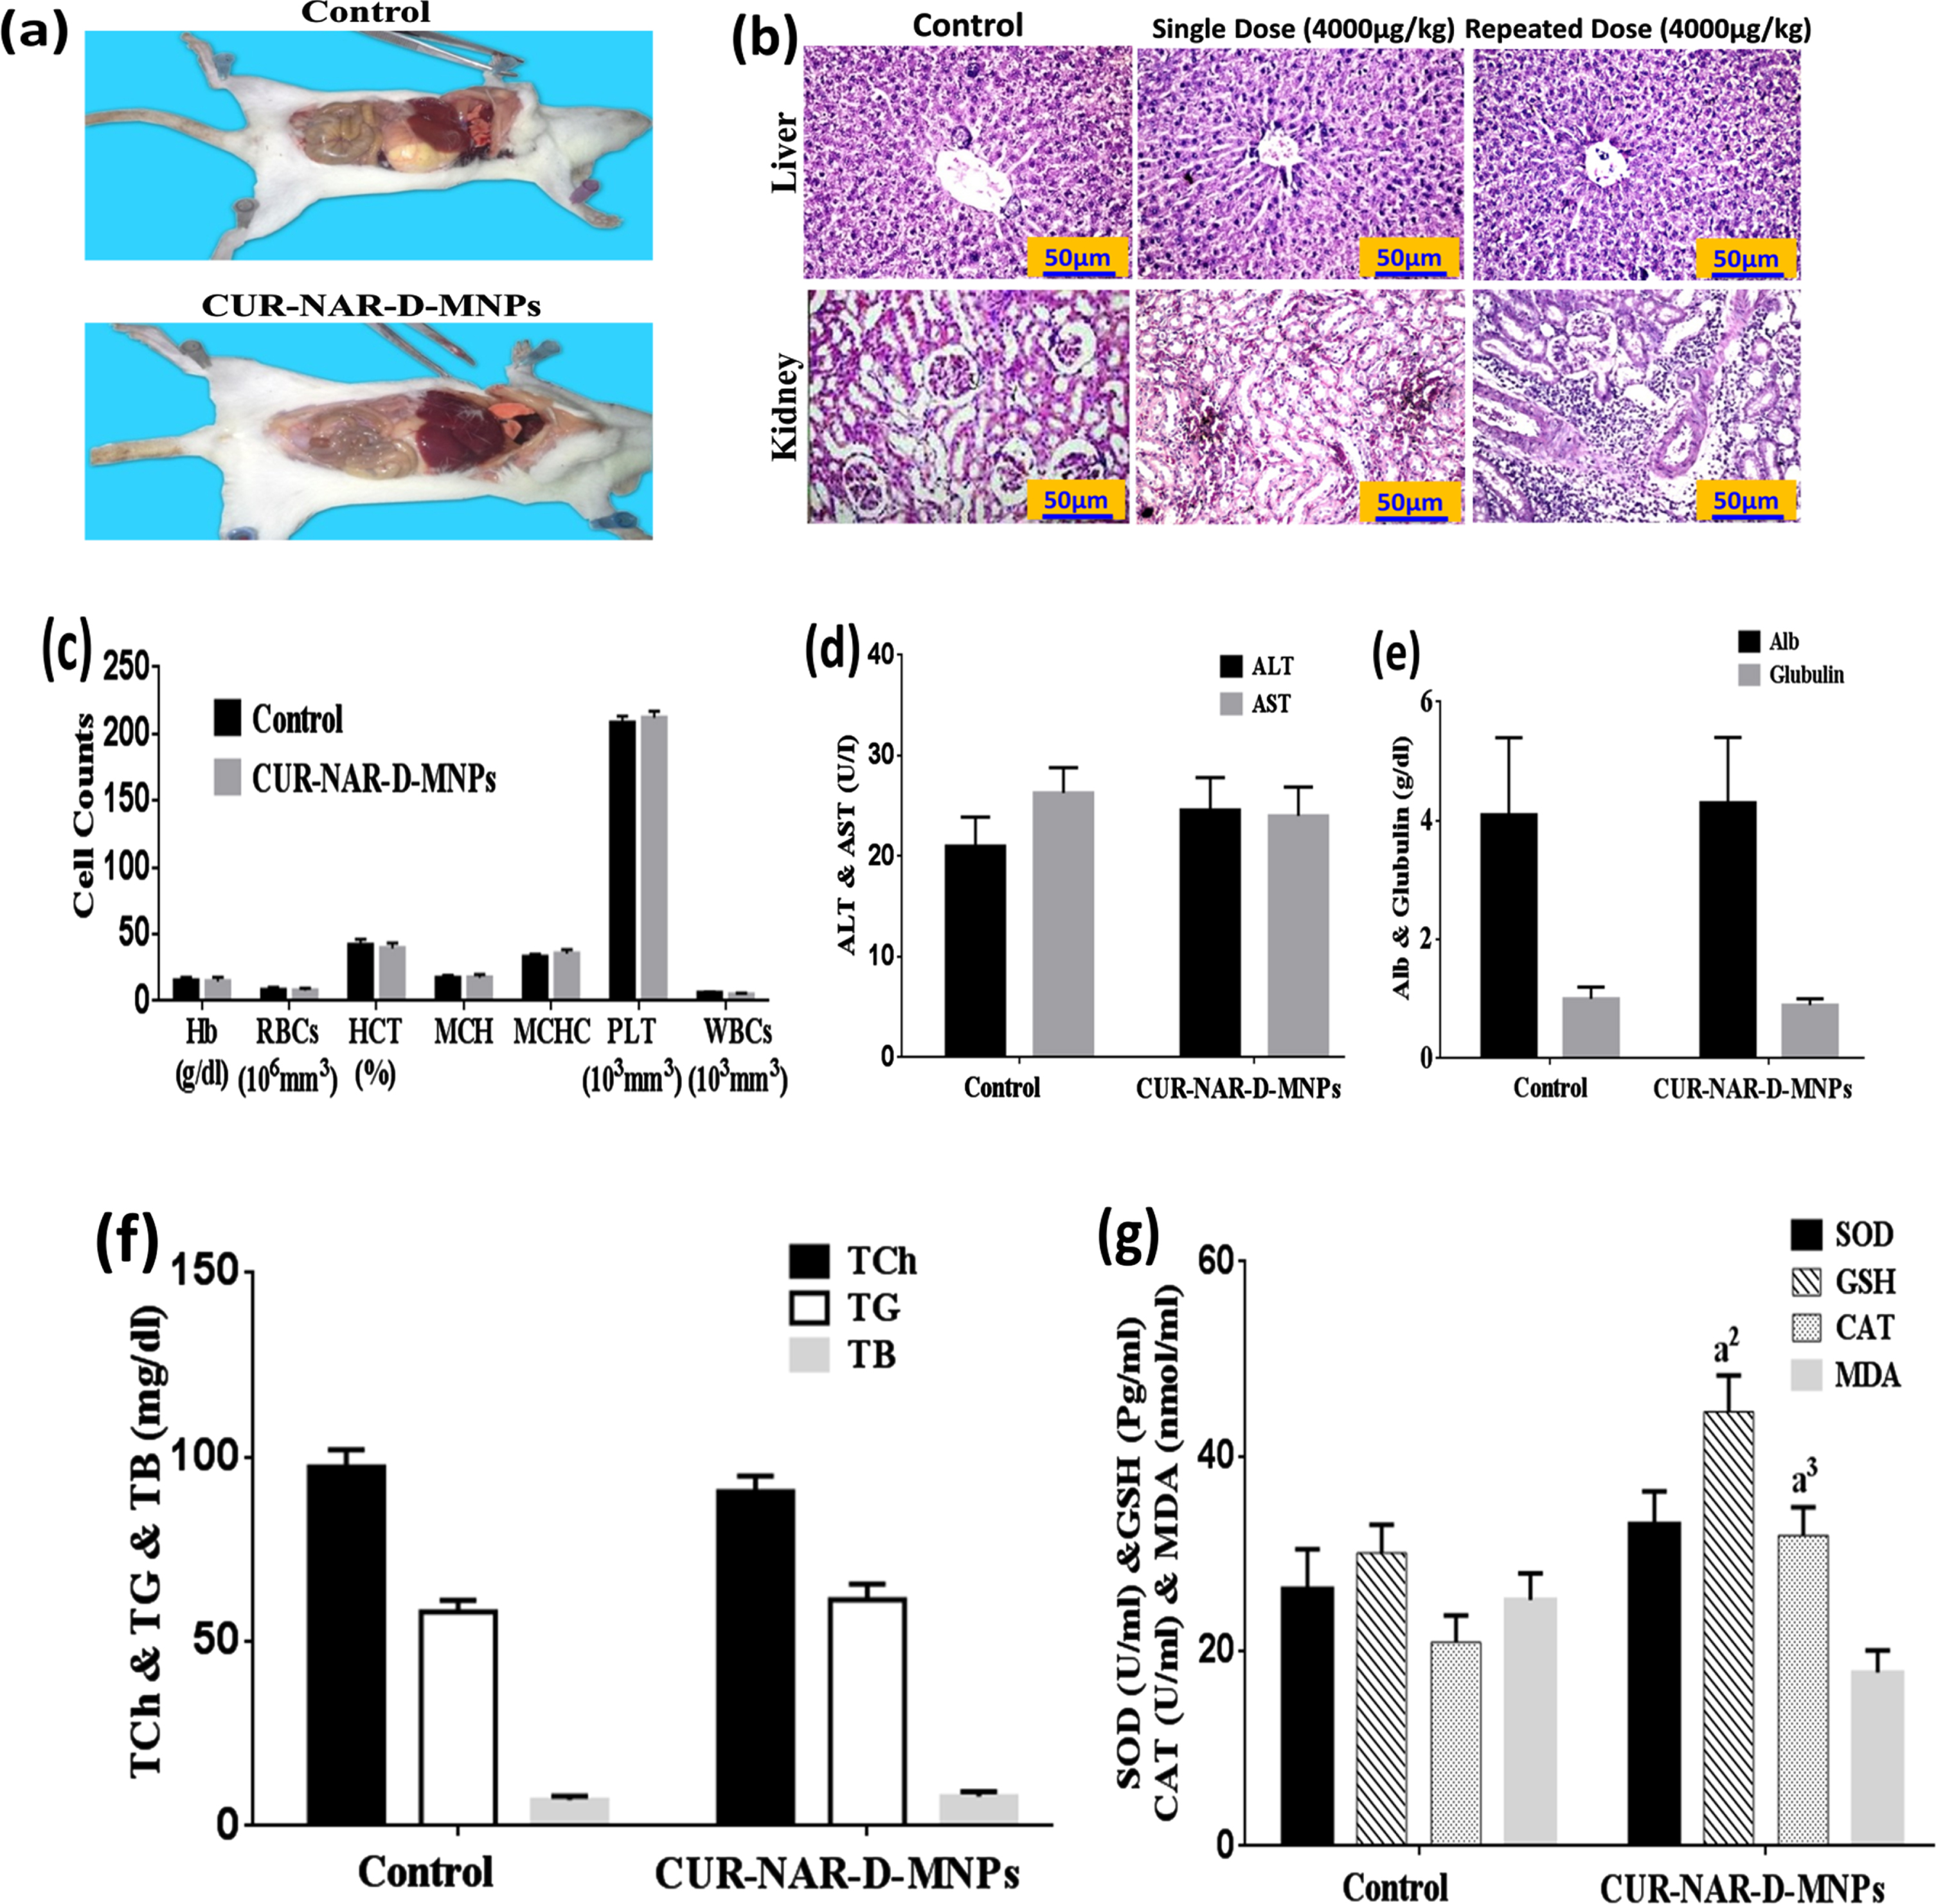
Additionally, no mortality and significant changes in the body weight were observed in the chronic treatment via the administration of 1000μg/kg repeated dose of CUR-NAR-D-MNPs per week for 4weeks (Table 1). Furthermore, nonsignificant changes in the histological features in the liver and kidney compared with the control (Fig. 3(b). Moreover, nonsignificant changes were not observed in the hematological (Fig. 3(c) and biochemical parameters (ALT, AST, Alb, glubulin, Total Cholesterol, TG, TB, SOD and MDA) compared with the control group (Fig. 3(d, e, f and g). However, the CUR-NAR-D-MNPs group was recorded to have significant elevations in the GSH and CAT levels compared with control-group (Fig. 3(g).
Table 1
Effect of CUR-NAR-D-MNPs on Morphological State
| Groups | Control | CUR-NAR-D-MNPs (Repeated-dose (4000μg/kg)) | P value |
| Parameters | |||
| Number of animals | 3 | 3 | –––– |
| Body Weight | 139.3±13.6 | 141.2±20.9 | NS |
| Mortalities | 0 | 0 | NS |
The values expressed as mean±SEM, n = 3 animals/group.
3.3.2Effect of CUR-NAR-D-MNPs on histopathological indices, mortality, body weight gain, tumor weight and tumor volume in tumor-bearing rats
Fig. 4(b) illustrated the histopathological examination for the mammary tissues. No tumors were observed in the sections of the image of the control-group. Images of the sections appeared with normal mammary tissue (a) and terminal duct tubules, and fatty tissue with normal acini (b). However, a solid mammary tumor was seen in the tumor-bearing group (DMBA-MPA) group.
Fig. 4
Effect of CUR-NAR-D-MNPs on breast tumor growth in rat model. a) Schematic diagram of the experimental procedures for five different treatment groups, (b) Morphological statues, rat bearing tumors, isolated tumors from rats and histopathology by (H&E 400X) for all groups.
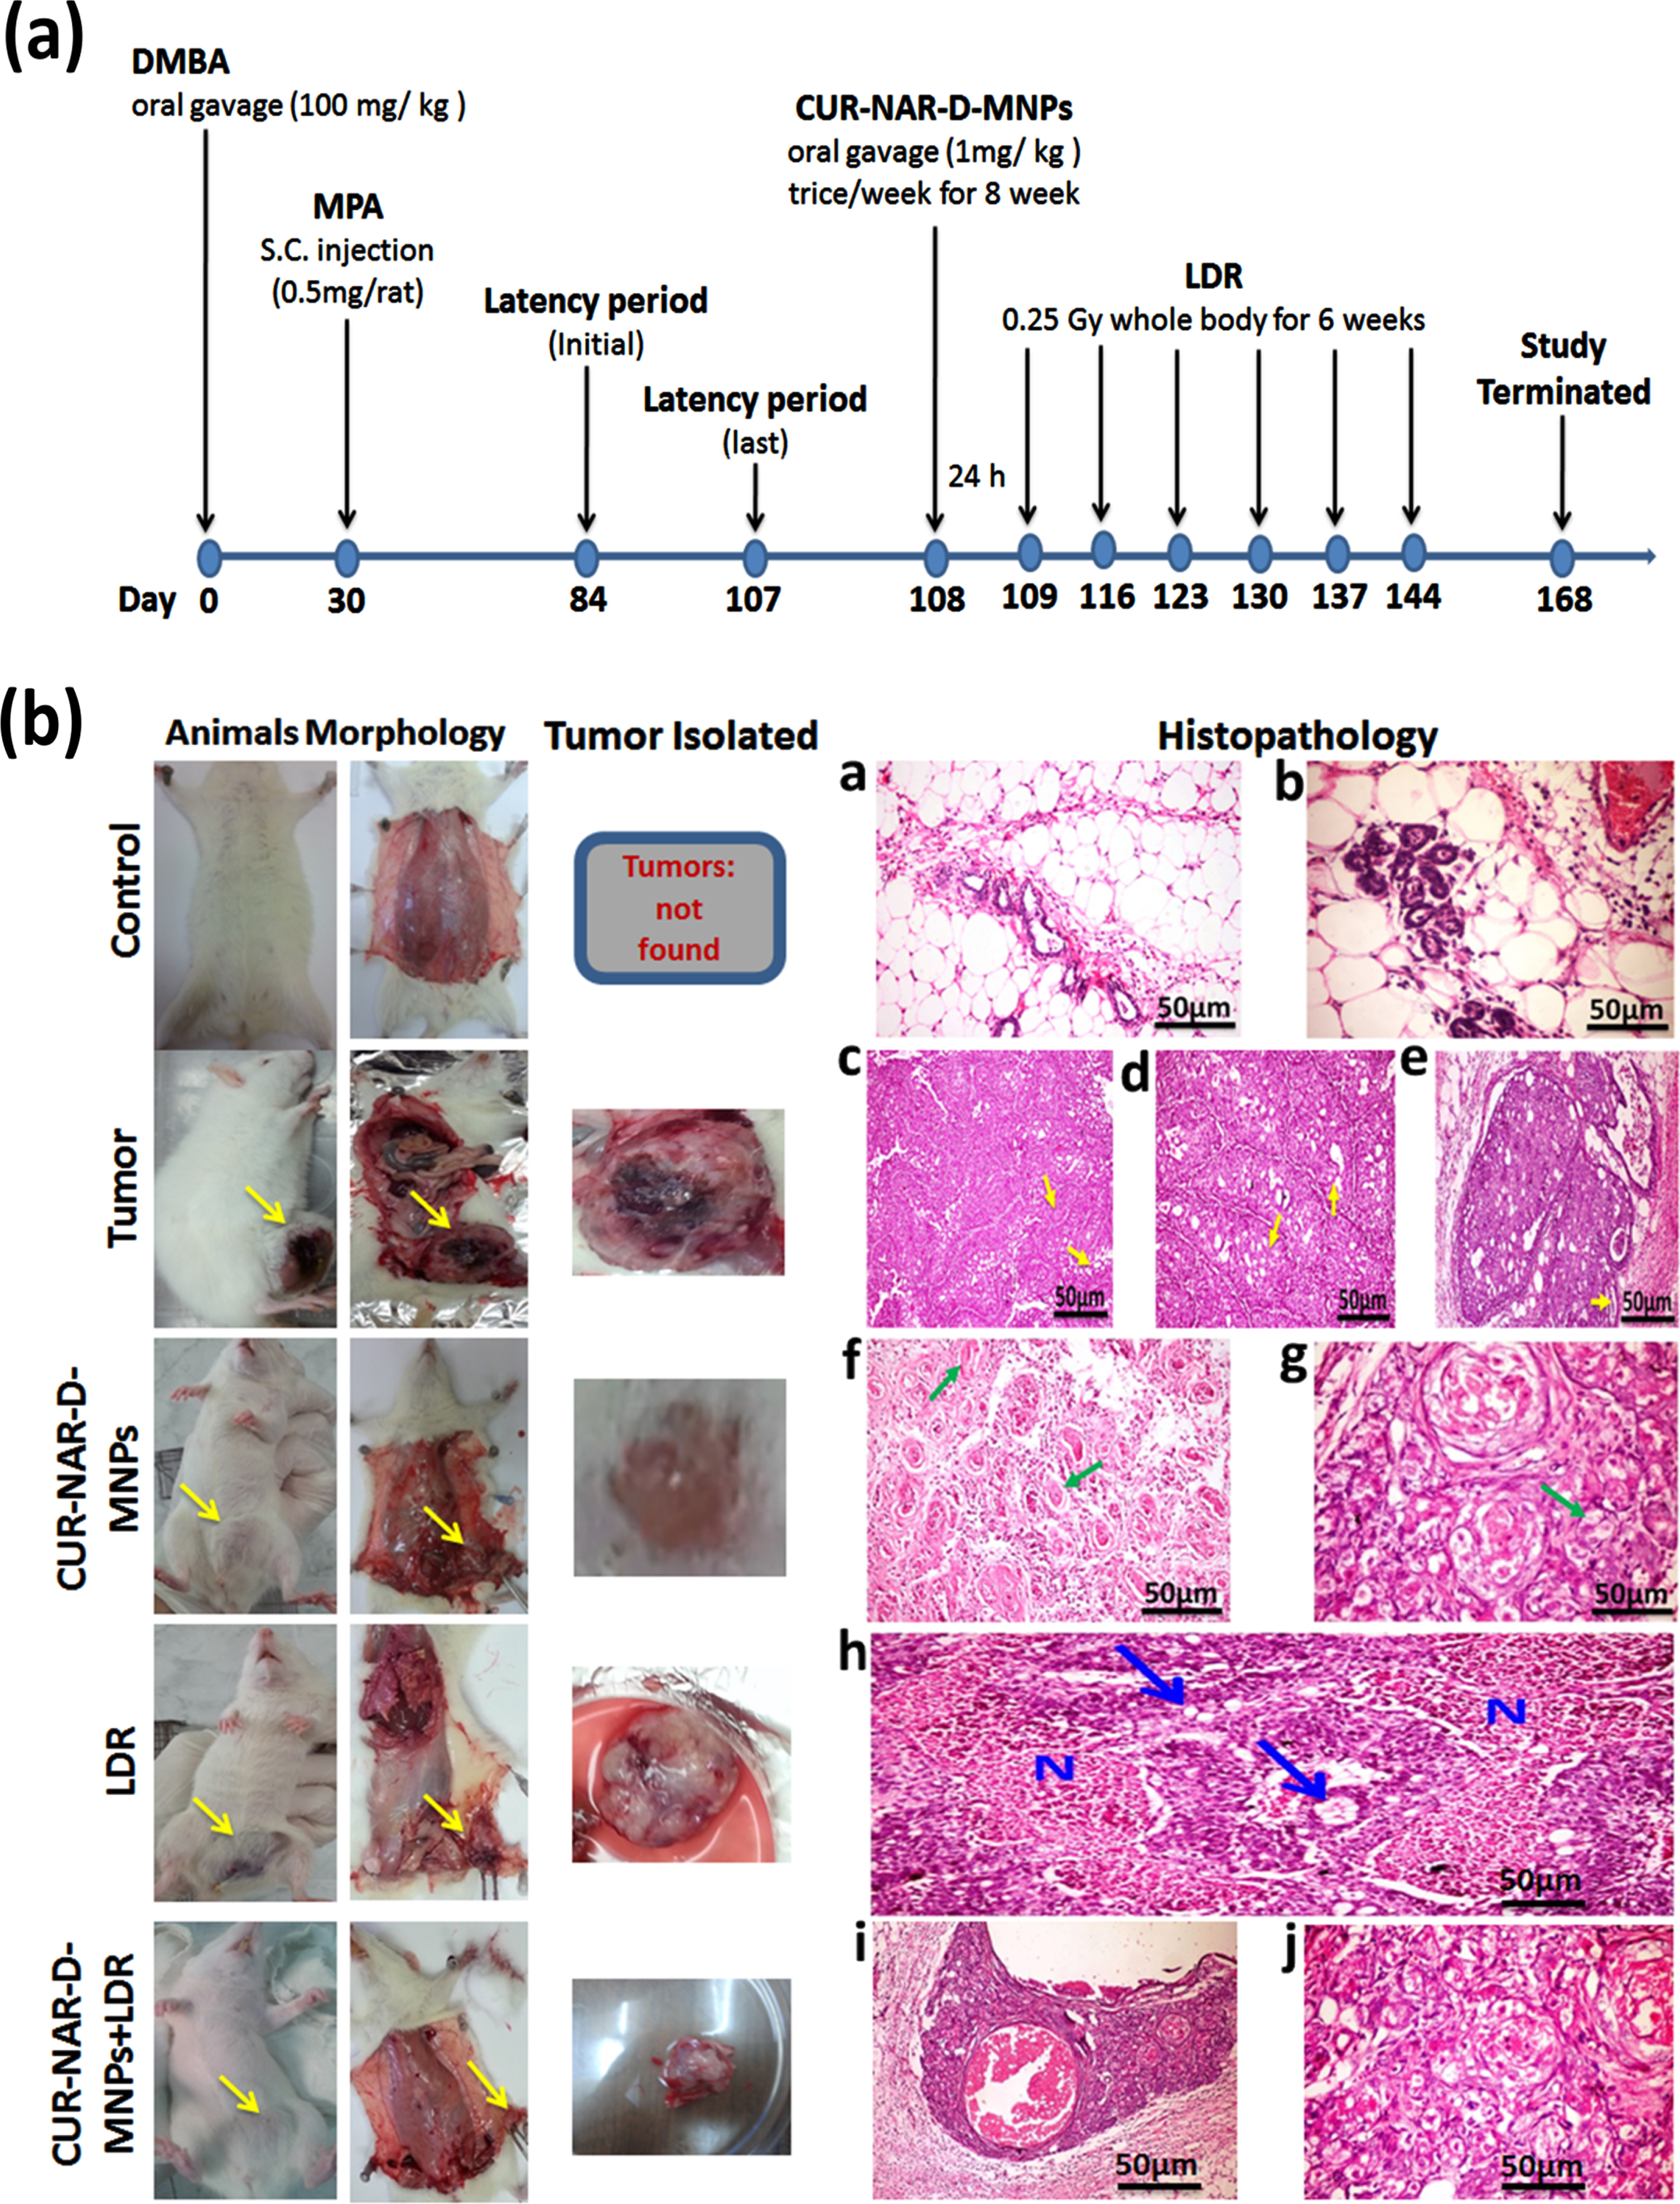
The first tumor was observed on day 44 of the initial induction of DMBA, (16-days after the first MPA injection and on day 104 of the animal age) with a 67-days latency period. The histopathological examination of the mammary tissue sections of the tumor group showed solid adenocarcinoma cells separated by thin fibrous bands (arrows) (c), several empty spaces (arrows) and cribriform adenocarcinoma with multiple spaces within the solid masses of the tumor some were empty (d), and others contained pink proteinaceous secretion (arrows) (e).
The administration of CUR-NAR-D-MNPs (1 mg/kg, three doses/week for 8 weeks) in the treated group caused marked regression in the tumor compared with that in the tumor- bearing group. Histopathological sections showed marked necrosis of the neoplastic cells; several pyknotic nuclei with marked vacuolization and cellular debris were distinguishable in association with eosinophilic necrotic patches (f). In addition, histopathological sections revealed haphazard arrangement and extensive nuclear pyknosis accompanied by several apoptotic bodies, and cellular debris was distinguishable in association with eosinophilic necrotic patches (g).
Regarding the effect of LDR treatment on the mammary tissue of rats, the examination of mammary tissue sections of tumor-bearing rats delivered LDR alone showed cancer cells necrosis, which appeared as large eosinophilic granular areas of necrosis among the tumor masses (blue arrow). Some of the later neoplastic cells showed cytoplasmic vacuolation (N) (h).
For the combination therapy (CUR-NAR-D-MNPs+LDR), the photographs showed marked swelling, vacuolation with nuclear pyknosis and necrosis of cancer cells, with the presence of large cystic fluid filled spaces in some cases and marked inflammatory reactions as well (i).The figures also, showed the beginning of fibrous bands proliferation among groups of cancer cells (j).
Additionally, 24 of 110 (21%) mortalities were noted in animals after DMBA feeding and intramuscular (IM) injection of MPA, which may be due to DMBA-toxicity. The tumor group had a significant decrease in weight-gain compared with the control group. Meanwhile, the rats treated with CUR-NAR-D-MNPs and/or LDR had a significantly increased weight gain compared with the tumor group. Otherwise, the rats treated with CUR-NAR-D-MNPs and/or LDR caused had a significant regression in tumor volume and weight, compared with the tumor group (Table 2).
Table 2
Effect of CUR-NAR-D-MNPs on Morphological State, tumor weight and tumor volume
| Groups | Control | Tumor | CUR-NAR-D-MNPs | LDR | CUR-NAR-D-MNPs + LDR |
| Parameters | |||||
| Number of animals | 10 | 15 | 15 | 15 | 15 |
| Body Weight | 178.4±9.6 | 133.2±8.1a1 | 165.2±5.2a3,b1 | 148.2±8.1a1,b3,c2 | 164.2±8.1a3,b1,d2 |
| Mortalities | 1.0 | 9.0a1 | 3.0a2 | 8.0a1 | 3.0b2,d2 |
| Latency period (Initial) | ––– | 84.0 | 87.0 | 88 | 86 |
| Latency period (last) | ––– | 101.0 | 107.0 | 106 | 105 |
| %of tumor incidence | ––– | 15.0 | 13.0 | 17 | 12 |
| Tumor weight (gm) | ––– | 13.7±2.2 | 6.1±0.8b2 | 10.5±0.8c3 | 4.1±0.8b1,d2 |
| Tumor volume (mm3) | ––– | 492.0±6.3 | 303.0±5.4b2 | 412.0±5.4c3 | 233.0±5.4b1,d2 |
Latency period: is the time of appearance 1st tumor after initial DMBA/MPA. The values expressed as mean±SEM. a1p < 0.001, a2p < 0.01, a3p < 0.05 vs. control; b1p < 0.001, b2p < 0.01, b3p < 0.05 vs. Tumor group; c2p < 0.01, c3p < 0.05 vs. CUR-NAR-D-MNPs group; d2p < 0.01 vs LDR.
3.4Effect of CUR-NAR-D-MNPs and/or LDR on cell cycle and apoptosis
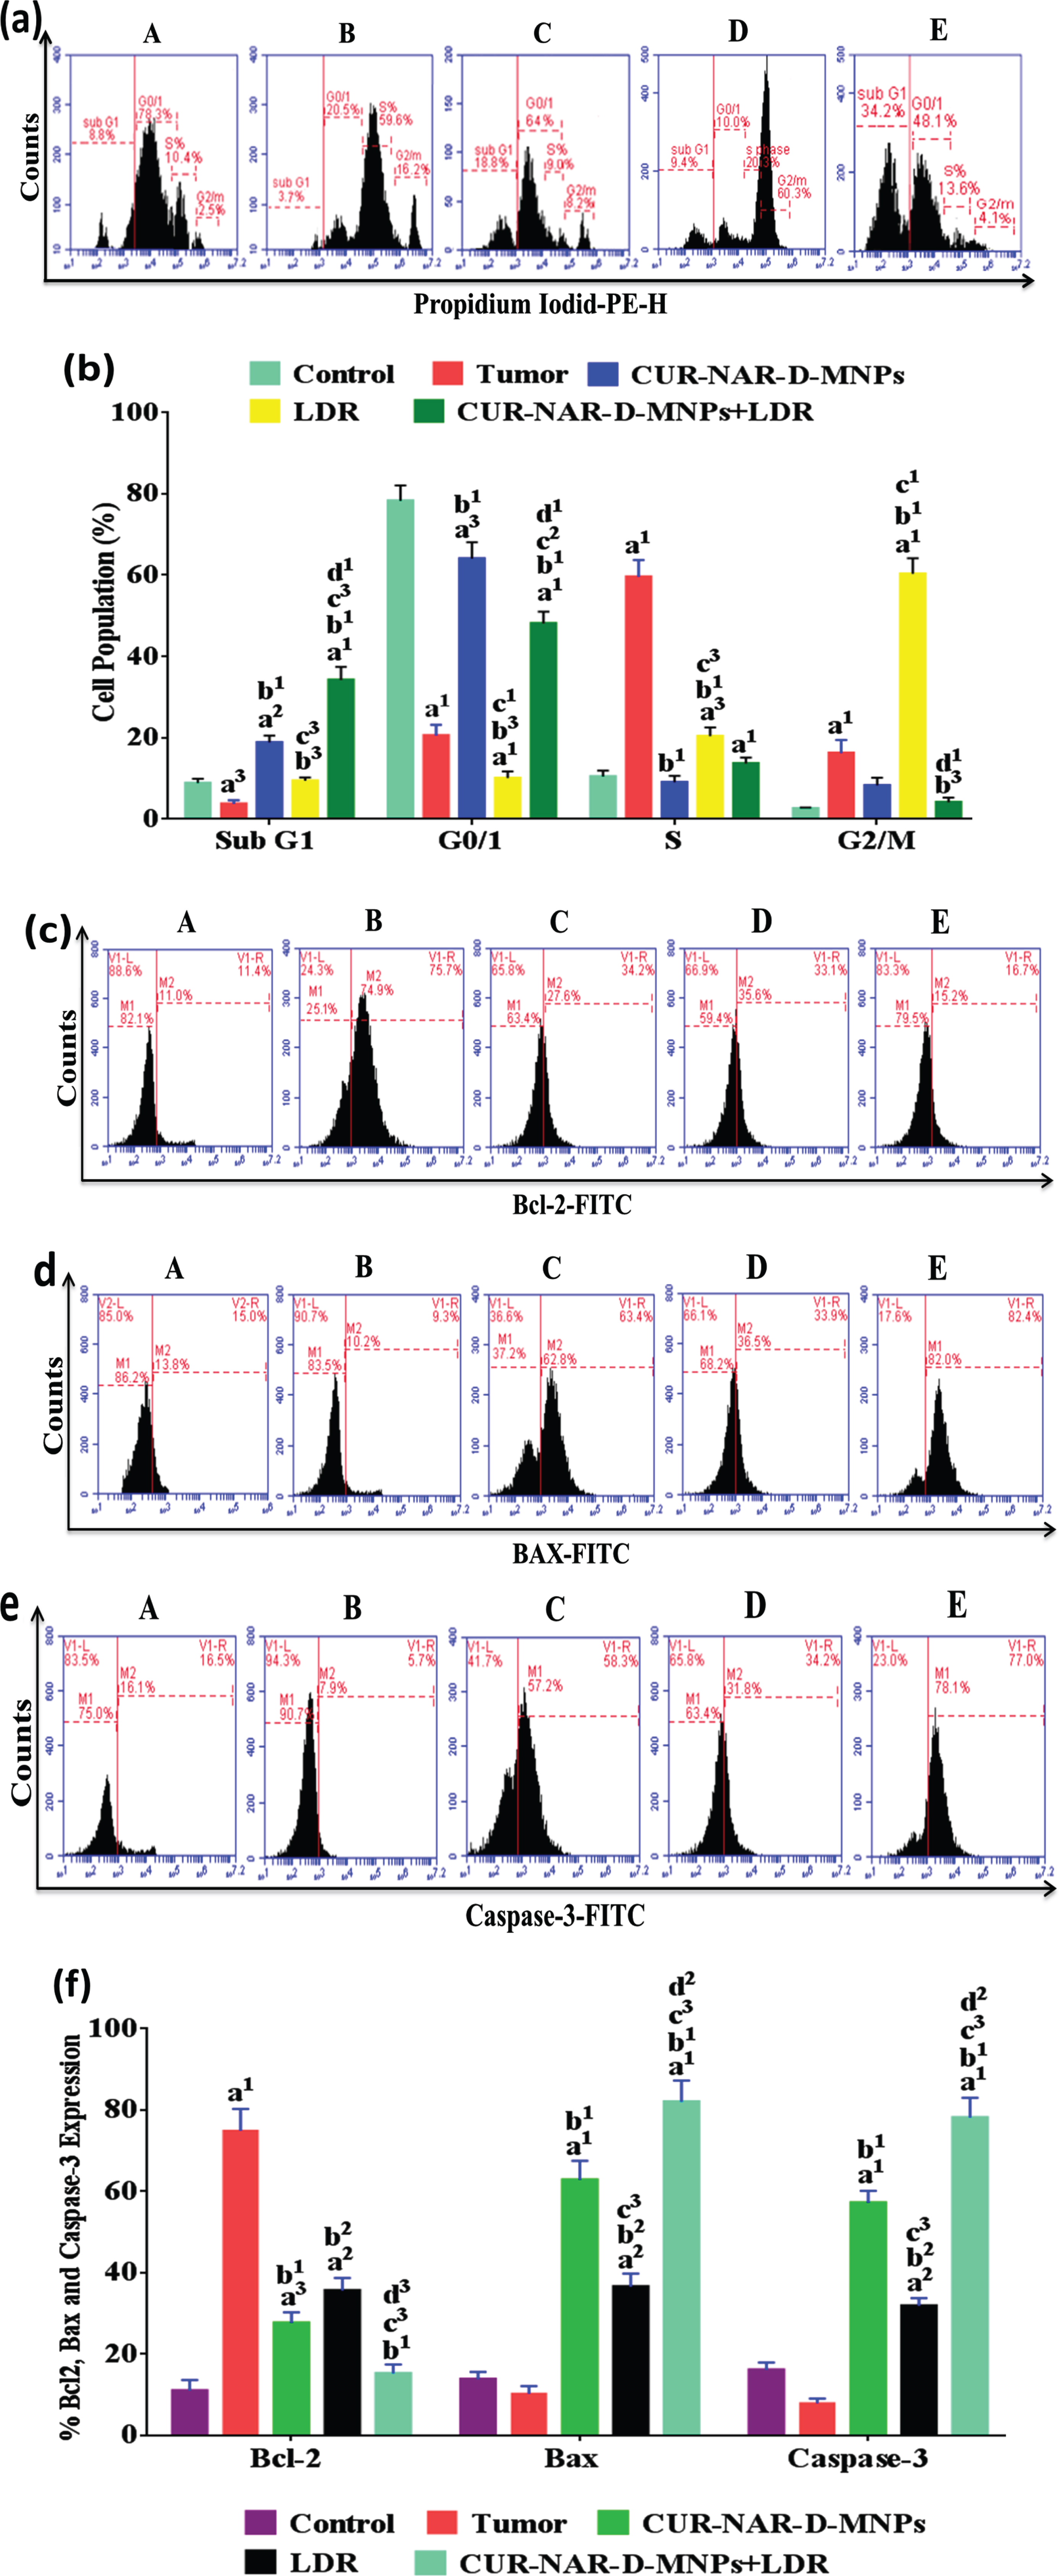
To investigate the mechanism behind the anticancer effect of CUR-NAR-D-MNPs and increased sensitivity to LDR in tumor-bearing animals, we analyzed cell cycle distribution, and apoptosis markers by flow cytometry. As shown in (Fig. 5), the majority of cells in the control group are blocked in the G1 phase before treatments. In addition, the distribution of the majority of cells in the tumor group was concentrated in the S phase with a significant increase in the level of anti-apoptotic Bcl-2, and a significant decrease in levels of the apoptotic Bax and caspase-3 levels compared with those in the control group. However, the treatment with CUR-NAR-D-MNPs induced an arrest to a proportion of cells in the G0/1 phase, with a significant increase in the sub G1 phase (apoptosis), a significant decrease in the Bcl-2 level, and a significant increase in the Bax and caspase-3 levels compared with the tumor or LDR groups. Furthermore, we found that the majority of cells in the LDR-treated rats were blocked in the G2/M phase compared with those in the tumor or CUR-NAR-D-MNPs groups. Additionally, the sub-G1 phase had a significant increase compared with that in the tumor group, with a significant decrease in the Bcl-2 level, and a significant increase in the Bax and caspase-3 levels compared with those in the tumor group. The combination treatment induced a higher proportion of cells in the G1 and sub G1 phases, with a highly significant decrease in the Bcl-2 level, and a highly significant increase in the Bax and caspase-3 levels compared with those in the tumor, CUR-NAR-D-MNPs and LDR groups.
Fig. 5
Antitumor mechanism induced by CUR-NAR-D-MNPs and/or LDR in rats via cell cycle arrest and apoptosis. (a) Flow cytometric images of cell cycle, (b) bar chart of of cell cycle, (c, d and e) Flow cytometric images of Bcl2, Bax and Caspase-3 respectively, (f) bar chart of accumulated data of Bcl2, Bax and Caspase-3. A, B, C, D and E) represent control, Tumor, CUR-NAR-D-MNPs, LDR and combination groups. The results presented as the mean±SEM, n = 5. a1p < 0.001, a2p < 0.01, a3p < 0.05 vs. control; b1p < 0.001, b2p < 0.01, b3p < 0.05 vs. Tumor group; c1p < 0.001, c2p < 0.01, c3p < 0.05 vs. CUR-NAR-D-MNPs group, d1p < 0.001, d2p < 0.01, d3p < 0.05 vs. LDR.
3.5Effect of CUR-NAR-D-MNPs and/or LDR on P53, P21, CD44, TNF-α and ROS
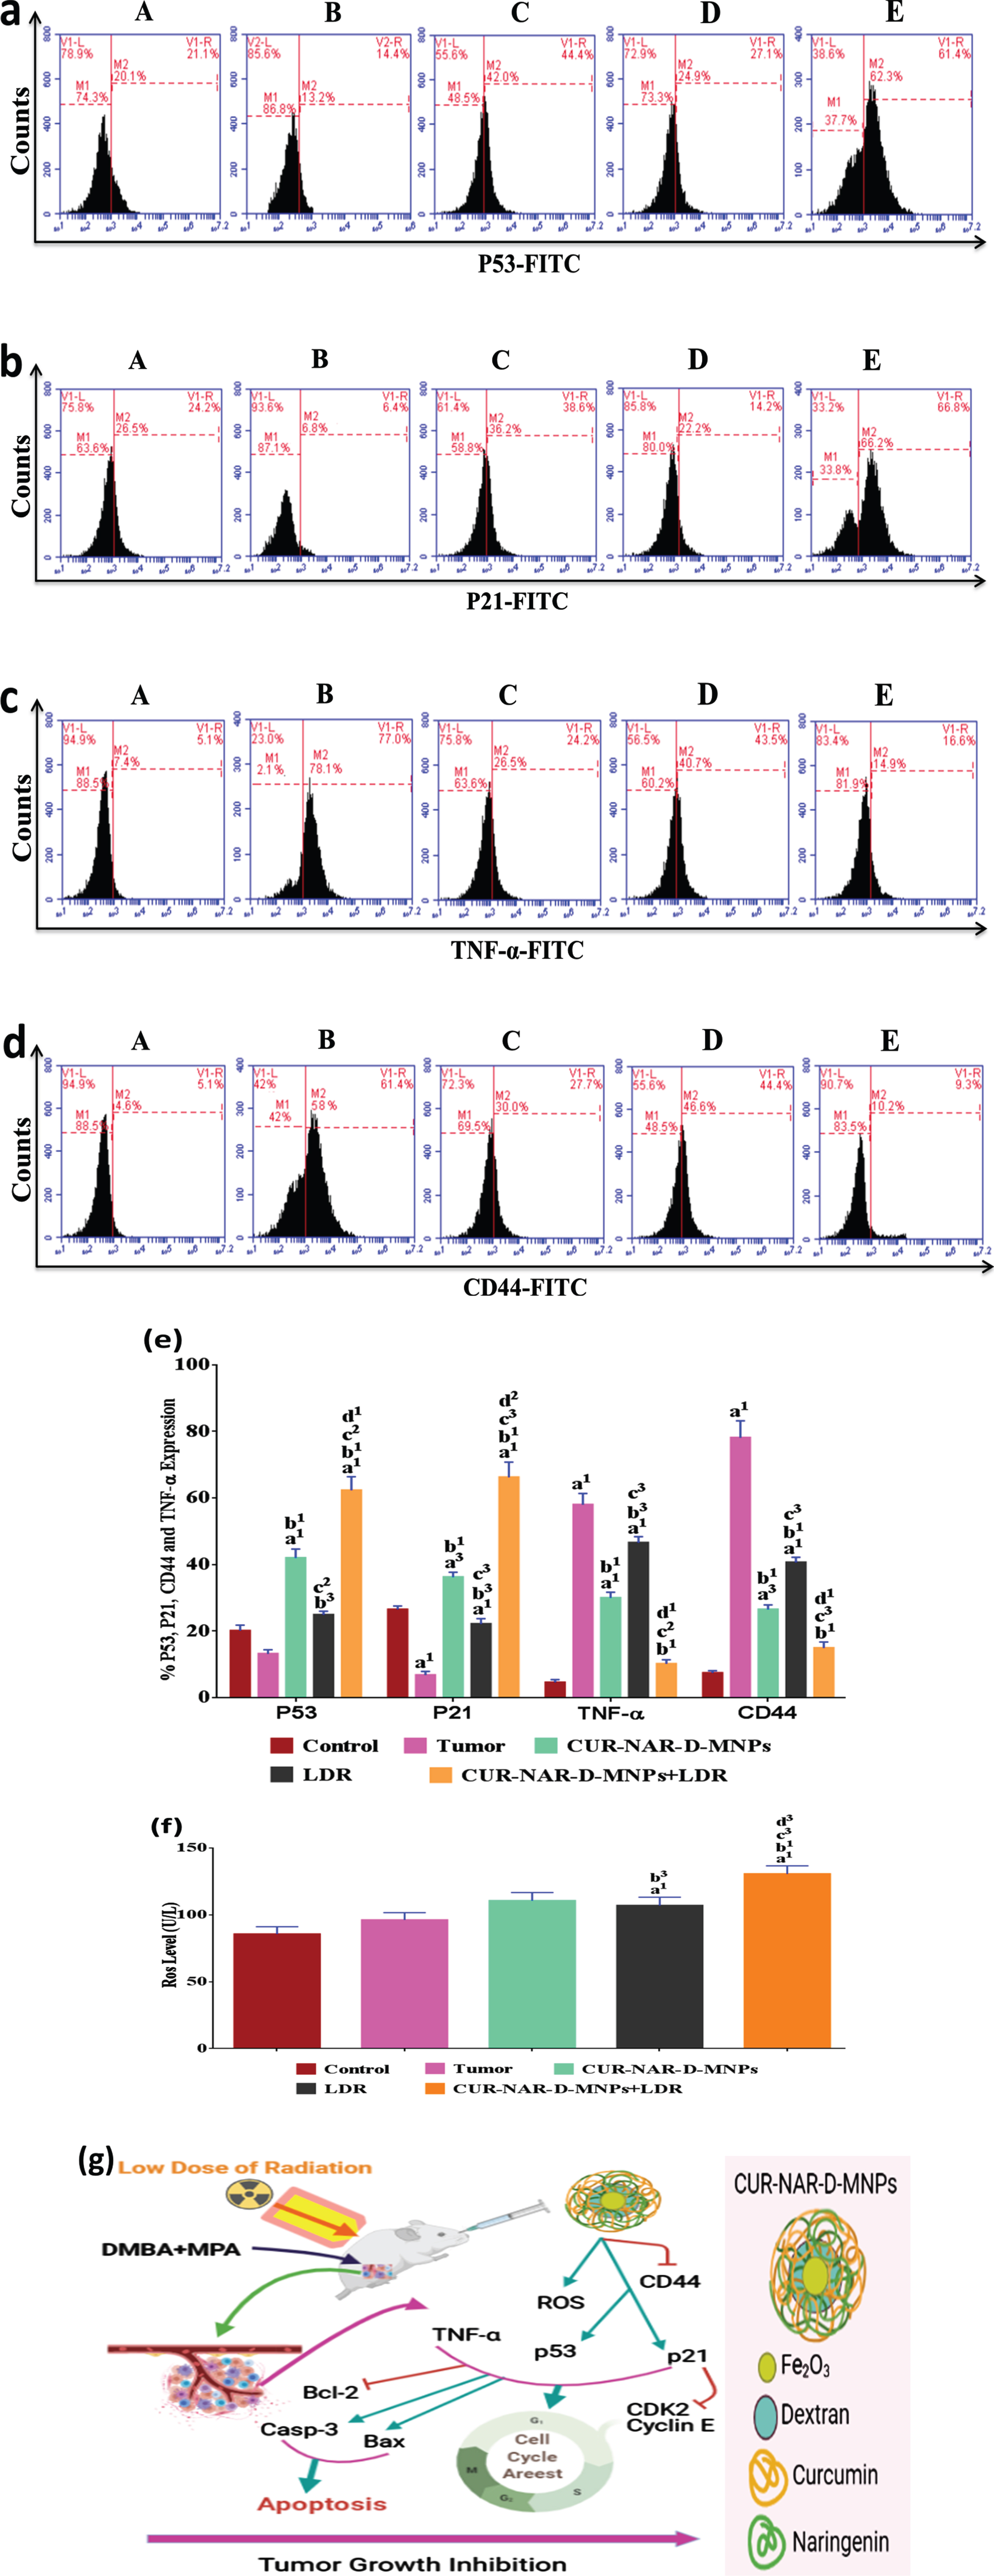
To further explore the underlying mechanism of tumor proliferation inhibition, cell cycle arrest and apoptosis induction of CUR-NAR-D-MNPs and/or LDR, a series of relative key proteins involved in cancer progression, cell cycle arrest and apoptosis regulation, including P53, P21, TNF-α, CD44 and ROS was investigated. As shown in (Fig. 6), the tumor group shows an underexpression of regulator proteins of cell cycle and apoptosis (p53, p21 and ROS) and overexpression of tumor promoting-proteins (TNF-α and CD44) compared with the control group without significant change in the p53 level. CUR-NAR-D-MNPs treatment significantly upregulated the P53, P21 and ROS levels, and downregulated the TNF-α and CD44 levels compared with the tumor or LDR groups. In addition, the results showed that treatment with LDR alone induced a moderate effect on the regulated-pathway of cell cycle and apoptosis by upregulating the p53, p21 and ROS levels and downregulating the TNF-α and CD44 levels compared with the tumor group. Furthermore, in an attempt to elucidate the mechanism of CUR in the enhancement of radiation effect on the regulated-pathway of tumor proliferation, cell cycle and apoptosis, the result showed that upon radiation treatment following CUR significantly upregulated the p53, p21 and ROS levels, and downregulated the TNF-α and CD44 levels compared with all treatments (Fig. 6), suggesting that CUR-NAR-D-MNPs increased the radiation effect by the inhibition of tumor growth, cell cycle and anti-apoptotic mediators through modulation of the P53high, P21high, TNF-αlow,CD44low and ROShigh signaling (Fig. 6 (g).
Fig. 6
CUR-NAR-D-MNPs act as tumor suppressors and radiosenstizers in tumor bearing animals by modulation of p21, p53, TNF-α and ROS signal pathway. (a, b, d and c) Flow cytometric images of p21, p53, TNF-α and CD44 respectively, (e) bar chart of accumulated data of p21, p53, TNF-α and CD44, (f) bar chart of ROS level. A, B, C, D and E) represent control, Tumor, CUR-NAR-D-MNPs, LDR and combination groups, (g) Schematic diagram representing the mode of action of CUR-NAR-D-MNPs/ or LDRTreatment with CUR-NAR-D-MNPs/ or LDR finally induce tumor suppressor by cell cycle arrest and apoptosis induction through P53, P21, TNF-α,CD44 and ROS pathway. (→) Indicates direction of pathway and (raisebox . 9pt --⊣) indicates blocking function. The results presented as the mean±SEM, n = 5. a1p < 0.001, a2p < 0.01, a3p < 0.05 vs. control; b1p < 0.001, b2p < 0.01, b3p < 0.05 vs. Tumor group; c1p < 0.001, c2p < 0.01, c3p < 0.05 vs. CUR-NAR-D-MNPs group, d1p < 0.001, d2p < 0.01, d3p < 0.05 vs. LDR.
4Discussion
Herbal medicines enhance the therapeutic efficacy and safety of drug molecules in a controlled drug delivery system to cancer cells [6]. Researches on novel anti-cancer agents such as siRNA and miRNA have also proved to be effective in BC treatment and are being investigated for the possibility for use in combination with other drugs [19, 47]. These combined systems although still not very popular, will possibly lead to increasing needs of NPs as drug carriers. By incorporating target-specific DDS, the pharmacologically effective drug dosage can be lowered and drug efficacy on target site is improved, which reduces the harmful side effects incurred through non-specific drug administration [18, 47]. This is probably the first in vitro and in vivo study to evidence the antitumor effects of two polyphenolic dietary compounds CUR and NAR in nanosystem form against MCF-7-cells and mammary tumors in a rat model.
The MNP surface was covered with dextran, probably due to different interactions, such as van der Waals forces, hydrogen bonding, and electrostatic interactions [48, 49]. The CUR spectrum showed a broad absorption band at 3430 cm–1, indicating the presence of a phenolic O–H group. An absorption band at 1630 cm–1 could be due to stretching vibrations of the benzene ring. The absorption peak at 1510 cm–1 attributed to C = O, and the band at 1428 cm–1 indicate the C–H functional-group of olefinic bending-vibration, and the band at 1277 cm–1 can be assigned to the aromatic C–O stretching-vibration [50]. Comparing the spectra of CUR and CUR-D-MNPs, the characteristic peaks of CUR in combination are distinguishable, although the central overlapped region of the spectra suggests that CUR is successfully entrapped in dextran-coated MNPs.
XRD spectra indicated a small decrease in the intensities of the diffraction peaks for D-MNPs, probably because of the in situ addition of dextran on the surface of MNPs, which significantly decreases the average crystalline size. No other peaks were observed in the XRD pattern, confirming MNPs [51].
The saturation magnetization of the samples decreased probably because of the effect of a higher density of dextran on the MNP surface. Dextran produces a magnetic dead layer on the surface of MNPs, which quenches the surface magnetic moments [52].
The shell thickness a determinant parameter in the extent of magnetization decrease. The spherical aggregates of MNPs could be due to the absence of a driving force in their surface or due to interparticle interaction [53]. The space between two particles was < 10 nm, confirming that the MNPs were prone to aggregation because of strong magnetic dipole-dipole interactions [54]. ZPA demonstrated a decrease in the negative value of MNPs due to the addition of CUR and NAR to D-MNPs.
Assessment of the cytotoxicity of CUR-NAR-D-MNPs toward MCF-7 cells showed that 48 h incubation is the most effective time exposure for the anti-proliferative effects of CUR-NAR-D-MNPs. CUR-loaded poly(D,L-lactic-co-glycolic acid)–polyethylene glycol (PLGA-PEG-NPs) inhibit MCF-7 cells dose and time dependently [55].
The cytotoxicity of the MNPs can be attributed to their strong binding with cancer cells, which causes DNA damage via drug release due to magnetic oxidation and the partial release of drugs from the MNPs [51]. The cytotoxicity of NPs could be due to their rapid escape to endolysosomes, where they remain in the cytoplasmic compartment [56]. and release the encapsulated drug in a sustained manner [57]. Thus, NPs can enhance drug accumulation in the cancer cells environment [55]. CUR-NAR-D-MNPs showed increased bioavailability and cytotoxicity in MCF-7-cells. Furthermore, apoptotic and necrotic-cells increased after 48 h incubation with CUR-NAR-D-MNPs. CUR and NAR co-treatment inhibits cell viability and increases the rate of apoptosis of THP-1-cells, due to the increase ROS or better uptake of NPs, which results in higher accumulation of NPs inside cancer cell, increasing their apoptosis [58, 59] Substances with synergistic action improve tumor radiosensitivity [60].
In this study, 48 h incubation of MCF-7-cells with CUR-NAR-D-MNPs before radiotherapy increased apoptosis probably due to the sensitizing effect of radiotherapy in cancer cells. Minafra et al., reported the radio-sensitizing ability of CUR-loaded lipid nanoparticles in MCF-7-cells with a protective role against radiotherapy side effects [61]. Superparamagnetic iron oxide nanoparticles enhanced radiation-induced MCF-7 cells cell-death by catalyzing ROS generation [62].
Oral administration of a single high dose (4000μg/kg) or repeated doses (1000μg/kg) of CUR-NAR-D-MNPs is safe. CUR-NAR exhibits antioxidant activity based on its radical-scavenging properties and the upregulation of endogenous antioxidant enzymes [63, 64].
In line with our findings, MNPs exhibit strong antioxidant activity and free radical-scavenging properties, due to electron transfer from the Fe+2/Fe+3 systems of iron oxide NPs [65]. In good correlation with our results, synthetic and natural progestins can accelerate the progression of DMBA-induced mammary-tumors in rats [66]. Treatment of tumor-bearing rats with CUR-NAR-D-MNPs significantly increases body weight and decreases tumor-burden. Combination polyphenols are more effective in cancer treatment than a single polyphenol [67]. CUR-NAR delays the development of MPA-accelerated DMBA-induced mammary-tumors [68, 69].
Regarding the effect of CUR-NAR-D-MNPs treatments alone or with LDR on the distribution of cell population in cell cycle phases and apoptosis, it was found to modulate the uncontrolled cell entry in different cell cycle phases; however, it arrested the cells at the G1 phase and induced apoptosis through the downregulation of Bcl-2 and increased the Bax and caspases-3 expression levels. A previous study demonstrated that CUR caused cell cycle arrest in the G1 phase in breast cancer cells. In the present study, CUR-NAR-D-MNPs induced the accumulation of the G1 phase and induced arrest, perhaps due to the enhanced expression of p21 in response to activated apoptosis (Bax and caspase-3) and blocked anti-apoptotic mediator (Bcl-2) compared with the tumor group [70]. These effects were likely due to the presence of CUR-NAR-D-MNPs as found in breast tissues since similar mechanisms have been previously reported for curcumin, which reported that P53 and P21 levels increased after treatment with curcumin [71]. Meanwhile, NAR arrested cells at the G1 phase in vitro and altered the mitochondrial-mediated intrinsic pathway responsible for apoptosis in vivo [72].
Depending on our data and emphasizing the above-mentioned reports, we could conclude that our results showed a synergistic effect between CUR and NAR in the nanosystem. Furthermore, CUR-NAR-D-MNPs treatment alone or with LDR causes the upregulation of P53 and p21 levels compared with the tumor group. The previous studies found that CUR increased the regulation of p53 and p21 levels in T-47D and MCF-7 cells [70, 73]. Additionally, NAR modified the expression of cell cycle and regulation of apoptosis genes by the downregulation of Bcl-2 and upregulation of p21, caspases-3, and Bax in both colorectal and breast cancer cells [74]. CD44 is a standard marker of cancer stem cells in breast cancer and is altered during inflammation and cellular malfunctioning during tumor progression [75]. TNF-α is one of the pro-inflammatory mediators that drive inflammation and disease progression [76].
In this context, the therapeutic effect of CUR-NAR-D-MNPs alone or with LDR on CD44 and TNF-α was demonstrated compared with that of the tumor group. Our findings indicate that CUR-NAR-D-MNPs exerted immune modulation and anti-inflammatory potential, as indicated by decreasing the expression of CD44 and lowering TNF-α-level in the tumor tissue of CUR-NAR-D-MNPs-treated rats. In agreement with our findings, researchers found that the combination of CUR and epigallocatechin gallate decreased the expression of CD44 in MADMB-231 cells. Moreover, CUR nanoparticles caused the downregulation of multiple pro-inflammatory cytokines, including TNF-α in pancreatic cells, and NAR reduced skin inflammation induced by ultraviolet irradiation via the inhibition of TNF-α, suggesting the ability of combined CUR-NAR to convert the cancer cell to noncancerous cell by lowering the expression of CD44 and TNF-α [77–79].
5Conclusion
In this study, CUR-NAR-D-MNPs were prepared and tested in vitro and in vivo to examine their effect in combination with radiotherapy in the treatment of tumors. The nanomaterial has good biocompatibility, which can stimulate ROS, guide tumor cell apoptosis, and inhibit tumor cell proliferation. When used in combination with radiotherapy, significant tumor suppression was achieved and the survival of mice was significantly prolonged through the modulation of P53high, P21high, TNF-αlow,CD44low and ROShigh signaling.
Acknowledgments
The authors have no acknowledgments.
Author contributions
MAA, OEES and AMH: Conception; MAA, OEES, AMH, OARAZ and NAM: Data Curation; MAA, OEES, AMH, OARAZ and NAM: Analysis of data; MAA, OEES and AMH: Preparation of the manuscript; All authors: Revision for important intellectual content.
Conflict of interest
The authors declare no conflicts of interest.
References
[1] | Zohre M , Hamid S . Epidemiological characteristics of and risk factors for breast cancer in the world. Breast Cancer:Targets and Therapy. (2019) ;11: :151–64. |
[2] | Karimia B , et al. Therapeutic effect of simvastatin on DMBA-induced breast cancer in mice. Fundamental & Clinical Pharmacology. (2019) ;33: :84–93. |
[3] | Benakanakere I , et al. Natural and synthetic progestins accelerate 7,12-dimethylbenz anthracene (DMBA)-initiated mammary tumors and increase angiogenesis in Sprague-Dawley rats. Clin Cancer Res. (2006) ;12: :4062–71. |
[4] | Liang Y , Hyder SM . Proliferation of endothelial and tumor epithelial cells by progestin-induced vascular endothelial growth factor from human breast cancer cells: Paracrine and autocrine effects. Endocrinology. (2005) ;146: :3632–41. |
[5] | Pérez-Soto E , et al. Cytotoxic Effect and Mechanisms from Some-Plant Derived Compounds in Breast Cancer. Molecules. (2019) ;24: :10. |
[6] | Chakraborty K , et al. Nano-technology in herbal medicines: A review. Int.J of Herbal Medicine. (2016) ;4: (3):21–7. |
[7] | Song X , et al. Molecular targets of curcumin in breast cancer (Review). Mol Med Rep. (2019) ;19: (1):23–9. |
[8] | Zhao Z , et al. Naringenin inhibits migration of breast cancer cells via inflammatory and apoptosis cell signaling pathways. Inflammopharmacology. (2019) ;27: (5):1021–36. |
[9] | Shehzad A , et al. Curcumin in various cancers. Biofactors. (2013) ;39: :56–68. |
[10] | Ekambaram G , et al. Naringenin reduces tumor size and weight loss in N-methyl-N-nitro-N-nitrosoguanidine- induced gastric carcinogenesis in rats. Nutr Res. (2008) ;28: :106–12. |
[11] | Ekambaram G , et al. Naringenin reduces tumor size and weight loss in N-methyl-N-nitro-N-nitrosoguanidine- induced gastric carcinogenesis in rats. Nutr Res. (2008) ;28: :106–12. |
[12] | Gandhy SU , et al. Curcumin and synthetic analogs induce reactive oxygen species and decreases specificity protein (Sp) transcription factors by targeting microRNAs. BMC Cancer. (2012) ;12: :564. |
[13] | Arul D , Subramanian P . Naringenin (citrus flavonone) induces growth inhibition, cell cycle arrest and apoptosis in human hepatocellular carcinoma cells. Pathol Oncol Res. (2013) ;19: (4):763–70. |
[14] | Patra JK , et al. Nano based drug delivery systems: recent developments and future prospects. J Nanobiotechnology. (2018) ;19: (1):71. |
[15] | He L , et al. Nanomedicine-Mediated Therapies to Target Breast Cancer Stem Cells. Front. Pharmacol. (2016) ;7: :313. |
[16] | Chu PY , et al. Co-Delivery of Natural Compounds with a Dual-Targeted Nanoparticle Delivery System for Improving Synergistic Therapy in an Orthotopic Tumor Model. ACS Appl Mater Interfaces. (2019) ;11: (27):23880–92. |
[17] | Markman JL , et al. Nanomedicine therapeutic approaches to overcome cancer drug resistance. Adv Drug Deliv Rev. (2013) ;65: :1866–79. |
[18] | Iman Akbarzadeh , et al. Folic acid-functionalized niosomal nanoparticles for selective dual-drug delivery into breast cancer cells: An in-vitro investigation. Advanced Powder Technology. (2020) ;31: (9):4064–71. doi: org/10.1016/j.apt.2020.08.011. |
[19] | Sengupta S , Balla VK . A review on the use of magnetic fields and ultrasound for non-invasive cancer treatment. J Adv Res. (2018) ;14: :2097–111. doi: 10.1016/j.jare.2018.06.003. |
[20] | Zhu N , et al. Surface Modification of Magnetic Iron Oxide Nanoparticles. Nanomaterials (Basel). (2018) ;9: :8(10). |
[21] | Shaterabadi Z , et al. High impact of in situ dextran coating on biocompatibility, stability and magnetic properties of iron oxide nanoparticles. Mater SciEng C Mater Biol Appl. (2017) ;75: :947–56. |
[22] | Minafra L , et al. Radiosensitizing effect of curcumin-loaded lipid nanoparticles in breast cancer cells. Sci Rep. (2019) ;9: :11134 (2019). doi: org/10.1038/s41598-019-47553-2. |
[23] | Ebrahimi FA , et al. Synergetic effects of Docetaxel and ionizing radiation reduced cell viability on MCF-7 breast cancer cell. Appl Cancer Res. (2017) ;37: :29. doi: org/10.1186/s41241-017-0035-7. |
[24] | Hermawan A , et al. Identification of potential therapeutic target of naringenin in breast cancer stem cells inhibition by bioinformatics and in vitro studies. Saudi Pharmaceutical Journal, 2020; doi.org/10.1016/j.jsps.2020.12.002. |
[25] | Gupta AK , Gupta M . Synthesis and surface engineering of iron oxide nanoparticles for biomedical applications. Biomaterials. (2005) ;26: :3995–4021. |
[26] | Hauser AK , et al. The effects of synthesis method on the physical and chemical properties of dextran coated iron oxide nanoparticles. Materials Chemistry and Physics. (2015) ;177: :186. |
[27] | Khalkhali M , et al. “Synthesis and characterization of dextran coated magnetite nanoparticles for diagnostics and therapy”. BioImpacts. (2015) ;5: (3):141–50. |
[28] | Swatee Dey , et al. Low-Dose Fractionated Radiation Potentiates the Effects of Paclitaxel in Wild-type and Mutant p53 Head and Neck Tumor Cell Lines. Clinical Cancer Research. (2003) ;9: :1557–65. |
[29] | Marek Janiak K , et al. Cancer immunotherapy: how low-level ionizing radiation can play a key role. Cancer Immunol Immunother. (2017) ;66: :819–32. |
[30] | ISO/ASTM E 51026. Practice for using the fricke dosimeter system, ASTM international, west Conshohocken, PA. 2015. |
[31] | Li W , et al. Cantharidin, a potent and selective PP2A inhibitor, induces an oxidative stress-independent growth inhibition of pancreatic cancer cells through G2/M cell-cycle arrest and apoptosis. Cancer Sci. (2010) ;101: (5):1226–33. |
[32] | Ribble D , et al. A simple technique for quantifying apoptosis in 96-well plates. BMC Biotechnology. (2005) ;5: :12. |
[33] | Oto G , et al. Plantago major Protective Effects on Antioxidant Status after Administration of 7,12-Dimethylbenz(a)anthracene in Rats. As.P.J of Cancer Prevention. (2012) ;12: :564. |
[34] | Niwa K , et al. Inhibitory effects of medroxyprogesterone acetate on mouse endometrial carcinogenesis. Jpn J Cancer Res. (1995) ;86: (8):724–9. |
[35] | Shibata MA , et al. Raloxifene inhibits tumor growth and lymph node metastasis in a xenograft model of metastatic mammary cancer. BMC Cancer. (1010) ;10: :566. |
[36] | Bancroft JD , et al. Theory and practice of histopathological techniques, 4th Edition. Churchill Livingstone, New York, London, san Francisco. (1996) . |
[37] | Reitman S , Frankel S . A colorimetric method for the determination of serum glutamic oxalacetic and glutamic pyruvic transaminases. Am J Clin Pathol. (1957) ;28: (1):56–63. |
[38] | Doumas BT , et al. Albumin standards and the measurement of serum albumin with bromcresol green. Clin Chim Acta. (1971) ;31: (1):87–96. |
[39] | Allain CC , et al. Enzymatic determination of total serum cholesterol. Clin Chem. (1974) ;20: (4):470–5. |
[40] | Fossati P , Prencipe L . Serum triglycerides determined colorimetrically with an enzyme that produces hydrogen peroxide. Clin Chem. (1982) ;28: (10):2077–80. |
[41] | Balistreri WR , Shaw LM . Liver function. In Fundamentals of Clinical Chemistry. Tietz,NW(ed), 3 rd ed.,W.B. Sanders Company, Philadelphia. (1987) ;729–.761. |
[42] | Minami M ., Yoshikawa I . A simplified assay method of Superoxide dismutase activity for clinical use. Clin Chim Acta. (1979) ;92: :337–42. |
[43] | Beutler E , Duron O , Kelly B . Improved method for the determination of blood glutathione. J LabClinMed. (1963) ;61: :882–8. |
[44] | Sinha AK . Colorimetric assay of catalase. Analytical biochemistry. (1972) ;47: (2):389–394. |
[45] | Yoshioka T , et al. Lipid peroxidation in maternal and cord blood and protective mechanism against activated-oxygen toxicity in the blood. Am J Obstet Gynecol. (1979) ;135: (3):372–6. |
[46] | Heinlein C , et al. A rapid and optimization-free procedure allows the in vivo detection of subtle cell cycle and ploidy alterations in tissues by flow cytometry. Cell Cycle. (2010) ;9: (17):3584–3590. |
[47] | Liyanage PY , et al. Nanoparticle-mediated targeted drug delivery for breast cancer treatment. Biochim Biophys Acta Rev Cancer. (2019) ;1871: (2):419–.433. doi: 10.1016/j.bbcan.2019.04.006. |
[48] | Banerjee SS , Chen DH . Fast removal of copper ions by gum arabic modified magnetic nano-adsorbent. Journal of Hazardous Materials. (2007) ;147: :792–9. |
[49] | Hong R , et al. Synthesis, characterization and MRI application of dextran-coated Fe 3 O 4 magnetic nanoparticles. Biochemical Engineering Journal. (2008) ;42: :290–300. |
[50] | Yallapu MM , et al. β-Cyclodextrin-curcumin self-assembly enhances curcumin delivery in prostate cancer cells. Colloids and Surfaces B: Biointerfaces. (2010) ;79: :113–25. |
[51] | Kumar SR , et al. Quercetin conjugated superparamagnetic magnetite nanoparticles for in-vitro analysis of breast cancer cell lines for chemotherapy applications. Journal of Colloid and Interface Science. (2014) ;436: :234–42. |
[52] | Aslibeiki B , et al. Strongly interacting superspins in Fe3O4 nanoparticles. Curr Appl Phys. (2012) ;12: :812–816. |
[53] | Chang B , et al. General one-pot strategy to prepare multifunctional nanocomposites with hydrophilic colloidal nanoparticles core/mesoporous silica shell structure. J Colloid Interface Sci. (2012) ;377: (1):64–75. |
[54] | Kumar S , et al. State of dispersion of magnetic nanoparticles in an aqueous medium: experiments and Monte Carlo simulation. Langmuir. (2010) ;26: (23):18320–30. |
[55] | Mirakabad FST , et al. A Comparison between the cytotoxic effects of pure curcumin and curcumin-loaded PLGA-PEG nanoparticles on the MCF-7 human breast cancer cell line. Artificial cells, nanomedicine, and biotechnology. (2016) ;44: (1):423–30. |
[56] | Das M , Sahoo SK . Epithelial cell adhesion molecule targeted nutlin-3a loaded immunonanoparticles for cancer therapy. Acta Biomaterialia. (2010) ;7: :355–69. |
[57] | Sahoo SK , Labhestwar V . Enhanced antiproliferative activity of transferrin con-jugated paclitaxel-loaded nanoparticles is mediated via sustained intracellular drug retention. Mol Pharm. (2005) ;2: :373–83. |
[58] | Shi D , et al. Co-treatment of THP-1 cells with naringenin and curcumin induces cell cycle arrest and apoptosis via numerous pathways. Mol Med Rep. (2015) ;12: (6):8223–8. |
[59] | Krishnakumar N , et al. Enhanced anticancer activity of naringenin-loaded nanoparticles in human cervical (HeLa) cancer cells. Biomedicine & Preventive Nutrition. (2011) ;1: (4):223–31. |
[60] | Calvaruso M , et al. Nutraceutical Compounds as Sensitizers for Cancer Treatment in Radiation Therapy. nt J Mol Sci. (2019) ; 20: (21). |
[61] | Minafra L , et al. Radiosensitizing effect of curcumin-loaded lipid nanoparticles in breast cancer cells. Sci Rep. (2019) ;9: (1), 11134. |
[62] | Huang G , et al. Superparamagnetic iron oxide nanoparticles: amplifying ROS stress to improve anticancer drug efficacy. Theranostics. (2013) ;3: :116–26. |
[63] | Haryuna DM , et al. The antioxidant effect of curcumin on cochlear fibroblasts in rat models of diabetes mellitus. Iranian journal of otorhinolaryngology. (2017) ;29: (4):93. |
[64] | Hong Y , et al. The Flavanone, Naringenin, Modifies Antioxidant and Steroidogenic Enzyme Activity in a Rat Model of Letrozole-Induced Polycystic Ovary Syndrome. Med Sci Monit. (2019) ;25: :395–401. |
[65] | Neupane BP , et al. Himalayan honey loaded iron oxide nanoparticles: synthesis, characterization and study of antioxidant and antimicrobial activities. Int J Nanomedicine. (2019) ;14: :3533–41. |
[66] | Benakanakere I , et al. Natural and synthetic progestins accelerate 7,12-dimethylbenz[a]anthracene-initiated mammary tumors and increase angiogenesis in Sprague-Dawley rats. Clin Cancer Res. (2006) ;12: (13):4062–71. |
[67] | Fantini M , et al. In vitro and in vivo antitumoral effects of combinations of polyphenols, or polyphenols and anticancer drugs: perspectives on cancer treatment. Int J Mol Sci. (2015) ;24: ;16 (5):9236–82. |
[68] | Carroll CE , et al. Curcumin delays development of medroxyprogesterone acetate-accelerated 7,12-dimethylbenz [a] anthracene-induced mammary tumors. Menopause. (2010) ;17: (1):178–84. |
[69] | Camargo CA , et al. Naringin Inhibits Tumor Growth and Reduces Interleukin-6 and Tumor Necrosis Factor α Levels in Rats with Walker 256 Carcinosarcoma. Anticancer Research. (2012) ;32: :129–134. |
[70] | Hu S , et al. Curcumin inhibits proliferation and promotes apoptosis of breast cancer cells. Exp Ther Med. (2018) ;16: (2):1266–72. |
[71] | Ávila-Gálvez MÁ , et al. Disposition of Dietary Polyphenols in Breast Cancer Patients’ Tumors, and Their Associated Anticancer Activity: The Particular Case of Curcumin. Mol Nutr Food Res. (2100) ;65: (12):e2100163. doi: 10.1002/mnfr.202100163. |
[72] | Zhao Z , et al. Naringenin inhibits migration of breast cancer cells via inflammatory and apoptosis cell signaling pathways. Inflammopharmacol. (2019) ;27: :1021–36. |
[73] | Hallman K , et al. The effects of turmeric (curcumin) on tumor suppressor protein (p53) and estrogen receptor (ERα) in breast cancer cells. Breast Cancer. Dove Med Press. (2017) ;9: :153–161. |
[74] | Abaza MS , et al. Growth inhibitory and chemo-sensitization effects of naringenin, a natural flavanone purified from Thymus vulgaris, on human breast and colorectal cancer. Cancer Cell Int. (2015) ;15: :46. |
[75] | Ghada AE , et al. Anticancer and Apoptogenic Effect of Graviola and Low-Dose Radiation in Tumor Xenograft in Mice. Integr Cancer Ther. (2020) ;19: :1–12. |
[76] | Karnam KC , et al. Preventive effect of berberine against DMBA-induced breast cancer in female Sprague Dawley rats. Biomed Pharmacother. (2017) ;92: :207–2. |
[77] | Chung SS , Vadgama JV . Curcumin and Epigallocatechin Gallate Inhibit the Cancer Stem Cell Phenotype via Down-regulation of STAT3-NFκB signaling. Anticancer Res. (2015) ;35: (1):39–46. |
[78] | Bisht S , et al. Polymeric nanoparticle-encapsulated curcumin (“nanocurcumin”): a novel strategy for human cancer therapy. J Nanobiotechnology. (2007) ;5: :3. |
[79] | Martinez RM , et al. Naringenin Inhibits UVB Irradiation-Induced Inflammation and Oxidative Stress in the Skin of Hairless Mice. J. Nat. Prod. (2015) ;78: (7):1647–55. |


