
The myeloid cell biomarker EMR1 is ectopically expressed in colon cancer
Abstract
OBJECTIVE:
The microenvironment of colon cancer (CC) is heterogeneous including cells of myeloid lineage affecting tumor growth and metastasis. Two functional subtypes of myeloid cells have been identified; one (M1) is tumor-inhibitory and the other one (M2) is tumor-promoting. Whether the three myeloid markers EMR1, CD206 and CD86 are expressed only in the infiltrating myeloid cells or also in the tumor cells was investigated.
METHODS:
Expression of the myeloid markers was investigated in CC at the mRNA and protein levels in primary tumors and lymph nodes. mRNA expression was also determined in 5 CC cell lines. Protein expression was investigated by two-color immunofluorescence and consecutive-sections-immune-staining combined with morphometry using specific antibodies for the myeloid cell markers and the epithelial cell markers CEACAM5 and EpCAM.
RESULTS:
EMR1 and CD86, but not CD206, mRNA levels were significantly higher in CC primary tumors compared to apparently normal colon tissue (P < 0.0001). EMR1 mRNA levels were significantly higher in both hematoxylin-eosin positive (H&E(+)) and H&E(–) lymph nodes of CC patients compared to control nodes (P = 0.03 and P = 0.01, respectively). EMR1 and CD206 mRNAs were expressed in 4/5 and 5/5 CC cell lines, respectively, while CD86 mRNA was not expressed. Immuno-morphometry revealed that about 20% of the tumor cells expressed EMR1 and CD206. Positive cells were tumor cells as revealed by anti-CEACAM5 and anti-EpCAM staining. The number of EMR1, CD206 and CD86 positive cells were significantly increased in CC primary tumors compared to normal colon tissue (P < 0.0001). However, CD206 was also expressed in normal colonocytes. Only EMR1 showed significantly increased numbers of positive tumor cells in H&E(+) nodes compared to H&E(-) nodes (P = 0.001). EMR1 expression in CC tumor cells correlated with CXCL17 expressing tumor cells.
CONCLUSION:
EMR1, like the chemokine CXCL17, is ectopically expressed in colon cancer possibly in the same cancer cells.
1Introduction
Colorectal cancer (CRC) is the third most common cancer worldwide with approximately 1.8 million new cases and 0.9 million deaths reported every year [1]. Surgery is the primary treatment and continues to have the greatest impact on survival, but residual micro-metastases and disseminated isolated tumor cells may cause relapse [2]. In order to improve survival, surgery can be complemented with chemotherapy or radiotherapy. Still, 20–30% of TNM-stage I and II patients will recur, [3] indicating that a number of patients did not receive the adjuvant treatment they would have benefitted from. Consequently, improvement of methods for detection of disseminated tumor cells is required, and molecular markers for their detection are urgently needed. Moreover, a deeper understanding of cell biology of tumors and growth moderating effects by cells in their microenvironment most likely will lead to new treatment modalities that may improve overall survival of CRC patients.
The tumor microenvironment consists of a heterogeneous group of cells, including leukocytes, fibroblasts, and endothelial cells. This complex microenvironment can support tumor growth, protect the tumor from host immune reactions, promote therapeutic resistance and provide niches for metastasis [4]. Cells of the myeloid lineage are predominant among the leukocytes in the tumor microenvironment [4]. Two functional subtypes of macrophages have been identified: the M1 subtype that is tumor-inhibitory via proinflammatory cytokines such as IL-12 and TNF-α, and the M2 subtype that is tumor-promoting via anti-inflammatory cytokines such as IL-10 and TGF-β [5]. M1 macrophages can also secrete the chemokines CXCL9 and CXCL10, which recruit lymphocytes of the T helper type 1 and cytotoxic T cell subsets, while M2 macrophages can secrete the chemokines CCL17, CCL22 and CCL24, which recruit the regulatory T cell and T helper type 2 subsets [6]. Suggested markers for detection of tumor-associated M1 macrophages are HLA-DR, CD11c, CD86, iNOS and pSTAT1, and for M2 macrophages are CD163, CD204, CD206, VEGF and cMAF. [7]
Here, we focused on the analysis of expression of the M1 marker CD86, the M2 marker CD206 and the eosinophil marker EMR1 in primary tumor and lymph nodes (LNs) in colon cancer (CC), investigating whether the markers were expressed only in the microenvironment or also in the tumor cells. This question is particularly relevant since analysis of tumor associated macrophages [8] and eosinophils [9] has been used as prognostic biomarkers in CRC. We have earlier detected ectopic expression of the chemokines CXCL16 and CXCL17 in CC tumor cells [10, 11]. Moreover, the M1macrophage marker CD86 was shown to be expressed in renal cancer cells [12, 13] and the M2 marker CD206 in liver tumor cancer cells, and increased expression of CD206 was associated with poor prognosis [14].
CD86 is one of the co-stimulatory molecules expressed on professional antigen-presenting cells including dendritic cells and certain macrophages [15]. CD86 interacts with its receptor CTL-4 on T cells, which results in proliferation of the T cells and cytokine production [16]. CD206 is a pattern recognition receptor that identifies the extracellular domains of specific carbohydrate molecules and is highly expressed on the surface of macrophages and immature dendritic cells [17]. EMR1, is a surface receptor of unknown function belonging to the EGF-seven-transmembrane (EGF-TM7) family of adhesion G protein coupled receptors (ADGRE) and is also named ADGRE1 [18–20].
Increased expression of CD206 positive cells was demonstrated in CC tissue stroma compared to normal tissue [8, 21]. However, in another study a reduced frequency of CD206 positive cells was seen as compared to the distal mucosa [22]. It has previously been shown that high macrophage infiltration along the tumor front in CC, as demonstrated by CD68 staining, correlates with better prognosis [23]. Most interestingly, chemical inhibition of the prostaglandin E2 receptor 4 (EP4) induced a functional switch in myeloid cells from immunosuppression (CD206-positive) to immunostimulation and enhanced cytotoxic T cell activation in a mouse model of CC [24]. Cancer cell-myeloid cell interactions in CRC may lead to angiogenesis through the production of chemokines and growth factors such as VEGF-A [25]. The plasticity of the myeloid cell polarization, opens the door to new therapeutic intervention [25].
In this study, we investigated the expression of CD86, CD206 and EMR1 in primary CC tumors, CC cell lines, and lymph nodes of CC- and control patients at the mRNA and protein levels.
2Materials and methods
2.1Patients and tissue specimens for mRNA analysis
Primary tumor specimens were retrieved from 35 CC patients (15 men and 20 women; mean (median age 72 years, range 43–86 years) after surgery at Norrland University Hospital, Umeå, Sweden or Helsingborg Hospital, Helsingborg, Sweden. None of the patients received treatment before surgery. Normal colon samples were from the distal resection margin of 30 CC patients. The clinical characteristics of the CC patients providing primary tumor and control colon tissue are shown in Table 1.
Table 1
Clinical characteristics of CC patients who donated primary tumor tissue and control colon tissue for mRNA analysis
| CC patients providing primary tumor tissue | ||||
| Variable | n | % | ||
| Sex | Male | 15 | 43 | |
| Female | 20 | 57 | ||
| Age | Median 72 years (range 43–86 years) | |||
| TNM-stage | I (T1-2N0M0) | 14 | 40 | |
| II (T3-4N0M0) | 11 | 31 | ||
| III (any TN1-2M0) | 11 | 31 | ||
| IV (anyTanyNM1) | 2 | 6 | ||
| Tumor site | Right colon | 15 | 43 | |
| Transverse colon | 1 | 3 | ||
| Left colon | 19 | 54 | ||
| CC patients providing control colon tissue * | ||||
| Sex | Male | 17 | 57 | |
| Female | 13 | 43 | ||
| Age | Median 72 years (range 57–85 years) | |||
| TNM-stage | I | 7 | 23 | |
| II | 17 | 57 | ||
| III | 4 | 13 | ||
| IV | 2 | 7 | ||
| Tumor site | Right colon | 16 | 53 | |
| Transverse colon | 2 | 7 | ||
| Left colon | 12 | 40 | ||
*Control colon tissue: apparently normal colon tissue samples with no detectable lesion retrieved from the proximal or distal resection margin of CC tumors of 30 patients.
Lymph nodes were retrieved from the resected specimens and bisected. One half of each node was included in routine histopathology examination, i.e. processed for hematoxylin-eosin (H&E) staining and inspection by specialized pathologists. The other half was snap frozen and stored at –70°C until RNA extraction. Lymph nodes were from 28 CC patients (median 76 years, range 50–88; 17 women and 11 men): 5 nodes were from 5 patients in stage I, 8 nodes were from 8 patients in stage II, 11 nodes were from 11 patients in stage III, and 6 nodes were from 4 patients in stage IV. Fifteen lymph nodes were judged tumor cell positive by routine histopathology (H&E(+)) and 15 nodes were H&E(–). Control lymph nodes were from 10 patients (median age 22 range 9–24; 3 women and 7 men), 8 with ulcerative colitis, one with Crohn’s disease, and one with lipoma.
2.2Patients and tissue specimens for immunohistochemistry
Primary tumor tissue samples of 10 CC patients (5 men and 5 women; median age 72 years, range: 60–84 years) were used for immunohistochemistry. Fresh tissue samples were washed with cold phosphate buffered saline (PBS), snap-frozen in iso-pentane, pre-cooled in liquid nitrogen, and stored at –70°C until preparation of tissue sections. One tumor was from a patient in stage I, 3 from patients in stage II, 4 from patients in stage III, and 2 from patients in stage IV. Primary tumor stage distribution (pT2–pT4) was 1, 6 and 3, respectively. Normal colon tissue samples were obtained from the distal resection margin of 9 CC patients (4 men and 5 women; median age 70 years, range: 41–83 years).
Lymph nodes from 10 CC patients (median age 80 years, range 71–91) were fresh-frozen in the same way as tumor tissue and stored at –70°C. Seven lymph nodes from 5 patients (1 in stage I, 2 in stage II, and 2 in stage III) were H&E(–). Six lymph nodes from 5 patients in stage III were H&E(+).
2.3Cell lines
Five CC cell lines LS174T, HT29, T84, HCT8 and CaCo2 and U937 (monocyte-like) were analyzed. Culture conditions and sources were previously described [26].
2.4RNA preparation
Total RNA was extracted using the acid guanidine phenol chloroform method as described [27].
2.5Real-time quantitative reverse transcriptase-polymerase chain reaction (qRT–PCR)
Quantification of EMR1, CD206 and CD86 mRNAs was done using commercially available TaqMan Gene Expression Assays (EMR1: Hs00892591_m1, CD206: Hs00267207_m1; CD86: Hs01567026_m1) in combination with TaqMan EZ technology (Applied Biosystems). The RT-PCR profile was 50°C for 2 min, 60°C for 30 min and 95°C for 5 min followed by 45 cycles of 95°C for 20 s and 60°C for 1min. Assays for CXCL16 and CXCL17 are previously described [10, 11] The concentration of 18S rRNA was determined in each sample by real-time qRT–PCR (Applied Biosystems) for normalization of mRNA levels as described [28]. All qRT-PCR analyses were performed in triplicates. Emission from the released reporter dye was recorded by the QuantStudio 5 Real-Time PCR System (Applied Biosystems) or the ABI Prism 7900 HT Sequence Detection System (Applied Biosystems).
mRNA levels are expressed as relative quantity (RQ) where the mRNA concentrations are normalized to the 18S rRNA concentration in the same sample by calculating the ΔCT between the CT for the mRNA species and the CT for 18S rRNA and RQ calculated according to the equation: 2 ∧- (ΔCT of the sample - the median ΔCT value of the normal colon tissue samples).
2.6Antibodies and substrate
The following antibodies were used; rabbit anti-EMR1 (NBP231090, Novus, Littleton, CO, USA), mouse anti-CD206 monoclonal antibody (mAb; MAB25341, Novus), mouse anti-CD86 mAb (NBP2-25208, Novus), anti-carcinoembryonic antigen (CEA) mAb (mouse IgG1, clone II-7, Dako, Glostrup, Denmark), and FITC-conjugated anti-epithelial cell adhesion molecule (EpCAM) mAb (mouse IgG1, clone BerEP4, Dako) were used as primary antibodies. Mouse IgG, ready to use (Dako), rabbit IgG ready to use (Dako) and FITC-conjugated mouse IgG (F0313, Dako) were used as negative controls. ImmPRESS micropolymer HRP conjugated anti-rabbit IgG (MP-7401, Vector laboratories, Burlingame, CA, USA), ImmPRESS micropolymer HRP conjugated anti-mouse IgG (MP-7402, Vector laboratories), Alexa Fluor 594-conjugated goat anti-mouse IgG (ab150116, Abcam, Cambridge, MA, USA) and Alexa Fluor 555-conjugated goat anti-rabbit IgG (ab150078, Abcam) were used as secondary antibodies. The peroxidase substrate used was 3,3′-diaminobenzidine (DAB; Vector Laboratories).
2.7Immunohistochemistry
Frozen tissue was cut into 4 –6μm-thick sections and processed as described [29, 30]. Briefly, consecutive sections were fixed with 4% paraformaldehyde, endogenous peroxidase activity quenched by incubation with 0.03% H2O2 and 2 mM NaN3, and non-specific binding sites blocked by incubation with 0.2% bovine serum albumin and 2.5% horse serum (ImmPress, Vector Laboratories). Thereafter, the sections were incubated with primary antibody followed by incubation with ImmPress anti-mouse IgG or ImmPress anti-rabbit IgG. Bound peroxidase was revealed by incubation with 0.05% DAB and 0.03% H2O2 in 0.05 M Tris-buffer (pH 7.6), and sections counterstained with methyl green. Anti-CEA mAb and mouse IgG instead of primary antibody served as positive and negative control, respectively.
2.8Immuno-morphometry
The number of positive cells in immunohistochemically stained tissue sections was quantified according to Weibel [29, 31].
2.9Two-Color immunofluorescence
Sections of frozen tissue were cut and fixed as described above, and, thereafter, incubated either with rabbit anti-EMR1 antibodies or normal rabbit IgG as a negative control, followed by Alexa Fluor 555-conjugated goat anti-rabbit IgG (red), or incubated with mouse anti-CD206 mAb or mouse IgG as a negative control, followed by the Alexa Fluor 594-conjugated goat anti-mouse IgG (red). Subsequently, the sections were incubated with FITC-conjugated anti-EpCAM mAb (green) or FITC-conjugated mouse IgG as a negative control. Single-color digital photos of the same ocular field were captured and superimposed. Double-positive cells show a yellow–orange color in the over-lays. Images were analyzed with NIS elements software.
2.10Statistical analysis
The statistical significance of differences in mRNA levels and number of positive cells were calculated using the two-tailed Mann–Whitney rank sum test. Correlations between mRNA levels were analyzed using the non-parametric two-tailed Spearman rank correlation. Descriptive values of mRNA levels are given as median with interquartile range (IQR) from the 25th to the 75th percentile while descriptive values of numbers of positive cells in immuno-morphometry are given as mean±1 standard error of the mean (SEM). The software utilized for statistical calculations was GraphPad Prism 6 (Graphpad Software, San Diego, CA, USA).
3Results
3.1EMR1, CD206, and CD86 mRNA expression levels in primary CC tumors, CC cell lines, a monocyte cell line and in lymph nodes of CC patients and controls
Figure 1A, Table 2 and Supplementary Figure 1 show the mRNA levels of EMR1, CD206 and CD86 in primary tumors from 32 CC patients compared to normal colon tissue. RQ is calculated relative to the median mRNA level of the respective mRNA in normal colon tissue samples. EMR1 and CD86 mRNAs but not CD206 mRNA were expressed at significantly higher levels in primary tumor compared to control colon (P < 0.0001). No significant variability in the mRNA expression levels of primary tumors of different T stages was seen for EMR1 and CD206, whereas CD86 expression levels were significantly higher in T3 tumors than in T2 tumors (P < 0.05). EMR1 and CD206 mRNAs were weakly expressed in 4/5 and 5/5 CC cell lines, respectively, while CD86 mRNA was not detected in any of the CC cell lines. The monocyte cell line U937 expressed high levels of EMR1 mRNA and CD86 mRNA but no CD206 mRNA.
Fig. 1
Levels of mRNA for EMR1, CD206 and CD86 in (A) primary tumor tissue of 32 CC patients (CC) compared to normal colon tissue (CTR; EMR1, n = 25; CD206 and CD86, n = 30) and (B) in metastatic lymph nodes of CC patients (H&E(+), n = 15), non-metastatic nodes of CC patients (H&E(–), n = 15) and nodes of control patients (CTR, n = 10). mRNA levels are given as relative quantity (RQ) calculated as described in the Materials and Methods section. Red horizontal lines indicate median values. P-values were calculated by two-tailed Mann-Whitney rank sum test.
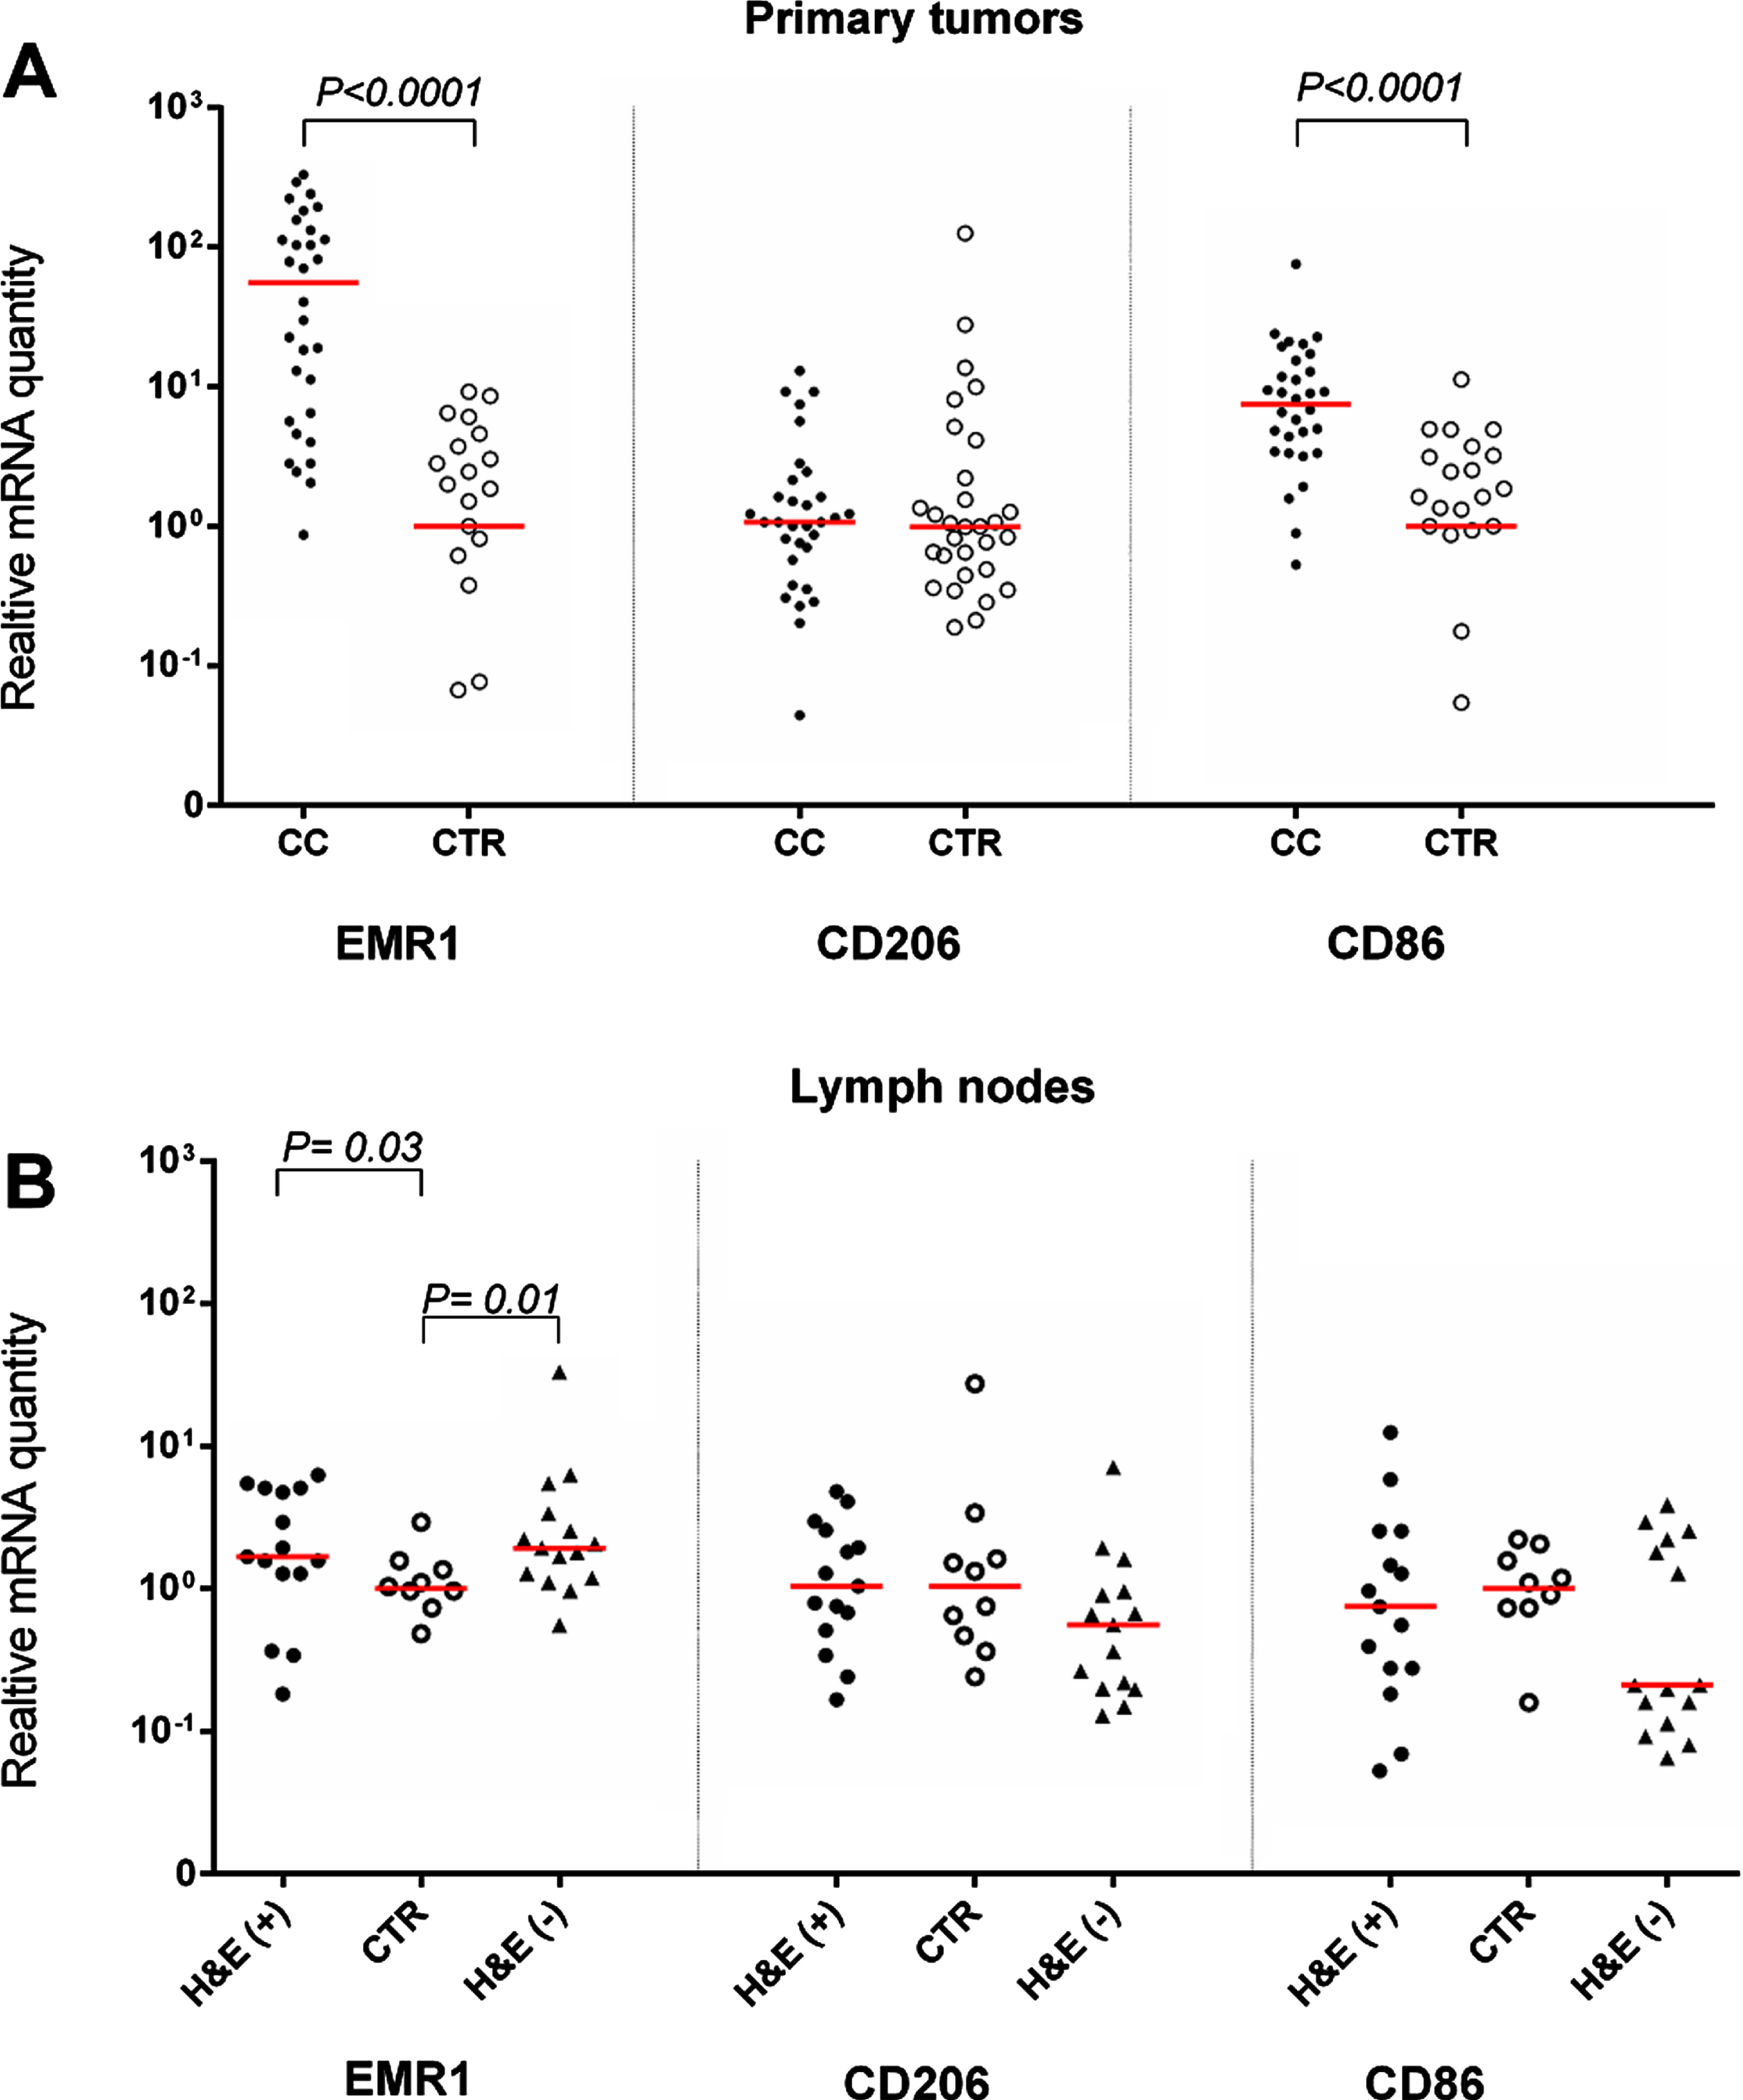
Table 2
Expression levels of EMR1, CD206 and CD86 mRNA in primary colon tumors, colon carcinoma cell lines and a monocyte cell line
| Source | n° | mRNA level (RQ) § | |||
| EMR1 | CD206 | CD86 | |||
| Primary CC tumors | 32 | 55.5 * (5.9–152) ** | 1.1 * (0.6–2) ** | 7.5 * (3.4–14.8) | |
| CC cell lines | LS174T | 1 | 0.1 | 0.005 | < 0.00001 |
| HT29 | 1 | 0.2 | 0.003 | < 0.00001 | |
| T84 | 1 | < 0.00001 | 0.001 | < 0.00001 | |
| HCT8 | 1 | 0.8 | 0.1 | < 0.00001 | |
| Caco2 | 1 | 0.1 | 0.01 | < 0.00001 | |
| Monocyte cell line | U937 | 1 | 322 | < 0.00001 | 1.7 |
°n = number of samples. §RQ = Relative quantity calculated as 2 (–Δ,Δct) , where Δ,Δct is the Δct of the sample minus the median Δct-value of normal colon tissue samples. *Median RQ of indicated number of samples. **Interquartile range of RQ from the 25th to the 75th percentile.
Figure 1B shows the expression levels of the three biomarkers in H&E(+) and H&E(–) lymph nodes from CC patients and in control lymph nodes from patients with inflammatory bowel disease. Only EMR1 mRNA levels were significantly higher in lymph nodes from CC patients than in control nodes. Note, however, that there was no apparent difference between lymph nodes containing easily detectable tumor cells (H&E(+) compared to (H&E(–) nodes (P = 0.03 and 0.01, respectively).
3.2Expression of EMR1, CD206 and CD86 proteins in CC tumors, normal colon tissue, and lymph nodes of CC patients
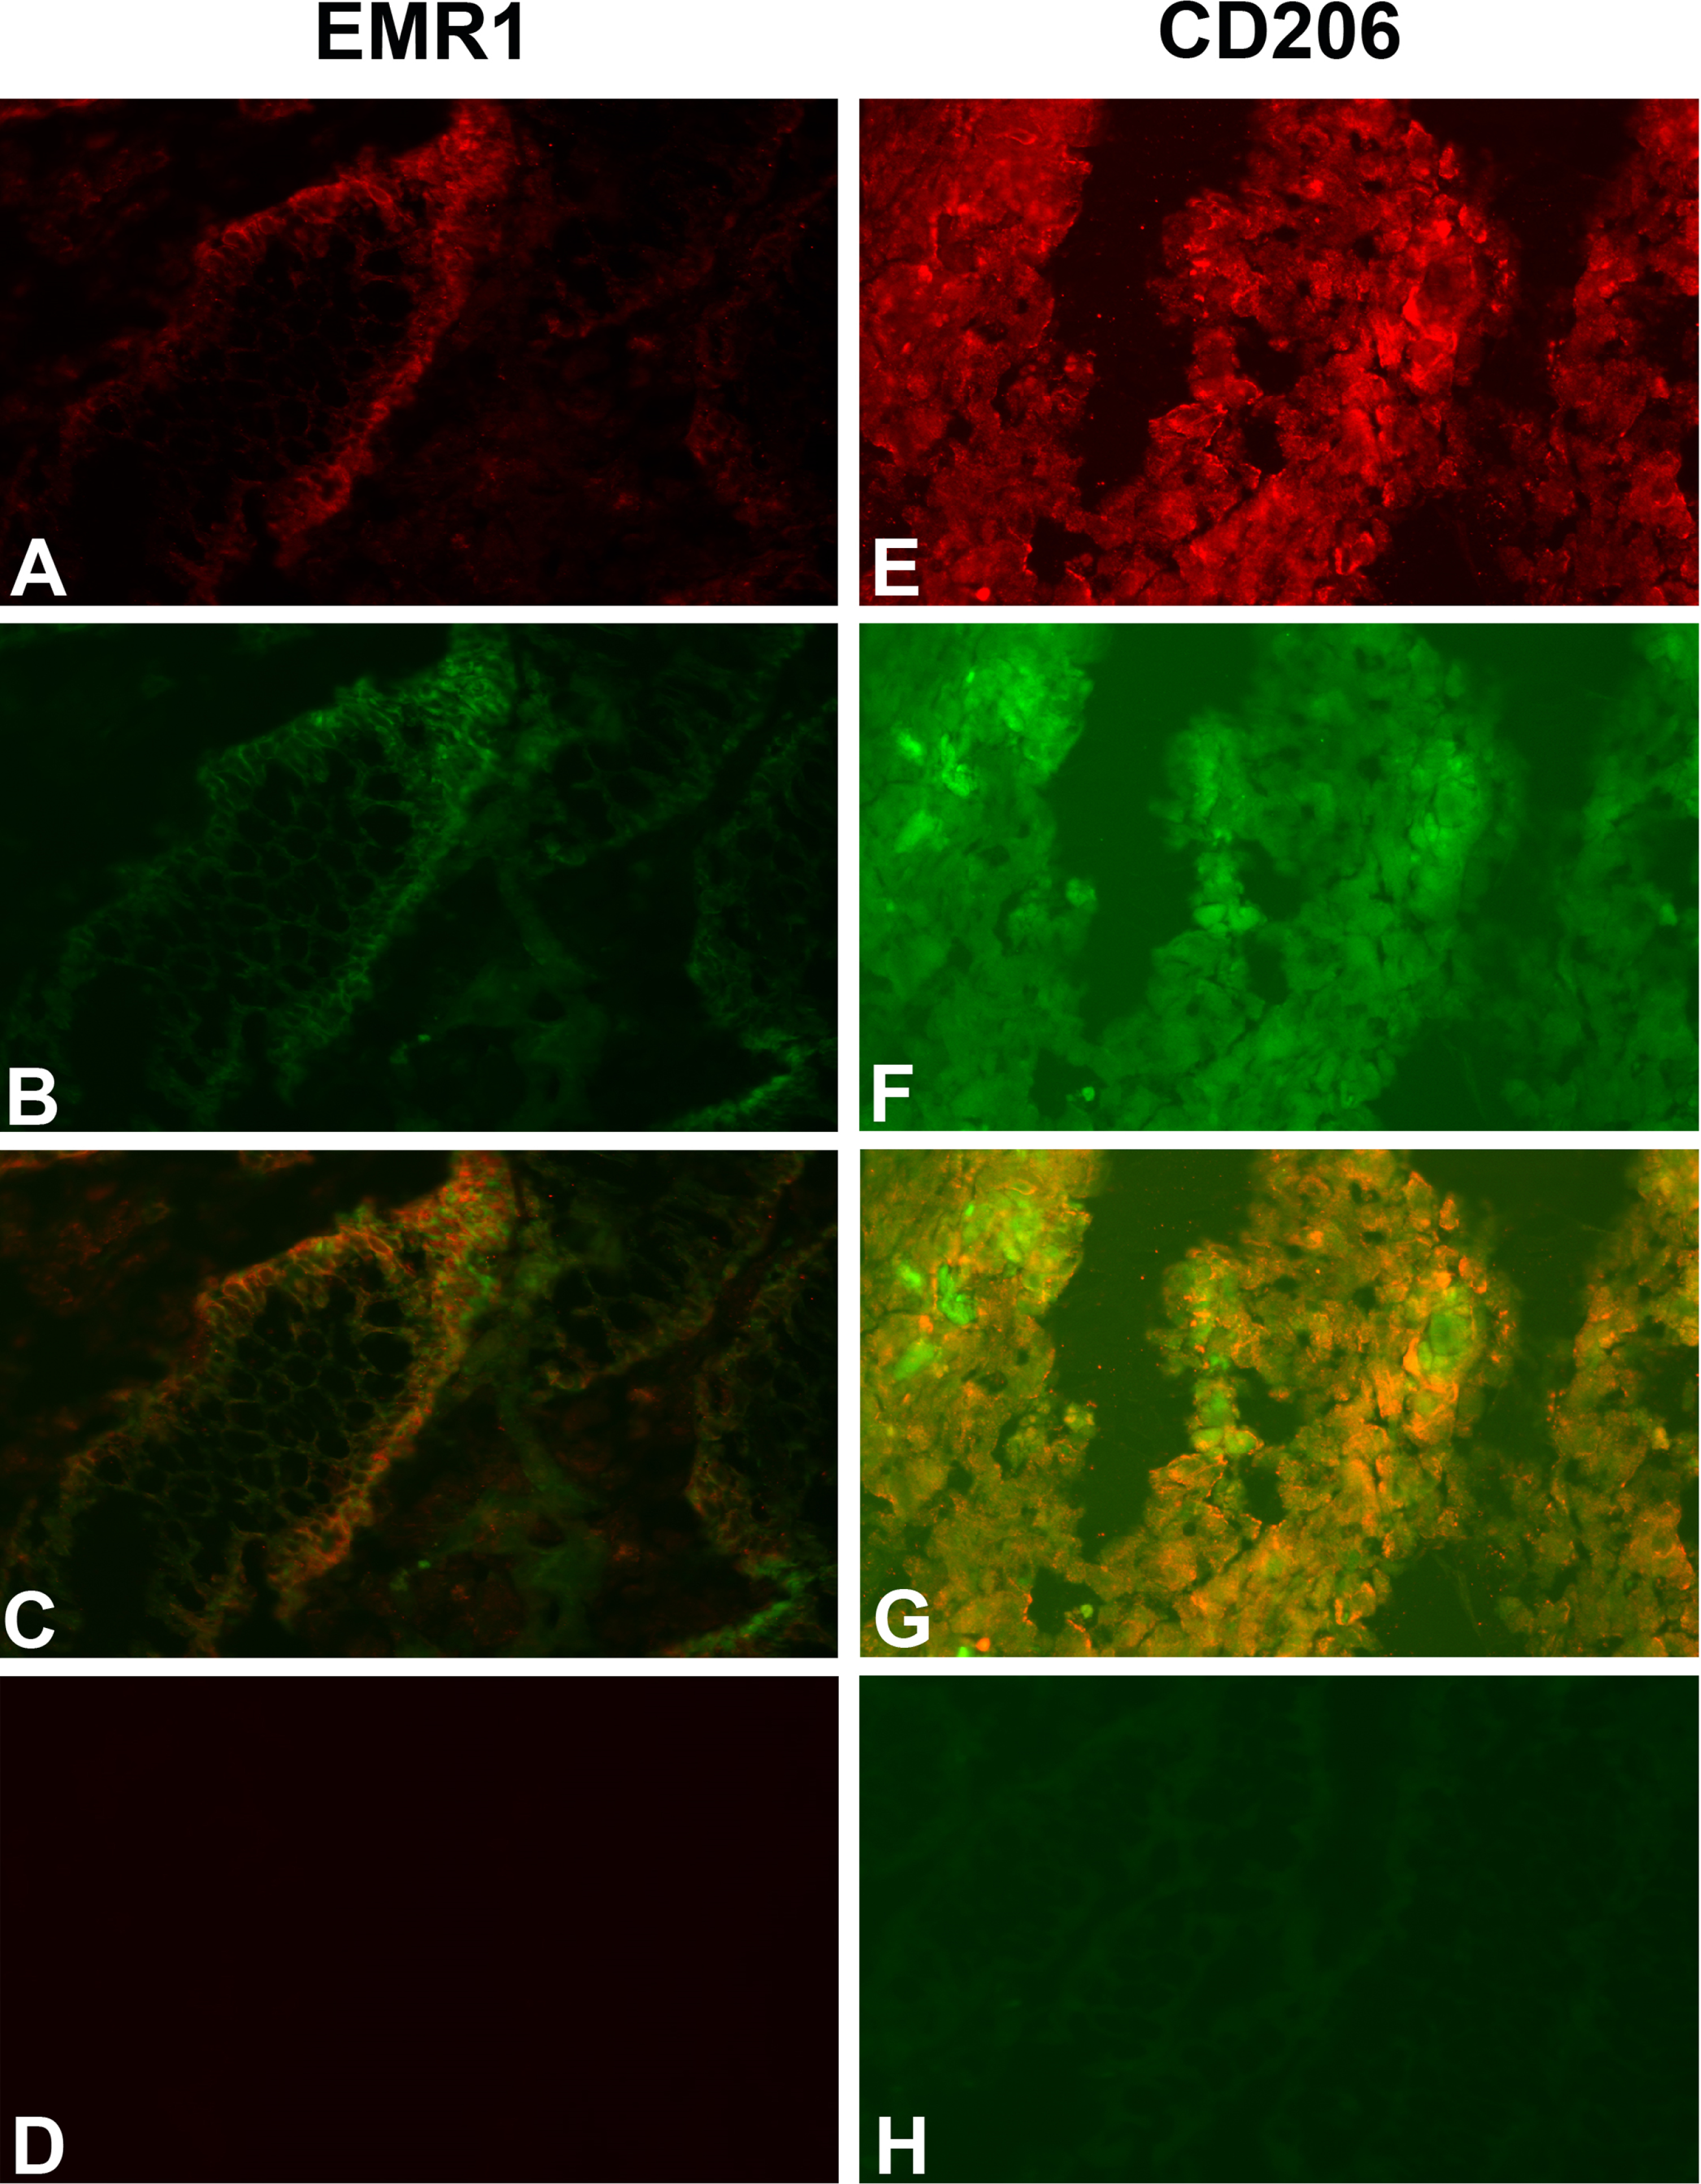
Do the tumor cells or the infiltrating myeloid cells or both express EMR1, CD206 and CD86 in CC tissue? Figure 2 shows a typical result using the consecutive-sections-immune-staining technique. Anti-CEA mAb was used to identify the tumor cells and polyclonal anti-EMR1 IgG, anti-CD206 mAb and anti-CD86 mAb to detect the three macromolecules in a primary CC tumor. The staining patterns indicate that EMR1 and CD206 were expressed by many tumor cells while CD86 by fewer cells. Staining appears to be membranous to cytoplasmic. Figure 3 shows staining of an H&E(+) lymph node from a CC patient using the same reagents and staining techniques as was used for staining of primary tumor tissue. Anti-EMR1 and anti-CD206 appear to stain many of the disseminated tumor cells in the lymph node while anti-CD86 staining of disseminated tumor cells were generally absent although occasional cellular aggregates displayed positive staining. Two-color immunofluorescence staining was performed to further substantiate the staining pattern with anti-EMR1 and anti-CD206 antibodies. To identify tumor cells, we used the anti-EpCAM mAb BerEP4. Figure 4 shows staining of a primary CC tumor. As can be seen, many tumor cells were stained both by anti-EMR1 and anti-EpCAM. Double staining with anti-CD206 and anti-EpCAM showed many double-stained tumor cells and strong anti-EpCAM staining of a minority of tumor cells that did not express CD206.
Fig. 2
Immunoperoxidase staining of tissue sections of a primary CC tumor. (A), (B), (C) Anti-CEA staining, original magnification 100×. (D) Anti-EMR1 staining of a consecutive section of (A), original magnification 100×. (E) Anti-CD206 staining of a consecutive section of (B), original magnification 100×. (F) Anti-CD86 staining of a consecutive section of (C), original magnification 100×. (G) Higher magnification of indicated area in (D), 400×. (H) Higher magnification of indicated area in (E), 400×. (I) Higher magnification of indicated area in (F), 400×. (J) Anti-EMR1 staining of normal colon tissue, 400x. (K) Anti-CD206 staining of normal colon tissue, 400x. (L) Anti-CD86 staining of normal colon tissue, 400x. Positive cells stained brown to black. Methyl-green was used for counterstaining.
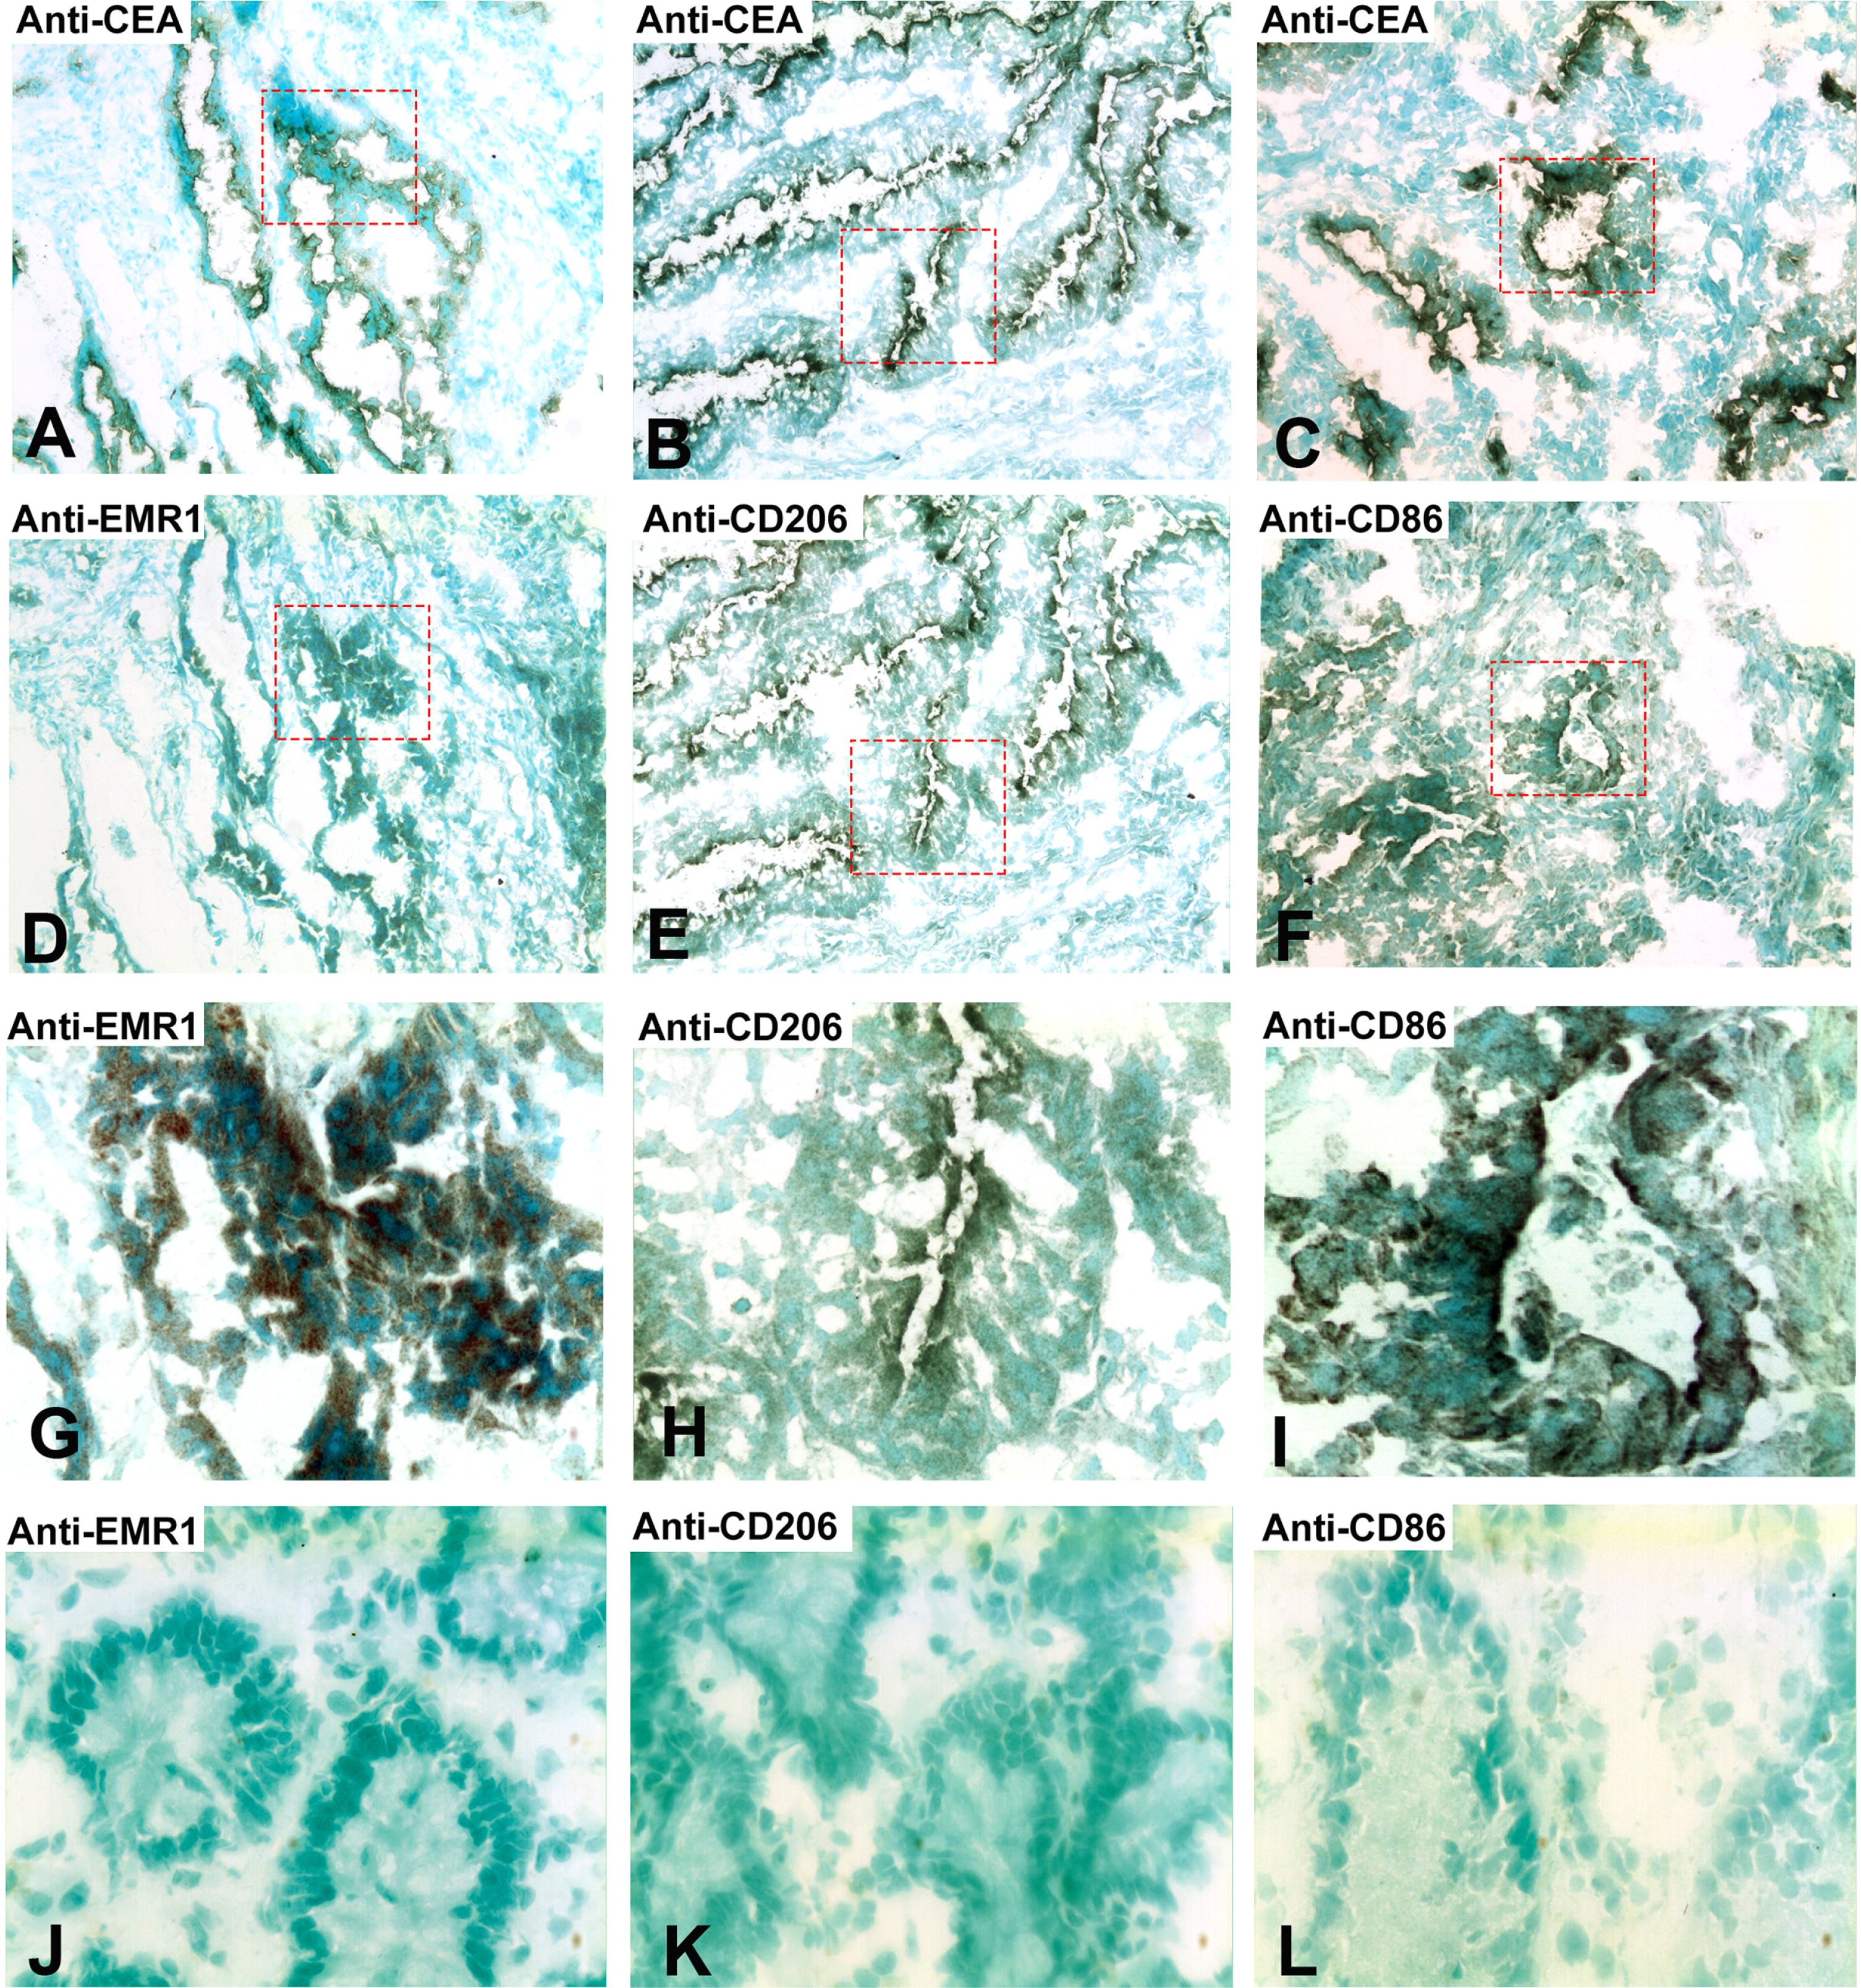
Fig. 3
Immunoperoxidase staining of tissue sections of a CC lymph node metastasis. (A), (B), (C) Anti-CEA staining of an H&E (+) lymph node from a CC patient, original magnification 100×. (D) Anti-EMR1 staining of a consecutive section of (A), original magnification 100×. (E) Anti-CD206 staining of a consecutive section of (B), original magnification 100×. (F) Anti-CD86 staining of a consecutive section of (C), original magnification 100×. (G) Higher magnification of indicated area in (D), 400×. (H) Higher magnification of indicated area in (E), 400×. (I) Higher magnification of indicated area in (F), 400×. (J) Anti-EMR1 staining of an H&E(–) lymph node of a CC patient, 400x. (K) Anti-CD206 staining of an H&E(–) lymph node of a CC patient, 400x. (L) Anti-CD86 staining of an H&E(–) lymph node of a CC patient, 400x. Positive cells stained brown to black. Methyl-green was used for counterstaining.
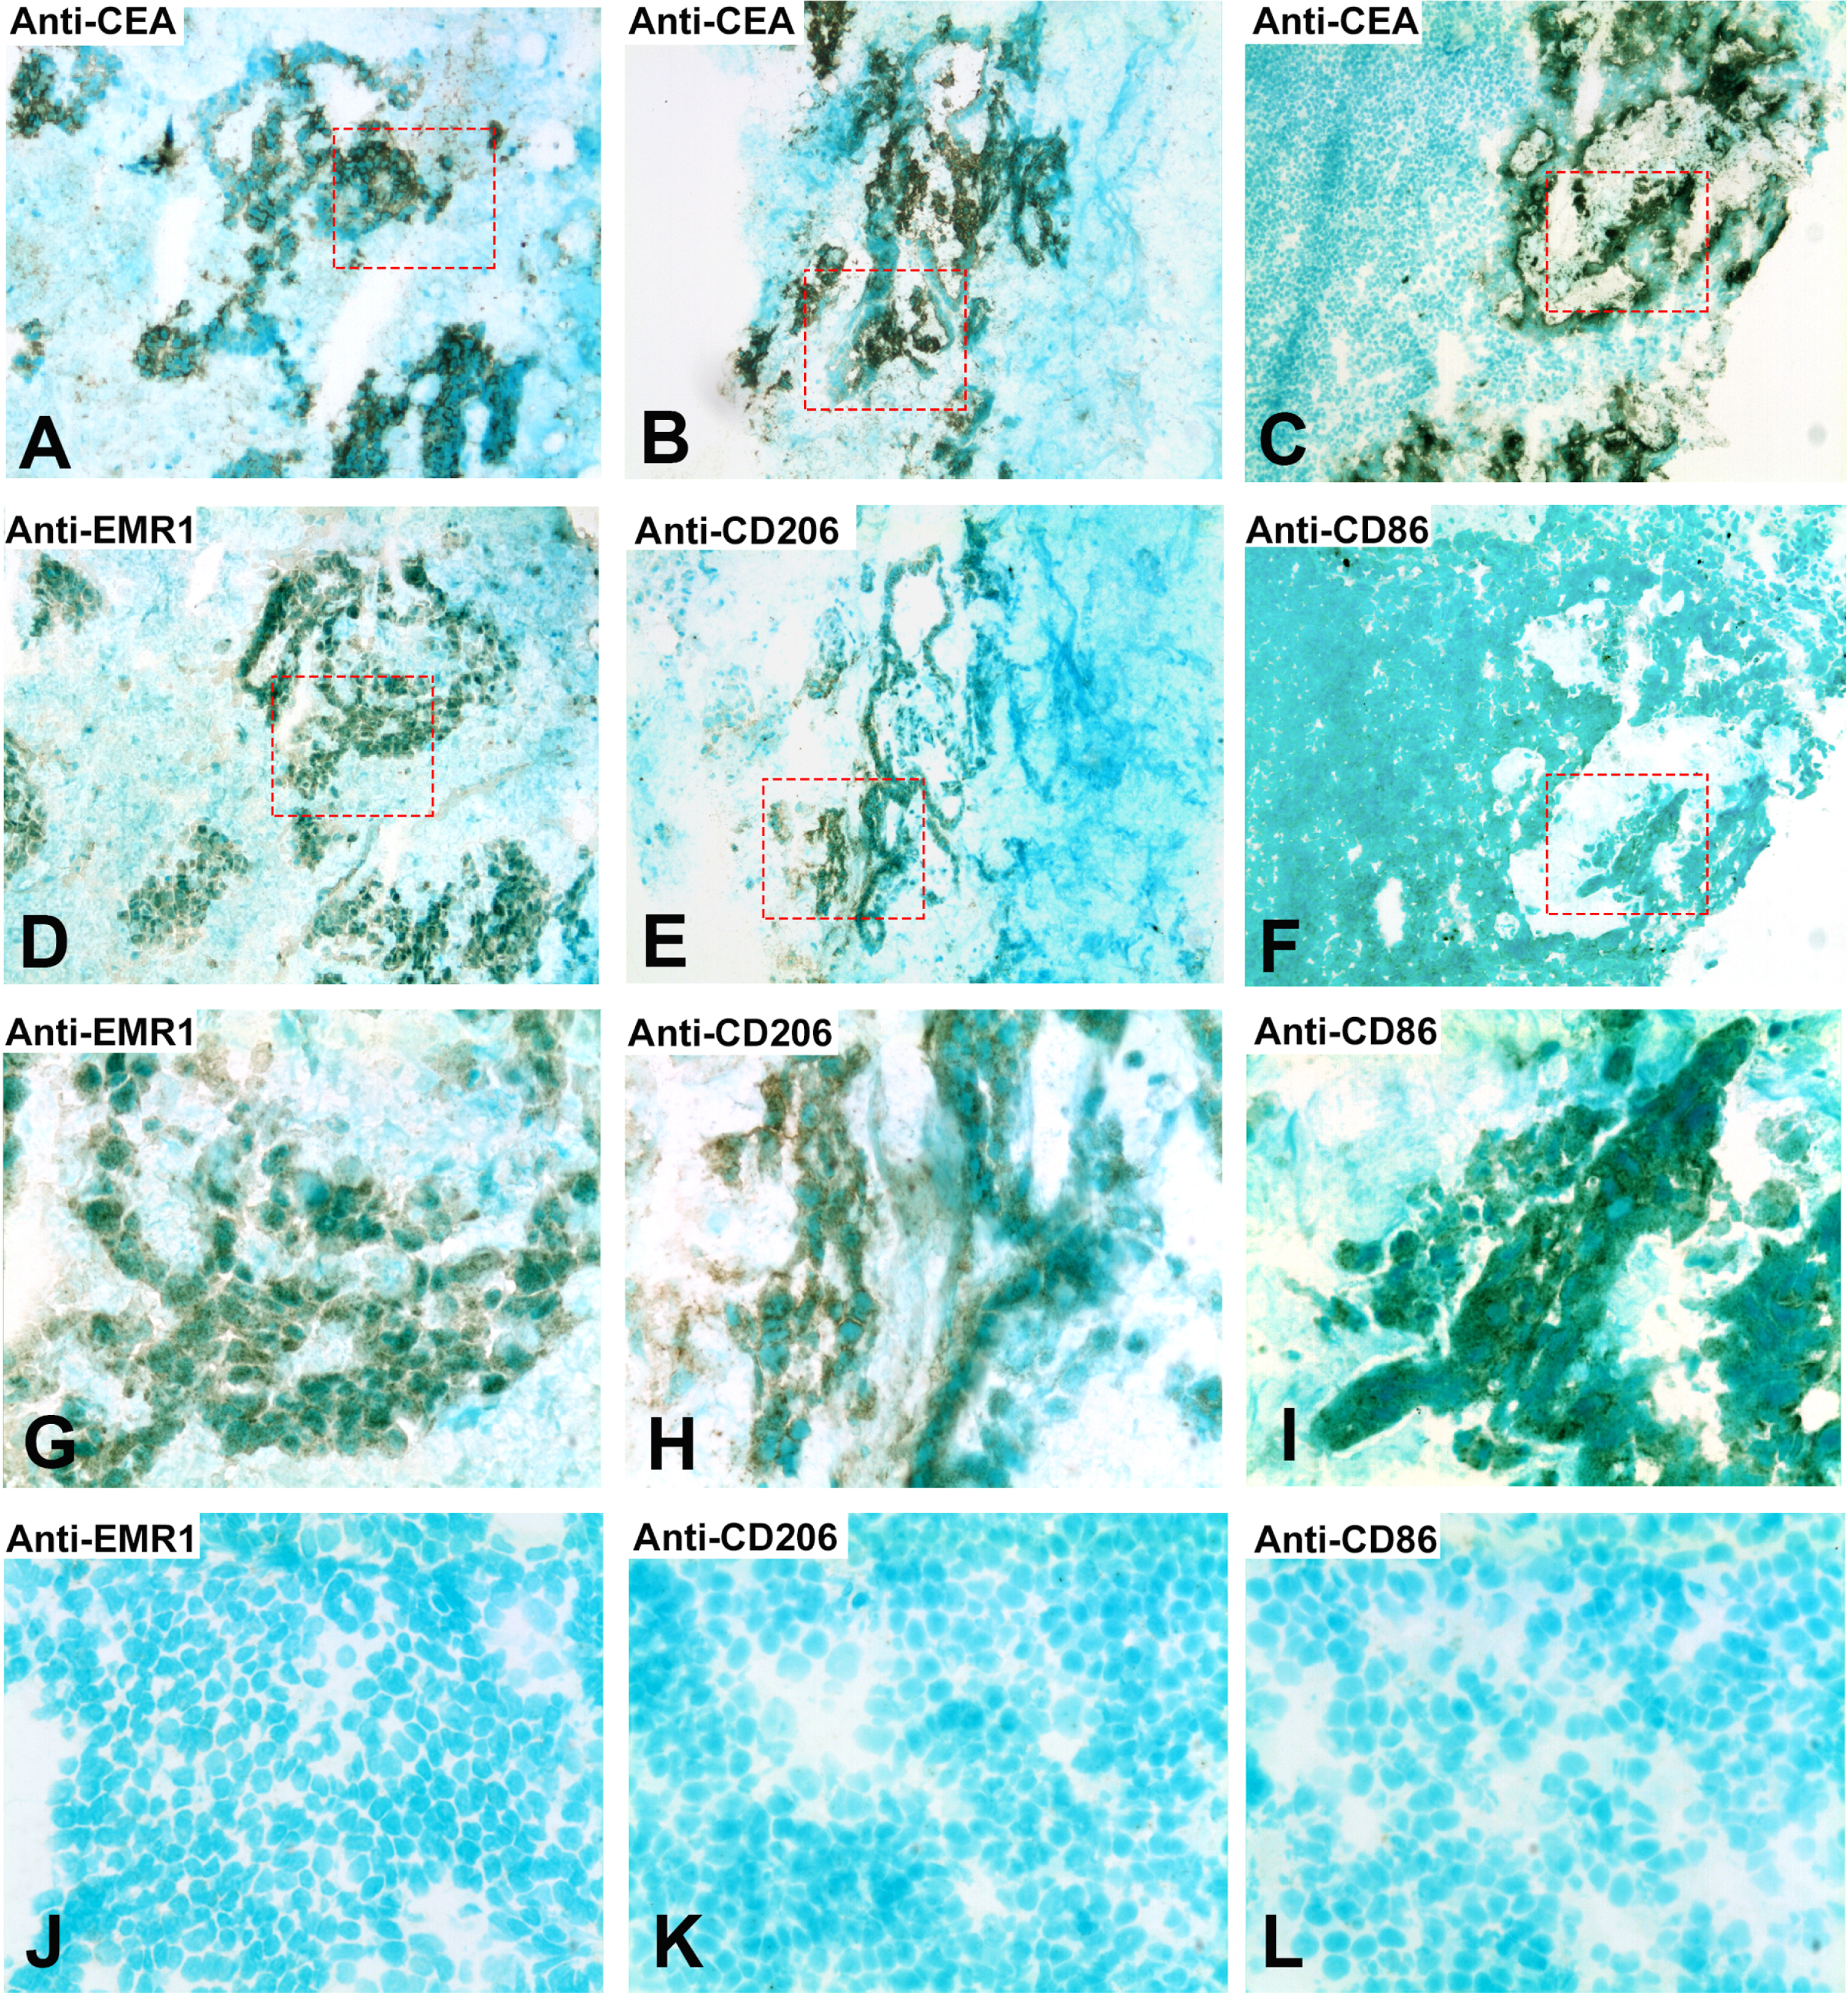
Fig. 4
Two-color immunofluorescence staining of primary CC tissue with anti-EMR1 and anti-EpCAM, and anti-CD206 and anti-EpCAM. (A) Anti-EMR1, (E) Anti-CD206, both red color. (B, F) anti-EpCAM, green color. (C, G) Overlays giving yellow color of double-stained cells. (D) Rabbit IgG; negative control for anti-EMR1 (H). FITC-conjugated mouse IgG; negative control for anti-EpCAM. Original magnification:×200.
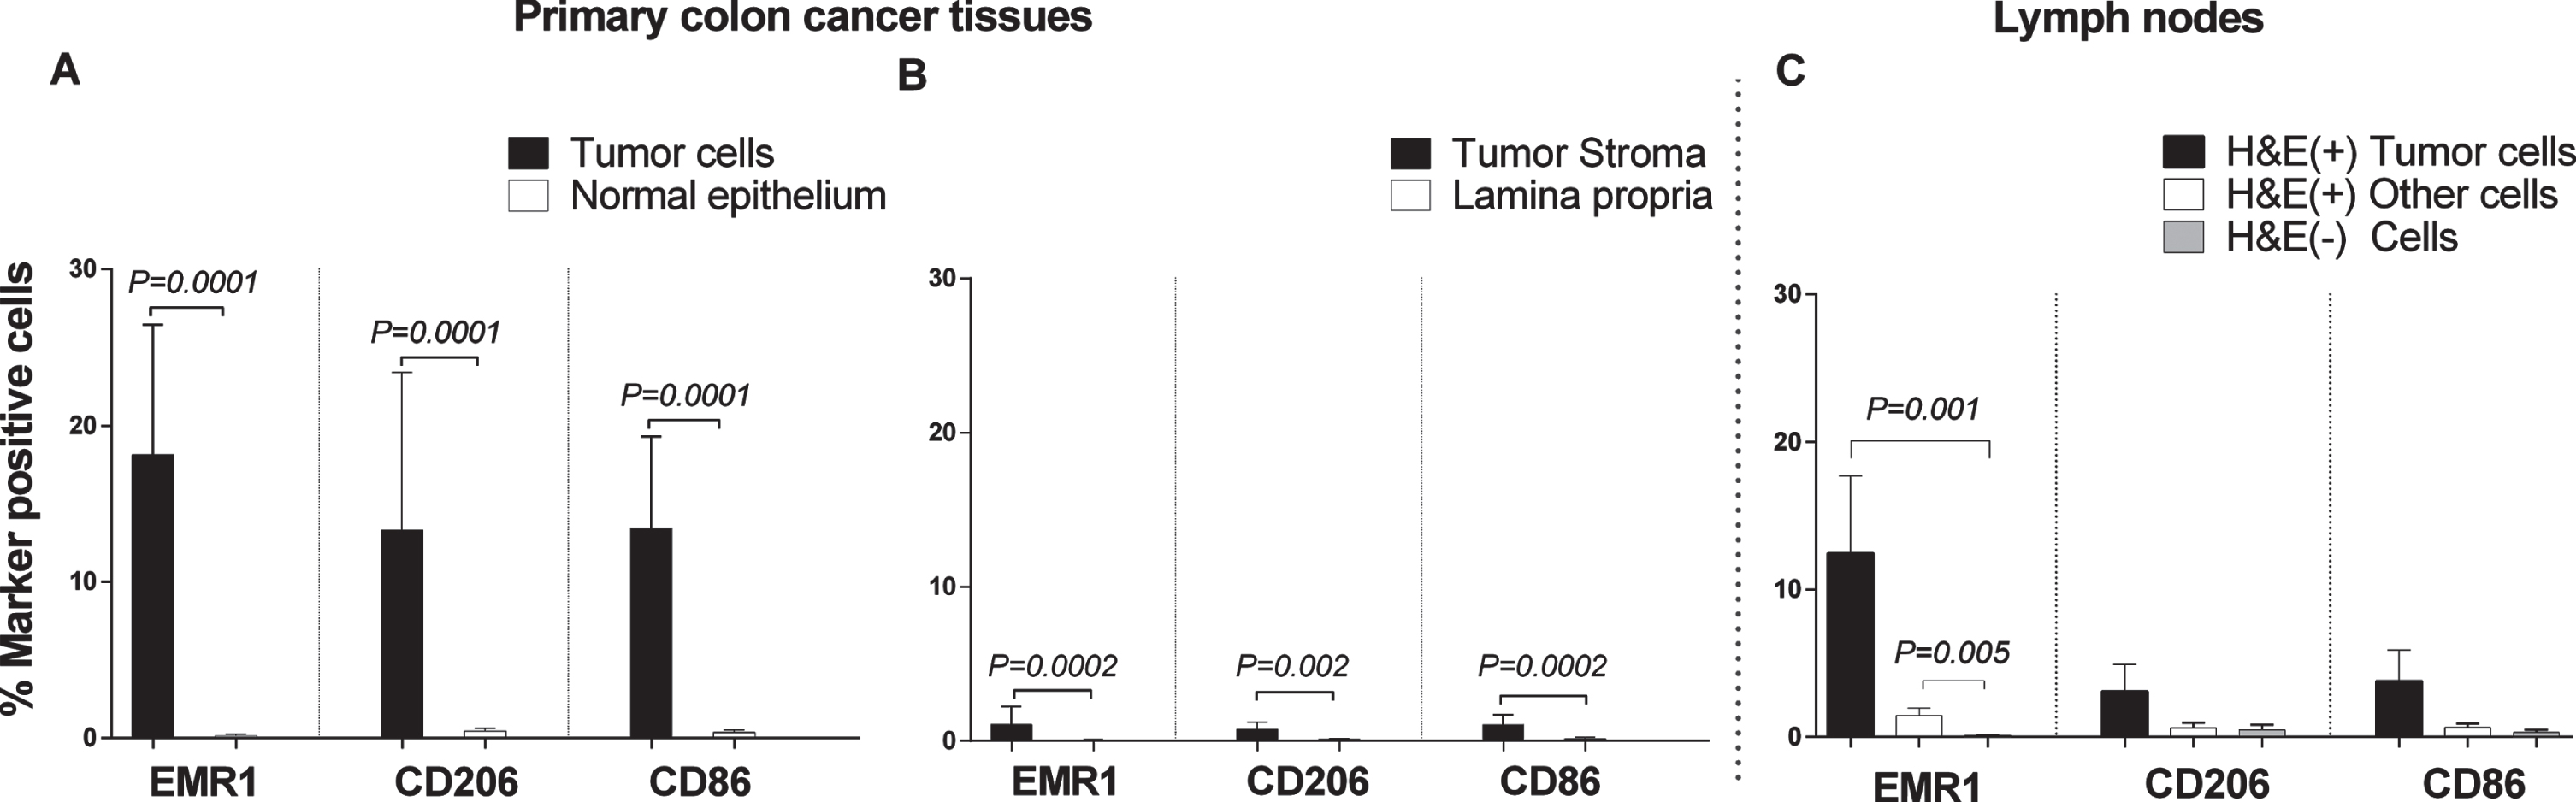
Weibel counting revealed that EMR1, CD206 and CD86 protein positive cells were present at significantly higher numbers in the CC tumor region than in normal colon epithelium (P = 0.0001; Fig. 5A). Between 15–20 % of the tumor cells were marker-positive. A highly significant difference was also seen when the tumor stroma was compared with lamina propria of normal colon mucosa (P = 0.0002, 0.002, and 0.0002 for EMR1, CD206 and CD86, respectively; Fig. 5B). About 1–2% marker positive cells were found in the stroma. Approximately, 12% of the cells in the tumor aggregates of H&E(+) lymph nodes were EMR1 protein positive (Fig. 5C). A low percentage of EMR1 positive cells was also found in other cells in H&E(+) lymph nodes, while almost no EMR1 positive cells were seen in H&E(–) nodes (Fig. 5C). The differences between H&E(+) lymph nodes and H&E(–) nodes were highly significant. Although both CD206 and CD86 were expressed at low levels in metastatic tumor cells aggregates in H&E(+) lymph nodes, the differences compared to H&E(–) lymph nodes were not statistically significant.
Fig. 5
Frequencies of EMR1, CD206 and CD86 positively stained cells in CC primary tumor tissue compared to normal colon tissue, and in H&E(+) and H&E(–) lymph nodes from CC patients as determined by immunomorphometric analysis according to Weibel. (A) CC tumor cells (black bars) compared with normal epithelial cells (open bars). (B) CC tumor stroma (black bars) compared with lamina propria in normal colon (open bars). (C) Metastatic tumors cells (black bars) and other cells of H&E(+) lymph nodes (open bars) compared to cells of H&E(–) lymph nodes (grey bars). Bars represent mean+1 SEM. P-values for comparisons between tumor and normal tissue by two-sided Mann–Whitney t-test are given. Ten primary CC tumors and 9 normal colon tissue samples were analyzed in A and B. Thirteen lymph nodes were analyzed in C.
3.3Correlation between mRNA levels of the myeloid cell markers EMR1, CD206 and CD86 and mRNA levels of the chemokines CXCL16 and CXCL17
High mRNA levels of the chemokines CXCL16 and CXCL17 in lymph nodes are markers of bad prognosis in CC patients and have previously been shown to be produced mainly by tumor cells [10, 11, 32]. Therefore, we investigated whether there is a correlation between mRNA levels for these chemokines and the myeloid cell marker studied here. Table 3 shows the results of the correlation analyses comparing the mRNA levels of EMR1, CD206 and CD86 with the levels of CXCL16 and CXCL17 mRNAs in 35 primary CC tumors. Interestingly, EMR1 mRNA levels correlated to CXCL17 mRNA levels but not to CXCL16 mRNA, CD86 mRNA correlated to CXCL16 mRNA levels but not to CXCL17 mRNA, while CD206 mRNA correlated to the mRNA levels of both chemokines.
Table 3
EMR1 mRNA expression levels correlates with CXCL17 mRNA while CD86 mRNA and CD206 mRNA is correlated to CXCL16 mRNA levels in primary tumors from patients with CC
| Biomarker | EMR1 | CD206 | CD86 | CXCL16 | CXCL17 |
| EMR1 | 0.52 ** | NS | NS | 0.45 ** | |
| CD206 | 0.43 ** | 0.50 ** | 0.35 * | ||
| CD86 | 0.50 ** | NS | |||
| CXCL16 | NS | ||||
| CXCL17 |
The numbers in the table show the r-values for the correlation. * P < 0.05, ** P < 0.01. 35 primary CC tumors were analyzed.
4Discussion
This study shows that EMR1 mRNA is overexpressed in CC tumors relative to normal colon tissue, and that it is present in 4/5 established CC cell lines albeit at relatively low levels. Since EMR1 is also expressed in cells of the myeloid linage, such as monocytes, macrophages, Kupffer cells, eosinophils, and basophiles, and less prominently in some tumor cells of the lymphoid lineage, [18, 33] and confirmed here by strong expression in the monocyte cell line U937, it could be argued that myeloid cells present in the tumor tissue samples and in normal colon tissue is responsible for the observed expression in CC tumor tissues. This is to some extent true but mRNA expression in 4/5 CC cell lines indicate that EMR1 is also expressed in CC-tumor cells. EMR1 expression in CC-tumor cells was confirmed at the protein level using two established markers for CC- tumor cells (CEA and EpCAM), and anti-EMR1 antibodies by two different immuno-histological staining techniques. However, not all CC tumor cells in primary tumors or in lymph node metastases express easily detectable levels of EMR1. We found that about 15–20 % of the tumor cells expressed EMR1. EMR1 is a G-Protein-Coupled-Receptor expressed on the cell surface with presently unknown ligand. The immuno-histochemistry staining results indicate that EMR1 is expressed on the cell surface also on CC tumor cells. Previous studies demonstrated, that the chemokine CXCL17 is ectopically expressed in CC-tumor cells [11, 32] Since there was a highly significant positive correlation between cells expressing EMR1 mRNA and CXCL17 mRNA, it is likely that it is essentially the same tumor cells that ectopically express the two molecules. Although EMR1 was not considered prognostic in CRC in analysis of the primary tumor, [33] the Iowa Women’s Health Study indicated that presence of tumor eosinophil infiltration in the primary tumor improved survival in CRC patients, [9] its ectopic expression in CC cells may make it a useful prognostic marker in CC lymph nodes where most myeloid linage cells are lacking.
The results on CD206 expression at the mRNA and protein levels is more complex. Firstly, CD206 mRNA is not overexpressed in CC tumor compared to control colon tissue or in lymph nodes harboring CC-tumor cells and only weakly expressed in CC cell lines. At the protein level we found coherent staining with anti-CEA/anti-CD206 and double staining with anti-EpCAM/anti-CD206. In the latter case there was a weak staining of most cells plus a rather strong anti-EpCAM staining of a few cells apparently not CD206 positive. CD206 is a C-type lectin also known as the mannose receptor. It occurs in a membrane-bound form and in a soluble form with retained carbohydrate binding ability. It is expressed on immature dendritic cells, antigen presenting cells, dermal fibroblasts and keratinocytes [7] but not on monocytes. The fairly high mRNA expression level in colonocytes and colon tumor cells makes this biomarker less useful as a M2 macrophage marker in CC. An interesting possibility to explain these results is that soluble CD206 has bound to carbohydrate structures at the tumor cell surface. It is well established, that the glycosylation pattern of surface glycoproteins and glycolipids are changed in epithelial tumors compared their normal counterparts, so called “tumor-associated carbohydrate antigens” [34].
CD86, a cell surface molecule expressed on M1 macrophages and antigen presenting cells (APCs) and the ligand to CTLA-4, is not expressed in tumor cells as seen from the entirely negative mRNA analysis on the five colon carcinoma cell lines studied here. Studying primary CC tumor cells samples in comparison with normal colon tissue we found increased mRNA expression in the tumor samples compared with normal colon tissue. However, this difference is most likely due to increased number of APCs and/or M1 macrophages in the tumor tissue. Thus, CD86 qualifies as M1 macrophage marker in CC. CD86 mRNA expression levels were significantly higher in T3- than T2 tumors (P < 0.05). The significance of this difference is unclear.
In summary, this study shows that the G-protein-coupled-receptor EMR1 is ectopically expressed in CC cells. Moreover, correlation analysis indicate that it is largely the same tumor cells that express CXCL17, previously shown to be ectopically expressed [11]. Both markers are primarily indicators of myeloid cells. An interpretation of these findings is that the tumor is manipulating the immune system of the host by pretending to be myeloid cells thereby escaping immune surveillance. It will be interesting to investigate whether EMR1 also is a marker of poor prognosis as was found to be the case for CXCL17. Another interesting aspect is identifying the unknown ligand of EMR1, which may help in understanding how epithelial cells can adopt properties of myeloid cells.
An important lesson from this study is, that immunohistochemistry or mRNA analysis alone are in many cases not enough to reveal tumor cell expression of an unknown gene. Careful analysis using both techniques is required.
Acknowledgments
We thank Technologist Anne Israelsson and Dr. Hager Ismail for their skillful technical assistance.
This work was financially supported by grants from the Swedish Research Council-Medicine and Health (BS) and Swedish Research Council-Natural and Engineering Sciences (M-LH), the Medical Faculty of Umeå University (BS and M-LH), the County Council of Västerbotten (BS), Lions Cancer Research Fund (BS), and Stig and Ragna Gorthon Foundation (GL).
Author contributions
CONCEPTION: BS, HA, LO, M-LH, GL and SH
DATA CURATION: GL, HA, LO, BS and HA
ANALYSIS OF DATA: BS, SH, M-LH and HA
PREPARATION OF THE MANUSCRIPT: BS, SH, M-LH and HA
REVISION FOR IMPORTANT INTELLECTUAL CONTENT: All authors
Conflict of interest
The authors declared no conflicts of interest.
Ethical considerations
All procedures performed in studies involving human participants were in accordance with the ethical standards of the institutional research committee and with the 1964 Helsinki Declaration and its later amendments or comparable ethical standards. The study was approved by the Local Ethics Research Committee of the Medical Faculty, Umeå University, Umeå, Sweden (Registration number: 03-503). Samples were collected after patients’ written, informed consent.
Supplementary material
[1] The supplementary material is available in the electronic version of this article: https://dx.doi.org/10.3233/TUB-200082.
References
[1] | Keum N. , Giovannucci E. Global burden of colorectal cancer: emerging trends, risk factors and prevention strategies. Nat Rev Gastroenterol Hepatol. (2019) ;16: :713–32. |
[2] | Medema RH. , Macurek L. Checkpoint control and cancer. Oncogene. (2012) ;31: :2601–13. |
[3] | Böckelman C. , Engelmann BE. , Kaprio T. , et al. Risk of recurrence in patients with colon cancer stage II and III: a systematic review and meta-analysis of recent literature. Acta Oncol. (2015) ;54: :5–16. |
[4] | Schouppe E. , De Baetselier P. , Van Ginderachter JA. , et al. Instruction of myeloid cells by the tumor microenvironment: Open questions on the dynamics and plasticity of different tumor associated myeloid cell populations. Oncoimmunology. (2012) ;1: :1135–45. |
[5] | Larionova I. , Cherdyntseva N. , Liu T. , et al. Interaction of tumor associated macrophages and cancer chemotherapy. Oncoimmunology. (2019) ;8: :1596004–19. |
[6] | Orecchioni M. , Ghosheh Y. , Pramod AB. , et al. Macrophage polarization: Different gene signatures in M1(LPS+) vs. classically and M2(LPS-) vs. alternatively activated macrophages. Front Immunol. (2019) ;10: :1084. |
[7] | Jayasingam SD. , Citartan M. , Thang TH. , et al. Evaluating the polarization of tumor-associated macrophages into M1 and M2 phenotypes in human cancer tissue: technicalities and challenges in routine clinical practice. Front Oncol. (2020) ;9: :1512. |
[8] | Feng Q. , Chang W. , Mao Y. , et al. Tumor-associated macrophages as prognostic and predictive biomarkers for postoperative adjuvant chemotherapy in patients with stage II colon cancer. Clin Cancer Res. (2019) ;25: :3896–907. |
[9] | Prizment AE. , Vierkant RA. , Smyrk TC. , et al. Tumor eosinophil infiltration and improved survival of colorectal cancer patients: Iowa Women’s Health Study. Mod Pathol. (2016) ;29: :516–27. |
[10] | AbdelMageed M. , Ali H. , Olsson L. , et al. The chemokine CXCL16 is a new biomarker for lymph node analysis of colon cancer outcome. Int J Mol Sci. (2019) ;20: :5793. |
[11] | Ohlsson L. , Hammarström ML. , Lindmark G. , et al. Ectopic expression of the chemokine CXCL17 in colon cancer cells. Br J Cancer. (2016) ;114: :697–703. |
[12] | He X. , Xu C. Immune checkpoint signaling and cancer immunotherapy. Cell Res. (2020) ;30: :660–9. |
[13] | Flörcken A. , Johannsen M. , Nguyen-Hoai , et al. Immunomodulatory molecules in renal cell cancer: CD80 and CD86 are expressed on tumor cells. Int J Clin Exp Pathol. (2017) ;10: :1443–54. |
[14] | Fan W. , Yang X. , Huang F. , et al. Identification of CD206 as a potential biomarker of cancer stem-like cells and therapeutic agent in liver cancer. Oncol Lett. (2019) ;18: :3218–26. |
[15] | Engel P. , Gribben JG. , Freeman GJ. , et al. The B7-2 (B70) costimulatory molecule expressed by monocytes and activated B lymphocytes is the CD86 differentiation antigen. Blood. (1994) ;84: :1402–7. |
[16] | Murray PG. , Oates J. , Reynolds GM. , et al. Expression of B7 (CD80) and CD40 antigens and the CD40 ligand in Hodgkin’s disease is independent of latent Epstein-Barr virus infection. Clin Mol Pathol. (1995) ;48: :105–8. |
[17] | Scodeller P. , Simon-Gracia L. , Kopanchuk S. , et al. Precision targeting of tumor macrophages with a CD206 binding peptide. Sci Rep. (2017) ;7: :14655. |
[18] | Hamann J. , Koning N. , Pouwels W. , et al. EMR1, the human homolog of F4/80, is an eosinophil-specific receptor. Eur J Immunol. (2007) ;37: :2797–802. |
[19] | Gad AA. , Balenga N. The emerging role of adhesion GPCRs in cancer. ACS Pharmacol Transl Sci. (2020) ;3: :2942. |
[20] | Legrand F. , Tomasevic N. , Simakova O. , et al. The eosinophil surface receptor epidermal growth factor-like module containing mucin-like hormone receptor 1 (EMR1): a novel therapeutic target for eosinophilic disorders. J Allergy Clin Immunol. (2014) ;133: :1439–47. |
[21] | Zhang Y. , Sime W. , Juhas M. , et al. Crosstalk between colon cancer cells and macrophages via inflammatory mediators and CD47 promotes tumour cell migration. Eur J Cancer. (2013) ;49: :3320–34. |
[22] | Strasser K. , Birnleitner H. , Beer A. , et al. Immunological differences between colorectal cancer and normal mucosa uncover a prognostically relevant immune cell profile. Oncoimmunology. (2018) ;8: :e1537693. |
[23] | Forssell J. , Öberg Å. , Henriksson ML. , et al. High macrophage infiltration along the tumor front correlates with improved survival in colon cancer. Clin Cancer Res. (2007) ;13: :1472–9. |
[24] | Lu W. , Yu W. , He J. , et al. Reprogramming immunosuppressive myeloid cells facilitates immunotherapy for colorectal cancer. EMBO Mol Med. (2021) ;11: :12798. |
[25] | Motz GT. , Coukos G. The parallel lives of angiogenesis and immunosuppression: cancer and other tales. Nat Rev Immunol. (2011) ;11: :702–11. |
[26] | Olsson L. , Lindmark G. , Hammarstrom ML. , et al. Evaluating macrophage migration inhibitory factor 1 expression as a prognostic biomarker in colon cancer. Tumour Biol. (2020) ;42: :1010428320924524. |
[27] | Ohlsson L. , Israelsson A. , Öberg Å. , et al. Lymph node CEA and MUC2 mRNA as useful predictors of outcome in colorectal cancer. Int J Cancer. (2012) ;130: :1833–43. |
[28] | Bas A. , Forsberg G. , Hammarström S. , et al. Utility of the housekeeping genes 18S rRNA, beta-actin and glyceraldehyde-3-phosphate-dehydrogenase for normalization in real-time quantitative reverse transcriptase-polymerase chain reaction analysis of gene expression in human T lymphocytes. Scand J Immunol. (2004) ;59: :566–73. |
[29] | Sitohy B. , Hammarström S. , Danielsson Å. , et al. Basal lymphoid aggregates in ulcerative colitis colon: a site for regulatory T cell action. Clin Exp Immunol. (2008) ;151: :326–33. |
[30] | Ali H. , AbdelMageed M. , Olsson L. , et al. Utility of G protein coupled receptor 35 expression for predicting outcome in colon cancer. Tumour Biol. (2019) ;41: :1010428319858885. |
[31] | Weibel ER. Point counting methods. In: Weibel ER, ed. Stereological methods.ed., vol. 1. Practical Methods for Biological Morphometry. London: Academic Press, (1979) ;101–161. |
[32] | Rashad Y. , Olsson L. , Israelsson A. , et al. Lymph node CXCL17 messenger RNA: A new prognostic biomarker for colon cancer. Tumour Biol. (2018) ;40: :1010428318799251. |
[33] | Uhlen M. , Ponten F. , Hober S. , et al. Human protein atlas, 2014, https://www.proteinatlas.org/ |
[34] | Pirro M. , Mohammed Y. , van Vliet SJ. , et al. N-glycoproteins have a major role in MGL binding to colorectal cancer cell lines: Associations with overall proteome diversity. Int J Mol Sci. (2020) ;21: :5522. |


