
Effects of Homologous instrument assisted mobilization (HIM) on ankle movement, gait-related muscle activation, and plantar pressure distribution in ankle dorsiflexion syndrome: A randomized single control trial
Abstract
BACKGROUND:
While the limited ankle dorsiflexion syndrome (ADS) is common in neuro-musculoskeletal conditions, the instrument-assisted mobilization focused on the shortened gastro-soleus myofascial structure (IMI) rather than the homologous structure (both gastrosoleus and tibiliais anterior muscles, HIM).
OBJECTIVE:
We aimed to compare the immediate therapeutic effects between IMH and IMI treatment groups on the ankle dorsiflexion angle, muscle activation and foot pressure distribution during dynamic gait in ADS.
METHODS:
Neuromechanical tests including kinematics (ankle mobility), kinetics (center of pressure distribution), and electromyography were used to determine the immediate therapeutic effects between HIM and IMI treatment groups in 24 participants with ADS.
RESULTS:
The ankle joint angle analysis demonstrated a more improved active DF angle in the group who received HIM intervention when compared to the group who received IMI intervention. (11.26% and 3.58%, respectively) EMG analysis showed more decreased mean and peak TA activation amplitudes in the group who received HIM intervention (9.1% and 9%) when compared to the group who received IMI intervention (11.48% and 1.48%). Plantar pressure distribution analysis showed difference that the forefoot/area decreased in the group who received HIM intervention (8.1%), but rather increased in the group who received IMI intervention (14.3%).
CONCLUSIONS:
Our neuromechanical results demonstrated promising positive effects on ankle joint mobility, muscle activation and foot pressure distribution during gait in ADS.
1.Introduction
Limited ankle dorsiflexion syndrome (ADS) is common in both musculoskeletal (e.g., lateral ankle sprain and plantar fasciitis) and neurological conditions (e.g., stroke and spastic diplegia), which alter ankle mobility, muscle activation, and foot plantar pressure distribution during dynamic gait. The potential causes of these differential diagnoses and etiologies may involve gastro-soleus muscle shortness or tightness in the musculoskeletal or soft-tissue conditions and spasticity or rigidity in neurological conditions [1]. Among these differential diagnoses, musculoskeletal impairments including gastro-soleus muscle shortness or tightness, plantar fasciitis, and Achilles’ tendinopathy are common etiologies [2]. For example, as many as 1 billion female users with high-heeled shoes may experience such gastro-soleus muscle shortness or tightness. Normally, an ankle dorsiflexion (DF) range of motion (ROM) of at least 10∘ is needed to move the body forward during the stance phase of the gait cycle as the tibia glides forward in a closed chain [3]. However, insufficient ankle DF mobility causes variations in electromyography (EMG) and foot plantar pressure during walking [4]. Shin and his colleagues demonstrated that the peak activity of the tibialis anterior (TA) was higher in individuals with ADS than in normal controls during gait [5]. Kadel and colleagues reported lower gastrocnemius (GCM) activation (20%) in individuals with ADS who wore high-heeled boots during gait [6]. These biomechanical constraints in the ADS affect ankle movement, muscle activation, and foot plantar pressure distribution during dynamic gait in both musculoskeletal and neurological populations, contributing to an increased risk of tripping [7, 8].
To address altered ankle mobility, muscle activation, and foot plantar pressure distribution in individuals with ADS, contemporary therapeutic techniques, including active or passive stretching and instrument-assisted mobilization (IMI), have been widely used to increase passive or active ankle DF ROM during static conditions [9, 10, 11]. However, a review of the current literature failed to produce clinical evidence supporting the therapeutic effects of these techniques during dynamic walking conditions in ADS and reported variable results [12]. Johanson and his colleagues reported that static stretching of the gastrocnemius muscle (GCM) (30 s, 5 times daily for 3 weeks) in individuals with ADS increased the passive ankle DF angle, but there was no difference in GCM activation during walking and no lasting or sustainable effects [10, 11, 13]. Such inconsistent results may arise from the fact that previous methods or techniques have not addressed the important neuromechanical properties of the length-tension relationship, autogenic inhibition, and reciprocal muscle activation [14, 15]. Based on this theoretical framework, we developed the HIM technique, which is designed to mitigate muscle length-tension relationship by means of applying the deep pressure effulge technique over the shortened GCM-Achilles’ tendon, while passively or actively moving the ankle into dorsiflexion [11]. Subsequently, restoration of the muscle length-tension relationship leads to more normalized muscle activation, which enhances ankle dorsiflexion mobility and plantar pressure distribution [16].
The purpose of this study was to compare the differential effects of HIM and IMI techniques on active ankle DF mobility, EMG ankle muscle activation pattern in the medial GCM, lateral GCM, and TA, and plantar pressure distribution in individuals with ADS. We hypothesized that there would be differences between the HIM and IMI groups in terms of active ankle dorsiflexion and plantar flexion ROM and EMG ankle muscle activation patterns in the medial GCM, lateral GCM, and TA as well as plantar pressure distribution.
2.Method
2.1Participants
Twenty-four young participants (age 24.77
Table 1
Demographic characteristics of the participants (
| HIM group ( | IMI group ( | ||
|---|---|---|---|
| Age (years) | 25.2 | 24.2 | 0.50 |
| Gender (M/F) | 6/6 | 7/5 | 0.56 |
| Height (cm) | 169.7 | 165.5 | 0.12 |
| Weight (kg) | 63.0 | 60.9 | 0.37 |
| BMI | 22.0 | 20.0 | 0.46 |
Abbreviations: SD, standard deviation; BMI, body mass index; HIM, homologous (paired tibialis anterior-gastrocnemius), IMI, isolated target gastrocnemius.
2.2Research design
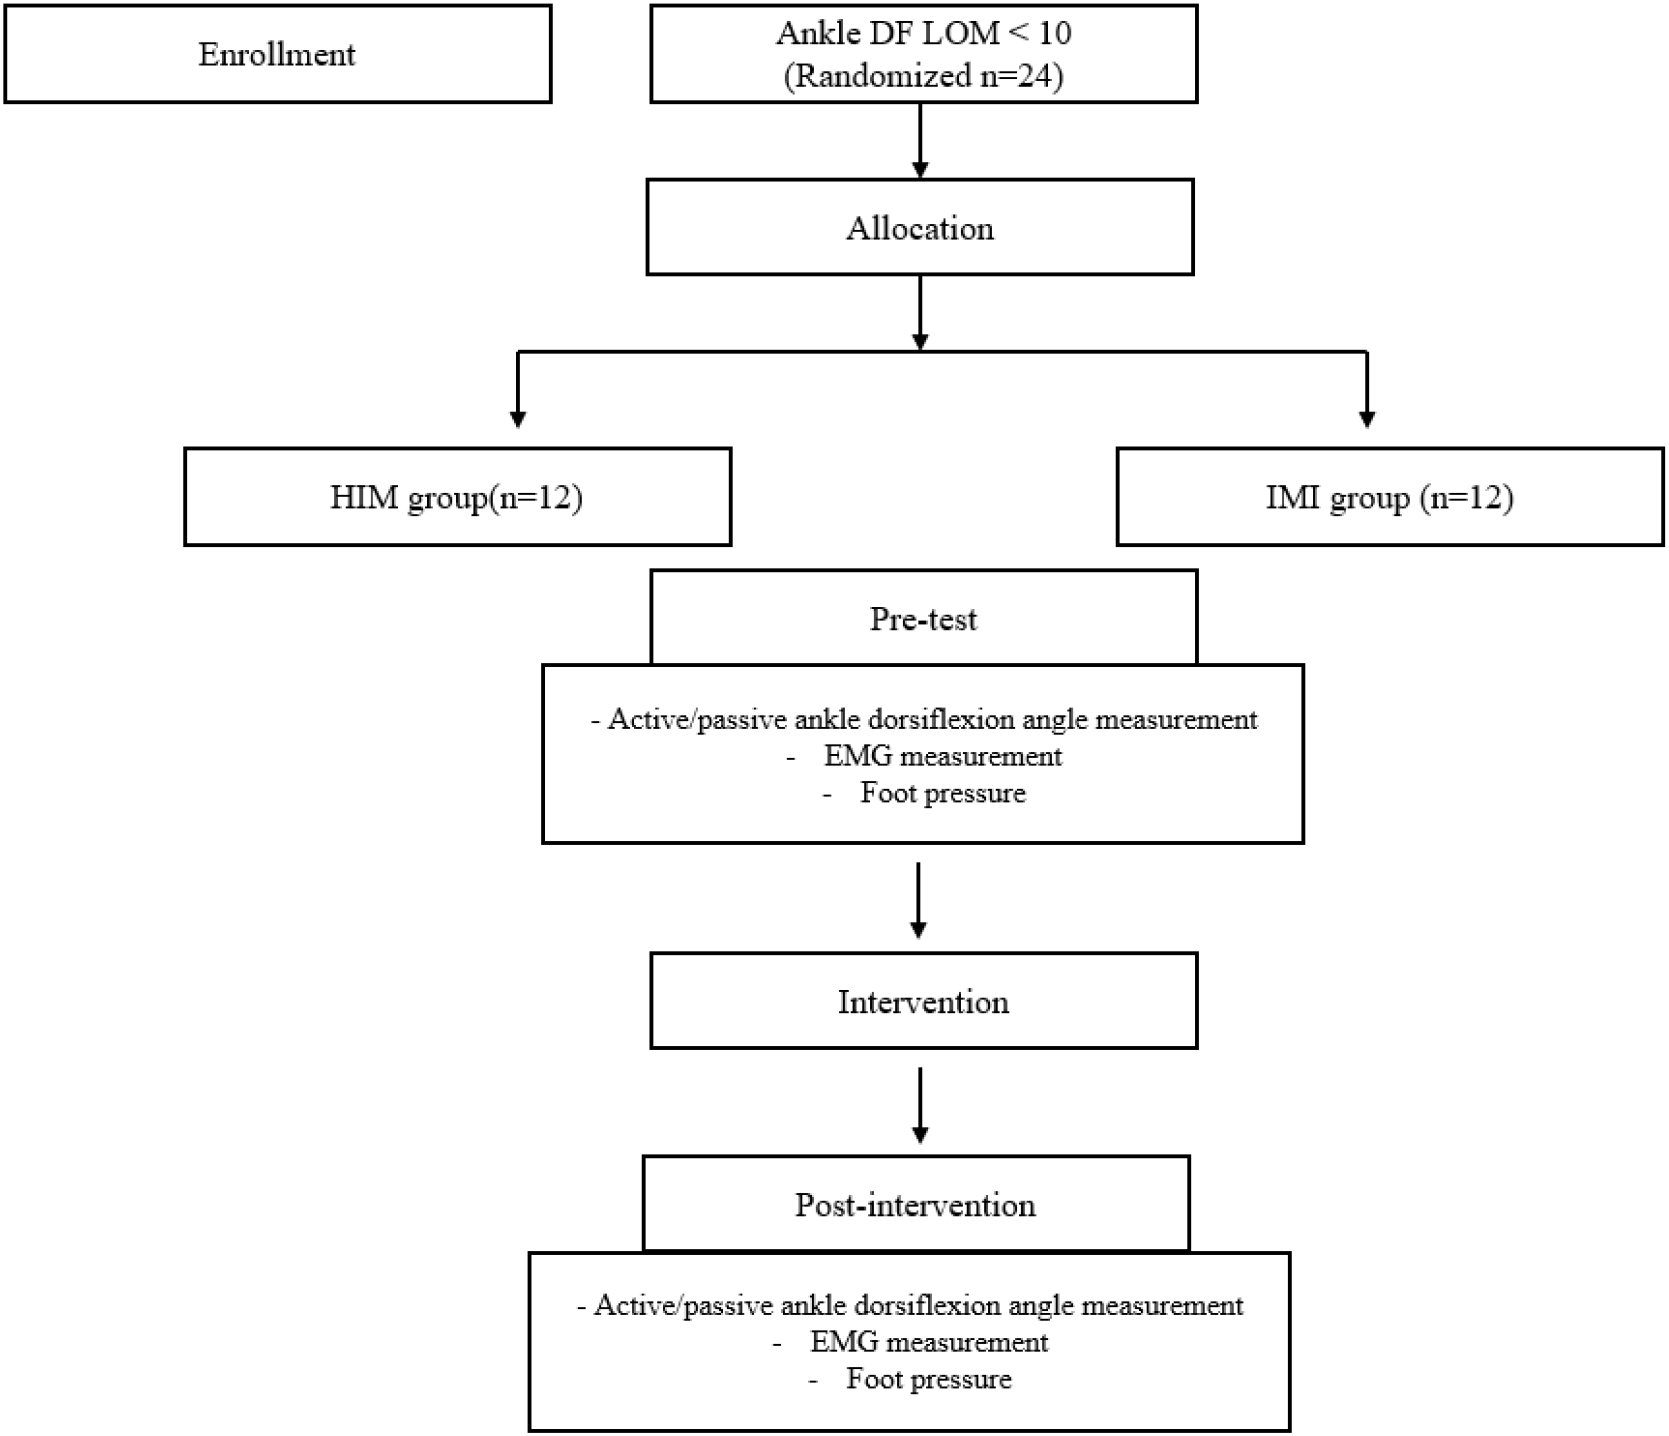
A participant-blinded randomized experimental design was used in the present study, in which all participants were randomly assigned to the HIM or IMI group using a random number generator in Microsoft Excel software (Microsoft Excel, Microsoft corporation, USA). To eliminate potential biases resulting from participants’ expectations, any experimental information that could influence them was concealed until the completion of the experiment. Both before and after the intervention, the biomechanical measurements including active and passive ankle ROM mobility, muscle activation pattern, and plantar pressure using ImageJ software (National Institutes of Health, Bethesda, MD), EMG, and insole sensor measurements, respectively, which were collected concurrently during self-preferred walking. All assessments and interventions were implemented consistently throughout the experimental procedure. A flowchart of the study is presented in Fig. 1.
Figure 1.
Flow chart.
2.3Data collection and procedure
2.3.1Ankle mobility
Image J was used to determine the intervention-related passive and active ankle DF ROM. The participant was positioned lying prone with the knee extended. One of the investigators (S.P.) instructed the participant’s ankle DF motion and performed the active DF ROM and the force of passive ankle DF motion was performed by the same investigator. Another investigator (J.Y.) collected camera images of the ankle’s lateral side. A camera was positioned 1 m from the sagittal plane of the ankle joint, at the same height and in the same plane as the ankle joint. To reduce distortion, the camera was positioned at a 90∘ angle on a tripod [18]. The marker was placed at the lateral malleolus, the middle of the lateral side of the fifth metatarsal bone, and the fibular head in the right leg [19]. A mark is consistently made on the same bony landmarks to minimize any potential error associated with the marker placement. The Image J photographic analysis software program was used to analyze the image files. The test was conducted three consecutive times, and the average value of the three readings was recorded as the passive ankle dorsiflexion ROM and saved for further statistical analysis [4]. The validity and test-retest reliability of the Image J software has been well established elsewhere (
2.3.2Muscle activation
Surface EMG (MR 3.18, Noraxon USA, Inc., Scottsdale, AZ, USA) was used to determine the muscle activation amplitudes of the medial GCM, lateral GCM, and TA muscles, which were collected simultaneously with the joint angle data during walking trials. The electrodes were attached to the medial GCM, lateral GCM, and TA muscles of the right leg according to the recommendations of SENIAM, and their EMG signals were collected at 2000 Hz using a surface EMG system [21]. The raw EMG signals were full-wave rectified, bandpass filtered between 10 and 500 Hz, and smoothed using a zero-lag 2nd order Butterworth filter with a cutoff frequency of 6 Hz to obtain a linear envelope of the signals. The processed EMG data for each muscle were normalized to the peak amplitude of the muscle after one minute of walking. The software used in data collection applied a high-pass band filter of 10 Hz and a lowpass band filter of 500 Hz as the data were collected. The threshold value of the plantar pressure insole, a device capable of electromyography (EMG) and sinking, was set to 10% for stance phase detection. The stance phase was then extracted and examined. The EMG test was performed three consecutive times, and the average value of the three readings was recorded for 10 repeated gait cycles and saved for further statistical analysis.
2.3.3Plantar pressure distribution
A Noraxon Ultium Insole (SmartLead, Noraxon, Scottsdale, Arizona, USA) was used to determine intervention-related changes in plantar pressure. The participants wore a pair of knitted shoes (Natso Knit Jogging Shoes, Keon Jong, South Korea) equipped with a Noraxon Ultium Insole, and plantar pressure data were collected at a sampling rate of 250/500 Hz Hz. Plantar pressure signals were collected simultaneously with the EMG data during the walking trials. Initially, the Noraxon EMG and Ultium Insole were concurrently calibrated to determine the accurate baseline EMG and plantar pressure distribution before the testing. The acquired plantar pressure distribution was analyzed with the Noraxon EMG and Ultium Insole software. The plantar pressure distribution test was performed three consecutive times, and the average value of the three readings was recorded for 10 repeated gait cycles and saved for further statistical analysis.
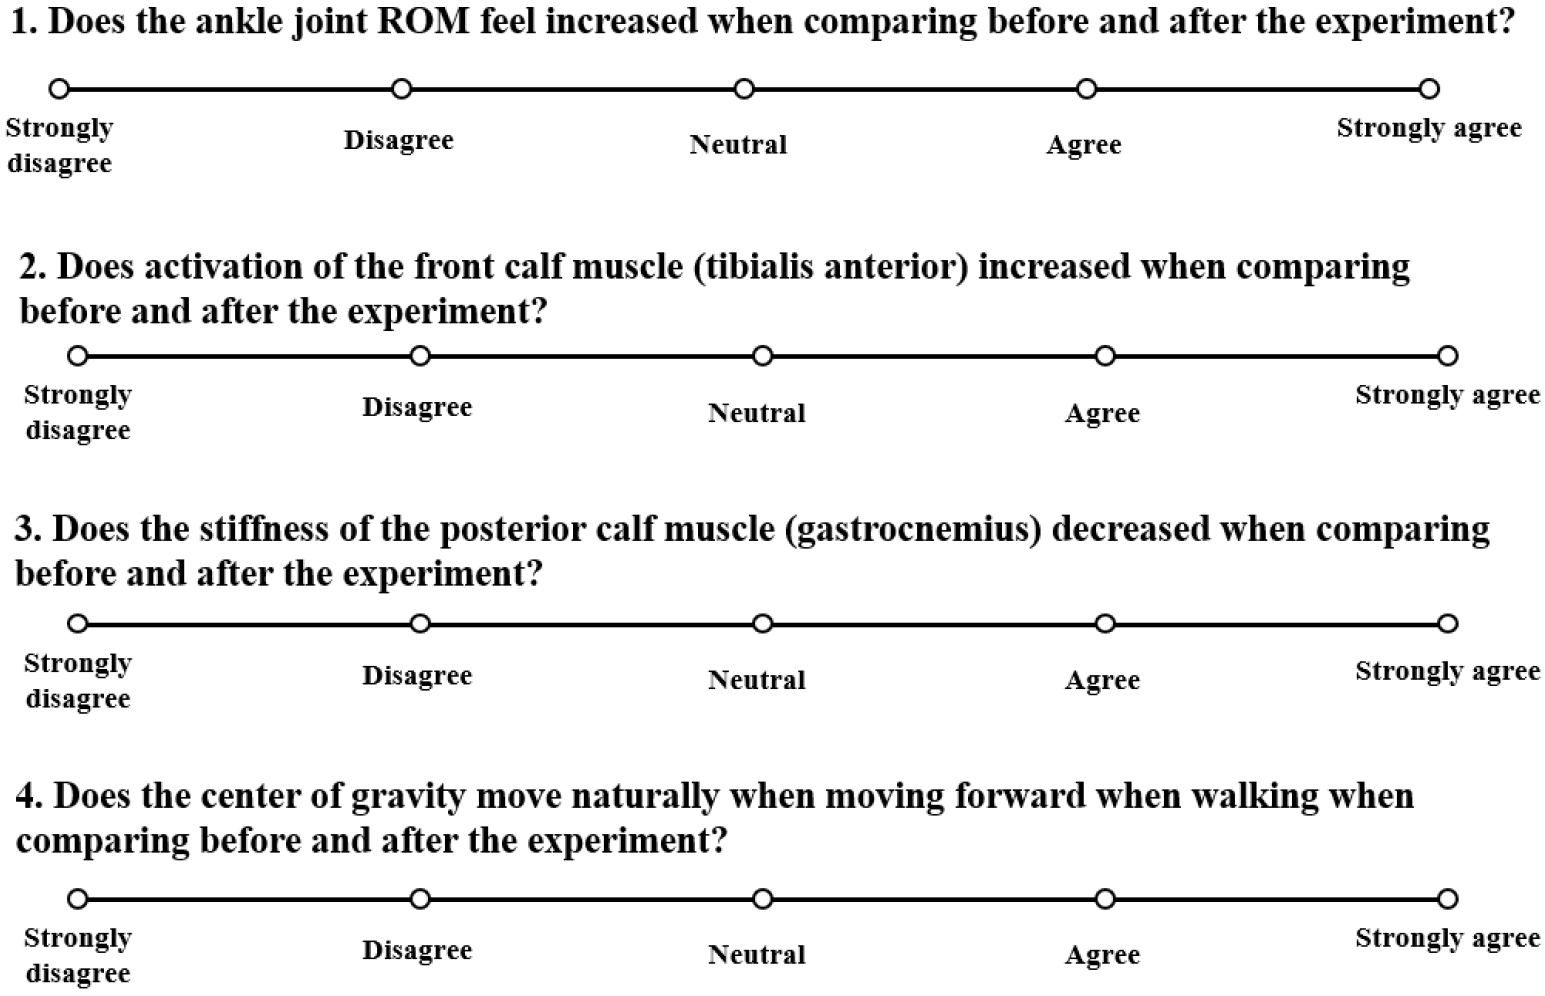
2.3.4Post-intervention questionnaire
The post-intervention questionnaire included four questions related to ankle mobility (Q1), muscle activation (Q2), feeling of stiffness (Q3), and center of pressure (Q4) changes using a Likert scale:1 (‘strongly disagree’), 2 (‘disagree’), 3 (‘neutral’), 4 (‘agree’), and 5 (‘strongly agree’) in Fig. 2.
Figure 2.
Post-intervention questionnaire.
2.3.5Intervention
The interventions included (1) HIM and (2) IMI group interventions. All participants were randomly assigned to the HIM or IMI group. Both the experimental and control groups underwent a standardized intervention protocol (30 min/session, one session). In the HIM group, participants were instructed to lie prone on a treatment table with hip and knee extended, and feet in a neutral position at the end of the table. First, the clinician began scanning the GCM muscles using a sweep stroke for 1 min. We then applied the 1–2 Hz low-frequency vibration technique, which is a deep pressure technique for inhibition of the Meissner corpuscle to the medial and lateral GCM. A massage lotion was applied to the target area, whereas the medial and lateral GCM muscles utilized the instrument to apply deep pressure in a proximal-to-distal direction, following the stretching of the muscle from its origin to its insertion (Dr. You STM® in Fig. 3, Seed Tech Cooperation, Kyong-gi, Republic of Korea). After the inhibition technique, the TA muscle applies a facilitation technique, which is quick pressure for stimulating the Pacinian corpuscle, from the insertion to the origin (from the proximal to the distal direction of muscular contraction), and participants simultaneously conduct dorsiflexion in Fig. 4. The participants were instructed to provide feedback to the clinician so that they could monitor the treatment intensity and ensure patient comfort. The clinician observed the participant’s skin redness and muscle fatigue. If symptoms arose, the intervention was stopped and an ice pack was applied.
Figure 3.
Dr. You STM®.
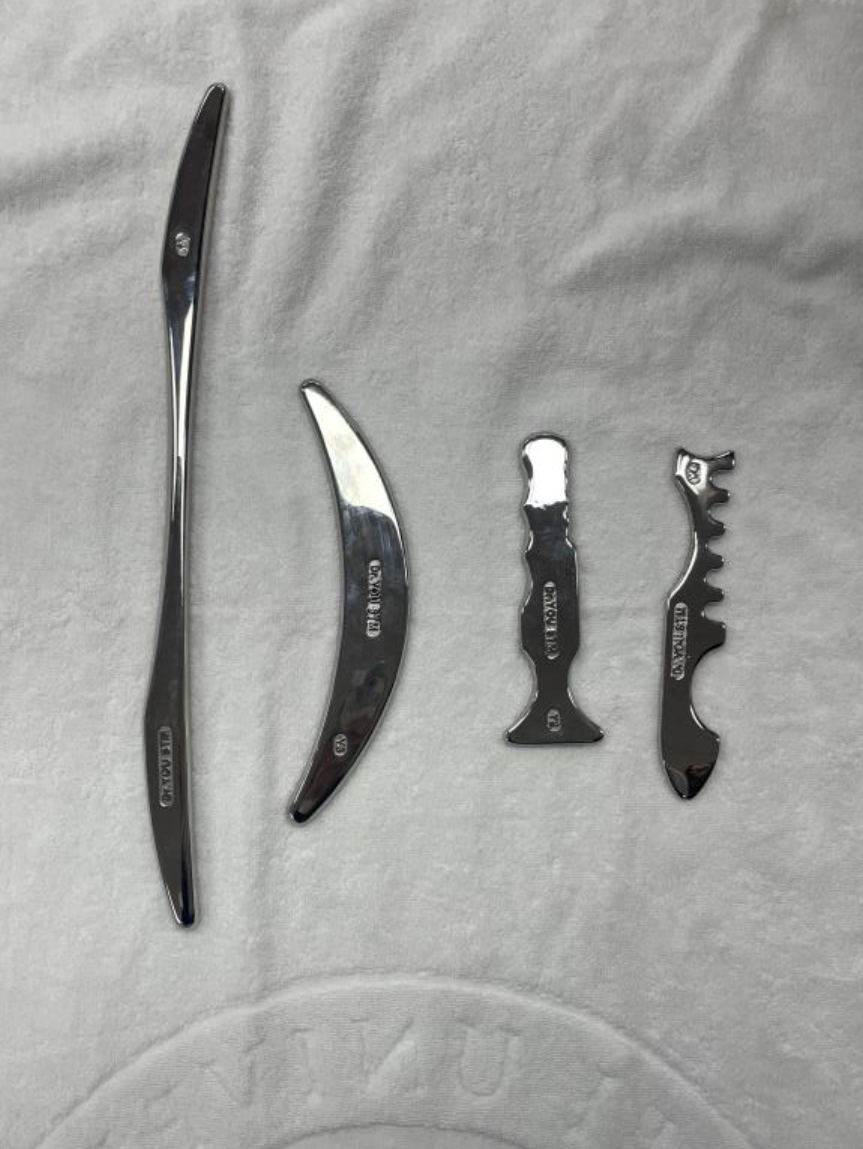
Figure 4.
IMI group intervention.
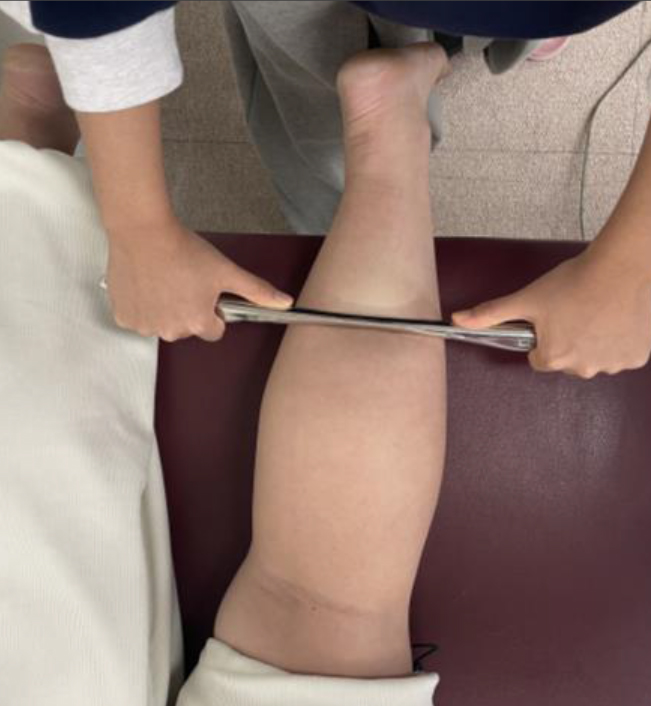
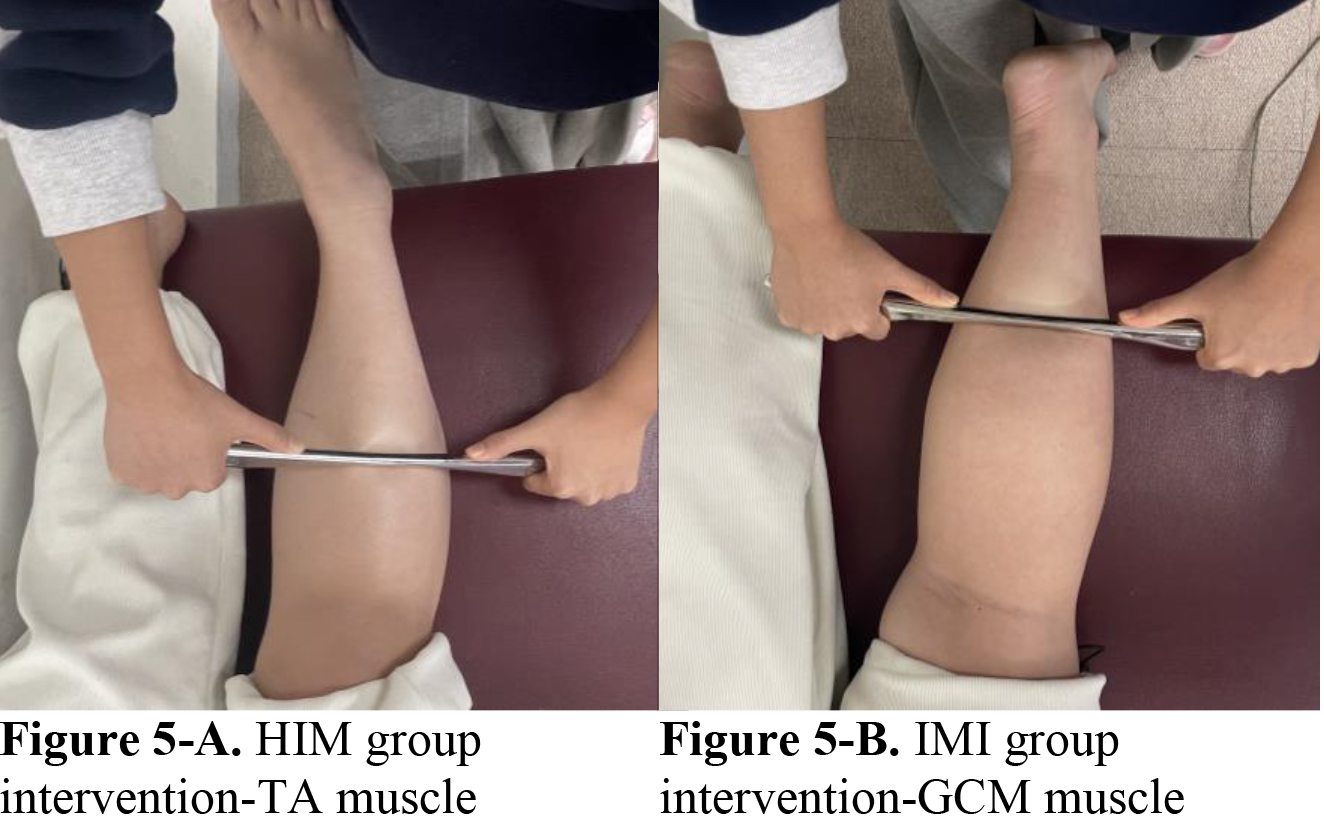
For the IMI group intervention, the participants were asked to lie prone on a treatment table with hip extension, knee extension, and feet in a neutral position at the end of the table. A massage lotion was applied to the target myofascial area, whereas the medial and lateral GCM muscles utilized the instrument to apply pressure in a proximal-to-distal direction, following the stretching of the muscle from its origin to its insertion in Fig. 5. The precautions and application methods used during the experiment were the same as those used for the inhibition technique in the HIM group.
Figure 5.
The lateral and medial GCM muscles were mobilized with the instrument assisted mobilization in the IMI group. The instrument assisted mobilization of the TA muscle was initially performed on the HIM group. And then the GCM muscles, both medial and lateral, are used.
2.4Data analysis
Statistical data were expressed as means and standard deviations. Independent t-tests or chi-square tests were used to compare baseline clinical characteristics and demographic data between the IMI and HIM groups. A power analysis using G Power software (version 3.1.9.4; Franz Faul, University of Kiel, Germany) was conducted to assess the minimum sample size requirement based on a prior pilot study. Based on a pilot study, the sample size was determined to be 24, and power (1 –
3.Results
Baseline demographic data, including age, gender, height, weight, and BMI did not differ between the groups.
3.1Ankle joint mobility data
Two-way mixed ANOVA showed a significant time
Table 2
Post-intervention angle and muscle activation outcome analysis, Mean
| HIM group | IMI group | |||||||||||||||
|---|---|---|---|---|---|---|---|---|---|---|---|---|---|---|---|---|
| Pre-test | Post-test | Pre-test | Post-test | Time effect | Betwen groups | Time x group | Time effect | |||||||||
| Active DF angle | 86.96 | 77.16 | 80.42 | 80.9 | 0. | 048 | 0. | 543 | 0. | 03* | 0. | 062 | ||||
| Passive DF angle | 86.96 | 83.87 | 87.53 | 83.35 | 0. | 002* | 0. | 070 | 0. | 105 | 0. | 581 | ||||
| Mean TA | 34.41 | 31.28 | 39.81 | 35.09 | 0. | 066 | 0. | 032* | 0. | 704 | 0. | 509 | ||||
| Peak TA | 73.84 | 66.83 | 76.35 | 75.22 | 0. | 167 | 0. | 067 | 0. | 316 | 0. | 676 | ||||
| Mean medial GCM | 38.24 | 38.82 | 40.81 | 42.99 | 0. | 531 | 0. | 130 | 0. | 715 | 0. | 582 | ||||
| Peak medial GCM | 53.75 | 54.13 | 63.2 | 65.41 | 0. | 687 | 0. | 002* | 0. | 777 | 0. | 108 | ||||
| Mean lateral GCM | 27.35 | 29.91 | 19.53 | 21.92 | 0. | 178 | 0. | 000** | 0. | 965 | 1. | 059 | ||||
| Peak lateral GCM | 37.85 | 41.81 | 29.54 | 30.94 | 0. | 198 | 0. | 000** | 0. | 533 | 1. | 427 | ||||
Abbreviations: SD, standard deviation; TA, tibialis anterior; GCM, gastrocnemius; HIM, homologous (paired tibialis anterior gastrocnemius); IMI, isolated target gastrocnemius. *
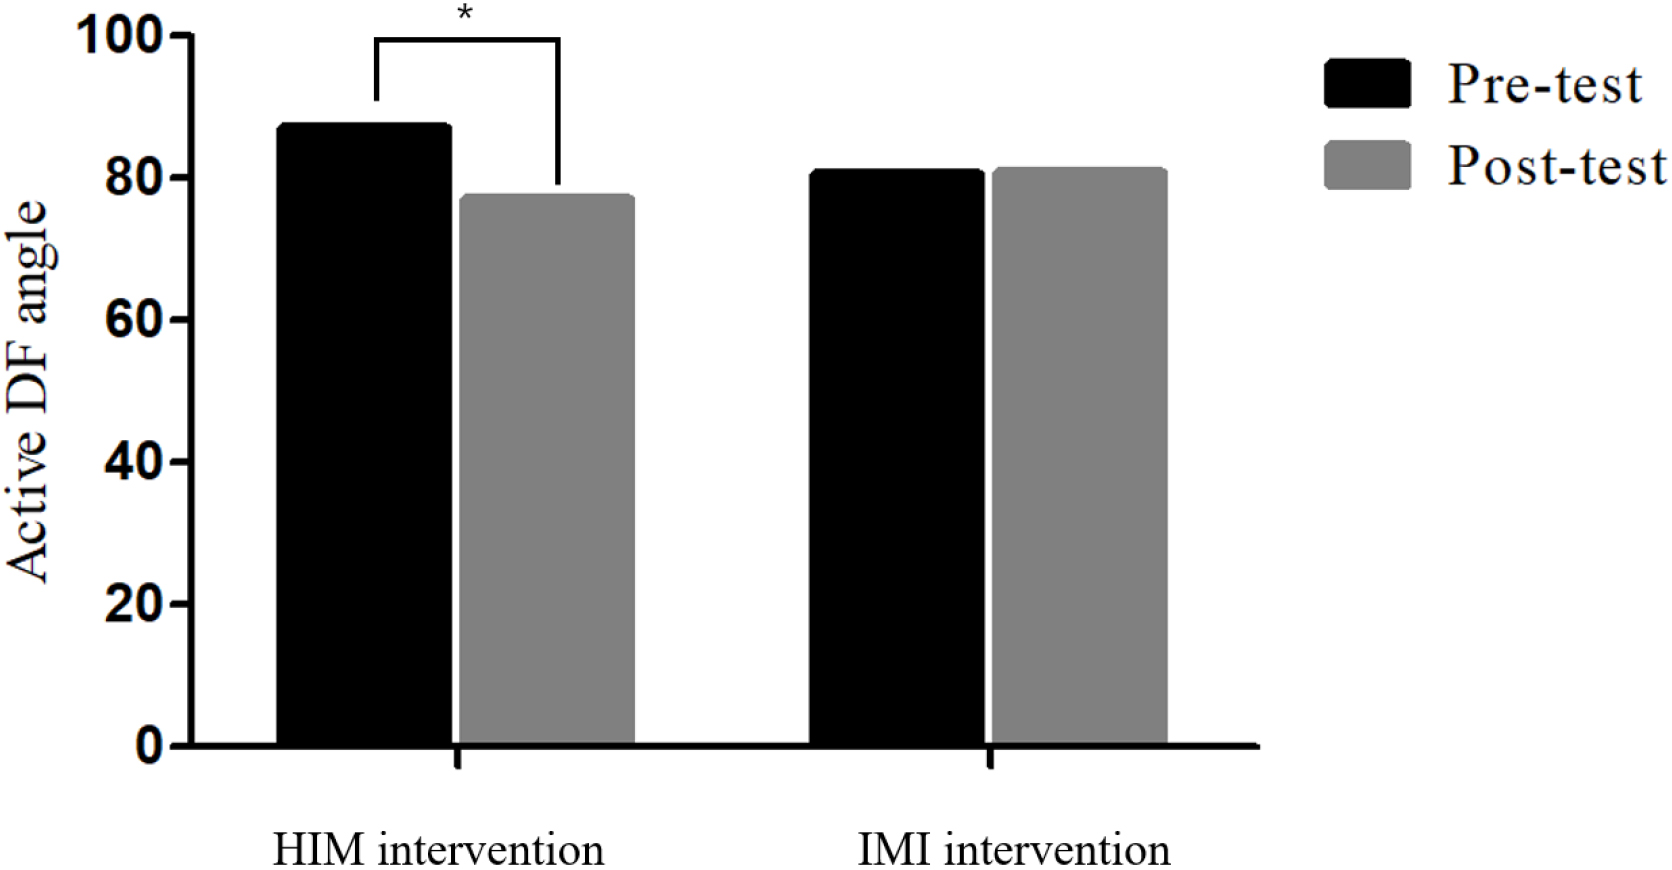
Figure 6.
Active ankle DF mobility data between HIM and IMI groups. Two-way ANOVA was performed at
3.2EMG Muscle activation
Two-way mixed ANOVA showed no significant time
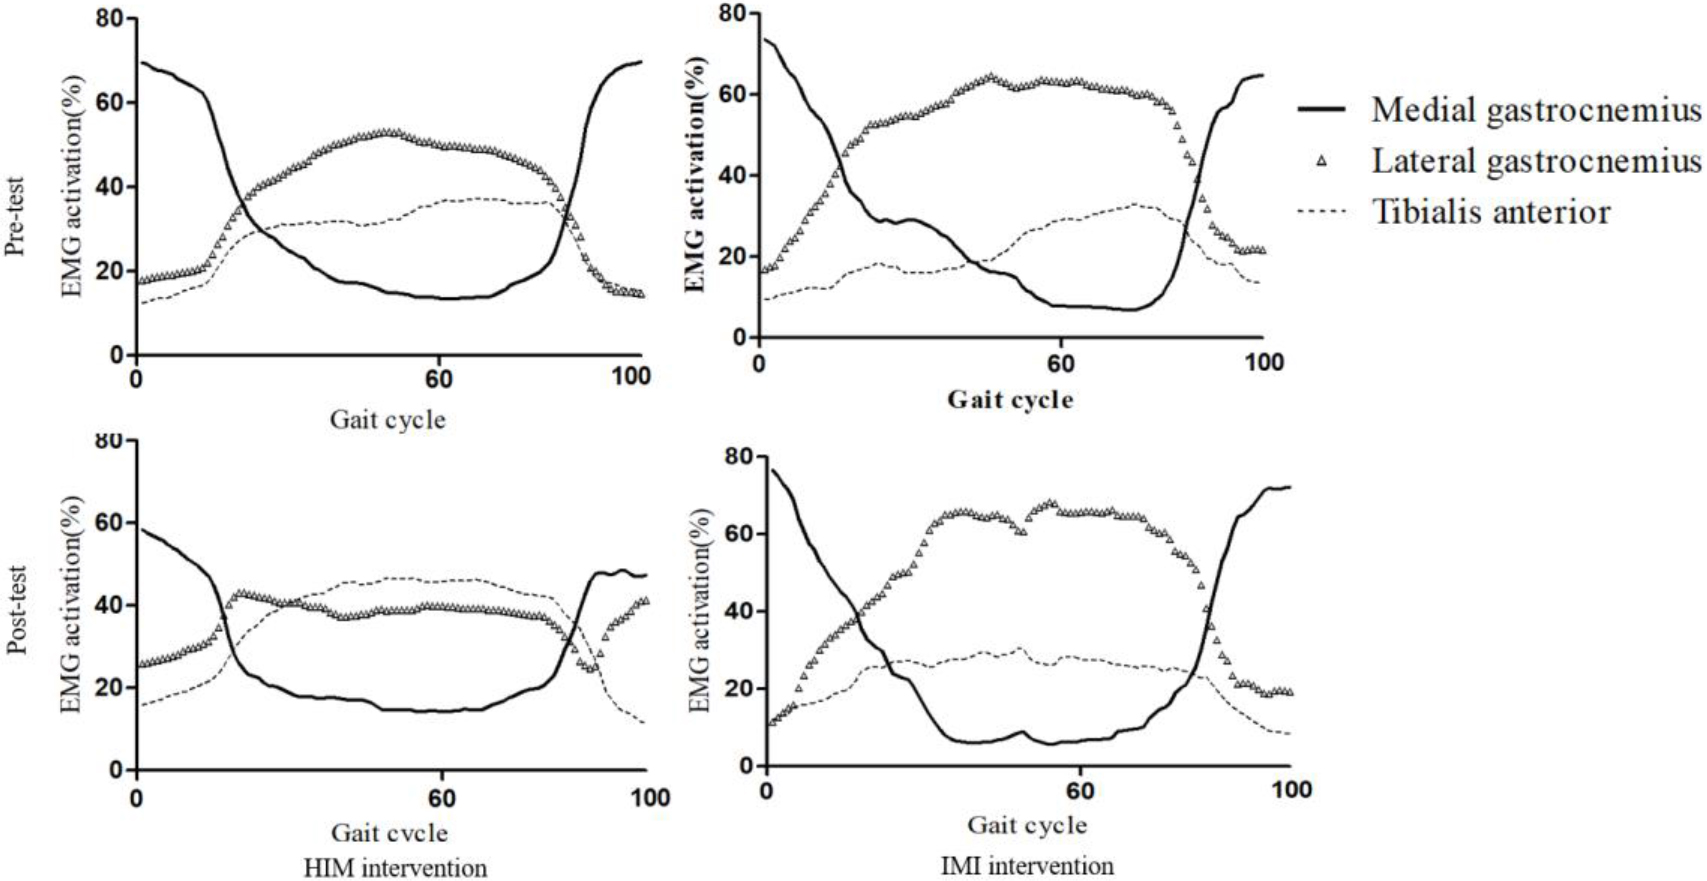
Figure 7.
Pre- and Post-test EMG amplitude data. Two-way ANOVA was performed at
3.3Plantar pressure
The two-way mixed ANOVA showed significant differences in the time
Table 3
Post-intervention foot pressure outcome analysis, Mean
| HIM group | IMI group | |||||||
|---|---|---|---|---|---|---|---|---|
| Pre-test | Post-test | Pre-test | Post-test | Time effect | Between groups | Time x group | Effect size | |
| Forefoot:hindfoot ratio | 20.43 | 18.78 | 18.19 | 21.91 | 0.057 | 0.752 | 0.000** | 2.925 |
| Hindfoot/area (N/cm2) | 16.67 | 16.67 | 22.96 | 19.97 | 0.144 | 0.006* | 0.144 | 5.156 |
| Forefoot/area(N/cm2) | 1.24 | 0.92 | 1.18 | 1.14 | 0.286 | 0.128 | 0.048* | 0.634 |
Abbreviations: SD, standard deviation; TA, tibialis anterior; GCM, gastrocnemius; HIM, homologous (paired tibialis anterior gastrocnemius); IMI, isolated target gastrocnemius. *
3.4Post-intervention questionnaire
Q2, Q3, and Q4 showed significant differences between the groups (
Table 4
Post-intervention questionnaire analysis
| Q1 | Q2 | Q3 | Q4 |
| 0.463 | 0.00∗∗ | 0.039∗ | 0.00∗∗ |
*p< 0.05, **p< 0.000.
4.Discussion
The present study aimed to highlight the differential effects of IMI and HIM on the ankle DF angle and EMG amplitude of the GCM and TA during gait in individuals with ADS. As anticipated, the HIM group showed greater improvements in ankle DF mobility and muscle activation amplitudes than the IMI group. Most importantly, ankle DF mobility was more substantially enhanced in the group that received HIM than in the group that received IMI, supporting the important neuromechanisms including the length-tension relationship of the GCM-Achilles tendon structure, the reciprocal facilitation of GCM, and autogenic inhibition of the TA mechanism [22]. It is difficult to compare our present data with previous findings because of the limited evidence in the current literature.
Ankle joint angle analysis demonstrated a more improved active DF angle in the group that received HIM than in the group that received IMI, but the passive ankle DF that remained between the groups was not significant. Our findings are similar to those of earlier studies that examined the effect of IM on ankle DF in ADS. Lee and his colleagues reported an increase of 6.5% in active or passive DF after the application of IMI by Dr. YouSTM [11]. Lee and his colleagues also reported an 18.9% increase in active DF after GCM stretching and TA strengthening exercises; however, passive DF mobility did not differ [9]. The active and passive DF mobilities improved by 11.26% and 3.58%, respectively. Such enhanced passive DF movement may be related to the normalized length-tension relationship via muscle structural remodeling, which would normalize the overextended TA and shortening or tightness of the GCM muscle.
EMG analysis showed decreased mean and peak TA activation amplitudes in the HIM group (9.1% and 9%, respectively) compared with the IMI group (11.48% and 1.48%, respectively). The peak lateral GCM activation amplitudes were higher in the HIM group (8.6%) than in the IMI group (4.5%). The present findings were compatible with previous EMG evidence showing 23.8% increased TA MVIC (%) EMG activation as a result of five trials
Plantar pressure distribution analysis revealed meaningful changes in the forefoot/area (N/cm2) in the group that received HIM (
Post-intervention questionnaire analysis showed that 46.2% of the participants in the HIM group reported increased ankle mobility compared with those in the IMI group (10%). Participants in the HIM group reported being more satisfied than those in the IMI group, relieving GCM tightness by 10.3%. In addition, the natural movement of the foot (hindfoot to forefoot) query was higher in the HIM group than in the IMI group (37.9%). The positive plantar pressure distribution changes from the forefoot to the hindfoot were perceived by 83% and 33.3% of the participants in the HIM and IMI groups, respectively. Possibly IM may have released GCM tightness and enhanced TA contraction increasing ankle DF mobility contributed to the normalized transfer of plantar pressure from the hindfoot to the forefoot during dynamic gait conditions.
This study had several limitations. One limitation is that our preliminary cross-sectional study could not determine the long-term effects of selective muscle release and facilitation techniques. The second limitation is that while we observed that the data sets didn’t differ from normal distribution and effect size was relatively high for angle, EMG activation, and pressure, our results should be interpreted carefully due to sample size. Another limitation is that the present study inclusively examined asymptomatic participants with limited ankle DF; hence, a careful interpretation should be made when applying our empirical evidence to musculoskeletal (e.g., lateral ankle sprain and plantar fasciitis) and neurological conditions (e.g., ITW, PD, stroke, and spastic diplegia). Additional studies are necessary to determine the mechanisms responsible for the decrease in muscular performance following stretching [9].
5.Conclusion
Our study demonstrated that HIM was more effective than IMI in improving ankle mobility, lowering muscle activation, and plantar pressure distribution in individuals with ADS. These results provide evidence-based clinical insights into the utilization of HIM intervention in ADS rehabilitation to maximize the recovery of ankle mobility, muscle activation, and plantar pressure in individuals with ADS.
Acknowledgments
This study was supported by the Brain Korea 21 PLUS Project Grant (No. 2021-51-0151), a National Research Foundation of Korea (NRF) grant funded by the Korean government (MSIT) (No. RS-2023-00221762), ‘Regional Innovation Strategy (RIS)’ through the National Research Foundation of Korea (NRF) funded by the Ministry of Education (MOE) (2022RIS-005), and the Institute for Project-Y Seed Grant of 2023 (No. 2023-22-0277).
Conflict of interest
None to report.
References
[1] | Adillón C, Gallegos M, Treviño S, Salvat I. Ankle joint dorsiflexion reference values in non-injured youth federated basketball players: a cross-sectional study. Int J Environ Res Public Health. (2022) ; 19: (18: ): 11740. doi: 10.3390/ijerph191811740.. |
[2] | Grieve R, Byrne B, Clements C, Davies LJ, Durrant E, Kitchen O. The effects of foam rolling on ankle dorsiflexion range of motion in healthy adults: A systematic literature review. J Bodywork Mov Ther. (2022) ; 30: : 5359. |
[3] | Farrag A, Elsayed W. Habitual Use of High-Heeled Shoes Affects Isokinetic Soleus Strength More Than Gastrocnemius in Healthy Young Females. Foot Ankle Int. (2016) ; 37: (9): 1008-16. doi: 10.1177/1071100716649172. Epub 2016 May 9. PMID: 27162223. |
[4] | Yoon JY, Hwang YI, An DH, Oh JS. Changes in kinetic, kinematic, and temporal parameters of walking in people with limited ankle dorsiflexion: pre-post application of modified mobilization with movement using talus glide taping. J Manip Physiol Ther. (2014) ; 37: (5): 320-325. |
[5] | Kwon Y, Shin G. Foot kinematics and leg muscle activation patterns are altered in those with limited ankle dorsiflexion range of motion during incline walking. Gait Posture. (2022) ; 92: : 315-320. |
[6] | Kadel NJ, Segal A, Orendurff M, Shofer J, Sangeorzan B. The efficacy of two methods of ankle immobilization in reducing gastrocnemius, soleus, and peroneal muscle activity during stance phase of gait. Foot Ankle Int. (2004) ; 25: (6): 406-409. |
[7] | Aronow MS, Diaz-Doran V, Sullivan RJ, Adams DJ. The effect of triceps surae contracture force on plantar foot pressure distribution. Foot Ankle Int. (2006) ; 27: (1): 43-52. |
[8] | Bush HM, Stanek JM, Wooldridge JD, Stephens SL, Barrack JS. Comparison of the Graston technique with instrument-assisted soft tissue mobilization for increasing dorsiflexion range of motion. J Sport Rehab. (2020) ; 30: (4): 587-594. |
[9] | Lee J, Cynn H, Shin A, Kim B. Combined effects of gastrocnemius stretch and tibialis anterior resistance exercise in subjects with limited ankle dorsiflexion. Phys Ther Rehabil Sci. (2021) ; 10: (1): 10-15. |
[10] | Lee JJ, Lee JJ, Kim DH, You SJH. Inhibitory effects of instrument-assisted neuromobilization on hyperactive gastrocnemius in a hemiparetic stroke patient. Biomed Mater Eng. (2014) ; 24: (6); 2389-2394. |
[11] | Lee J, Park C, Cha Y, You JSH. Comparative effects of different manual techniques on electromyography activity, kinematics, and muscle force in limited ankle dorsiflexion syndrome. J Back Musculoskelet Rehabil. (2021) ; 34: (6): 1105-1112. |
[12] | Rowlett CA, Hanney WJ, Pabian PS, McArthur JH, Rothschild CE, Kolber MJ. Efficacy of instrument-assisted soft tissue mobilization in comparison to gastrocnemius-soleus stretching for dorsiflexion range of motion: A randomized controlled trial. J Bodyw Mov Ther. (2019) ; 23: (2): 233-240. |
[13] | Johanson MA, Cuda BJ, Koontz JE, Stell JC, Abelew TA. Effect of stretching on ankle and knee angles and gastrocnemius activity during the stance phase of gait. J Sport Rehabil. (2009) ; 18: (4): 521–534. doi: 10.1123/jsr.18.4.521. |
[14] | Park JH, Rhyu HS, Rhi SY. The effects of instrument-assisted soft tissue mobilization rehabilitation exercise on range of motion, isokinetic strength, and balance in chronic ankle instability taekwondo players. J Exerc Rehabil. (2020) ; 16: (6): 516-521. doi: 10.12965/jer.2040752.376. PMID: 33457388. |
[15] | Purves D, Augustine GJ, Fitzpatrick D, et al., editors. Neuroscience. 2nd edition. Sunderland (MA): Sinauer Associates; 2001. Mechanoreceptors Specialized to Receive Tactile Information. Available from: https//www.ncbi.nlm.nih.gov/books/NBK10895/. |
[16] | Balle SS, Magnusson SP, McHugh MP. Effects of contract- 510 relax vs static stretching on stretch-induced strength loss and 511 length-tension relationship. Scand J Med Sci Sports. (2015) ; 25: (6): 764-769. |
[17] | You JY, Lee HM, Luo HJ, Leu CC, Cheng PG, Wu SK. Gastrocnemius tightness on joint angle and work of lower extremity during gait. Clin Biomech. (2009) ; 24: (9): 744-750. |
[18] | Johanson MA, Cooksey A, Hillier C, Kobbeman H, Stambaugh A. Heel lifts and the stance phase of gait in subjects with limited ankle dorsiflexion. J Athl Train. (2006) ; 41: (2): 159. |
[19] | Jeon IC, Kwon OY, Yi CH, Cynn HS, Hwang UJ. Ankle-dorsiflexion range of motion after ankle self-stretching using a strap. J Athl Train. (2015) ; 50: (12): 1226-1232. |
[20] | Lee JJ, You JH. Movement measurement validity and reliability of the Image J Program for kinematic analysis. J Mech Med Biol. (2016) ; 16: (8): 1640028. |
[21] | Hermens HJ, Freriks B, Disselhorst-Klug C, Rau G. Development of recommendations for SEMG sensors and sensor placement procedures. Journal of electromyography and Kinesiology. (2000) ; 10: (5); 361-374. |
[22] | Bell J, Bell C. The anatomy and physiology of the human body. Collins & Company. (1827) ; 1. |
[23] | Selby-Silverstein L, Farrett WD, Jr., Maurer BT, Hillstrom HJ. Gait analysis and bivalved serial casting of an athlete with shortened gastrocnemius muscles: a single case design. J Orthop Sports Phys Ther. (1997) ; 25: (4): 282-288. |


