
Differences of protein expression in enterococcus faecalis biofilm during resistance to environmental pressures
Abstract
BACKGROUND:
Enterococcus faecalis biofilm was frequently found on the failed treated root canal wall, which survived by resisting disinfectant during endodontic treatment.Many researches have been conducted to explore the mechanisms of persistence of this pathogen in unfavorable conditions. However, no comprehensive proteomics studies have been conducted to investigate stress response in Enterococcus faecalis caused by alkali and NaOCl.
OBJECTIVE:
Enterococcus faecalis (E.f) has been recognized as a main pathogen of refractory apical periodontitis, its ability to withstand environmental pressure is the key to grow in the environment of high alkaline and anti-bacterial drug that causes chronic infection in the root canal. This study aims to focus on the protein expression patterns of E.f biofilm under extreme pressure environment”.
METHODS:
Enterococcus faecalis biofilm model was established in vitro. Liquid Chromatograph-Mass Spectrometer (LC-MS/MS)-based label free quantitative proteomics approach was applied to compare differential protein expression under different environmental pressures (pH 10 and 5% sodium hypochlorite (NaOCl)). And then qPCR and Parallel Reaction Monitoring Verification (PRM) were utilized to verify the consequence of proteomics.
RESULTS:
The number of taxa in this study was higher than those in previous studies, demonstrating the presence of a remarkable number of proteins in the groups of high alkaline and NaOCl. Proteins involved in ATP-binding cassette (ABC) transporter were significantly enriched in experimental samples. We identified a total of 15 highly expressed ABC transporters in the high alkaline environment pressure group, with 7 proteins greater than 1.5 times.
CONCLUSIONS:
This study revealed considerable changes in expression of proteins in E.f biofilm during resistance to environmental pressures. The findings enriched our understanding of association between the differential expression proteins and environmental pressures.
1.Introduction
Enterococcus are recognized common bacteria that causes infections in various body parts such as urinary tract, intra-abdomen and pelvic regions, surgical sites and oral cavity [1]. Enterococcus faecalis is one of the most usual species that can be detected in the root canals of teeth where root canal treatment failed [2]. It is an important microorganism for root canal persistent infection and reinfection. In previously treated cases, the prevalence of Enterococcus faecalis ranged from 45.8% to 79.5% [3, 4, 5].
About 80% microbial infections were based on the format of biofilm. Biofilm was resistant to antibiotics and disinfectant which may depend on its property of physical barrier [6]. Enterococcus faecalis biofilm was frequently found on the failed treated root canal wall, which survived by resisting disinfectant during endodontic treatment [7]. Calcium hydroxide (Ca (OH)2) and sodium hypochlorite (NaOCl) are common disinfection medications during root canal treatment. Calcium hydroxide (Ca(OH)2) is the most frequently used intracanal medication due to its strong alkaline property. The destruction of phospholipids, structural components of the cellular membrane, can be caused by the induction of lipid peroxidation by hydroxide ions. Genes are destroyed when hydroxide ions react with bacterial DNA and cause the denaturation of the strands [8]. Sodium hypochlorite (NaOCl) is the most widely used irrigation fluid, usually up to 5% concentration, during endodontic treatment because of its effective antimicrobial and tissue-dissolving properties [9]. NaOCl of 5.25% could kill Enterococcus faecalis in planktonic state effectively, but Enterococcus faecalis biofilm could still grow when concentration of NaOCl was low, such as 1%, even during the alkaline dressing [10].
Many researches have been conducted to explore the mechanisms of persistence of this pathogen in unfavorable conditions. Although some of the previous genetic screening studies have suggested the gene regulation responsible for the adaption process of these bacteria to alkaline stress conditions [11, 12], the actual expression of functional proteins is unclear. Moreover, previous proteomics studies on Enterococcus faecalis have been mainly focused on the differential protein expression patterns in planktonic Enterococcus faecalis cells exposed to antibiotics or to some stressful conditions [13, 14, 15, 16, 17].
However, no comprehensive proteomics studies have been conducted to investigate stress response in Enterococcus faecalis caused by alkali and NaOCl. In the current study, we examine the protein expression profiles of Enterococcus faecalis biofilms in these stresses by employing a tandem-mass-tag(TMT)-based quantitative proteomics analysis, which may ultimately contribute to exploring the possible mechanisms governing biofilm formation of Enterococcus faecalis under extreme pressure environment and obtaining the evidence on development of strategies for the prevention of Enterococcus faecalis infections and improve root canal treatment strategies.
2.Materials and method
2.1Bacterial strains and growth conditions
Enterococcus faecalis standard strain ATCC33186 was inoculated into tryptic soy broth (TSB) containing 1.7% tryptone, 0.3% polypeptone, 0.1% yeast extract (Sangon, Shanghai, China), 0.5% NaCl, 0.25% glucose, and 0.25% dipotassium phosphate at 37∘C overnight. We identified the biofilm after the bacterial strain inoculated from standard bacterial and we are sure the bacterial colony was not contaminated by other species of bacterial or microorganisms.
The bacterial biofilms were performed in three environments including 5% NaOCl, pH 10 and normal condition and labeled as NaOCl group, ALK group and N group, with three samples in each group.
2.2Samples preparation and extraction
After the pellets of Enterococcus faecalis biofilm proteins were extracted, all protein samples were taken about 20
2.3Protein digestion and TMT 10-plex labeling
Protein digestion was performed according to the FASP procedure, as previously [18]. After protein digestion with Trypsin in FASP method, TMT labeling was performed according to the manufacturer’s instructions (Thermo Scientific).
Peptide Fractionation with High-pH reversed-phase chromatography separation.
The TMT-labelled peptides were subjected to High-pH Reversed-Phase Fractionation in 1100 Series HPLC Value System (Agilent) equipped with a Gemini-NX (Phenomenex, 00F-4453-E0) column (4.6
2.4LC-MS/MS analysis
The TMT-labeled samples were analyzed using Easy-nLC nanoflow HPLC system connected to Orbitrap Fusion mass spectrometer (Thermo Fisher Scientific, San Jose, CA, USA), The sequential separation of peptides on Thermo Scientific EASY trap column (100
2.5Protein identification and quantitation
The raw files were analyzed using the Proteome Discoverer 2.4 software (Thermo Fisher Scientific). Search for the fragmentation spectra was performed using the MASCOT search engine embedded in Proteome Discoverer against Enterococcus faecalis protein sequence file (uniprot_E_Faecalis_166900_20200 814.fasta, downloaded at 2020/08/14, included 166,900 sequences).
2.6Bioinformatics analysis
2.6.1Selection of significantly differential expressed protein
Student
2.6.2COG functional analysis
All identified protein sequences were searched against the database of Clusters of Orthologous Groups of proteins (COGs) including 1,781,653 sequences via a standalone blast (version: 2.10.1+) with expect value 1e-8.
2.6.3InterPro annotation and gene ontology functional analysis
InterProscan software (version: 5.45-80.0, http://www.ebi.ac.uk/Tools/pfa/iprscan/) with default parameters was used to perform protein sequences searches against InterPro member database for signature identification.
2.6.4Pathway analysis
The protein sequences were submitted to KOBAS (version 3.0) with expect value:1e-8, database: efa (Enterococcus faecalis V583), and method: hypergeometric test. The experimental workflow for TMT labeling and analysis was illustrated in Fig. 1.
Figure 1.
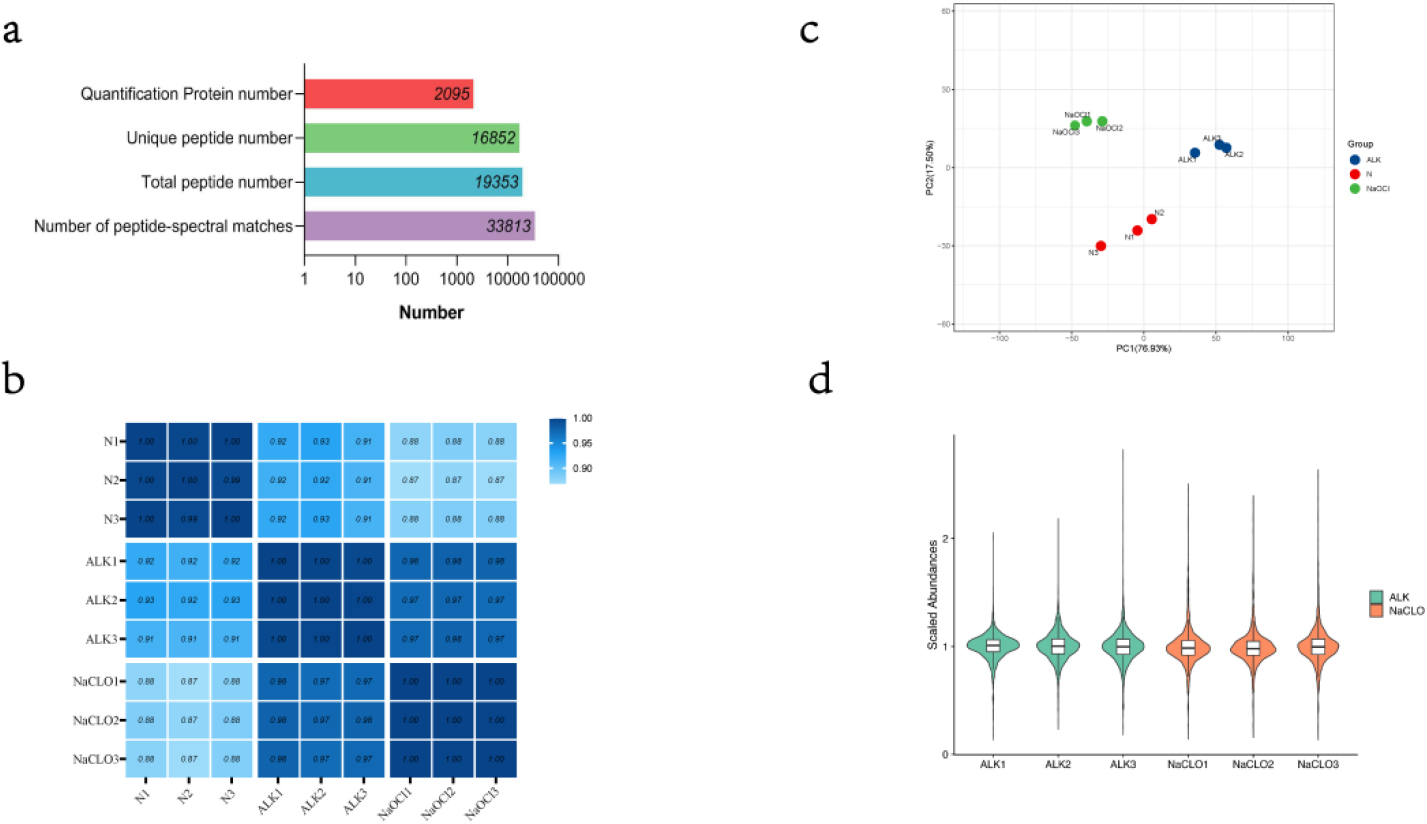
(a) Summary of mass information. (b) A heatmap of Pearson correlation coefficient. (c) A scatter graph of PC1 and PC2 through principal component analysis. (d) A violin plot of abundances with median normalization. This plot shows the kernel density estimation for distribution of scale abundance of protein and can be superimposed on a box plot. Using the same filling colors indicate technical replicated sample.
2.6.5RNA Extraction and Real-time PCR
Total RNA was extracted from 48 h Enterococcus faecalis biofilms using Qiagen RNeasy Protect Bacteria Mini Kit, (Magen, Guangzhou, China), according to the manufacturer’s instructions, and stored at
3.Result
3.1TMT-based Quantitative Analysis of the Proteome of Enterococcus faecalis Biofilm
After LC-MS/MS and searching database with Mascot, we identified a total of 19,353 peptides (included 16,852 unique peptides), corresponding to 33,813 peptide-spectral matches in an assembly of 2,095 protein groups with a protein-level FDR (false discovery rate)
We used original abundances of identified proteins to calculate the Pearson correlation coefficient among samples and visualized by a heatmap (Fig. 1b). The results showed that there was a very high correlation between the samples. Especially, the correlations between samples belonging to the same technical repeat group were close to 1. In addition, the scatter graph of the first principal component and second principal component through principal component analysis (PCA) also showed that repeatability of the technical replicated group was satisfactory (Fig. 1c).
For the following differentially expressed protein screening, protein quantitative abundances were normalized with median normalization, and visualized by a violin plot (Fig. 1d).
3.2Identification of significantly differentially expressed proteins
Differential expressed analyses of the proteome were respectively performed by comparing ALK with N, comparing NaOCl with ALK, and comparing NaOCl with N. Differentially Expressed Proteins (DEPs) were determined by
In total, 80, 71, and 122 up-regulated proteins were determined by thresholds cutoff
3.3COG functional analyzes
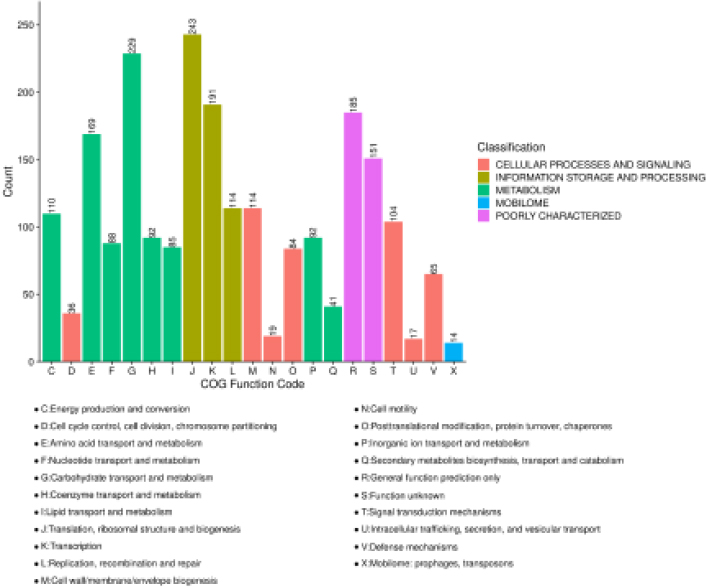
A total of 1,919 (91.6%) proteins were annotated to COG protein sequence databases via blastp with expect value 1e-8. These proteins were assigned to at least one COG functional categories. Five top COG categories that included 21 sub COG categories were mapped and counted (Fig. 3a). As Fig. 3a showed
Table 1
The common DEPs screened from comparisons ALK versus N, NaOCl versus ALK, and NaOCl versus N
| Accession # | Gene Names | Description | Biological | ALK vs. N | NaOCl vs. ALK | NaOCl vs. N | |||
|---|---|---|---|---|---|---|---|---|---|
| process | Log2FC | Log2 FC | Log2 FC | ||||||
| A0A2Z6BJM6 | KUB3007_C13910 | 2-dehydropantoate 2-reductase | Pantothenate biosynthetic process | 6.87E-05 | 2.15E-04 | 2.53E-05 | |||
| E2YC69 | HMPREF9493_01162 | ATP synthase, subunit F | Ion transmembrane transport | 1.14 | 4.32E-04 | 0.81 | 9.06E-04 | 1.94 | 9.34E-05 |
| A0A449EHT9 | FKY84_00230 | ATPase V | 1.06 | 2.75E-05 | 0.78 | 2.82E-05 | 1.84 | 1.52E-06 | |
| A0A1Q1FTT7 | BZG32_07375 | ATPase V | 0.93 | 8.95E-04 | 1.08 | 5.47E-05 | 2.01 | 4.60E-06 | |
| R3KY17 | WOU_01483 | Branched-chain alpha-keto acid dehydrogenase, E1 component, beta subunit | 2.54E-05 | 6.07E-05 | 6.87E-06 | ||||
| S4FRR3 | D351_01409 | Cysteine-rich domain protein | 2.88E-05 | 1.18E-04 | 7.80E-06 | ||||
| A0A4V0DCK7 | pdhC_2 | Dihydrolipoamide acetyltransferase component of pyruvate dehydrogenase complex | 7.96E-07 | 4.32E-05 | 1.37E-07 | ||||
| A0A4V0CW09 | Esp | Enterococcal surface protein | 2.03E-06 | 4.57E-03 | 3.94E-08 | ||||
| E2YDL9 | HMPREF9493_01664 | Fructosamine deglycase | Carbohydrate derivative metabolic process; carbohydrate metabolic process | 1.02E-04 | 4.25E-05 | 1.35E-05 | |||
| A0A0M2ARI4 | WO5_01154 | Iron-sulfur cluster-binding protein | Lactate oxidation | 5.00E-05 | 1.20E-02 | 1.04E-07 | |||
1: Biological process annotation of Gene ontology from UNIPROTKB.
243 proteins was maximumly found in “Translation, ribosomal structure and biogenesis”. Enriched analyzes of COG categories of DEPs were performed with Fisher’s exact test using all identified proteins as a background, and calculated
Figure 2.
(a)Volcano plots of differentially expressed proteins reveal significance patterns. Threshold cutoffs determined for log2 fold change ratios are represented by vertical solid lines, and
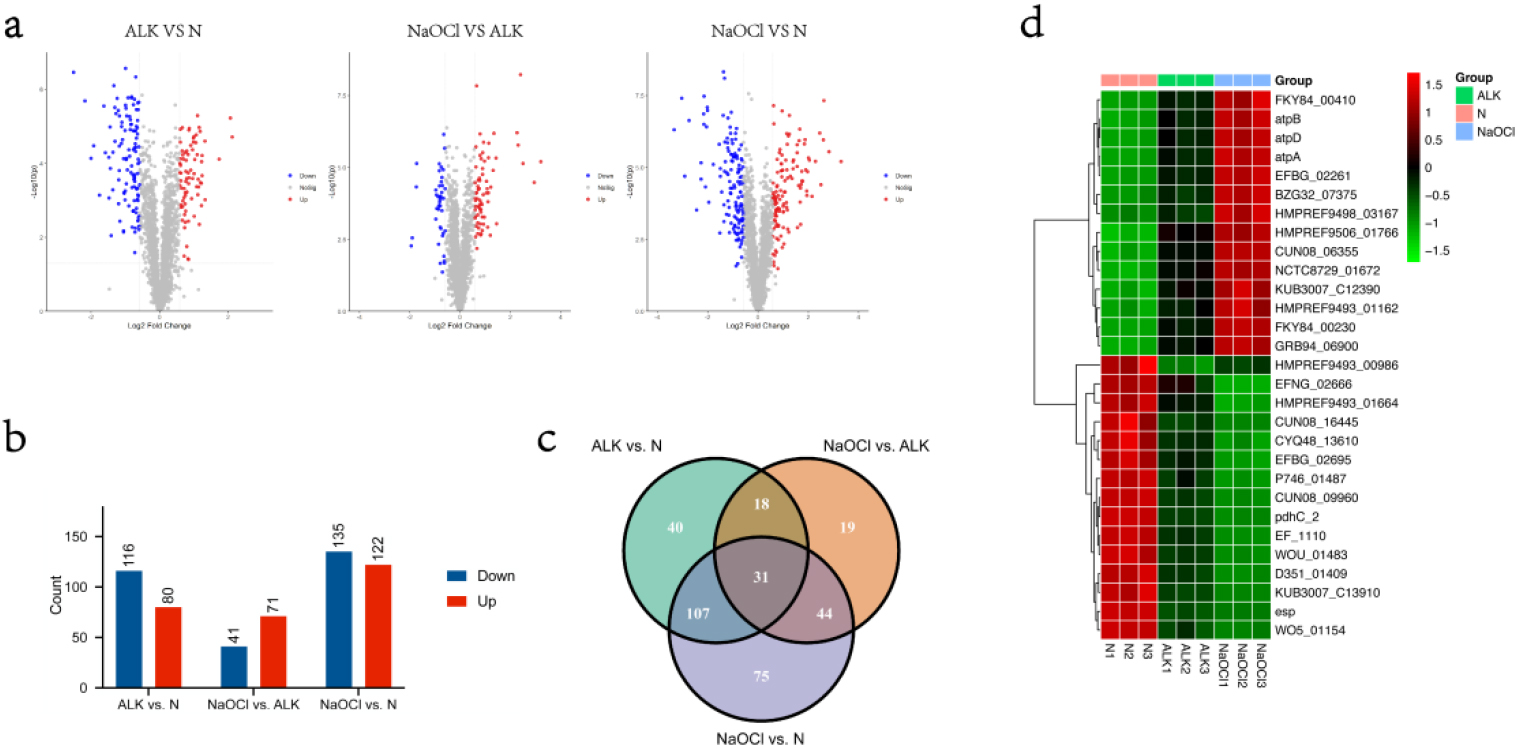
Figure 3.
Functional analyzes of DEPs: Bar plot of COG functional classification. The same top categories are filled by the same color. The letter as a COG function code represents the COG functional categories. The counts of protein in categories are indicated on the bar.
3.4Pathway enrichment analyzes of significantly differentially expressed proteins
For obtaining summary of Kyoto Encyclopedia of Genes and Genome (KEGG) pathways, all identified protein sequences were submitted to BlastKOALA (https://www.kegg.jp/blastkoala/) that was KEGG’s internal annotation tool for K number assignment of KEGG GENES using BLAST searches. In total, 1444 (68.9%) sequences were annotated. In these, 226, 220, 197 protein entries were found in “Protein families: genetic information process”, “Carbohydrate metabolism”, and “Genetic Information processing” as the top 3 categories.
KOBAS (version:3.0) were performed to search efa (Enterococcus faecalis V583) protein sequences database for assignment of KEGG gene identifiers to DEPs and all identified proteins. A total of 1,985 (94.7%) identified proteins was successfully mapped to gene identifiers of Enterococcus faecalis V583, while 184 (93.8%) DEPs of ALK versus N, 105 (93.8%) DEPs of NaOCl versus ALK, 244(94.9%) DEPs of NaOCl versus N were succeeded in KOBAS searches.
3.5Correlation of TMT data with quantitative real-time PCR (qPCR) and PRM results
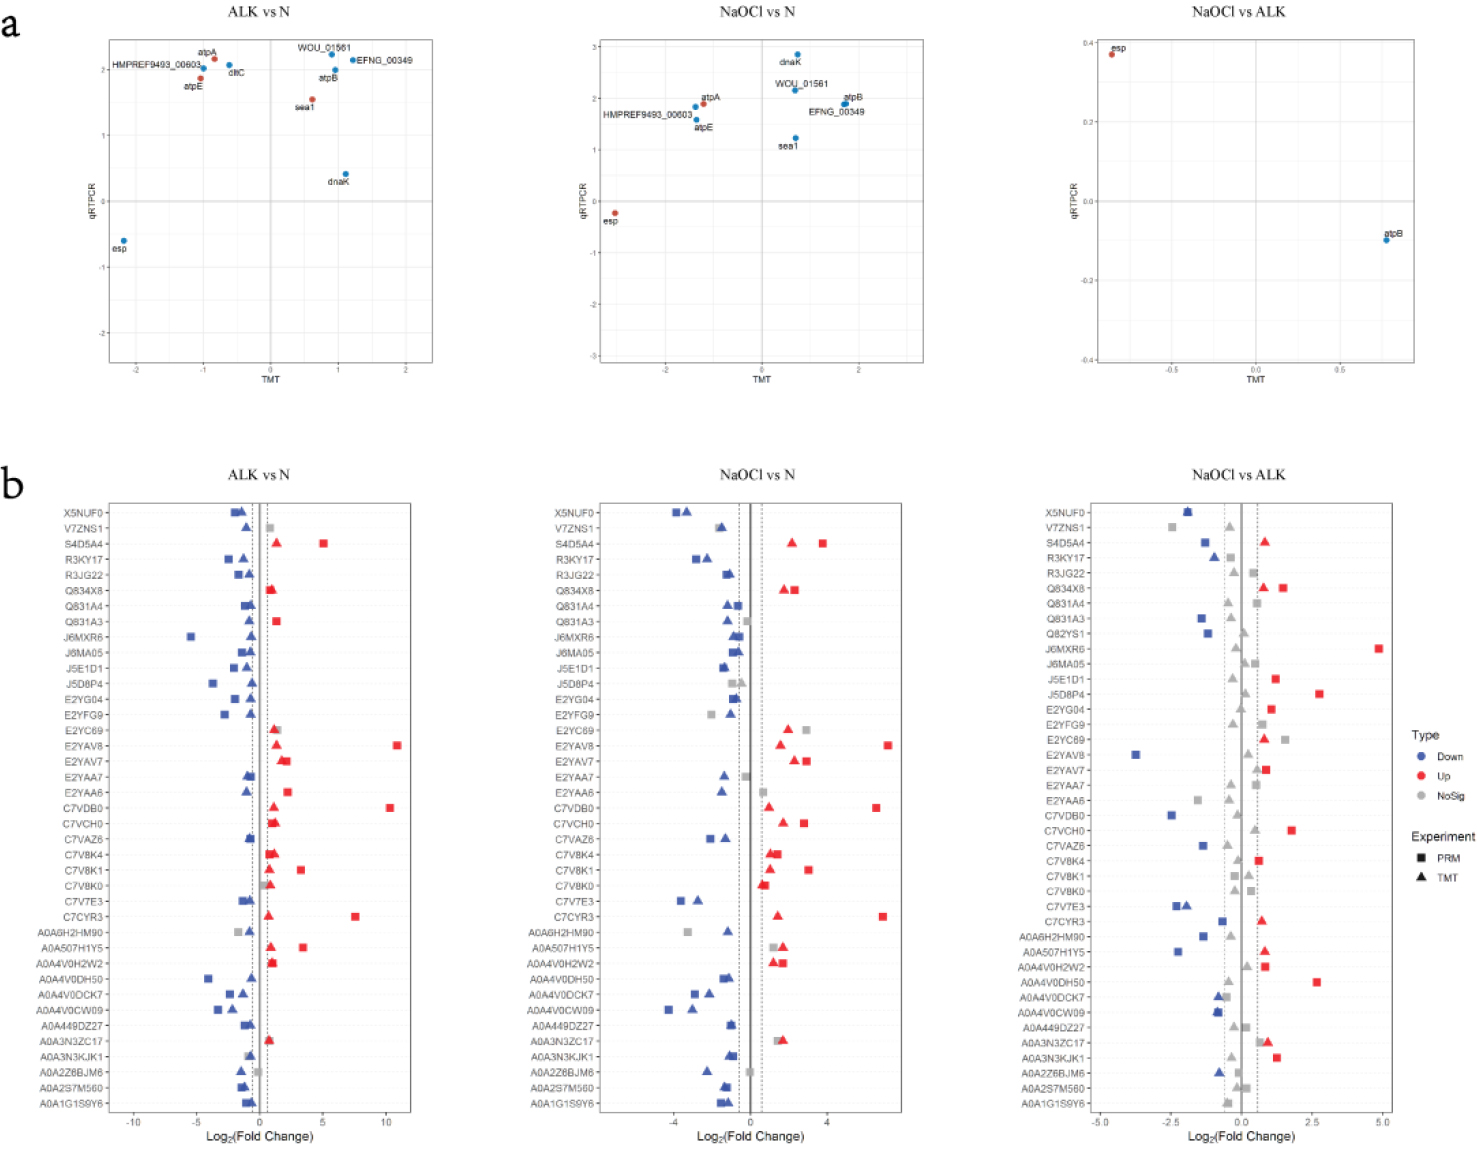
The results of qPCR analysis were checked for the correlation with TMT data (Fig. 4a). About half of the genes expression in ALK vs N and NaOCl vs N had the positive correlation between qPCR data and TMT results.
A total of 39 peptides that were significantly up-regulated or down-regulated and involved important pathways were selected and verified by PRM (Table 2). And the results of PRM analysis were checked for the correlation with TMT data (Fig. 4b). The majority of the proteins in ALK vs N and NaOCl vs N had the positive correlation between PRM data and TMT results.
Table 2
The list of DEPs verified by PRM
| Accession | Description | GeneName |
|---|---|---|
| A0A2S7M560 | ATP synthase subunit b | atpF |
| J5E1D1 | ATP synthase subunit c | atpE |
| C7VAZ6 | ATP synthase subunit a | atpB |
| Q831A3 | ATP synthase subunit alpha | atpA |
| Q831A4 | ATP synthase gamma chain | atpG |
| A0A4V0DH50 | ATP synthase subunit beta | atpD |
| A0A3N3KJK1 | ATP synthase epsilon chain | atpC |
| E2YC69 | ATP synthase, subunit F | HMPREF9493_01162 |
| A0A3N3ZC17 | V-type ATP synthase beta chain | atpB |
| Q834X8 | V-type ATP synthase beta chain | atpB |
| S4D5A4 | V-type ATP synthase beta chain | atpB |
| E2YAA6 | ABC transporter, permease protein | HMPREF9493_00602 |
| E2YAA7 | ABC transporter, permease protein | HMPREF9493_00603 |
| R3JG22 | His/Glu/Gln/Arg/opine family amino ABC transporter, permease, 3-TM region | WOK_00999 |
| E2YFG9 | ABC transporter, ATP-binding protein | HMPREF9493_02321 |
| J6MXR6 | Putative glutamine ABC transporter permease protein GlnP | HMPREF1332_03123 |
| E2YAV8 | ABC transporter, ATP-binding protein | HMPREF9493_00680 |
| E2YAV7 | Efflux ABC transporter, permease protein | HMPREF9493_00679 |
| A0A1G1S9Y6 | PTS mannose transporter subunit IID | BHU49_07340 |
| A0A449DZ27 | PTS system mannose/fructose/N-acetylgalactosamine-transporter subunit IIB | FKY84_01780 |
Figure 4.
Correlation of TMT Data with Quantitative Real-time PCR (qPCR) and PRM: (a) Correlation of qPCR and TMT. Log 2 (fold change) is used to draw the scatter plot, and only the significant proteins in the TMT experiment are selected. The blue dot is qPCR
4.Discussion
Many studies had detected the existence of Enterococcus faecalis biofilm in root canals that had failed to be treated [7], and in vitro studies had confirmed that Enterococcus faecalis could survive in the commonly used root canal disinfection drugs such as calcium hydroxide and sodium hypochlorite [10, 11], but the mechanism is still unclear. We studied the changes in protein expression of Enterococcus faecalis biofilm in alkaline and sodium hypochlorite environments by means of TMT-based quantitative analysis. The results showed that compared with the alkaline environment, Enterococcus faecalis had a greater number of proteins that have changed expression in sodium hypochlorite media, and the degree of change was greater.
For pathogens, many secreted proteins are toxins, adhesins, and enzymes that determine virulence, which may mediate interactions between the pathogen and the host. In this study, for the first time, we used the method of metaproteomics to compare the bacterial secreted proteins of Enterococcus faecalis biofilms under different pressure environments. A total of 2850 differentially expressed proteins were obtained, of which 580 had statistical differences. Further bioinformatics analysis revealed that proteins with expression differences of more than 1.5 times were mainly concentrated in ABC transporters, glycolysis/gluconeogenesis, pyruvate metabolism, citric acid cycle, and other aspects.
The ABC transporter superfamily is a group of transmembrane proteins widely present in eukaryotes, prokaryotes, and archaea [20, 21]. In the K-12 genome of Escherichia coli, approximately 5% of the genome encodes ABC transporters, which constitute one of the largest known gene families in humans [22].
The core structure of a typical ABC transporter generally includes four domains and two highly hydrophobic transmembrane junctions.
The transmembrane domain (TMD) and two hydrophilic nucleotide binding domains (NBD) embedded in the cell membrane but protruding from the cytoplasm that catalyze ATP hydrolysis. ABC transporters typically utilize the energy of hydrolyzing ATP to transport various substances across membranes, including ions, sugars, amino acids, metal ions, vitamins, peptides, hormones, cellular metabolites, and drugs. Through material transport, ABC transporters participate in various cellular processes, such as maintaining osmotic pressure dynamic balance, nutrient uptake, resistance to exogenous toxins, antigen processing, cell division, cancer cell resistance, bacterial immunity, pathogenic mechanisms and spore formation, cholesterol and lipid transport, and developmental stem cell biological processes [23]. The bacterial ABC transporter protein was first discovered as a high affinity nutrient transporter, and later attracted attention due to its involvement in multidrug resistance (MDR) in Candida albicans. Research has shown that overexpression of genes encoding ABC transporters is one of the main reasons for pathogenic fungi to acquire multidrug resistance [24, 25]. Overexpressed ABC transporters efficiently pump antifungal drugs that enter fungal cells out of the cell, reducing the concentration of drugs inside the cell and allowing pathogenic fungi to survive in the patient’s body, leading to fungal resistance [26]. In recent years, with the efforts of scholars from various countries, the reconstruction of ABC transport systems for species such as Escherichia coli [27], Bacillus subtilis [28], and Bacillus subtilis [29] has been gradually completed.
This study identified over 50 peptide segments corresponding to adenosine triphosphate binding cassette transporter (ABC transporter); Multiple ABC transporters related to the transport of iron, nickel, cobalt ions, iron compounds, metal ions, oligopeptides, dipeptides, amino acids, branched chain amino acids, lactidases, and cleavage nucleases were detected in the plaque fluid of the three groups with no differential co expression. It can be seen that ABC transporters are involved in various physiological functions of bacteria. Correspondingly, foreign scholars have applied proteomic techniques in S During the formation of biofilms by mutans and S. oralis, as well as in the expression profiles of intracellular and extracellular proteins under various environmental pressures, traces of ABC transporters have also been found [30, 31], suggesting their involvement in regulating bacterial adaptation to the environment, survival, and virulence. Recently, Alexander further confirmed that two related transport proteins, S. mutans, are involved in the uptake of disaccharides and oligosaccharides by cells, and there may be interactions between different transport proteins [32]. At the same time, the ABC transport device system plays an important role in the recognition process of autoinducers (AIs) transport in the density sensing (QS) system, participating in the regulation of intracellular specific gene expression and completing signal exchange between bacteria [33, 34].
It is worth noting that we identified a total of 15 highly expressed ABC transporters in the high alkaline environment pressure group, with 7 proteins greater than 1.5 times. However, in the control group, only 6 ABC transporters were highly expressed, all lower than 1.5 times, suggesting that they may be potential target molecules for testing the resistance of fecal enterococci biofilms to alkaline environments.
5.Conclusion
Through comprehensive analysis, we obtained a total of 2850 peptide segments with quantitative information in this experiment. Resulting in a dataset of 580 differentially expressed peptide segments with statistical significance. In addition, proteins undergo glycosylation, phosphorylation, and acetylation modifications from synthesis to secretion, and complex interactions occur between proteins. It is worth noting that we identified a total of 15 highly expressed ABC transporters in the high alkaline environment pressure group, with 7 proteins greater than 1.5 times. Nevertheless, macroproteomics, secretory proteomics, and bioinformatics analysis still provide a very good platform for our research. This experiment obtained the largest known dataset of differentially secreted proteins in the biofilm of Enterococcus faecalis under different environmental pressure states, providing experimental data for further clarification of the pathogenesis of refractory periapical periodontitis, research directions, and possible ecological interventions. In the future, we will do more study about functions of meaningful proteins so that we can recognize more detail about the mechanisms of how E.f resistant to pressure environment.
Acknowledgments
This study was funded by the Shanghai Natural Science Foundation of China (18zr1422300) and Natural Science Foundation of Tibet Autonomous Region (XZ2019ZR-ZY43(Z)). We acknowledge Shanghai ShengZi Biotechnology Co., Ltd and Dr. Yu Hong for their great effort on the LC–MS/MS experiments.
Conflict of interest
None to declare.
References
[1] | Mohamed JA, Huang DB. Biofilm formation by enterococci. Journal of Medical Microbiology. (2007) ; 56: : 1581-1588. doi: 10.1099/jmm.0.47331-0. |
[2] | Hancock HH, Jr., Sigurdsson A, Trope M, Moiseiwitsch J. Bacteria isolated after unsuccessful endodontic treatment in a North American population. Oral Surgery Oral Medicine Oral Pathology Oral Radiology and Endodontics. (2001) ; 91: : 579-586. doi: 10.1067/moe.2001.113587. |
[3] | Pinheiro ET, Gomes BP, Ferraz CC, Teixeira FB, Zaia AA, Souza Filho FJ. Evaluation of root canal microorganisms isolated from teeth with endodontic failure and their antimicrobial susceptibility. Oral Microbiology Immunology. (2003) ; 18: : 100-103. doi: 10.1034/j.1399-302x.2003.00058.x. |
[4] | Siqueira JF. Jr., Rocas IN. Polymerase chain reaction-based analysis of microorganisms associated with failed endodontic treatment. Oral Surgery Oral Medicine Oral Pathology Oral Radiology and Endodontics. (2004) ; 97: : 85-94. doi: 10.1016/s1079-2104(03)00353-6. |
[5] | Sedgley C, Nagel A, Dahlen G, Reit C, Molander A. Real-time quantitative polymerase chain reaction and culture analyses of Enterococcus faecalis in root canals. Journal of Endodontics. (2006) ; 32: : 173-177. doi: 10.1016/j.joen.2005.10.037. |
[6] | Muras A, Mallo N, Otero-Casal P, Pose-Rodríguez JM, Otero A. Quorum sensing systems as a new target to prevent biofilm-related oral diseases. Oral Diseases. (2020) ; 1-7. doi: 10.1111/odi.13689. |
[7] | Swimberghe RCD, Coenye T, De Moor RJG, Meire MA. Biofilm model systems for root canal disinfection: a literature review. International Endodontic Journal. (2019) ; 52: : 604-628. doi: 10.1111/iej.13050. |
[8] | Mohammadi Z, Dummer PM. Properties and applications of calcium hydroxide in endodontics and dental traumatology. International Endodontic Journal. (2011) ; 44: : 697-730. doi: 10.1111/j.1365-2591.2011.01886.x. |
[9] | Gonçalves LS, Rodrigues RC, Andrade Junior CV, Soares RG, Vettore MV. The Effect of Sodium Hypochlorite and Chlorhexidine as Irrigant Solutions for Root Canal Disinfection: A Systematic Review of Clinical Trials. Journal of Endodontics. (2016) ; 42: : 527-532. doi: 10.1016/j.joen.2015.12.021. |
[10] | Ma J, Tong Z, Ling J, Liu H, Wei X. The effects of sodium hypochlorite and chlorhexidine irrigants on the antibacterial activities of alkaline media against Enterococcus faecalis. Archives of Oral Biology. (2015) ; 60: : 1075-1081. doi: 10.1016/j.archoralbio.2015.04.008. |
[11] | Appelbe OK, Sedgley CM. Effects of prolonged exposure to alkaline pH on Enterococcus faecalis survival and specific gene transcripts. Oral Microbiology and Immunology. (2007) ; 22: : 169-174. doi: 10.1111/j.1399-302X.2007.00340.x. |
[12] | Ran S, Liu B, Jiang W, Sun Z, Liang J. Transcriptome analysis of Enterococcus faecalis in response to alkaline stress. Frontiers in Microbiology. (2015) ; 6: : 795. doi: 10.3389/fmicb.2015.00795. |
[13] | Arntzen MØ, Karlsk IL, Skaugen M, Eijsink VG, Mathiesen G. Proteomic investigation of the response of Enterococcus faecalis V583 when cultivated in urine. PLoS One. (2015) ; 10: : 1-17. doi: 10.1371/journal.pone.0126694. |
[14] | Giard JC, Laplace JM, Rince A, Pichereau V, Benachour A, Leboeuf C, Hartke A. The stress proteome of Enterococcus faecalis. Electrophoresis. (2001) ; 22: : 2947-2954. doi: 10.1002/1522-2683(200108)22:14<2947::AID-ELPS2947>3.0.CO;2-K. |
[15] | Wang X, He X, Jiang Z, Wang J, Chen X, Liu D, Yuan J. Proteomic analysis of the Enterococcus faecalis V583 strain and clinical isolate V309 under vancomycin treatment. Journal of Proteome Research. (2010) ; 9: : 1772-1785. doi: 10.1021/pr901216e. |
[16] | Pessione A, Lamberti C, Cocolin L, Campolongo S, Grunau A, Giu-bergia, S, …Pessione E. Different protein expression profiles in cheese and clinical isolates of Enterococcus faecalis revealed by proteomic analysis. Proteomics. (2012) ; 12: : 431-447. doi: 10.1002/pmic.201100468. |
[17] | Bøhle LA, Færgestad EM, Veiseth-Kent E, Steinmoen H, Nes IF, Eijsink VG, Mathiesen G. Identification of proteins related to the stress response in Enterococcus faecalis V583 caused by bovine bile. Proteome Science. (2010) ; 8: : 37. doi: 10.1186/1477-5956-8-37. |
[18] | Wisniewski JR, Zougman A, Nagaraj N, Mann M. Universal sample preparation method for proteome analysis. Nature Methods. (2009) ; 6: : 359-362. doi: 10.1038/nmeth.1322. |
[19] | Hogrebe A, von Stechow L, Bekker-Jensen DB, Weinert BT, Kelstrup CD, Olsen JV. Benchmarking common quantification strategies for large-scale phosphoproteomics. Nature Communications. (2018) ; 9: : 1045. doi: 10.1038/s41467-018-03309-6. |
[20] | Fan W, Huang Z, Fan B. Effects of prolonged exposure to moderate static magnetic field and its synergistic effects with alkaline pH on Enterococcus faecalis. Microbial Pathogenesis. (2018) ; 115: : 117-122. doi: 10.1016/j.micpath.2017.12.028. Epub 2017 Dec 11. |
[21] | Suriyanarayanan T, Qingsong L, Kwang LT, Mun LY, Truong T, Seneviratne CJ. Quantitative Proteomics of Strong and Weak Biofilm Formers of Enterococcus faecalis Reveals Novel Regulators of Biofilm Formation. Molecular and Cellular Proteomics. (2018) ; 17: : 643-654. doi: 10.1074/mcp.RA117.000461. |
[22] | Kane PM. The where, when, and how of organelle acidification by the yeast vacuolar H+-ATPase. Microbiology and Molecular Biology Reviews. (2006) ; 70: : 177-191. doi: 10.1128/MMBR.70.1.177-191.2006. |
[23] | Zhu X, Liu W, Lametsch R, Aarestrup F, Shi C, She Q, …Knøchel S. Phenotypic, proteomic, and genomic characterization of a putative ABC-transporter permease involved in Listeria monocytogenes biofilm formation. Foodborne Pathogens and Disease. (2011) ; 8: : 495-501. doi: 10.1089/fpd.2010.0697. |
[24] | Fabretti F, Theilacker C, Baldassarri L, Kaczynski Z, Kropec Holst O, Huebner J. Alanine esters of enterococcal lipoteichoic acid play a role in biofilm formation and resistance to antimicrobial peptides. Infection and Immunity. (2006) ; 74: : 4164-4171. doi: 10.1128/IAI.00111-06. |
[25] | Jeckelmann JM, Erni B. The mannose phosphotransferase system (Man-PTS) – Mannose transporter and receptor for bacteriocins and bacteriophages. Biochimica et Biophysica Acta-Biomembranes. (2020) ; 1862: : 183412. doi: 10.1016/j.bbamem.2020.183412. |
[26] | Peng Z, Ehrmann MA, Waldhuber A, Niemeyer C, Miethke T. Frick JS, …Vogel RF. Phosphotransferase systems in Enterococcus faecalis OG1RF enhance anti-stress capacity in vitro and in vivo. Research in Microbiology. (2017) ; 168: : 558-566. doi: 10.1016/j.resmic.2017.03.003. |
[27] | Wei L, Li M, Xia F, Wang J, Ran S, Huang Z, Liang J. Phosphate transport system mediates the resistance of Enterococcus faecalis to multidrug. Microbiological Research. (2021) ; 249: : 126772. doi: 10.1016/j.micres.2021.126772. |
[28] | Cicchillo RM, Baker MA, Schnitzer EJ, Newman EB, Krebs C, Booker SJ. Escherichia coli L-serine deaminase requires a [4Fe-4S] cluster in catalysis. The Journal of Biological Chemistry. (2004) ; 279: : 32418-32425. doi: 10.1074/jbc.M404381200. |
[29] | Lindenstrauss AG, Behr J, Ehrmann MA, Haller D, Vogel RF. Identification of fitness determinants in Enterococcus faecalis by differential proteomics. Archives of Microbiol. (2013) ; 195: : 121-130. doi: 10.1007/s00203-012-0857-3. |
[30] | Großeholz R, Koh CC, Veith N, Fiedler T, Strauss M, Olivier B, …Kummer U. Integrating highly quantitative proteomics and genome-scale metabolic modeling to study pH adaptation in the human pathogen Enterococcus faecalis. NPJ Systems Biology and Applications. (2016) ; 2: : 16017. doi: 10.1038/npjsba.2016.17. |
[31] | Tendolkar PM, Baghdayan AS, Gilmore MS, Shankar N. Enterococcal surface protein, Esp, enhances biofilm formation by Enterococcus faecalis. Infection and Immunity. (2004) ; 72: : 6032-6039. doi: 10.1128/IAI.72.10.6032-6039.2004. |
[32] | Tendolkar PM, Baghdayan AS, Shankar N. The N-terminal domain of enterococcal surface protein, Esp, is sufficient for Esp-mediated biofilm enhancement in Enterococcus faecalis. Journal of Bacteriology. (2005) ; 187: : 6213-6222. doi: 10.1128/JB.187.17.6213-6222.2005. |
[33] | Toledo-Arana A, Valle J, Solano C, Arrizubieta MJ, Cucarella C, Lamata M, …Lasa I. The enterococcal surface protein, Esp, is involved in Enterococcus faecalis biofilm formation. Applied and Environmental Microbiology. (2001) ; 67: : 4538-4545. doi: 10.1128/AEM.67.10.4538-4545.2001. |
[34] | Dworniczek E, Wojciech Ł, Sobieszczańska B, Seniuk A. Virulence of Enterococcus isolates collected in Lower Silesia (Poland). Scandinavian Journal of Infectious Diseases. (2005) ; 37: : 630-636. doi: 10.1080/00365540510031421. |
Appendices
Supplementary data
Table S1
List of primers used for RT-PCR analysis
| Accession | Gene name | Primer sequence | |
|---|---|---|---|
| Forward | Reverse | ||
| J5E1D1 | atpE | TATCGGAGCCGCTATCGGTAA | CTTCGATTAAAGCGACCCCGA |
| A0A4V0CW09 | esp | GGGCAAGGCTCTCAATGACT | GTAGGCTCCATGCTGGTTGT |
| Q82YS1 | sea1 | CAGGGGTAGCAGGTATTGGG | GCTTGCTCCGTTGTTTGTGT |
| S4D0N0 | dnaK | GTATCGAAACAATGGGCGGC | CAGCCATTGGACGTTCTCCT |
| J5D8P4 | dltC | ACAGGAACAGACGAAGTTGTGA | TGGTGTTCCCCATACTTCACG |
| Q831A3 | atpA | TTCTATGCAGGCACTCGTCC | GCAGTGGCGCATGTAGTTTT |
| Q834X8 | atpB | GAGCGGTATCCAACCACCAA | GTTGGGCAAAAGCTGCGTAA |
| C7VCH0 | EFNG_00349 | GCCAAAGGGGTTGGCTTTAC | TTGGGCAATCCCAGAGAACAA |
| E2YAA7 | HMPREF9493_00603 | TTTGTTTGCGGCTTTGGGTT | CAACAATCGCCATTCGAGCC |
| R3I6P6 | WOU_01561 | TATGCACGCTGAATTTGGTGA | TCGCTATTACTTTTCCAAGCGG |


