
Detection method for unrecognized spatial disorientation based on optical flow stimuli
Abstract
BACKGROUND:
Flight accidents caused by spatial disorientation (SD) greatly affect flight safety.
OBJECTIVE:
Few studies have been devoted to the evaluation of SD.
METHODS:
10 pilots and 10 non-pilots were recruited for the experimental induction of SD. Videos for giving optical flow stimuli were played at two different flow speeds to induce SD. Subjective judgment and center of foot pressure (CoP) data were collected from the tests. The data were combined to determine the occurrence of SD and analyze the SD types.
RESULTS:
The number of self-reported SD events was slightly smaller in the pilots than in the non-pilots. The average upper bound of the confidence interval for the standard deviation of CoP was 0.32
CONCLUSION:
The method offered a new to analyze unrecognized SD. We could determine the occurrence unrecognized SD. This is an essential means of reducing flight accidents caused by unrecognized SD.
1.Introduction
Spatial disorientation (SD) is a pilot’s erroneous perception of position, attitude, or motion in relation to the gravitational vertical angle and the Earth’s surface. Examples include illusions of self-motion (or vection) [1] and autokinetic illusion [2]. SD has caused many flight accidents so far. From 1993 to 2013, 11% of the flight accidents in the US troops were related to SD [3], with a mortality of 69% [4]. Hence, SD poses a serious threat to flight safety [5].
SD-induced flight accidents are generally divided into three categories [6]: unrecognized SD in this category, a pilot gets disoriented but does not recognize it [7]; recognized SD is aware of SD [8]; and uncontrollable SD is aware of SD, but the pilots gets incapacitated and loses control of the aircraft [7]. According to the latest research, the three types of SD correspond to the three stages of human brain cognition. The three of them are interconnected, each building on the previous one [9]. The judgment method varies for each type of SD. Recognized SD and incontrollable SD can be more intuitively determined, for example, by subjective judgment [10] and rating scales [11]. However, the judgment method for unrecognized SD is not yet mature. In this study, we focused on the detection method for unrecognized SD to solve these mentioned problems.
Although unrecognized SD goes undetected by the human, it influences human behaviors subconsciously. From 2002 to the present, the changes in the center of foot pressure (CoP) were detected using a force plate in several studies on vision-induced vection illusion and postural deviation [12]. CoP deviation was found to be larger during self-reported vection illusion than in its absence.
In 2002, Thurrell et al. [13] examined whether the conscious awareness of self-motion affected the amplitude and directional accuracy of vision-induced postural response. Among studies on vision-induced vection illusion and postural deviation, the changes in CoP were detected using a force plate. CoP deviation was larger during self-reported vection illusion than in its absence. The results confirmed that the direction of vision-induced postural response changed with the variation in the visual stimuli varied. In 2005, Fushiki et al. [14] conducted a similar study and used video-based motion analysis equipment to discuss the subjects’ head and trunk deviations during the experiment. They concluded that postural balance was affected by vection illusion.
Da-Silva et al. [15] conducted an experimental study in 2015 using dynamic virtual vision simulation to induce vection. The CoP data in different directions and under different speeds of the visual scene were analyzed. Their study showed that the displacement of CoP upon vection had the same direction as the visual scene. Their study also showed that the postural balance was disrupted by vection, resulting in significant changes in CoP.
The aforementioned studies were concerned with postural balance upon vection. However, very few focused on recognized SD. Mounting evidence shows that the differences in postural instability can be used to predict who will experience strong illusory self-motions (vection) and become sick when exposed to global patterns of optical flow [16, 17]. Observing a moving visual scene is very likely to generate a feeling of disorientation [18], which inevitably results in postural adjustments [19]. When SD is induced by only visual information, very small discrepancies are noted in posture and individuals’ susceptibility to SD. The subjects may have little awareness of the occurrence of SD. This situation is known as unrecognized SD, which poses the greatest threat to flight safety. Even if the pilots themselves are unaware of SD, we can still detect it from minor postural swings. On this basis, we could determine the occurrence of SD and differentiate between different types of SD events, especially unrecognized SD. Then, enhancing SD-targeted training based on this understanding is an essential means of reducing flight accidents.
In the present study, we applied a judgment methodology for unrecognized SD published in 2020 [20] and 2022 [9] to practice. CoP was used as an indicator to determine the occurrence of unrecognized SD. CoP was combined with subjective judgment to determine the occurrence of unrecognized SD. The present study explored the feasibility of the judgment methodology in two different populations: pilots and non-pilots. We investigated the feasibility and reliability of this methodology and assessed the similarities and differences in the experimental induction of unrecognized SD in pilots and non-pilots. Therefore, we hope that this study can provide reference for reducing flight accidents and casualties.
2.Method
2.1Participants
The study included 20 participants, all of whom were male. Ten participants were pilots, whereas the other 10 were non-pilots. The pilots were aged 24–28 years, with an average of 25
2.2Experimental process
Each participant received two groups of tests using optical flow stimuli. One group consisted of six repetitive control tests, with each lasting for 30 s. The other group consisted of six repetitive tests with optical flow stimuli, each lasting for 30 s. The participants were asked whether they experienced any vection at the end of each test. twelve tests were given for each participant, with each lasting for 30 s. The two tests were spaced 1–5 min apart. It was ensured that each participant had enough time to rest.
The lights were turned off during the tests so that the tests were conducted in complete darkness. The participants kept two feet together during the tests, standing on the force plate with two hands down. The participants were told to maintain an upright position during the tests. A projection screen was placed at 1 m in front of the participants for playing the video stimuli. Both the vertical and horizontal angles of view of the projection screen were 90∘.
2.3Visual stimuli
The optical flow stimuli were given to induce SD. The video was shown on a 2
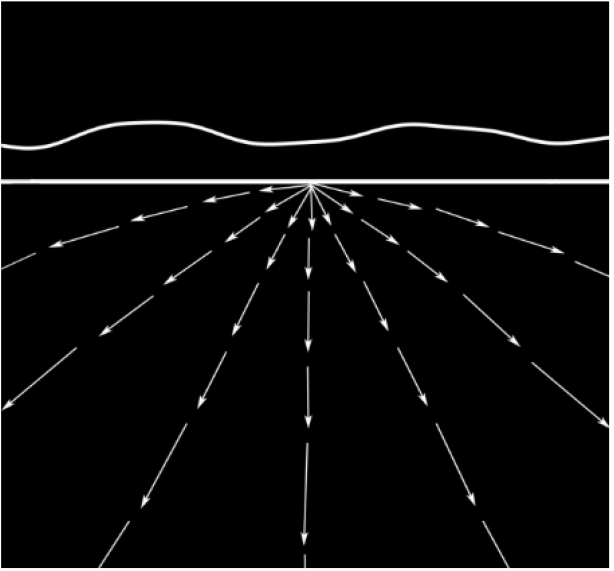
Figure 1.
Optical flow stimuli.
2.4Control tests
In the control tests, the video was paused. That is, the picture was static (Fig. 1), while all other test conditions were the same as in the optical flow stimuli tests. Only one variable was different between the control and optical flow stimuli tests: whether the picture was flowing. The test results were then analyzed on this basis.
2.5Experimental group
The optical flow stimulus was given to simulate the scene in which the light observable on the ground from a high-speed aircraft at night was moving toward the pilot due to relative motion [21]. After the test began, the lines in the videos flowed in the direction shown by the arrowhead (Fig. 1). Two flow speeds of the visual scene were used: high and low. The width of the distant mountain and the horizon in the video was 2.5 cm. The width of the arrow line was 1 cm. Every two adjacent arrow lines among seven were spaced 45∘ apart. In the high-speed flow stimulus tests, the middle arrow line moved downward for 45 cm every second. In the low-speed flow stimulus tests, the middle arrow line moved downward for 15 cm every second. The high flow speed was about three times the low flow speed. Each test lasted for 30 s.
2.6Data collection
2.6.1Subjective judgment
Since we focused on unrecognized SD, the participants were asked whether they had experienced vection during tests after each test. Here, vection was defined as a subjective feeling of oneself moving forward. Two different subjective judgments concerning the aforementioned situation were recorded:
a) Y, feeling oneself moving forward, that is, a visual illusion of self-motion;
b) N, not feeling oneself moving forward, that is, no visual illusion of self-motion.
2.6.2Postural deviation
Bertec force plate (Bertec FP4060-08, Bertec Corp, OH, USA) was immobilized on the laboratory floor, covering an area of 400
2.7Processing of indicator data
We calculated the standard deviation (
(1)
where
2.8Statistical analysis
When
Table 1
Judgment method for unrecognized SD
| No. | Reported | Result | |
|---|---|---|---|
| 1 | Y | Y | Recognized SD |
| 2 | Y | N | Recognized SD |
| 3 | N | Y | Unrecognized SD |
| 4 | N | N | Non-SD |
2.9Judgment method for unrecognized SD
We conducted an in-depth investigation into the judgment method for unrecognized SD based on the studies conducted in 2020 [20] and 2022 [9]. Following the judgment method, the subjective judgment data and CoP data from all tests were classified into the following four categories, as shown in Table 1:
a) The participant reported a vection (Y), and
Table 2
Upper bounds of the 95% confidence interval of
No. Upper bounds of the 95% confidence interval of No. Pilot group Non-pilot group 1 0.18 0.18 7 7 0.25 0.20 4 8 0.26 0.22 1 4 0.27 0.38 3 3 0.28 0.41 5 2 0.30 0.42 8 5 0.36 0.45 2 9 0.41 0.47 6 10 0.42 0.50 9 6 0.50 0.55 10 Mean value 0.32 0.378 Mean value Standard deviation 0.09 0.119 Standard deviation b) The participant reported a vection (Y), and
c) The participant did not report a vection (N), and
d) The participant did not report a vection (N), and
3.Results
3.1Subjective judgment
Twenty participants were tested (pilot group and non- pilot group), each given three repetitive control tests and three optical flow stimuli tests. Each group receiving the low-speed optical flow stimuli + high-speed optical flow stimuli received 30
The test was marked positive for recognized SD if the participant reported SD after the test. The numbers of tests marked positive for recognized SD were as follows:
a) Pilot group: Two for the low-speed optical flow stimuli and three for the high-speed optical stimuli.
b) Non-pilot group: Two for the low-speed optical flow stimuli and four for the high-speed optical stimuli.
Unrecognized SD occurred only in tests for which no participants reported SD. The number of tests without self-reported SD is shown in Fig. 2:
a) Pilot group: 28 for the low-speed optical flow stimuli and 27 for the high-speed optical stimuli.
b) Non-pilot group: 28 for the low-speed optical flow stimuli and 26 for the high-speed optical stimuli.
The two flow speeds chosen for the optical flow stimuli were small. Therefore, the pilots reported recognized SD less frequently than the non-pilots. Further, we analyzed CoP in participants reporting no SD
3.2Postural swing analysis
We first calculated the
Table 3
| No. | Pilot group | Non-pilot group | ||||||||||
|---|---|---|---|---|---|---|---|---|---|---|---|---|
| Low-speed tests | High-speed tests | Low-speed tests | High-speed tests | |||||||||
| 1 | 2 | 3 | 1 | 2 | 3 | 1 | 2 | 3 | 1 | 2 | 3 | |
| 1 | 0.17 | 0.14 | 0.11 | 0.14 | 0.15 | 0.10 | 0.36 | 0.40* | 0.37 | 0.43* | 0.39* | 0.47* |
| 2 | 0.20 | 0.24 | 0.27 | 0.30* | 0.33* | 0.19 | 0.74* | 0.40 | 0.55* | 0.38 | 0.50* | 0.56* |
| 3 | 0.26 | 0.20 | 0.24 | 0.44* | 0.27 | 0.25 | 0.19 | 0.17 | 0.78* | 0.20* | 0.26* | 0.24* |
| 4 | 0.29* | 0.24 | 0.19 | 0.26 | 0.32* | 0.36* | 0.15 | 0.24* | 0.26* | 0.24* | 0.20 | 0.17 |
| 5 | 0.35 | 0.51* | 0.40* | 0.29 | 0.33 | 0.31 | 0.57* | 0.59* | 0.51* | 0.43 | 0.41 | 0.39 |
| 6 | 0.49 | 0.33 | 0.48 | 0.45 | 0.47 | 0.82* | 0.82* | 0.54 | 0.77* | 0.58* | 0.63* | 0.71* |
| 7 | 0.25* | 0.26* | 0.28* | 0.21 | 0.24 | 0.19 | 0.38 | 0.30 | 0.40 | 0.43* | 0.51* | 0.39 |
| 8 | 0.38* | 0.28* | 0.23 | 0.31* | 0.25 | 0.40* | 0.13 | 0.17 | 0.15 | 0.12 | 0.10 | 0.16 |
| 9 | 0.39 | 0.49* | 0.39 | 0.55* | 0.40 | 0.33 | 0.52* | 0.43 | 0.40 | 0.61* | 0.41 | 0.57* |
| 10 | 0.40 | 0.36 | 0.30 | 0.48* | 0.40 | 0.37 | 0.80* | 0.37 | 0.42 | 0.86* | 0.49 | 0.76* |
Figure 2.
Upper bounds of the 95% confidence interval in the two groups receiving the control tests.
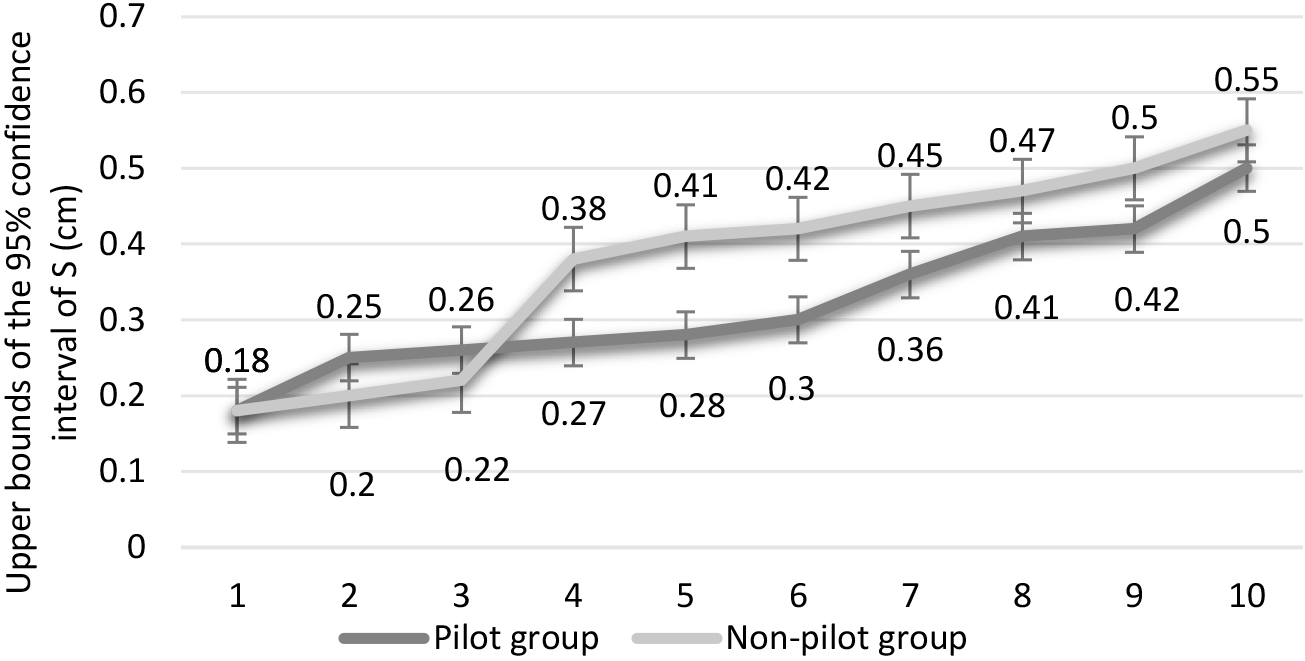
After obtaining the upper bounds of the 95% confidence interval, we further calculated the standard deviation of CoP for each participant in each test (Table 3). If
As shown in Table 3, in low-speed optical flow stimuli tests from pilots, the
3.3Judgment and analysis of unrecognized SD
The subjective judgment data were combined with the confidence intervals of CoP to identify unrecognized SD events (Table 1). When the participant did not report vection but the
Table 4
Judgment results for unrecognized SD in the two groups Here, “
| No. | Pilot group | Non-pilot group | ||||||||||||||||
|---|---|---|---|---|---|---|---|---|---|---|---|---|---|---|---|---|---|---|
| Low-speed tests | High-speed tests | Low-speed tests | High-speed tests | |||||||||||||||
| 1 | 2 | 3 | 1 | 2 | 3 | 1 | 2 | 3 | 1 | 2 | 3 | |||||||
| 1 |
| – |
|
|
| |||||||||||||
| 2 |
|
|
|
|
|
|
|
|
|
|
|
| ||||||
| 3 |
|
|
|
|
|
|
|
|
|
|
| |||||||
| 4 |
|
|
|
|
|
|
|
|
|
| ||||||||
| 5 |
|
|
|
|
|
|
|
|
| |||||||||
| 6 |
|
|
|
|
|
|
|
|
|
|
|
| ||||||
| 7 |
|
|
|
|
|
| ||||||||||||
| 8 |
|
|
|
|
|
| ||||||||||||
| 9 |
|
|
|
|
|
|
|
|
|
|
| |||||||
| 10 |
|
|
|
|
|
|
|
|
|
|
|
| ||||||
| Total |
|
| ||||||||||||||||
Table 4 shows that the total number of unrecognized SD events in pilots was lower than non-pilots. An insignificant difference in the number of unrecognized SD events was observed between the two groups. The success rate of the experimental induction of unrecognized SD was 26.7% and 45.0% in the pilots and non-pilots, respectively. Non-pilots were more likely to experience unrecognized SD than pilots (more by 9 events).
The two groups of participants show differences according to the test results. Then, we performed a multivariate analysis of variance to verify whether this difference was statistically significant. The three different judgment results were taken as dependent variables, and two-factor analysis of variance was conducted considering the interaction effect. The analysis results for factor A (two levels: optical flow stimuli with low and high flow speeds) and factor B (two levels: pilot and non-pilot) were indicated no interaction effect between the flow speed and the population. These two factors had little impact on the type of SD. No significant difference was found in the occurrence of SD evoked by low- and high-speed optical flow stimuli in each group. To be specific, the difference in this respect was only statistically insignificant.
4.Discussion
We administered video-based optical flow stimuli to 10 pilots and 10 non-pilots for the experimental induction of SD. A set of criteria were set up for identifying unrecognized SD. The purpose was to discuss the feasibility of the judgment method for unrecognized SD and the difference between pilots and non-pilots in terms of susceptibility to SD.
The analysis of subjective judgment data from the participants showed that, under the visual stimuli at the same flow speed, vection was reported less frequently in pilots than in non-pilots. One possible reason was that the pilots received flight simulator training addressing the vection problem as part of their routine training. In contrast, non-pilots were rarely exposed to such scenes and were more likely to experience recognized vection compared with pilots. The aforementioned finding proved the effectiveness of flight simulator training in reducing SD [23, 24]. Some researchers believed that the three types of SD events were three successive steps in human perception. Increasing the level of cognition could help with the timely recognition of SD [20].
The present study demonstrated the feasibility of the judgment method for unrecognized SD. The subjective judgment data were combined with the statistical analysis of CoP to identify participants and tests positive for unrecognized SD. Twenty participants recruited in the present study received 120 control tests in total. The statistical analysis of the confidence intervals calculated from the standard deviation (
We used the proposed judgment method for unrecognized SD. The unrecognized SD events totaled 43 in 20 participants, accounting for 35.8% of all tests. This result agreed with the general occurrence rule of unrecognized SD [25]. The total number of unrecognized SD events occurring in pilots was reduced by 18.3% compared with that in non-pilots. Although the difference was not statistically significant, we have reasons to believe that pilots are less likely to experience SD under optical visual flow stimuli, probably due to frequent training addressing SD. It was thus proved feasible to combine subjective and objective judgments to determine the occurrence of recognized SD. Our study shed new light on the detection of unrecognized SD [26] and laid the basis for subsequent experimental induction and statistical analysis of SD. Hence, enhancing SD-targeted training may be an effective pathway to reduce SD-related accidents.
Two-way ANOVA, considering the interaction effect between variables based on all test data, indicated no significant difference in SD occurrence under different population and flow speed factors. This result was inconsistent with the findings of Da Silva et al. [15] . The latter believed that the flow direction of the visual scene affected people’s control of postural balance. The discrepancy might be explained by the slight difference between the two flow speeds adopted for our tests. Another probable reason was the limited number of participants recruited for the present study, leading to an insignificant difference. We will follow up on this issue in the future.
To conclude, we identified participants and tests positive for unrecognized SD by combining subjective judgment with the standard deviations (
The aforementioned findings suggested that the amplitude of postural deviation was closely related to the occurrence of SD. Many studies have shown that the involuntary deviation of the head or trunk occurs first upon SD, resulting in CoP deviation. In future research, we will use this method to analyze more subjects. We plan to combine this judgment method with the EEG signals. Used to analyze whether there are observable characteristic changes in EEG signals when unrecognized SD occurs, and further improve the judgment method for unrecognized SD.
5.Conclusion
Our research methodology opened a new direction for the study of unrecognized SD. The test results showed that combining subjective judgment with CoP data was feasible for identifying unrecognized SD. Based on this method, we will look for the characteristic changes in objective physiological signals accompanying the occurrence of unrecognized SD. Our method laid a basis for identifying unrecognized SD, screening for pilots below the cognitive threshold, and enhancing the training addressing unrecognized SD. Our study might contribute to the reduction of SD-related flight accidents.
Acknowledgments
This work was supported in part by the Health Commission of Hebei Province (20220079, 20230214), Science and Technology Project of Hebei Education Department (BJK2023074, QN2022020, QN2023029), and the Innovation Experiment Program of College Students in Hebei Medical University (USIP2022075, USIP2022214, USIP2023161, USIP2023219).
Conflict of interest
None to report.
References
[1] | Sánchez-Tena MÁ, Alvarez-Peregrina C, Valbuena-Iglesias MC, Palomera PR. Optical Illusions and Spatial Disorientation in Aviation Pilots. J Med Syst. (2018) ; 42: (5):79. doi: 10.1007/s10916-018-0935-4. |
[2] | Pennings HJM, Oprins EAPB, Wittenberg H, Houben MMJ, Groen EL. Spatial Disorientation Survey Among Military Pilots. Aerosp Med Hum Perf (2020) ; 91: (1): 4-10. doi: 10.3357/AMHP.5446.2020. |
[3] | Poisson RJ, Miller ME. Spatial disorientation mishap trends in the US. Air force 1993–2013. Aviation, Space, and Environmental Medicine. 2014: ; 85: (9): 919-24. doi: 10.3357/ASEM.3971.2014. |
[4] | Lyons TJ, Ercoline W, O’Toole K, Grayson K. Aircraft and related factors in crashes involving spatial disorientation: 15 years of US. Air Force data. Aviation, Space, and Environmental Medicine. (2006) ; 77: (7): 720-3. |
[5] | Cheung B. Spatial disorientation: more than just illusion. Aviation, Space, and Environmental Medicine. (2013) ; 84: (11): 1211-4. |
[6] | Gillingham KK, Previc FH. Spatial Orientation in Flight. (1993) . |
[7] | Neubauer JC. Classifying spatial disorientation mishaps using different definitions. IEEE Engineering in Medicine & Biology Magazine the Quarterly Magazine of the Engineering in Medicine & Biology Society. (2000) ; 19: (2): 28. doi: 10.1109/51.827402. |
[8] | Gibb RW. Visual perception in aviation: Glide path performance during impoverished visual conditions. Dissertations & Theses Gradworks, (2007) . |
[9] | Hao C, Cheng L, Guo L, Zhao R, Wu Y, Li X, et al. Detection of unrecognized spatial disorientation: A theoretical perspective. Technology and Health Care: Official Journal of the European Society for Engineering and Medicine. (2022) ; 30: (S1): 469-80. doi: 10.3233/THC-THC228043. |
[10] | Baijal RJVSA. Simulator based Spatial Disorientation training in the Indian Air Force. Indian Journal of Aerospace Medicine. (2006) ; 2: (50): 1-6. |
[11] | Boril J, Smrz V, Blasch E, Lone M. Spatial Disorientation Impact on the Precise Approach in Simulated Flight. Aerosp Med Hum Perf. (2020) ; 91: (10): 767-75. doi: 10.3357/AMHP.5591.2020. |
[12] | Guerraz M, Thilo KV, Bronstein AM, Gresty MA. Influence of action and expectation on visual control of posture. Brain research. Cognitive Brain Research. (2001) ; 11: (2): 259-66. |
[13] | Thurrell AEI, Bronstein AM. Vection increases the magnitude and accuracy of visually evoked postural responses. Exp Brain Res. (2002) ; 147: (4): 558-60. |
[14] | Fushiki H, Kobayashi K, Asai M, Watanabe Y. Influence of visually induced self-motion on postural stability. Acta Oto-Laryngol. (2005) ; 125: (1): 60-4. |
[15] | Da Silva PJG, Cagy M, Infantosi AFC. A New Dynamic Virtual Stimulation Protocol to Induce Vection. In: 6th European Conference of the International Federation for Medical and Biological Engineering. 2015: : 497-500. |
[16] | Apthorp D, Nagle F, Palmisano S. Chaos in balance: non-linear measures of postural control predict individual variations in visual illusions of motion. Plos One. (2014) ; 9: (12): e113897. doi: 10.1371/journal.pone.0113897. |
[17] | Stoffregen TA, Smart LJJ. Postural instability precedes motion sickness. In, (1998) : 437-48. |
[18] | Wolfgang K, Karin K, Wolfram T, et al. The Importance of Motion Cues in Spatial Disorientation Training for VFR-Pilots. The International Journal of Aviation Psychology. (2011) ; 21: (2): 135-52. doi: 10.1080/10508414.2011.556458. |
[19] | Yu Y, Tucker CA, Lauer RT, Keshner EA. Influence of Visual Dependence on Inter-Segmental Coordination during Upright Stance in Cerebral Palsy. J Motor Behav. (2020) ; 52: (3): 249-61. doi: 10.1080/00222895.2019.1610860. |
[20] | Hao C, Fan X, Dong C, Qiao L, Zhao R. A Classification Method for Unrecognized Spatial Disorientation Based on Perceptual Process. Ieee Access (2020) ; 8: : 1. doi: 10.1109/ACCESS.2020.3012821. |
[21] | Eriksson L, von Hofsten C, Tribukait A, Eiken O, Andersson P, Hedström J. Visual flow scene effects on the somatogravic illusion in non-pilots. Aviation, Space, and Environmental Medicine. (2008) ; 79: (9): 860-6. |
[22] | Wei K, Stevenson IH, Körding KP. The uncertainty associated with visual flow fields and their influence on postural sway: Weber’s law suffices to explain the nonlinearity of vection. J Vision. (2010) ; 10: (14): 4. doi: 10.1167/10.14.4. |
[23] | Gaydos SJ, Harrigan MJ, Bushby AJR. Ten years of spatial disorientation in US. Army rotary-wing operations. Aviation, Space, and Environmental Medicine. (2012) ; 83: (8): 739-45. |
[24] | Baaj B, Lewkowicz R, Francuz P, Augustynowicz P, Fudali-Czy A, Stróak P, et al. Spatial disorientation cue effects on gaze behaviour in pilots and non-pilots. Cognition, Technology & Work. (2019) ; 21: (3): 473-86. doi: 10.1007/s10111-018-0534-7. |
[25] | Hao C, Zhao R, Qiao L, Li X, Chi Z. EEG Analysis of Visually Induced Spatial Disorientation. In: 2019 12th International Congress on Image and Signal Processing, BioMedical Engineering and Informatics (CISP-BMEI), (2019) . |
[26] | Li Y, Chen Y, Lv X, Yang Y, Li J, Hao C, et al. EEG functional network properties related to visually induced unrecognized spatial disorientation. Bio-Med Mater Eng. (2015) ; 26: (Suppl 1): S1115-24. doi: 10.3233/BME-151408. |
[27] | Keshavarz B, Berti S. Integration of sensory information precedes the sensation of vection: a combined behavioral and event-related brain potential (ERP) study. Behav Brain Res. (2014) ; 259: : 131-6. doi: 10.1016/j.bbr.2013.10.045. |
[28] | Kim NG, Kim BS. The Effect of Retinal Eccentricity on Visually Induced Motion Sickness and Postural Control. Applied Sciences. (2019) ; 9: (9): 1-9. doi: 10.3390/app9091919. |


