
Clustering algorithm based on DINNSM and its application in gene expression data analysis
Abstract
BACKGROUND:
Selecting an appropriate similarity measurement method is crucial for obtaining biologically meaningful clustering modules. Commonly used measurement methods are insufficient in capturing the complexity of biological systems and fail to accurately represent their intricate interactions.
OBJECTIVE:
This study aimed to obtain biologically meaningful gene modules by using the clustering algorithm based on a similarity measurement method.
METHODS:
A new algorithm called the Dual-Index Nearest Neighbor Similarity Measure (DINNSM) was proposed. This algorithm calculated the similarity matrix between genes using Pearson’s or Spearman’s correlation. It was then used to construct a nearest-neighbor table based on the similarity matrix. The final similarity matrix was reconstructed using the positions of shared genes in the nearest neighbor table and the number of shared genes.
RESULTS:
Experiments were conducted on five different gene expression datasets and compared with five widely used similarity measurement techniques for gene expression data. The findings demonstrate that when utilizing DINNSM as the similarity measure, the clustering results performed better than using alternative measurement techniques.
CONCLUSIONS:
DINNSM provided more accurate insights into the intricate biological connections among genes, facilitating the identification of more accurate and biological gene co-expression modules.
1.Introduction
Gene expression data is a high-dimensional matrix that captures the expression levels of thousands of genes under different experimental conditions [1]. Detecting gene co-expression modules is crucial in the biological interpretation of gene expression data [2]. Clustering algorithms are widely applied in detecting co-expression modules in gene expression data. Despite the success of clustering analysis in many aspects, challenges still exist due to the high dimensionality and inherent noise in gene expression data. Researchers have developed or improved various clustering algorithms to address these challenges [3, 4, 5]. However, a critical issue in clustering is determining a suitable method for measuring the similarity. The accuracy of measuring gene similarity directly affects the resulting gene modules. Thus, accurately describing the similarity between genes is crucial for clustering.
The Pearson correlation (PC) and Euclidean distance (ED) methods are commonly used for measuring the similarity in gene expression data [6, 7]. Also, more advanced methods have been proposed for measuring the similarity. Herwig et al. [8] used mutual information as a similarity measure to enhance the effectiveness of traditional K-means. Sawa et al. [9] proposed a method to approximate the ideal similarity measure using a neural network. However, this approach was prone to overfitting and performed poorly when applied to small datasets. Balasubramaniyan et al. [10] proposed a clustering method that used Spearman’s rank correlation (SPC). This method did not require data normalization and was robust to noise. However, it was less efficient in detecting time pattern features. Son et al. [11] proposed a novel method for measuring similarity in time-series gene expression data. This method preserved information about the similarity of expression-level trajectories over time intervals and considered the similarity of trajectory patterns when two profiles reached their highest and lowest levels of expression. Jothi et al. [12] proposed a method for measuring approximate similarity based on local neighborhood representation in a minimum-spanning tree. Hou et al. [13] applied distance correlation (DC) to weighted gene co-expression network analysis (WGCNA) and named it DC-WGCNA. This method improved module stability and enrichment analysis results, but it had a high computational complexity and lacked validation of evaluation metrics.
The study proposed an algorithm called Dual-Index Nearest Neighbor Similarity Measure (DINNSM). The algorithm used PC and SPC to determine the similarity matrix between genes. Next, a nearest neighbor table was constructed using the similarity matrix. Finally, the similarity matrix was reconstructed using the positions of shared genes in the nearest neighbor table and the number of shared genes. We compared the results of WGCNA based on DINNSM with those of WGCNA based on SPC and those of regular WGCNA. The DINNSM algorithm was also applied to K-means, Fuzzy C-Means (FCM), and hierarchical clustering methods and compared with five commonly used methods [PC, SPC, ED, DC, and maximum information coefficient (MIC)] for measuring the similarity of gene expression data. The rationality and effectiveness of the algorithm were validated using three internal evaluation indices [silhouette index (SI), Calinski-Harabaz index (CHI), and Davies-Bouldin index (DBI)], as well as three external evaluation indices [adjusted mutual information (AMI), adjusted Rand index (ARI), and adjusted biological homogeneity index (ABHI)]. The ABHI was an improvement over the biological homogeneity index (BHI) [14] because it addressed the cluster size issue neglected in BHI. It specifically focused on potential errors that might arise when a cluster contained fewer than five genes, thereby enhancing the biological relevance of the clustering algorithm.
2.Methods
2.1Datasets
We performed experimental validation on five gene expression datasets, as detailed in Table 1. The Yeast1 dataset, created by Cho et al. [15], which used cDNA microarrays to track gene expression changes during the cell cycle of the yeast genome. The dataset contains an expression value of 416 genes at 17 time points. Yeung et al. [16] selected 384 genes that exhibited peak expression at the four single time points. The dataset can be accessed at http://faulty.washington.edu/kayee/cluster. The Yeast2 dataset originated from the Department of Molecular Biology at Stanford University. It contains 552 genes and has been included in the R language’s internal datasets (in the Kohonen package) [17]. The Escherichia coli dataset originated from a comprehensive assessment of the gene expression data module detection method performed by Saelens et al. [8]. We selected four functional gene categories: cell motility (114 genes), coenzyme transport and metabolism (122 genes), inorganic ion transport and metabolism (305 genes), and secondary metabolite biosynthesis, transport, and catabolism (36 genes). After removing outliers and normalizing the data, the final E. coli dataset consisted of 573 genes and 814 samples. The three datasets were selected for our experiments because they offered accurate gene classifications.
Table 1
Details of experimental datasets
| Dataset | Number of instances ( | Number of dimensions (d) | Number of clusters (k) |
|---|---|---|---|
| Yeast1 | 17 | 384 | 5 |
| Yeast2 | 24 | 552 | 4 |
| E. coli | 814 | 573 | 4 |
| HT | 21 | 788 | NA |
| GC | 132 | 652 | NA |
The hypertension (HT) (GSE75360) dataset and gastric cancer (GC) (GSE54129) dataset from the Gene Expression Omnibus (GEO) database (http://www.ncbi.nlm. nih.gov/geo/) were used to validate our algorithm. The HT dataset included 21 samples, and the GC dataset had 132 samples. Probe transformation, missing-value removal, duplicate-gene elimination, and normalization were performed on both datasets using R (version 4.2.1). Differential analysis was conducted using the limma package, with significant differentially expressed genes identified based on the
2.2Dual-Index Nearest Neighbor Similarity Measure (DINNSM)
The DINNSM algorithm was used to construct a similarity matrix by combining PC and SPC similarity measurement methods with the nearest neighbor concept. The principle of the algorithm was as follows.
Suppose dataset A is a gene expression dataset with
(1)
Where
The Disim had higher accuracy compared with that of similarity matrices constructed solely based on PC or PSC. The high-dimensional nature of the data space resulted in the nontransitive similarity measure. To address this issue, we used the concept of nearest neighbors to improve the accuracy of the similarity measure.
The knearest neighbor table refers to a table of
(2)
where
Finally, clustering was performed using the similarity matrix generated using Eq. (2).
This method addressed the limitations of PC in calculating the similarity between genes with nonlinear relationships and overcame the nontransitivity of similarity in high-dimensional data spaces. We constructed Constrsim() and Constrodsnn() functions and performed parallel operations using the foreach package due to the high computational complexity of the DINNSM [18]. The foreach package allowed for parallel computation across multiple Central Processing Unit cores, leading to a significant reduction in the runtime of the algorithm.
2.3Clustering algorithms
WGCNA is a popular algorithm used for detecting gene modules [19]. It describes gene relationships using a network model, and the gene network follows a scale-free distribution. The similarity matrix is typically constructed using PC, which is then converted into an adjacency matrix. The adjacency matrix is further transformed into a topological matrix using the TOMsimilarity() function. Finally, gene modules are identified using the dynamic tree-cutting method.
The K-means clustering is a widely used iterative algorithm [20]. The process includes randomly selecting
FCM clustering is a popular fuzzy clustering algorithm based on objective functions [12]. It is used to calculate a membership matrix for the samples (genes) and assign samples with the highest degree of similarity to the same cluster. This allows the same data to belong to multiple classes.
Hierarchical clustering is an effective method for exploring the nested relationships [12, 20]. It generates a nested hierarchical clustering tree by calculating the similarity between data points in different categories. The most common approach to clustering is agglomerative hierarchical clustering, which includes three linking methods: single linkage, complete linkage, and average linkage. We used the average linkage method
2.4Evaluation measures
This study used SI, CHI, and DBI as internal evaluation measures [21, 22, 23]. Among these, the SI ranges from
BHI assesses the biological significance of clustering by considering gene functional classes. If two genes in the same clustering category also belong to the same functional class, they are given a higher weight. We found that the evaluation value of BHI was too high when certain clusters in the clustering results had less than five genes. We proposed the ABHI to address this issue.
Given a set of gene functional classes
(3)
where
2.5Biological significance
Functional enrichment analysis is a commonly used method in bioinformatics research. It can be conducted on genes within the same cluster using Gene Ontology (GO) terms. We can interpret the biological significance of the clustering results by comparing the gene sets obtained from clustering analysis to known gene functions. Studies have shown that the three most important GO terms can effectively reflect the biological relevance of clustering [12]. We conducted GO enrichment analysis on the gene sets obtained from clustering analysis using the clusterProfiler package. The
3.Results and discussion
3.1Cluster quality analysis
Table 2
Comparison of internal evaluation metrics obtained by WGCNA based on different similarity measurement methods on all gene expression datasets
| Dataset | Evaluation measures | SPC | WCGNA [19] | DC-WGCNA [13] | DINNSM | |||
|---|---|---|---|---|---|---|---|---|
| Yeast1 | SI | 0 | .036 | 0 | .034 | 0 | .038 | 0.195 |
| CHI | 13 | .974 | 12 | .334 | 17 | .526 | 91.731 | |
| DBI | 3 | .595 | 3 | .731 | 3 | .174 | 1.664 | |
| Yeast2 | SI | 0 | .004 | 0 | .003 | 0 | .005 | 0.053 |
| CHI | 5 | .426 | 4 | .818 | 7 | .036 | 36.206 | |
| DBI | 7 | .245 | 7 | .909 | 6 | .974 | 4.002 | |
| E.coli | SI | .002 | .017 | 0. | 002 | 0.067 | ||
| CHI | 21 | .938 | 25 | .513 | 27 | .850 | 68.136 | |
| DBI | 4 | .479 | 4 | .375 | 4 | .305 | 3.120 | |
| HT | SI | .0117 | | .014 | | .005 | 0.146 | |
| CHI | 14 | .975 | 17 | .636 | 15 | .783 | 808.077 | |
| DBI | 8 | .300 | 10 | .132 | 7 | .310 | 2.393 | |
| GC | SI | 0 | .009 | 0 | .006 | 0 | .003 | 0.241 |
| CHI | 4 | .340 | 5 | .571 | 3 | .492 | 568.802 | |
| DBI | 7 | .238 | 8 | .733 | 8 | .965 | 1.720 | |
Table 3
Comparison of external evaluation metrics obtained by WGCNA based on different similarity measures methods on three gene expression datasets
| Dataset | Evaluation measures | SPC | WCGNA [19] | DC-WGCNA [13] | DINNSM |
|---|---|---|---|---|---|
| Yeast1 | AMI | 0.150 | 0.219 | 0.182 | 0.488 |
| ARI | 0.120 | 0.140 | 0.137 | 0.454 | |
| ABHI | 0.236 | 0.317 | 0.288 | 0.497 | |
| Yeast2 | AMI | 0.105 | 0.079 | 0.096 | 0.485 |
| ARI | 0.072 | 0.061 | 0.063 | 0.560 | |
| ABHI | 0.303 | 0.288 | 0.294 | 0.614 | |
| E.coli | AMI | 0.064 | 0.080 | 0.076 | 0.087 |
| ARI | 0.064 | 0.060 | 0.038 | 0.047 | |
| ABHI | 0.336 | 0.355 | 0.353 | 0.409 |
Table 2 shows the internal evaluation results for different WGCNA methods across all datasets. WGCNA using DINNSM as a similarity measure obtained the best evaluation results in all datasets. The results of the external evaluation are shown in Table 3. The DINNSM as a similarity measure also obtained the best evaluation results in all datasets, except for the ARI in the E. coli dataset.
Figure 1.
(a) Comparison of SI metrics obtained by K-means clustering based on different similarity measurement methods on all gene expression datasets. (b) Comparison of AMI metrics obtained by K-means clustering based on different similarity measurement methods on three gene expression datasets.
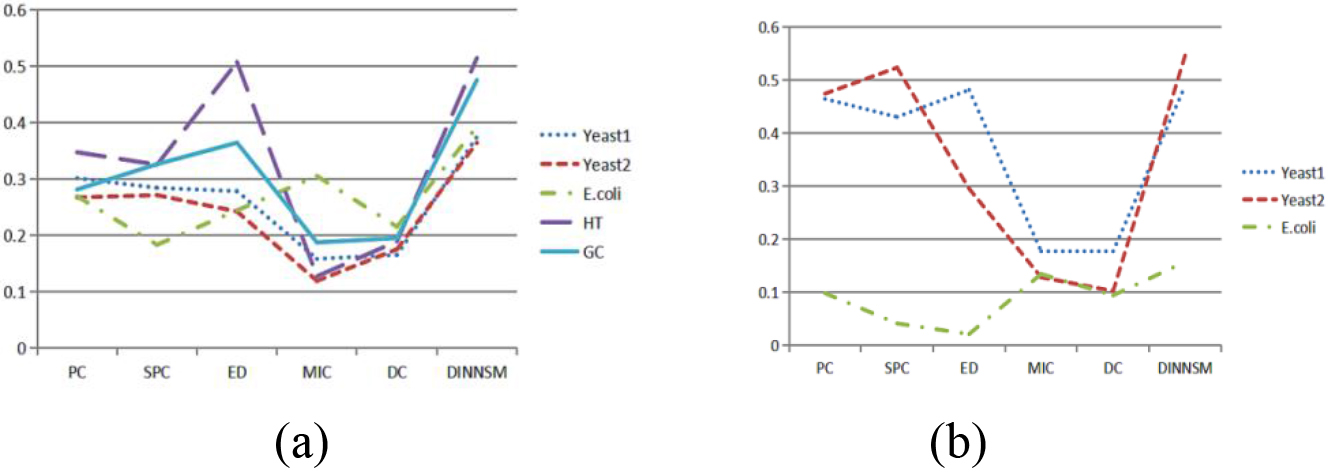
The DINNSM algorithm was also applied to K-means, FCM, and hierarchical clustering methods to verify the applicability of the algorithm. The internal and external evaluation results of K-means clustering based on six different similarity measurement methods (PC, SPC, ED, MIC, DC, and DINNSM) are shown in Fig. 1a and b. DINNSM outperformed other similarity measures regarding SI and AMI values across all datasets.
Figure 2.
(a) Comparison of SI metrics obtained by FCM clustering based on different similarity measurement methods on all gene expression datasets. (b) Comparison of AMI metrics obtained by FCM clustering based on different similarity measurement methods on three gene expression datasets.
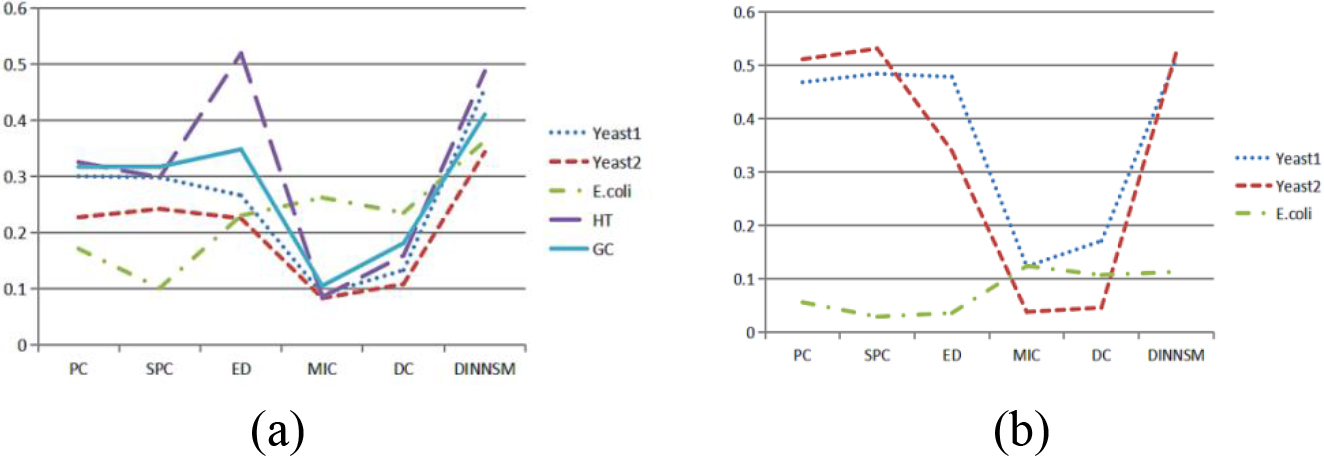
The internal and external evaluation results of FCM clustering based on the six different similarity measurement methods are shown in Fig. 2a and b. The DINNSM method achieved the highest SI values in all datasets, except the HT dataset. Meanwhile, DINNSM obtained the most significant AMI values in all datasets, except the E. coli dataset.
The internal and external evaluation results of hierarchical clustering based on the six different similarity measurement methods are shown in Fig. 3a and b. DINNSM achieved the highest SI values in all datasets except the HT dataset and had the highest AMI values in all datasets.
Figure 3.
(a) Comparison of SI metrics obtained by hierarchical clustering based on different similarity measurement methods on all gene expression datasets. (b) Comparison of AMI metrics obtained by hierarchical clustering based on different similarity measurement methods on three gene expression datasets.
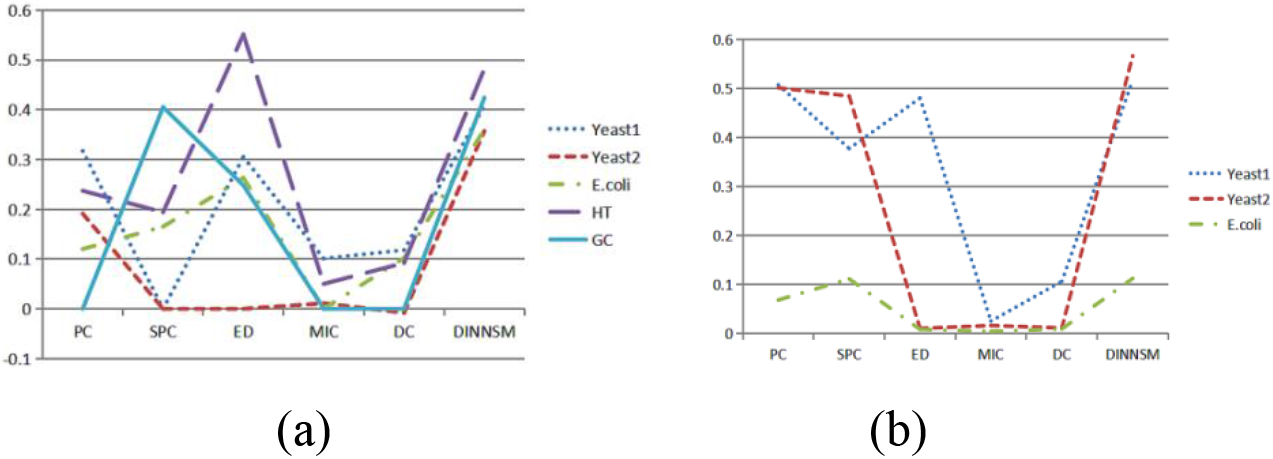
Table 4
The top 3 significant molecular function terms and
| Clusters | The most significant molecular function | |
|---|---|---|
| 1 | Single-stranded DNA binding GO:0003697 | 2.83E-09 |
| DNA binding GO:0003677 | 2.37E-07 | |
| Double-stranded DNA binding GO:0003690 | 8.38E-07 | |
| 2 | Microtubule binding GO:0008017 | 2.11E-06 |
| Microtubule motor activity GO:0003777 | 3.68E-05 | |
| ATP-dependent microtubule motor activity, minus-end-directed GO:0008569 | 6.37E-04 | |
| 3 | Actin filament binding GO:0051015 | 1.70E-03 |
| Myosin II light chain binding GO:0032033 | 1.38E-02 | |
| Myosin light chain binding GO:0032027 | 1.38E-02 | |
| 4 | Single-stranded DNA-dependent ATP-dependent DNA helicase activity GO:0017116 | 6.11E-07 |
| DNA replication origin binding GO:0003688 | 8.69E-06 | |
| 3’-5’ DNA helicase activity GO:0043138 | 1.45E-04 | |
| 5 | Citrate synthase activity GO:0036440 | 1.50E-02 |
| Cupric ion binding GO:1903135 | 2.24E-02 | |
| Citrate (Si)-synthase activity GO:0004108 | 2.24E-02 |
Figure 4.
(a) Comparison of the runtime with and without parallel computing for the MIC measurement method. (b) Comparison of the runtime with and without parallel computing for the DC measurement method. (c) Comparison of the runtime with and without parallel computing for the DINNSM measurement method. (d) Comparison of the runtime with different numbers of threads for three similarity measurement methods on the E. coli dataset.
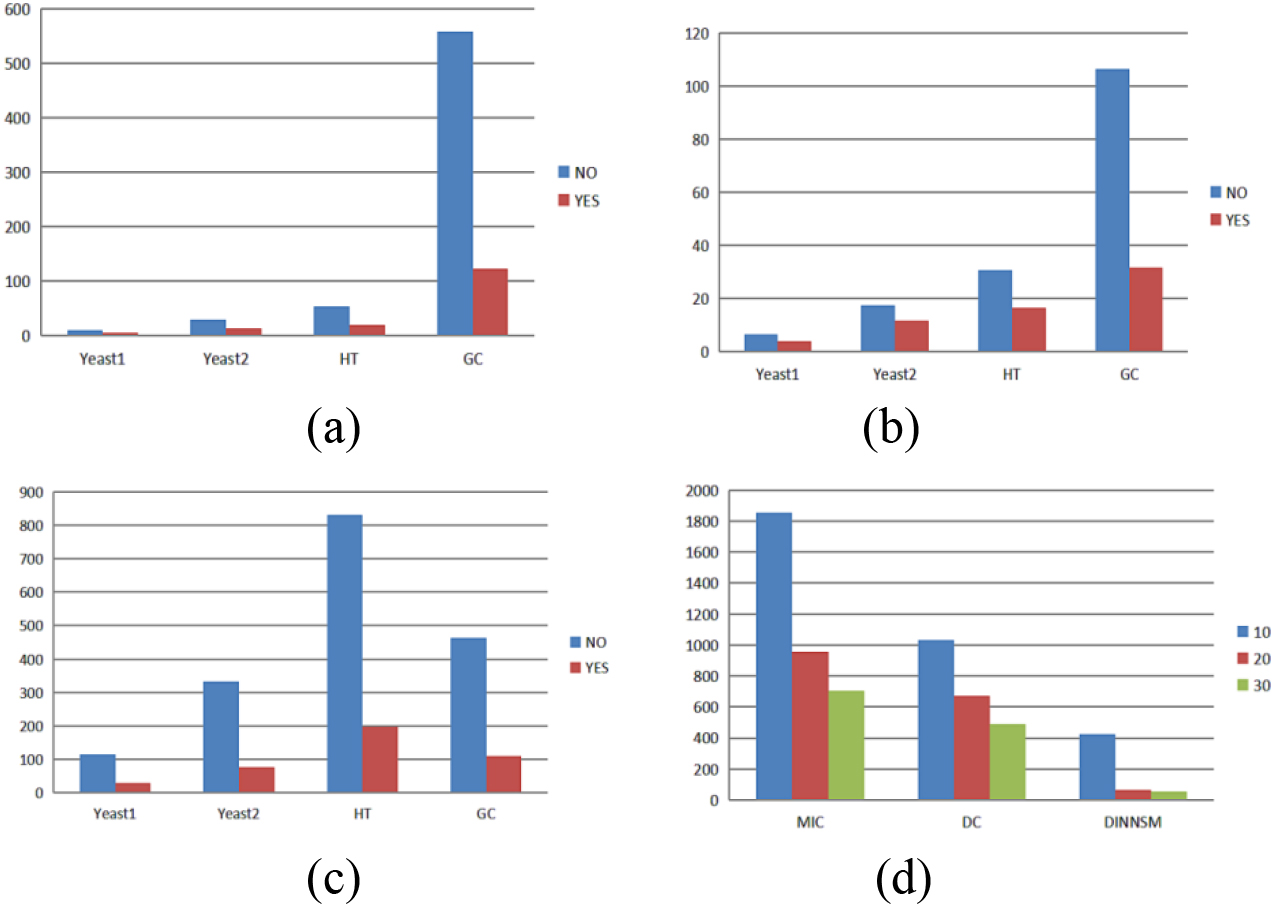
3.2Speed analysis
We performed parallel computation using the foreach package. As the MIC and DC methods have high time complexity, we also implemented parallel computation. We conducted 10 runs of each method without parallel processing and with parallel computation using 10 threads to compare the time difference (in seconds) between running the MIC, DC, and DINNSM measurement methods with and without parallel computation. We observed the average times on the Yeast1, Yeast2, HT, and GC datasets. As shown in Fig. 4a–c, parallel computation led to a significant decrease in the runtime. We compared the runtime of the MIC, DC, and DINNSM methods using 10, 20, and 30 threads on the E. coli dataset, as shown in Fig. 4d, to investigate the effect of varying thread numbers on the runtime. The results showed that using an appropriate number of parallel threads could significantly reduce the program execution time.
3.3Biological significance
We conducted module detection on the Yeast1 dataset to demonstrate the biological significance of the clusters generated by our proposed method. We performed GO analysis on the clustering modules. Table 4 presents the top three molecular function terms and their corresponding
4.Conclusions
DINNSM was more effective than the Pearson and Spearman correlation in revealing intricate biological interactions between genes. The DINNSM addressed the limitations of the PC in calculating the similarity between genes with nonlinear relationships. It also overcame the issue of nontransitivity of similarity in high-dimensional data. Therefore, it provided greater accuracy and scientific validity in measuring gene similarities. Despite its higher time complexity compared with the original measurement methods, we implemented parallel computing in our code to reduce the runtime.
The effectiveness of the proposed method in clustering algorithms was validated using three internal evaluation metrics (SI, CHI, and DBI) and three external evaluation metrics (AMI, ARI, and ABHI). ABHI was an improvement we made on the BHI metric to address the issue of evaluating BHI when a cluster had fewer than five genes. DINNSM was applied to WGCNA and compared with the traditional WGCNA, WGCNA based on SPC, and DC-WGCNA in five gene expression datasets. The results showed that, except for ARI on the E. coli dataset, WGCNA using DINNSM as a similarity measure had the highest evaluation performance across all metrics in all datasets. DINNSM was applied to three common clustering algorithms, K-means, FCM, and hierarchical, to further verify the applicability of the algorithm. The results showed that K-means, using the DINNSM, performed the best in terms of SI and AMI evaluation across all datasets. FCM using the DINNSM demonstrated the highest performance in SI evaluation across all datasets, except the HT dataset. In terms of external evaluation metrics, FCM with DINNSM had the best AMI evaluation performance in all datasets, except the E. coli dataset. Hierarchical clustering using the DINNSM performed the best in terms of SI evaluation in all datasets except the HT dataset. Additionally, it displayed the highest AMI evaluation performance across all datasets regarding external evaluation metrics.
The main disadvantage was the lengthy computation time, particularly when the dataset included a large number of genes. Before analyzing the dataset, methods such as gene differential analysis, variance coefficient, and standard deviation were used to eliminate unimportant genes. Alternatively, multi-threaded parallel computing could significantly reduce the processing time, especially when the computer or server has ample memory. We plan to use our strategy for more data analysis tasks and conduct a comprehensive examination using various clustering algorithms.
Acknowledgments
This study was supported by the China University Industry Research Innovation Fund (No. 2021DA12008), the Natural Science Basic Research Program of Shaanxi (Program No. 2022JQ-364), the China University Industry Research Innovation Fund (No. 2022IT230), the Qinhai IoT Key Laboratory (No. 2017-ZJ-Y21), and the Tibetan Information Processing and Machine Translation Key Laboratory of Qinghai Province (No. 2020-ZJ-Y05).
Conflict of interest
None to report.
References
[1] | Wang Z, Gerstein M, Snyder M. RNA-Seq: A revolutionary tool for transcriptomics. Nature Reviews Genetics. (2009) ; 10: (1): 57-63. |
[2] | Pirim H, Ekşioğlu B, Perkins AD, et al. Clustering of high throughput gene expression data. Computers & Operations Research. (2012) ; 39: (12): 3046-3061. |
[3] | Mukhopadhyay A, Maulik U. Towards improving fuzzy clustering using support vector machine: Application to gene expression data. Pattern Recognition. (2009) ; 42: (11): 2744-2763. |
[4] | Zeng Y, Xu Z, He Y, Rao Y. Fuzzy entropy clustering by searching local border points for the analysis of gene expression data. Knowledge-Based Systems. (2020) ; 190: : 105309. |
[5] | Pandey KK, Shukla D. Min max kurtosis distance based improved initial centroid selection approach of K-means clustering for big data mining on gene expression data. Evolving Systems. (2023) ; 14: (2): 207-244. |
[6] | Eisen MB, Spellman PT, Brown PO, Botstein D. Cluster analysis and display of genome-wide expression patterns. Proceedings of the National Academy of Sciences. (1998) ; 95: (25): 14863-14868. |
[7] | Tavazoie S, Hughes JD, Campbell MJ, Cho RJ, Church GM. Systematic determination of genetic network architecture. Nature Genetics. (1999) ; 22: (3): 281-285. |
[8] | Herwig R, Poustka AJ, Müller C, Bull C, Lehrach H, O’Brien J. Large-scale clustering of cDNA-fingerprinting data. Genome Research. (1999) ; 9: (11): 1093-1105. |
[9] | Sawa T, Ohno-Machado L. A neural network-based similarity index for clustering DNA microarray data. Computers in Biology and Medicine. (2003) ; 33: (1): 1-15. |
[10] | Balasubramaniyan R, Hüllermeier E, Weskamp N, Kamper J. Clustering of gene expression data using a local shape-based similarity measure. Bioinformatics. (2005) ; 21: (7): 1069-1077. |
[11] | Son YS, Baek J. A modified correlation coefficient based similarity measure for clustering time-course gene expression data. Pattern Recognition Letters. (2008) ; 29: (3): 232-242. |
[12] | Jothi R, Mohanty SK, Ojha A. Gene expression clustering using local neighborhood-based similarity measure. Computers & Electrical Engineering. (2021) ; 91: : 107032. |
[13] | Hou J, Ye X, Feng W, Zhang Q, Han Y, Liu Y, et al. Distance correlation application to gene co-expression network analysis. BMC Bioinformatics. (2022) ; 23: (1): 1-24. |
[14] | Wu HM. On biological validity indices for soft clustering algorithms for gene expression data. Computational Statistics & Data Analysis. (2011) ; 55: (5): 1969-1979. |
[15] | Cho RJ, Campbell MJ, Winzeler EA, Steinmetz L, Conway A, Wodicka L, et al. A genome-wide transcriptional analysis of the mitotic cell cycle. Molecular Cell. (1998) ; 2: (1): 65-73. |
[16] | Yeung KY, Fraley C, Murua A, Raftery E, Ruzzo WL. Model-based clustering and data transformations for gene expression data. Bioinformatics. (2001) ; 17: (10): 977-987. |
[17] | Desgraupes B. Clustering indices. University of Paris Ouest-Lab Modal’X. (2013) ; 1: (1): 34. |
[18] | Analytics R, Weston S. doParallel: Foreach parallel adaptor for the parallel package. R Package Version. (2014) ; 1: (8): 2014. |
[19] | Langfelder P, Horvath S. WGCNA: An R package for weighted correlation network analysis. BMC Bioinformatics. (2008) ; 9: (1): 1-13. |
[20] | Jiang D, Tang C, Zhang A. Cluster analysis for gene expression data: A survey. IEEE Transactions on Knowledge and Data Engineering. (2004) ; 16: (11): 1370-1386. |
[21] | Yang C, Wan B, Gao X. Effectivity of internal validation techniques for gene clustering. Biological and Medical Data Analysis: 7th International Symposium, ISBMDA 2006, Thessaloniki, Greece. (2006) ; 49-59. |
[22] | Brock G, Pihur V, Datta S. clValid: An R package for cluster validation. Journal of Statistical Software. (2008) ; 25: : 1-22. |
[23] | Chen M, Jia S, Xue M, et al. Dual-Stream Subspace Clustering Network for revealing gene targets in Alzheimer’s disease. Computers in Biology and Medicine. (2022) ; 151: : 106305. |


