
A novel approach for estimating initial sound level for speech reception threshold test
Abstract
BACKGROUND:
The speech reception threshold (SRT), synonymous with the speech recognition threshold, denotes the minimum hearing level required for an individual to discern 50% of presented speech material. This threshold is measured independently in each ear with a repetitive up-down adjustment of stimulus level starting from the initial SRT value derived from pure tone thresholds (PTTs), measured via pure-tone audiometry (PTA). However, repetitive adjustments in the test contributes to increased fatigue for both patients and audiologists, compromising the reliability of the hearing tests.
OBJECTIVE:
Determining the first (initial) sound level closer to the finally determined SRT value, is important to reduce the number of repetitions. The existing method to determine the initial sound level is to average the PTTs called pure tone average (PTAv).
METHODS:
We propose a novel method using a machine learning approach to estimate a more optimal initial sound level for the SRT test. Specifically, a convolutional neural network with 1-dimensional filters (1D CNN) was implemented to predict a superior initial level than the conventional methods.
RESULTS:
Our approach produced a reduction of 37.92% in the difference between the initial stimulus level and the final SRT value.
CONCLUSIONS:
This outcome substantiates that our approach can reduce the repetitions for finding the final SRT, and, as the result, the hearing test time can be reduced.
1.Introduction
Hearing loss is associated with critical health issues, including heart conditions, cognitive decline, dementia, and various chronic diseases [1, 2]. Hearing tests evaluate the auditory ability of a patient, with several types of hearing tests. Among them, along with the bone-conduction test, pure tone audiometry (PTA) performed by air-conduction is the most common test to find the quietest volume the patient can hear at some frequencies [3]. The lowest volume levels are termed pure tone thresholds (PTTs). Speech audiometry (SA) is important for assessing the applicability of hearing aids and includes sub-tests such as the speech reception threshold (SRT) test [4].
The SRT test often validates PTA results [5], measuring the lowest hearing level required for recognizing language or speech through a “listen and repeat” process [6] for a set of words with sound level adjustment. The repetition continues until 50% of the words are successfully repeated, defining the sound level as SRT [5]. In the current method, the starting sound level for the repetitive process is determined by the pure tone average (PTAv), an average of PTTs at specified frequency components [4].
However, repetitive adjustment in the test leads to increased fatigue for both patients and the audiologist, causing the hearing test to have low reliability. Determining the first (initial) sound level closer to the finally determined SRT value is important to reduce repetitions.
This study proposes a novel method using a machine-learning approach to estimate a better initial sound level for the SRT test using machine learning approach. A convolutional neural network with 1-dimensional filters (1D CNN) was used to predict a better initial sound level than existing methods determining the initial level by PTAv, a linear combination of PTTs. Our approach produced 37.92% less difference between the initial sound level and the final SRT value, supporting that our approach can reduce repetitions for finding the final SRT and, as a result, the hearing test time can be reduced.
2.Related works and current methods
2.1Air-conduction audiometry
Audiometry is the gold standard testing method for evaluating hearing availability by sound [7]. Two types of audiometry exist: air conduction (AC) and bone conduction. Pure tone and speech tone are involved in AC audiometry. Pure tone is used to determine the type and degree of hearing loss [8, 9], while speech tone is used to examine the applicability of hearing aids [5]. This section introduces detailed descriptions of pure tone and speech audiometry for the AC test.
2.1.1Pure tone audiometry
PTA aims to find the lowest hearing levels with sine wave sounds, termed pure tones [3]. Using different frequencies of pure tones, the hearing thresholds of patients corresponding to the frequencies, known as PTTs, are measured [6]. The PTA procedure for measuring PTTs is shown in Fig. 1.
Figure 1.
Procedure of measuring pure tone thresholds.
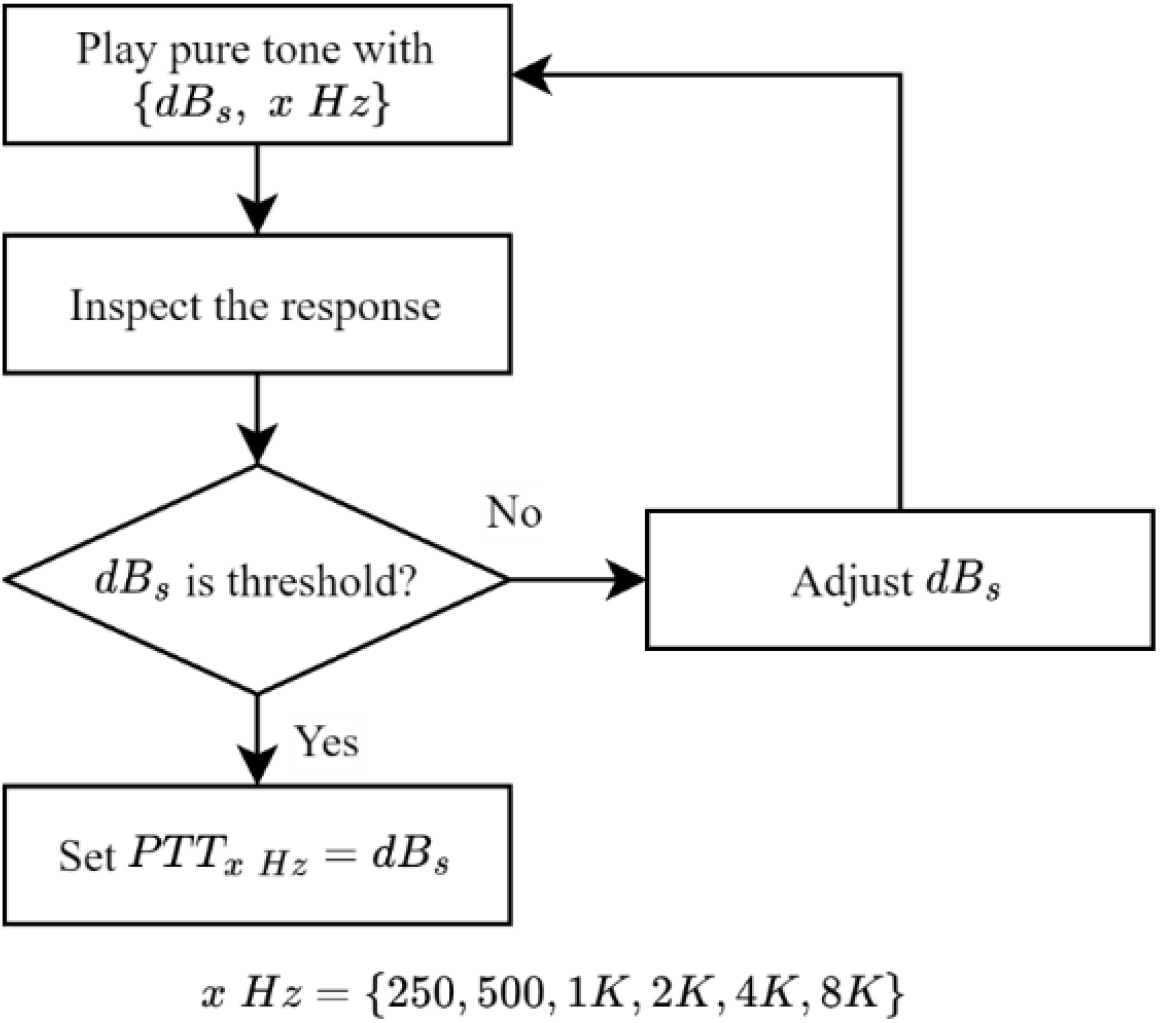
First, a patient was instructed to wear an AC headset in a soundproof booth and press a feedback button upon hearing a sound. After that, the pure tone sounds with
As the result of the PTA for a patient, two data sets corresponding to the left and the right ears, each with six PTTs, were obtained as described in the Eq. (1).
(1)
where
2.1.2Pure tone average
The current method for finding the initial sound level for repetitive adjustment in the SRT testing process, described in the following section, was to compute a PTAv [10]. PTAv is considered an average of PTTs at specified frequency components, typically 0.5 K, 1 K, 2 K, and 4 KHz. The PTAv value measures the average hearing sensitivity of the patient at various frequency sounds in each ear. The outermost frequencies were not included in the PTAv calculation because most information on speech sounds was mainly represented in the mid frequencies. Three PTAv calculations were 3 frequencies average (3FA), weighted 3 frequencies average (W3FA), and weighted 4 frequencies average (W4FA), with equations given in Eqs (2)–(4).
(2)
(3)
(4)
Incorporating modified equations representing the average hearing sensitivity for various frequencies, the chosen PTAv, the value is used as the starting sound level for repetitive adjustment in determining find the SRT value. Consequently, with a PTAv closer to the finally determined SRT value, the number of repetitions can be reduced. This is the motivation of this study to find a better initial level for SRT adjustment.
2.1.3Speech audiometry
In human communication, it is important not only to hear pure tone frequencies, but also to hear words. Given that hearing aids represent a prevalent treatment for hearing loss, evaluating their applicability is essential and accomplished through speech audiometry. Among various tests in SA, the SRT test holds particular significance because it measures the lowest hearing level with speech. The procedure of the SRT test is shown in Fig. 2.
Figure 2.
Procedure of speech reception threshold test.
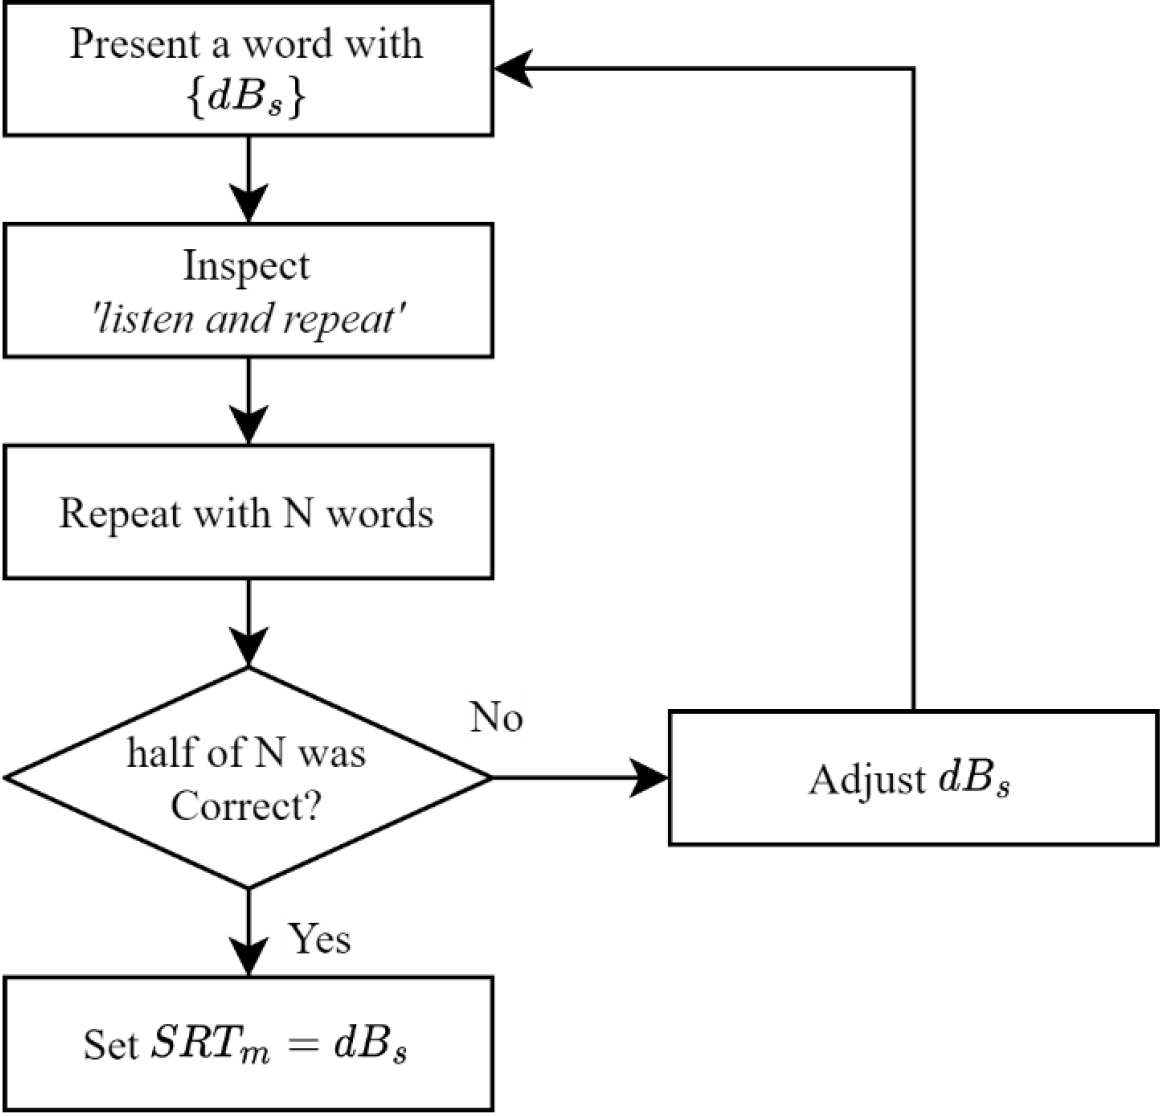
The patient was instructed to do a “listen and repeat” which means involving the vocal repetition of heard words [6]. The audiologist initiated the presentation of a word with
As described in Fig. 2, the “listen and repeat” process was time-consuming, and patients, especially those required to discern small sound words, easily experienced fatigue. Minimizing the number of adjustments was imperative to simplify the entire hearing test and reduce patient fatigue. Note that, currently a PTAv [10] is used. This study proposes a machine learning approach to predict a better starting sound level
2.21D convolutional neural network
A convolutional neural network (CNN) is a neural network-based machine learning technique [11]. This algorithm integrates a 2-dimensional convolution layer, performing feature extraction through convolutional filtering operations, with a multi-layer feed-forward neural network. Although it is commonly used for image classification and segmentation due to its 2-dimensional operations [12], it is also adaptable to 1-dimensional signal data using a 1D convolution layer, referred to as a 1D CNN [13]. The multi-layer feed-forward neural network, also known as a multi-layer perceptron (MLP), is connected after the convolution layer to produce output values [14]. The activation function for neurons in both layers is typically non-linear, such as ReLU and Sigmoid [11]. Parameters for both layers are learned through the error back-propagation rule [15].
3.Motivation and goal
As detailed in Section 2.1.2, the SRT for a patient
PTAv such as 3FA, W3FA, or W4FA in SA is assumed to be similar to the
Hence, obtaining a more optimal starting sound level one closer to the true or finally determined SRT value
(5)
Note that the existing method used the PTAv for
4.Dataset description
AC audiometry data was obtained from Chonnam National University Hospital in Korea, which were collected from 8,936 patients experiencing hearing difficulties. The data collection followed the procedure outlined in Section 2. The dataset comprised the following components: ID (patient identification number), ear (left or right),
Table 1
Components of data
| Feature | Dimension | Unit |
|---|---|---|
| ID | 1 | – |
| Ear | 1 | “L”, “R” |
|
| 6 | dB |
|
| 1 | dB |
The data was treated as independent data in this study because the hearing test was conducted separately on both “L” and “R” ears. Therefore, the total number of original data was 17,872, equivalent to twice the number of patients. However, acknowledging the presence of various human errors during the PTA, a meticulous selection process was undertaken. We carefully cleansed data by addressing issues such as missing values or redundancy. Finally, 10481 data were discerned as non-erroneous and deemed suitable for inclusion in this study.
5.SRT prediction with CNN
5.1CNN model architecture
In this study, the CNN model showing the state-of-the-art performance in many fields, was used [13, 14]. Alternatively, any other model capable of accurately predicting
Table 2
CNN model architecture
| Layer | No | Parameter | |
|---|---|---|---|
| Input | 1 | Input size: (6) | |
| Hidden | Convolution | 4 | Filter size: (3) No. of filters: 16 Activation: ReLU Padding: zero padding |
| Flatten | 1 | 96 output/input (1D) | |
| Fully connected | 2 | No. of neurons: 32 Activation: ReLU | |
| Output | 1 | No. of neurons: 1 Activation: linear | |
The architecture and hyper-parameters of the CNN model are summarized in Table 2. Note that, the architecture can significantly impact performance. However, detailed optimization of architecture and training parameters, such as drop-out, stride, batch normalization, and pooling [12], was not the primary focus because the primary goal was to introduce a novel approach employing machine learning techniques to reduce hearing test time by determining an optimal starting sound level. Further investigation into the ideal architecture for the model is recommended for enhanced performance.
The flatten layer transformed the outputs of 16 filters, each containing six values, into a flattened vector format of 96 values. This flattened vector served as the input to the fully connected layer. The output neuron had linear activation function, representing
(6)
where
5.2Training the CNN model
We randomly split the 10,481-sample data into two subsets for training and testing in a 50:50 ratio. The 1D CNN model was trained with the training subset to minimize the mean absolute error (MAE) defined by the Eq. (7):
(7)
where
The proposed 1D CNN model was trained using a learning rate of 0.0001, using the ADAM algorithm as the optimization method, which is widely used in deep learning fields. The maximum training epoch was set at 10,000, and the MAE on the test subset was evaluated at each epoch to select the model with the best performance on the test subset. We again note that the primary focus was not on fine-tuning the architecture and training parameters.
The training and testing episode was iterated ten times to eliminate dependencies on data separation and parameter initialization, each time employing new data separation and initial parameters. Subsequently, we computed assessments for each episode, including the best, worst, and average outcomes. Further details are explained in the subsequent section.
6.Result and analysis
6.1Result of model train
Figure 3.
Error curves for training data (a) and testing data (b).
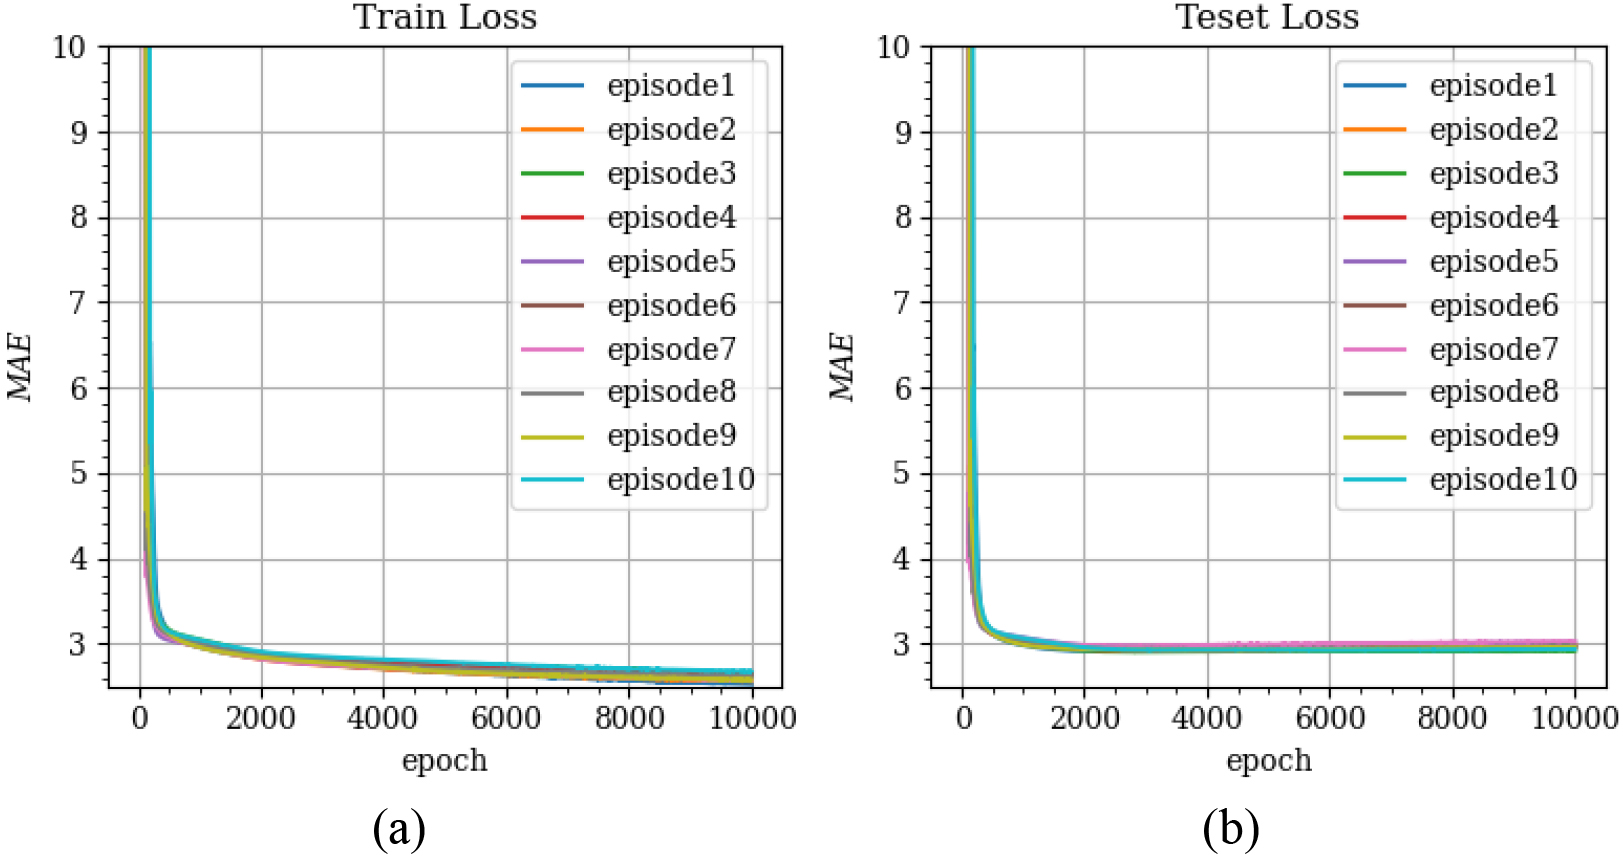
The training progress is visualized in Fig. 3 through the
6.2Prediction comparison
MAE values were computed for the conventional approaches 3FA, W3FA, and W4FA, employing the following equation to facilitate a comparison with conventional approaches elucidated in Section 2:
(8)
where
Table 3
Average result of ten repetition
| Dataset |
| |
|---|---|---|
| Training | Average | 2.64 dB |
| Best | 2.57 dB | |
| Worst | 2.71 dB | |
| Testing | Average | 2.96 dB |
| Best | 2.91 dB | |
| Worst | 3.01 dB | |
Table 4
Comparison of SRT prediction
| Conventional method |
|
|
|---|---|---|
| 3FA | 4.76 dB | 37.92% |
| W3FA | 4.74 dB | 37.59% |
| W4FA | 3.86 dB | 23.35% |
As observed in Table 4, our machine learning approach reduced the SRT test time because of lower
6.3Discussion
In hearing tests, the most time-consuming aspect is the SRT test, involving the repetitive “listen and repeat” process with continuous adjustments of sound levels based on the responses of the patient. Prolonged test durations pose significant challenges because the monotonous nature of the “listen-and-repeat” process may lead to patient non-cooperative, resulting in unreliable test outcomes and inaccurate designs for hearing aids. Additionally, extended test times can inconvenience other patients who must wait for their turn. Therefore, our proposed approach is a promising solution to reduce the overall testing time by accurately predicting the SRT closer to its final value.
We did not focus on finding the optimal machine learning model and its parameters, while this study empirically demonstrates the successful application of machine learning techniques to reduce hearing test times. Hence, those implementing our approach for enhanced results should conduct further investigations to find a superior model and its associated parameters. Moreover, all experiments were performed using a dataset not specifically collected for our approach, limiting the comparison with conventional methods solely to MAE values. However, the number of repetitions for adjusting the sound level for the “listen and repeat” process should be compared.
7.Conclusion
In hearing tests, measuring SRT requires repeating the “listen and repeat” process with iterative adjustments to the sound level. This repetitive testing procedure makes the test inefficient, causes fatigue for both the audiologist and the patient, thereby compromising the reliability of the test. The starting sound level should be closer to the finally determined SRT value to address the challenge of reducing repetitions in the SRT test. The conventional method has traditionally employed PTAv as the starting value.
While the PTAv has been deemed appropriate for initiating the SRT test, it represents a simple linear combination of PTTs and lacks consideration for the non-linear properties between PTTs. This study proposed a machine learning approach to estimate a more accurate starting sound level for the SRT test. Our proposed approach used a 1D CNN model with 1D convolution filters to predict the optimal starting sound level. The model was trained to accurately predict SRT values as outputs based on the PTTs as input values.
The CNN prediction model reduced MAE by up to 37.92% compared with the conventional method. Therefore, our approach has the potential to streamline hearing test times by estimating a more precise starting sound value, resulting in fewer repetitions of the SRT test. While this study experimentally proved the applicability of machine learning techniques in reducing hearing test times, we did not focus on finding an optimal machine learning model and its parameters. Hence, those implementing our approach for improved results should investigate to ascertain a superior model and its associated parameters.
Furthermore, this study exclusively used the dataset of pure tone AC audiometry, and the applicability of bone-conduction audiometry warrants consideration. Additionally, our machine learning approach holds promise for enhancing other tests assessing hearing abilities, such as most comfortable level (MCL) and word recognition score (WRS).
Acknowledgments
This work was supported by Innovative Human Resource Development for Local Intellectualization program through the Institute of Information & Communications Technology Planning & Evaluation (IITP) grant funded by the Korea government (MSIT) (IITP-2024-00156287).
Conflict of interest
None to report.
References
[1] | Nadhimi Y, Llano DA. Does hearing loss lead to dementia? A review of the literature. Hearing Research. (2021) ; 402: : 108038. doi: 10.1016/j.heares.2020.108038. |
[2] | Baiduc RR, Sun JW, Berry CM, Anderson M, Vance EA. Relationship of cardiovascular disease risk and hearing loss in a clinical population. Scientific Reports. (2023) ; 13: (1). doi: 10.1038/s41598-023-28599-9. |
[3] | Ristovska L, Jachova Z, Kovacevic J, Radovanovic V, Hasanbegovic H. Correlation between pure tone thresholds and speech thresholds. Journal Human Research in Rehabilitation. (2021) ; 11: (2): 120-5. doi: 10.21554/hrr.092108. |
[4] | Hamid MA, Brookler KH. Speech audiometry. Ear, Nose & Throat Journal. (2006) ; 85: (12): 810-2. doi: 10.1177/014556130608501207. |
[5] | Georgescu MG, Stan CI, Marinescu AN, Paun DL. Nonorganic hearing loss. malingering, factitious or conversion disorder? Romanian Journal of Legal Medicine. (2014) ; 22: (1): 35-40. doi: 10.4323/rjlm.2014.35. |
[6] | Kim H, Park J, Choung Y-H, Jang JH, Ko J. Predicting speech discrimination scores from pure-tone thresholds – a machine learning-based approach using data from 12,697 subjects. PLOS ONE. (2021) ; 16: (12). doi: 10.1371/journal.pone.0261433. |
[7] | de Oliveira Beck RM, Ramos BF, Grasel SS, Ramos HF, de Moraes MF, de Almeida ER, et al. Comparative study between pure tone audiometry and auditory steady-state responses in normal hearing subjects. Brazilian Journal of Otorhinolaryngology. (2014) ; 80: (1): 35-40. doi: 10.5935/1808-8694.20140009. |
[8] | Lin H-Y, Shih S-C, Chuang C-K, Lee K-S, Chen M-R, Lin H-C, et al. Assessment of hearing loss by pure-tone audiometry in patients with mucopolysaccharidoses. Molecular Genetics and Metabolism. (2014) ; 111: (4): 533-8. doi: 10.1016/j.ymgme.2014.02.003. |
[9] | Ahn JH, Lee H, Kim Y, Yoon TH, Chung JW. Comparing pure-tone audiometry and auditory steady state response for the measurement of hearing loss. Otolaryngology-Head and Neck Surgery. (2007) ; 136: (6): 966-71. doi: 10.1016/j.otohns.2006.12.008. |
[10] | Kim JM, Na MS, Jung KH, Lee SH, Han JS, Lee OH, et al. The best-matched pure tone average and speech recognition threshold for different audiometric configurations. Korean Journal of Otorhinolaryngology-Head and Neck Surgery. (2016) ; 59: (10): 725. doi: 10.3342/kjorl-hns.2016.59.10.725. |
[11] | Krizhevsky A, Sutskever I, Hinton GE. ImageNet classification with deep convolutional Neural Networks. Communications of the ACM. (2017) ; 60: (6): 84-90. doi: 10.1145/3065386. |
[12] | Li Z, Liu F, Yang W, Peng S, Zhou J. A survey of Convolutional Neural Networks: Analysis, applications, and prospects. IEEE Transactions on Neural Networks and Learning Systems. (2022) ; 33: (12): 6999-7019. doi: 10.1109/tnnls.2021.3084827. |
[13] | Kiranyaz S, Avci O, Abdeljaber O, Ince T, Gabbouj M, Inman DJ. 1d convolutional neural networks and applications: A survey. Mechanical Systems and Signal Processing. (2021) ; 151: : 107398. doi: 10.1016/j.ymssp.2020.107398. |
[14] | Ramchoun H, Amine M, Idrissi J, Ghanou Y, Ettaouil M. Multilayer perceptron: Architecture optimization and training. International Journal of Interactive Multimedia and Artificial Intelligence. (2016) ; 4: (1): 26. doi: 10.9781/ijimai.2016.415. |
[15] | Rumelhart DE, Hinton GE, Williams RJ. Learning representations by back-propagating errors. Nature. (1986) ; 323: (6088): 533-6. doi: 10.1038/323533a0. |


