
Neural networks prediction of the protein-ligand binding affinity with circular fingerprints
Abstract
BACKGROUND:
Protein-ligand binding affinity is of significant importance in structure-based drug design. Recently, the development of machine learning techniques has provided an efficient and accurate way to predict binding affinity. However, the prediction performance largely depends on how molecules are represented.
OBJECTIVE:
Different molecular descriptors are designed to capture different features. The study aims to identify the optimal circular fingerprints for predicting protein-ligand binding affinity with matched neural network architectures.
METHODS:
Extended-connectivity fingerprints (ECFP) and protein-ligand extended connectivity fingerprints (PLEC) encode circular atomic and bonding connectivity environments with the preference for intra- and inter-molecular features, respectively. Densely-connected neural networks are employed to map the circular fingerprints of protein-ligand complexes to binding affinities
RESULTS:
The performance of neural networks is sensitive to the parameters used for ECFP and PLEC fingerprints. The R2_score of the evaluated ECFP and PLEC fingerprints reaches 0.52 and 0.49, higher than that of the improperly set ECFP and PLEC fingerprints with R2_score of 0.45 and 0.38, respectively. Additionally, compared to the predictions from the standalone fingerprints, the ECFP+PLEC conjoint ones slightly improve the prediction accuracy with R2_score of approximately 0.55.
CONCLUSION:
Both intra- and inter-molecular structural features encoded in the circular fingerprints contribute to the protein-ligand binding affinity. Optimizing the parameters of ECFP and PLEC can enhance performance. The conjoint fingerprint scheme can be generally extended to other molecular descriptors for enhanced feature engineering and improved predictive performance.
1.Introduction
As biomolecules are essential components of living systems, understanding their biological, chemical, and physical properties is crucial in elucidating their functions. Quantitative structure-activity/property relationship (QSAR/QSPR) models have been developed to establish the link between molecular structures and properties [1, 2]. In particular, protein-ligand binding affinity is of significant importance in QSAR/QSPR studies [3, 4]. Although various approaches have been developed for predicting binding affinity, recent advances in machine-learning techniques have paved an alternative way that offers impressive efficiency and accuracy in prediction [5, 6].
By converting molecular structures into computer-readable feature vectors, machine learning maps the input structural features through hierarchical non-linear functions to the output molecular properties. However, the prediction performance depends on how molecules are represented. Many types of molecular descriptors have been designed to meet the different demands of structure-property modeling [7, 8, 9, 10, 11, 12]. Binding affinity of a protein-ligand complex is related to three types of interactions: intra-protein, intra-ligand, and inter-protein-ligand. In this study, two types of circular fingerprints are used to capture the intra-molecular and inter-molecular structural and interaction information. Specifically, the intra-protein and intra-ligand features are encoded by the extended-connectivity fingerprints (ECFP) [7], and the inter-molecular features are encoded by the protein-ligand extended connectivity fingerprints (PLEC) [10]. Neural networks are employed to learn features from the circular fingerprints to evaluate the effects of intra- and inter-molecular features on protein-ligand binding affinity. The improved performance from the conjoint (ECFP+PLEC) fingerprints further suggests that these two fingerprints can provide complementary information for predicting molecular properties of complex systems.
2.Materials and methods
2.1Protein-ligand binding data
The PDBbind database [13] holds a PDB-wide collection of experimentally measured binding affinities for the protein-ligand complexes with known 3D structures. The refined set of PDBbind is selected in this study due to its higher quality binding affinity data in the form of dissociation constant
2.2ECFP fingerprints
As shown in Fig. 1A, the ECFP generation process assigns an integer identifier to each substructure feature, denoted by a central atom and a diameter, by a hashing procedure. The positions of “1” bits (representing the presence of particular substructures) in the fixed-length binary vector representation are derived from these integer identifiers. There are two major parameters: maximum diameter (
Figure 1.
Constructions of the ECFP (A) and PLEC (B) fingerprints. (C) Neural network architecture for the molecular fingerprints-based protein-ligand binding affinity prediction.
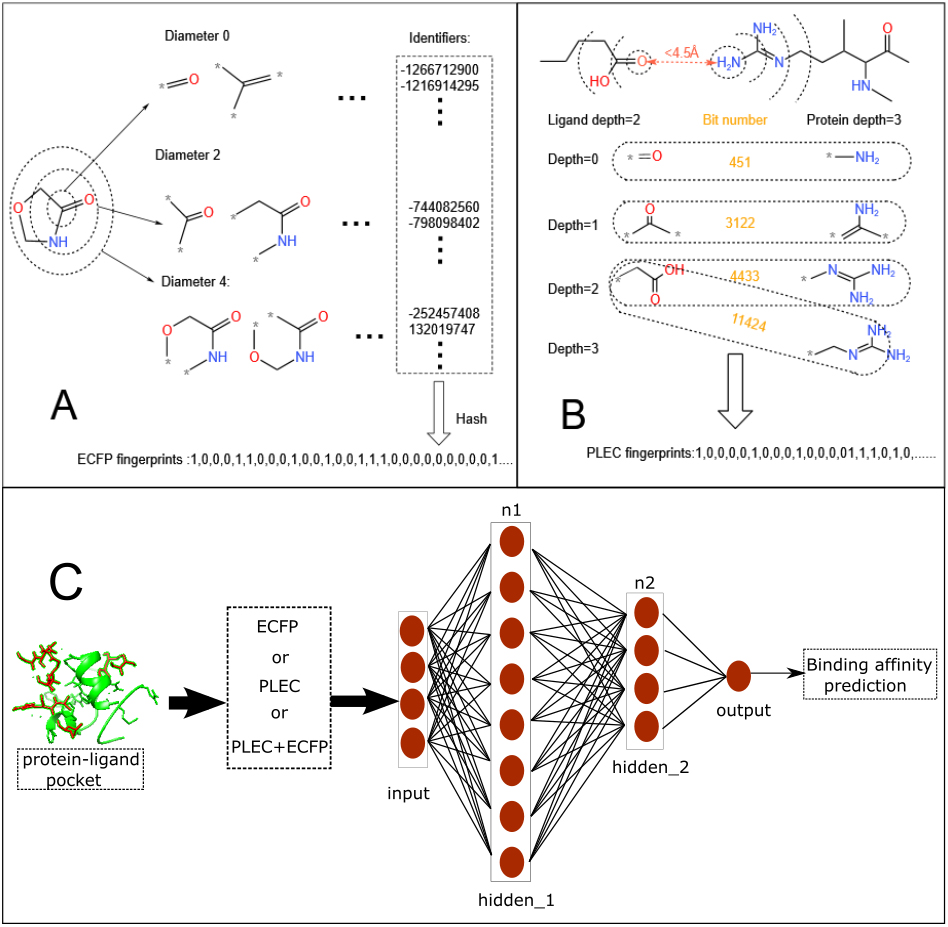
2.3PLEC fingerprints
The PLEC generation process, as depicted in Fig. 1B, involves the identification of a pair of interacting atoms (from the protein and ligand, respectively) if the distance between them is within a distance cut-off (in 3D). As with the ECFP generation process shown in Fig. 1A, the substructures denoted by the central atom itself and its atomic neighbors and bonding connectivity (up to the predefined maximum diameter, i.e., depth) are generated for each atom. An integer identifier is then assigned to each pair of substructures and the positions of “1” bits in the fixed-length binary vector representation are derived from these identifiers. There are four major parameters: distance cut-off, protein depth (
2.4Neural networks and performance metrics
As shown in Fig. 1C, a densely-connected neural network (DNN) is adopted to predict the protein-ligand binding affinities. We set the number of hidden layers to be two and train the DNN with different number of neurons in hidden layers (
Binding affinity prediction is a single-valued regression task. The mean squared error (MSE), mean absolute error (MAE), Pearson correlation coefficient (
3.Results
3.1Intra- and inter-molecular features
To encode exclusively the intra-molecular (intra-protein and intra-ligand) structural features within the pocket region, we generate the ECFP fingerprints of protein-ligand complexes as follows: (i) ECFP fingerprints are calculated separately for the protein pocket (ECFP
By definition, PLEC fingerprints encode circular environments for all atom pairs in contact between a protein and its ligand. Unlike ECFP, PLEC fingerprints exclusively account for inter-molecular interaction features within the pocket region of a protein-ligand complex. It should be noted that while the ECFP environment is based solely on a molecule’s topology to describe the physicochemical properties of a central atom, the selection of atom pairs in contact actually involves the 3D structural information of the protein-ligand complex.
The tested range of (
Figure 2.
The loss in the training and validation subsets (A) and the scatter plot of the predicted pK vs. experimentally determined pK (B) for
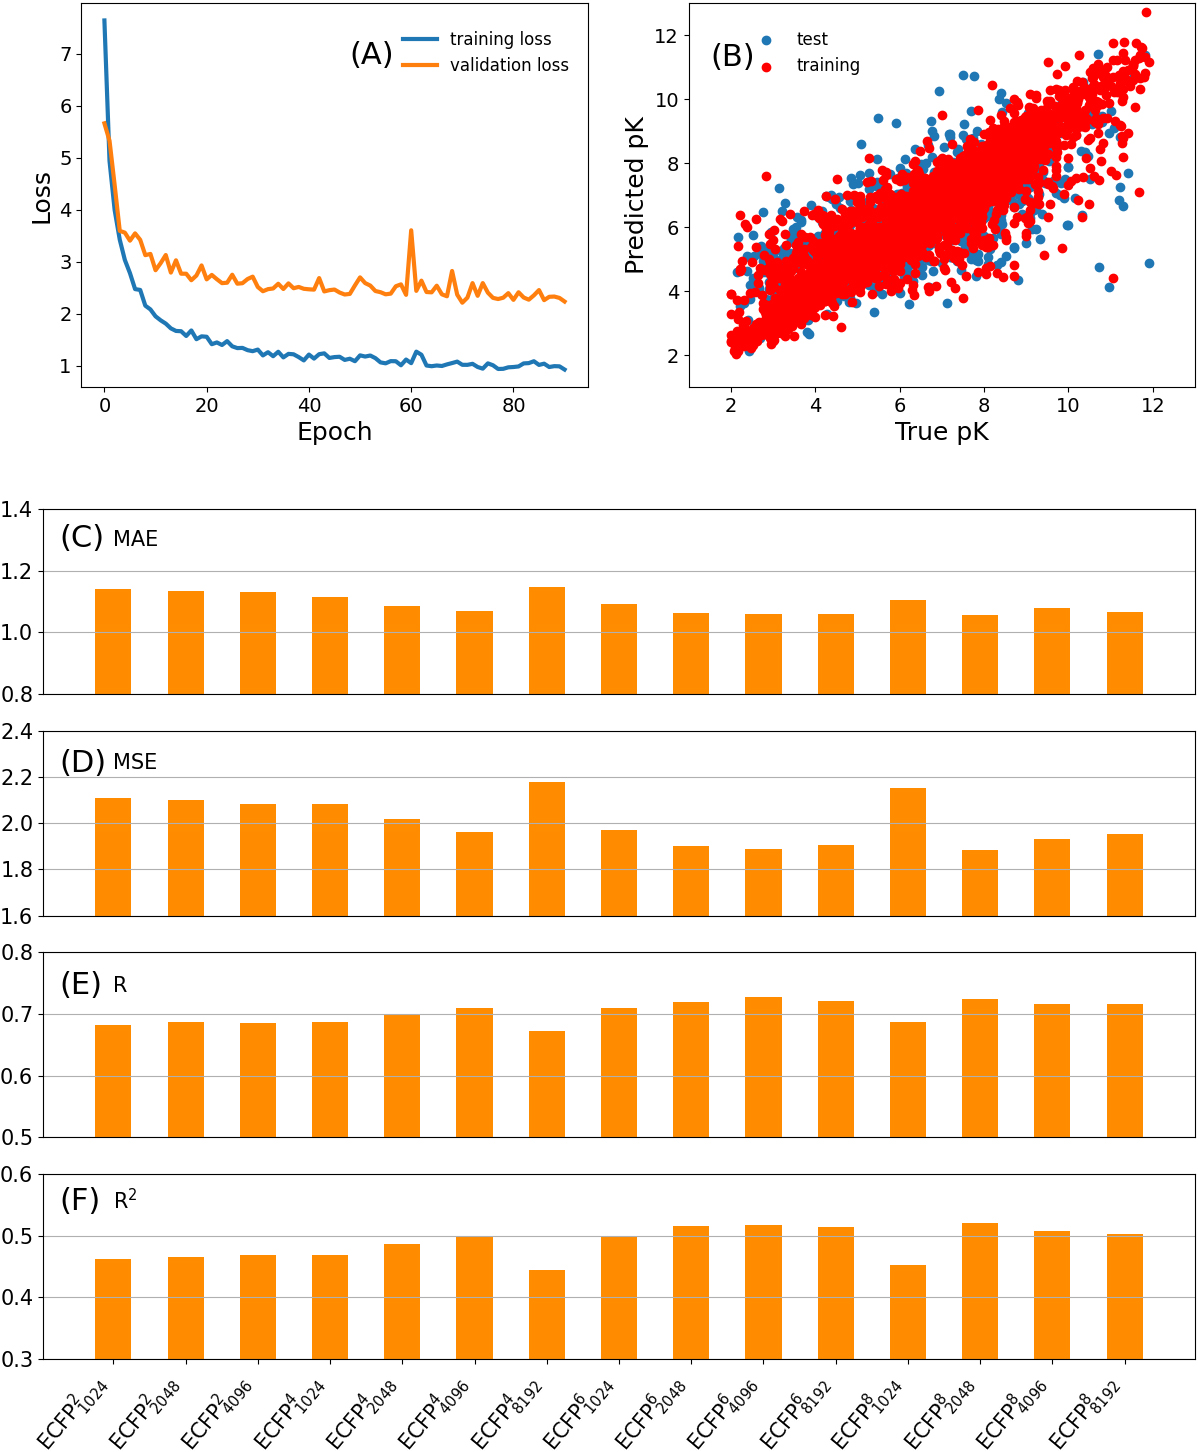
3.2ECFP performance
The loss (MSE) can be tracked during the DNN training process. Figure 2A gives the loss in the training and validation subsets for the
To quantitatively evaluate the predictive performance of different ECFP fingerprints, we calculate the MAE, MSE,
Figure 3.
The loss in the training and validation subsets (A) and the scatter plot of the predicted pK vs. experimentally determined pK (B) for
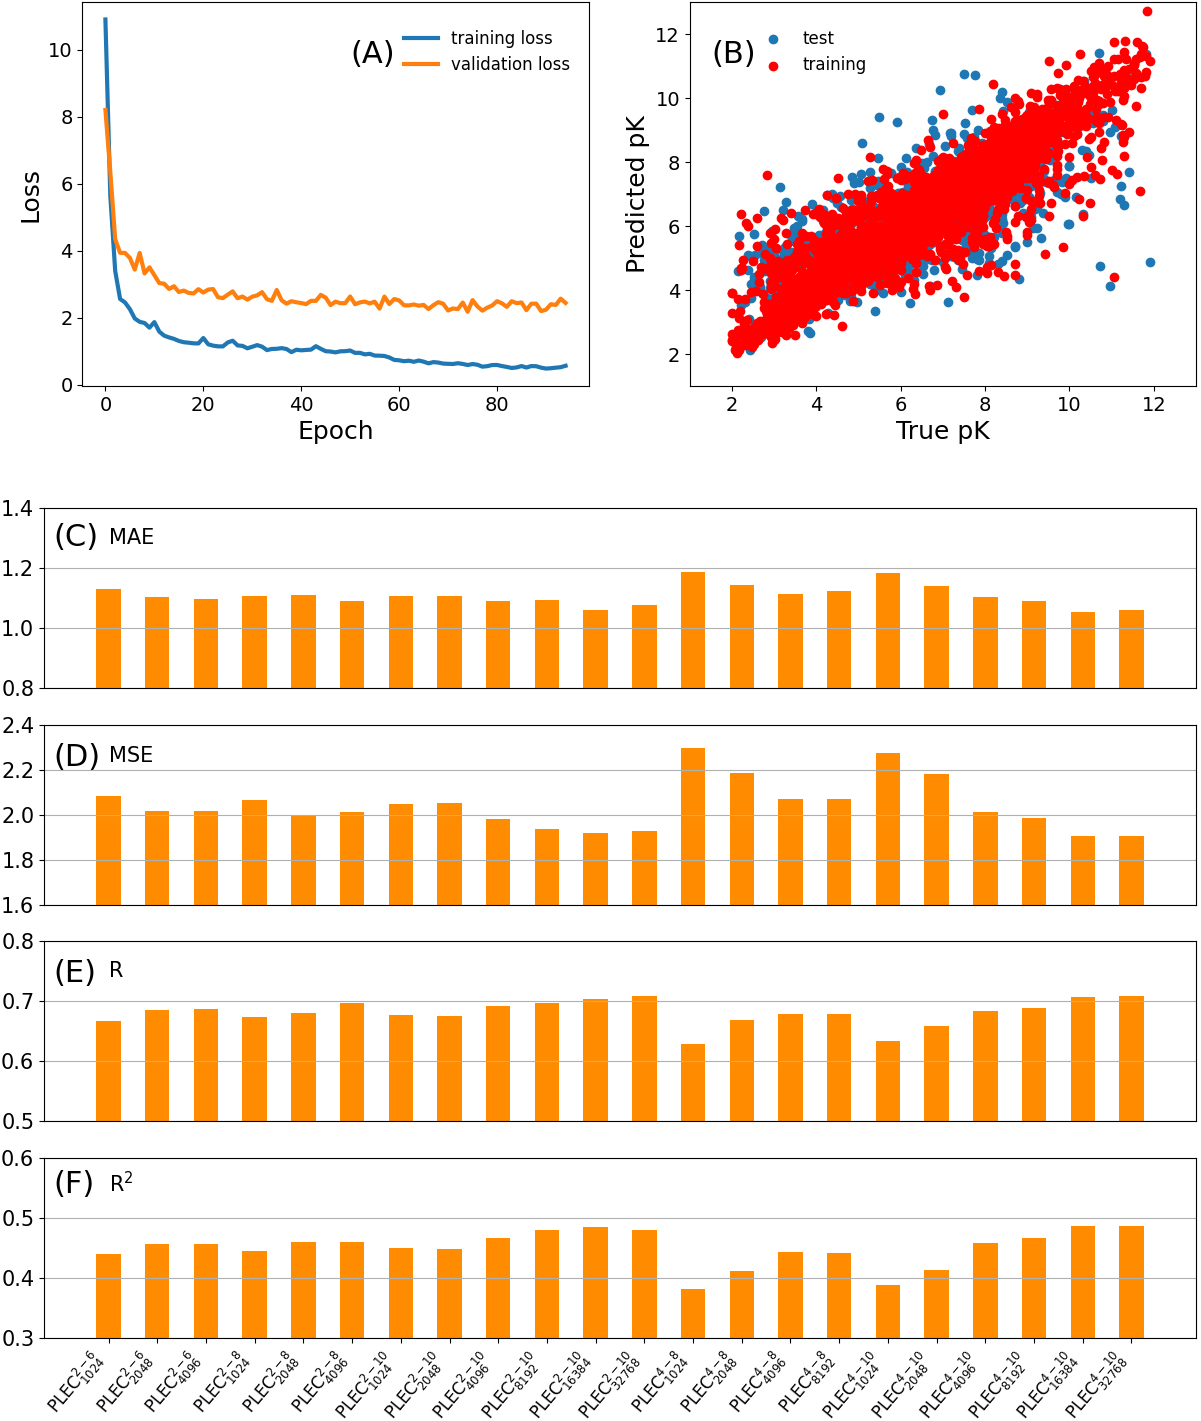
3.3PLEC performance
As depicted in Fig. 3A and B for
3.4ECFP+PLEC performance
We select two of the top-performing ECFP fingerprints (
Table 1
Performance (
| Fingerprints | RF | XGBoost | LightGBM | DNN |
|---|---|---|---|---|
|
| 0.53 | 0.53 | 0.53 | 0.52 |
|
| 0.52 | 0.53 | 0.53 | 0.52 |
|
| 0.49 | 0.48 | 0.48 | 0.48 |
|
| 0.47 | 0.48 | 0.47 | 0.49 |
|
| 0.57 | 0.56 | 0.55 | 0.55 |
|
| 0.55 | 0.54 | 0.54 | 0.55 |
|
| 0.57 | 0.56 | 0.55 | 0.54 |
|
| 0.56 | 0.56 | 0.55 | 0.54 |
In addition to the choice of molecular representation, the performance of machine learning is also influenced by the underlying algorithms used for feature engineering. As listed in Table 1, we test the performances of three typical machine learning algorithms, i.e., random forest (RF), XGBoost and LightGBM. However, the similar predictive performances of all four models indicate that altering the feature engineering algorithm may not significantly improve the prediction accuracy. The information of presence/absence of substructures alone is limited and not sufficient for accurately predicting the binding affinities of protein-ligand complexes. Additional information, such as the positions of substructures, may be beneficial for improving predictions. Therefore, properly encoding the spatial information of identified substructures remains a challenge for the further development of circular fingerprints-based molecular descriptors.
4.Discussion
The independent nature of the substructures represented by the “1” bits in both ECFP and PLEC fingerprints suggests that the DNN model is a suitable choice, as it can effectively learn useful information from independent features of input data. The number of hidden layers (
Biomolecules are primarily composed of carbon, nitrogen, and oxygen atoms. Although their covalent bonding patterns differ, the substructures encoded by circular fingerprints (both ECFP and PLEC) are relatively limited, especially for proteins. To address this issue, various types of fingerprints are designed to encode specific aspects of molecular features. Conjoint fingerprints, which combine different types of fingerprints, are expected to be more informative and can achieve better performance than individual ones [15, 16, 17, 18]. In fact, binding affinities are determined by the 3D structures of protein-ligand complexes. Combining circular fingerprints with 3D ones, such as molecular surface fingerprints [11], may provide a more comprehensive representation of the underlying molecular structure and enhance predictive performance.
Furthermore, it is important to note that protein-ligand binding data is collected from different experimental platforms with their 3D structures solved in different resolutions. Directly analyzing the integrated data may lead to issues such as the batch effect [19, 20], resulting in limited predictive performance. To overcome these limitations, a promising approach is to combine molecular docking and molecular dynamics simulations [21, 22] with machine learning algorithms. This can provide a more accurate representation of the protein-ligand binding interactions and improve predictive performance.
5.Conclusions
In this study, we exclusively use two types of circular fingerprints, ECFP and PLEC, to encode the intra-molecular and inter-molecular structural features of protein-ligand complexes. The neural networks learning from the standalone fingerprints illustrates that both types of features contribute to the protein-ligand binding affinities. Through systematic testing of different ECFP and PLEC fingerprints, we identified the optimal combinations of the fingerprints with neural network architectures, which can be applied to various applications such as virtual screening, structure-activity relationship modeling and compound library analysis. The improved predictive performance from the ECFP+PLEC conjoint fingerprints suggests that the combination of two complementary fingerprints can better capture the molecular features and interactions that determine the protein-ligand binding affinity. We anticipate that the conjoint fingerprint scheme can be generally extended to other molecular descriptors for enhanced feature engineering and improved predictive performance.
Conflict of interest
The authors declare no conflict of interest.
Funding
This research was funded by the National Natural Science Foundation of China (12074151, 22003020) and the Natural Science Foundation of Jiangsu Province (BK20191031).
References
[1] | Danishuddin Khan AU. Descriptors and their selection methods in QSAR analysis: paradigm for drug design. Drug Discovery Today. (2016) ; 21: (8): 1291-1302. |
[2] | Khan PM, Roy K. Current approaches for choosing feature selection and learning algorithms in quantitative structure – activity relationships (QSAR). Expert Opinion on Drug Discovery. (2018) ; 13: (12): 1075-1089. |
[3] | Gilson MK, Zhou H. Calculation of Protein-Ligand Binding Affinities. Annual Review of Biophysics and Biomolecular Structure. (2007) ; 36: (1): 21-42. |
[4] | Fu H, Chen H, Blazhynska M, Lacam EGC, Szczepaniak F, Pavlova A, et al. Accurate determination of protein:ligand standard binding free energies from molecular dynamics simulations. Nature Protocols. (2022) ; 17: (4): 1114-1141. |
[5] | Bagherian M, Sabeti E, Wang K, Sartor MA, Nikolovska-Coleska Z, Najarian K. Machine learning approaches and databases for prediction of drug – target interaction: a survey paper. Briefings in Bioinformatics. (2021) ; 22: (1): 247-269. |
[6] | Dhakal A, McKay C, Tanner JJ, Cheng J. Artificial intelligence in the prediction of protein – ligand interactions: recent advances and future directions. Briefings in Bioinformatics. (2022) ; 23: (1): b476. |
[7] | Rogers D, Hahn M. Extended-Connectivity Fingerprints. Journal of Chemical Information and Modeling. (2010) ; 50: (5): 742-754. |
[8] | Lim J, Ryu S, Park K, Choe YJ, Ham J, Kim WY. Predicting Drug – Target Interaction Using a Novel Graph Neural Network with 3D Structure-Embedded Graph Representation. Journal of Chemical Information and Modeling. (2019) ; 59: (9): 3981-3988. |
[9] | Da C, Kireev D. Structural Protein-Ligand Interaction Fingerprints (SPLIF) for Structure-Based Virtual Screening: Method and Benchmark Study. Journal of Chemical Information and Modeling. (2014) ; 54: (9): 2555-2561. |
[10] | Wójcikowski M, Kukieka M, Stepniewska-Dziubinska MM, Siedlecki P. Development of a protein-ligand extended connectivity (PLEC) fingerprint and its application for binding affinity predictions. Bioinformatics. (2019) ; 35: (8): 1334-1341. |
[11] | Gainza P, Sverrisson F, Monti F, et al. Deciphering interaction fingerprints from protein molecular surfaces using geometric deep learning. Nature Methods. (2020) ; 17: (2): 184-192. |
[12] | Wang DD, Chan M, Yan H. Structure-based protein-ligand interaction fingerprints for binding affinity prediction. Computational and Structural Biotechnology Journal. (2021) ; 19: : 6291-6300. |
[13] | Wang R, Fang X, Lu Y, Wang S. The PDBbind Database: Collection of Binding Affinities for Protein-Ligand Complexes with Known Three-Dimensional Structures. Journal of Medicinal Chemistry. (2004) ; 47: (12): 2977-2980. |
[14] | Kingma DP, Ba J. Adam: a method for stochastic optimization. (2015) ; arXiv1412.6980. |
[15] | Tseng YJ, Hopfinger AJ, Esposito EX. The great descriptor melting pot: mixing descriptors for the common good of QSAR models. Journal of Computer-Aided Molecular Design. (2012) ; 26: (1): 39-43. |
[16] | Xie L, Xu L, Kong R, Chang S, Xu X. Improvement of prediction performance with conjoint molecular fingerprint in deep learning. Frontiers in Pharmacology. (2020) ; 11.606668. |
[17] | Rahaman O, Gagliardi A. Deep Learning Total Energies and Orbital Energies of Large Organic Molecules Using Hybridization of Molecular Fingerprints. Journal of Chemical Information and Modeling. (2020) ; 60: (12): 5971-5983. |
[18] | Mendolia I, Contino S, De Simone G, Perricone U, Pirrone R. EMBER – Embedding Multiple Molecular Fingerprints for Virtual Screening. International Journal of Molecular Sciences. (2022) ; 23: (4):2156. |
[19] | Huang H, Wu N, Liang Y, Peng X, Shu J. SLNL: A novel method for gene selection and phenotype classification. International Journal of Intelligent Systems. (2022) ; 37: (9): 6283-6304. |
[20] | Huang H, Rao H, Miao R, Liang Y. A novel meta-analysis based on data augmentation and elastic data shared lasso regularization for gene expression. BMC Bioinformatics. (2022) ; 23: (10): 353. |
[21] | Morris CJ, Corte DD. Using molecular docking and molecular dynamics to investigate protein-ligand interactions. Modern Physics Letters B. (2021) ; 35: (08): 2130002. |
[22] | Gu S, Shen C, Yu J, et al. Can molecular dynamics simulations improve predictions of protein-ligand binding affinity with machine learning? Briefings in Bioinformatics. (2023) ; bbad008. doi: 10.1093/bib/bbad008. |


