
Altered brain functional networks after Quchi (LI 11) acupuncture: An EEG analysis
Abstract
BACKGROUND:
As a unique traditional Chinese medicine therapy, the central effect of acupuncture has received increasing attention. Functional brain networks can provide connectivity information among brain regions.
OBJECTIVE:
The study goal is to explore the regulatory effect of acupuncture on the brain functional network.
METHODS:
This paper analyzes the electroencephalography (EEG)-based power spectrum and brain functional network elicited by acupuncture at Quchi (LI 11).
RESULTS:
The power spectrum results showed that acupuncture at LI 11 decreased the energy in the alpha frequency, mainly in the central region, left parietal lobe, left temporal lobe and left frontal lobe. Moreover, functional brain networks converted from the magnitude-squared coherence matrix in the alpha band are reconstructed. The results show that acupuncture did not alter the basic properties of the brain functional connection network. During acupuncture, the average node degree, average clustering coefficient, and small-world property of the brain functional connection network decreased after acupuncture compared with that before it. However, the average characteristic path length increased after acupuncture compared with before.
CONCLUSION:
Acupuncture at LI 11 altered the brain’s electrical activity. In the meantime, this acupuncture reduced the network’s internal connectivity and information transfer efficiency.
1.Introduction
As a therapy unique for traditional Chinese medicine (TCM), acupuncture is crucial in treating nervous and motor system diseases and mental illnesses. Recently, the central effect of acupuncture has received increasing attention, as it may be involved in the working pathway of acupuncture. Acupuncture stimulates receptors in nerve endings at the acupoints. Upon stimuli, the peripheral nerves send impulses to the central nervous system, which are integrated and modulated by the nerve centers at all levels. Thus, the nucleus masses in the related brain functional regions are activated. The neurohumoral system is further involved in controlling neurotransmitter release, which ultimately regulates target organ functions [1]. Analyzing the influence of acupuncture on brain functions can inform our understanding of the central nervous pathways by which acupuncture works [2]. The brain’s functional connectivity network can gain new insights into the central mechanism of acupuncture. Function connectivity is the temporal correlation between long-range neural oscillation activities. Acupuncture can influence the functional connection network of the brain under physiological conditions. Since stimulating different acupoints will lead to different changes in the functional connection network of the brain, it is speculated that the functional connectivity network and the working mechanism of acupuncture are closely related [3].
Electroencephalography (EEG) is a noninvasive method to record an electrogram of the brain’s spontaneous electrical activity with high temporal resolution. This technique can provide real-time data for plotting electrical activity during neurotransmission. EEG can detect slight differences in the power distribution of brain waves. Existing studies have shown that power spectral density can measure the influence of acupuncture on EEG power spectra. Based on EEG power spectrum, the effect of high-frequency and low-frequency acupuncture at Hegu (LI 4) was investigated. The results showed that acupuncture at high frequency reduced the power intensity in the theta frequency band [4]. Gao et al. estimated the sedative effects of electroacupuncture based on EEG power spectral density. They found that the sedative effects of electroacupuncture were associated with the increase of delta wave power intensity and the decrease of alpha wave power intensity [5]. Although EEG power spectra can be used to differentiate between different stages of acupuncture in the frequency domain, they are only applicable to single-channel data. EEG power spectra cannot measure the correlation between data in different channels and hence cannot reflect functional connections between different brain regions [6]. EEG is very sensitive to the functional status of the brain [7] and offers a precise assessment of the functional network features [8, 9]. Synchronization likelihood, coherence, directed transfer function, and Granger causality, which are algorithms measuring energy connectivity based on EEG data, have been widely applied to study the working mechanism of acupuncture [10, 11, 12, 13]. Yu et al. employed the synchronization likelihood method to calculate the function connectivity between EEG channel signals in healthy subjects, thereby revealing the effects of acupuncture at Zusanli (ST 36) on the brain functional connectivity network. They found that acupuncture dramatically regulated functional brain activity, promoting information transfer between different brain regions [10]. Temporal synchronization between two signals in the frequency domain can be evaluated by coherence, which is the spectral correlation between EEG signals in two channels. Li et al. used coherence estimation to analyze the influence of acupuncture at acupoint ST 36 on EEG-based brain functional connection network of healthy volunteers. It was found that acupuncture at this acupoint helped coordinate the electrical activity between the brain regions [11].
LI 11 is the confluence acupoint of the large intestine channel of Hand-Yangming and is usually stimulated concomitantly with other acupoints. Acupuncture at LI 11 has proven efficacy in hypertension, chronic pain, sedation, and anesthesia [14, 15, 16]. Several studies have demonstrated that electroacupuncture at LI 11 activates algesthesia, the visceral regulation center, and some other brain regions. The complex information integration process occurring in the subcortical structures corresponds to the hypothesis about the information transfer pathway in the central nervous system (CNS), which, in turn, is associated with the working mechanism of acupuncture at LI 11 [17, 18]. Zou et al. found that electroacupuncture at the acupoint combination consisting of Hegu (LI 4), Shousanli (LI10), and LI 11 could regulate the power of the delta and beta bands in the primary motor cortex of stroke patients. Their study revealed the electrophysiological mechanism of electroacupuncture-enabled rehabilitation in stroke [19]. Qiao et al. found that the electrical stimulation of LI 11 and Neiguan (PC 6) increased the entropy of EEG signal samples, brain activity complexity, muscle activity’s orderliness, and brain-myoelectricity synergy [20].
The existing studies proved that acupuncture with different acupoint combinations containing LI 11 had CNS effects. However, few studies have focused on acupuncture at LI 11 alone. Studying the functions of a single acupoint can help screen suitable acupoints for treatment. Building a brain functional connectivity network based on EEG is a modern medical technique to reveal the acupoint-brain correlation. This study covered healthy participants, for which EEG was given in combination with conventional therapy. The brain functional connectivity network was built based on EEG power spectral density and magnitude-squared coherence (MSC). Then, the response characteristics of the functional brain network with or without acupuncture were detected, revealing the central mechanism of acupuncture at LI 11.
2.Method
2.1Participants and experiment procedures
Fifteen healthy right-handed adults (seven males and eight females of 18–26 years and mean age of 22) were recruited through advertising. Experiment procedures do not involve any violation of ethical principles or moral issues. Participants were informed of the acupuncture stimulation in the experiments and agreed in writing to participate before the experiment.
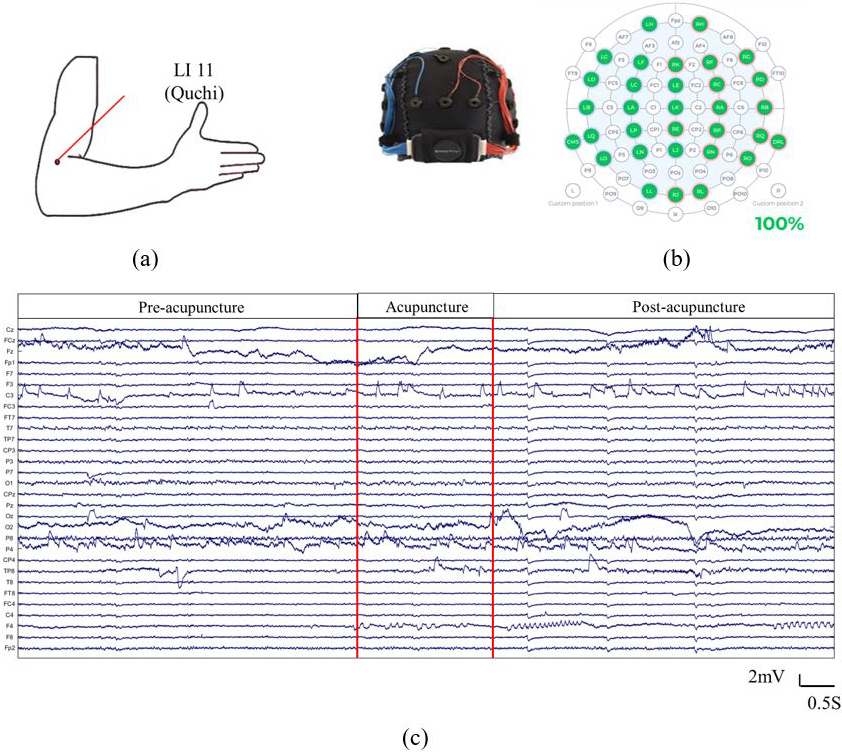
In the experiment, a licensed acupuncturist used disposable stainless steel needles with a diameter of 0.25 mm and a length of 40 mm to manually perform acupuncture at LI 11 (Quchi) point on the left arm (Fig. 1a). We adopted the lifting-thrusting method with a frequency of 90 times/min. The experiment lasted for approximately 22 min. The experimental procedure is as follows: EEG data of participants who were at rest for 10 minutes were collected synchronously, referred to as the pre-acupuncture state. After conventional disinfection, insert the needle into LI 11 acupoint to a depth of 1 cun (
Figure 1.
The locations of LI 11 and the EEG recording. (a) Locations of LI 11. (b) Emotiv EPOC EEG headset and (c) the EEG signals recorded. EEGs were recorded before (Pre-acupuncture), during (Acupuncture) and after acupuncture (Post-acupuncture).
2.2Electroencephalogram signal recording and data processing
The Emotiv system with 32 electrodes was used to record the EEG signal (sampling frequency: 128 Hz; hardware filter passband: 0.2 Hz–45 Hz). The electrodes were placed according to the standard 10–20 system. Bilateral mastoid references were used. EEG signals were recorded at 30 channels (Fig. 1b and c). The median EEG data of 60 seconds before, during and after acupuncture were selected for each participants. The EEGLAB toolbox was to preprocess scalp EEG data in MATLAB 2014a. The EEG data of each channel were re-referenced to the average of all channels. High-pass filtering was performed by setting the cutoff frequency to 1 Hz to eliminate low-frequency artifacts. Visible electrooculogram and electromyogram artifacts were removed using independent component analysis and ADJUST to obtain EEG signals with a high signal-to-noise ratio.
2.3Power spectrum analysis
Power spectral estimation was performed using Welch’s method (window: 1S, 50% overlap length of the window). The average power spectrum density of the whole brain was calculated. Five frequency bands were analyzed: delta (0.5–4 Hz), theta (4–8 Hz), alpha (8–13 Hz), beta (13–30 Hz), and gamma (30–45 Hz).
2.4Functional network construction
In this study, the channel is defined as a node, and the edge is defined as the magnitude-squared coherence (MSC) from any two channels. MSC estimates the extent to which two temporal signals are linearly related to each other at frequency
For the time series
(1)
Where,
We used MSC as a frequency-domain measure of static functional connectivity, as defined below:
(2)
We performed a Fourier transform using a symmetric Hann window (length: 128 samples) and a window overlap rate of 50%. The average of
This paper calculated the MSC of each pairwise EEG channel in each frequency band to obtain the 30
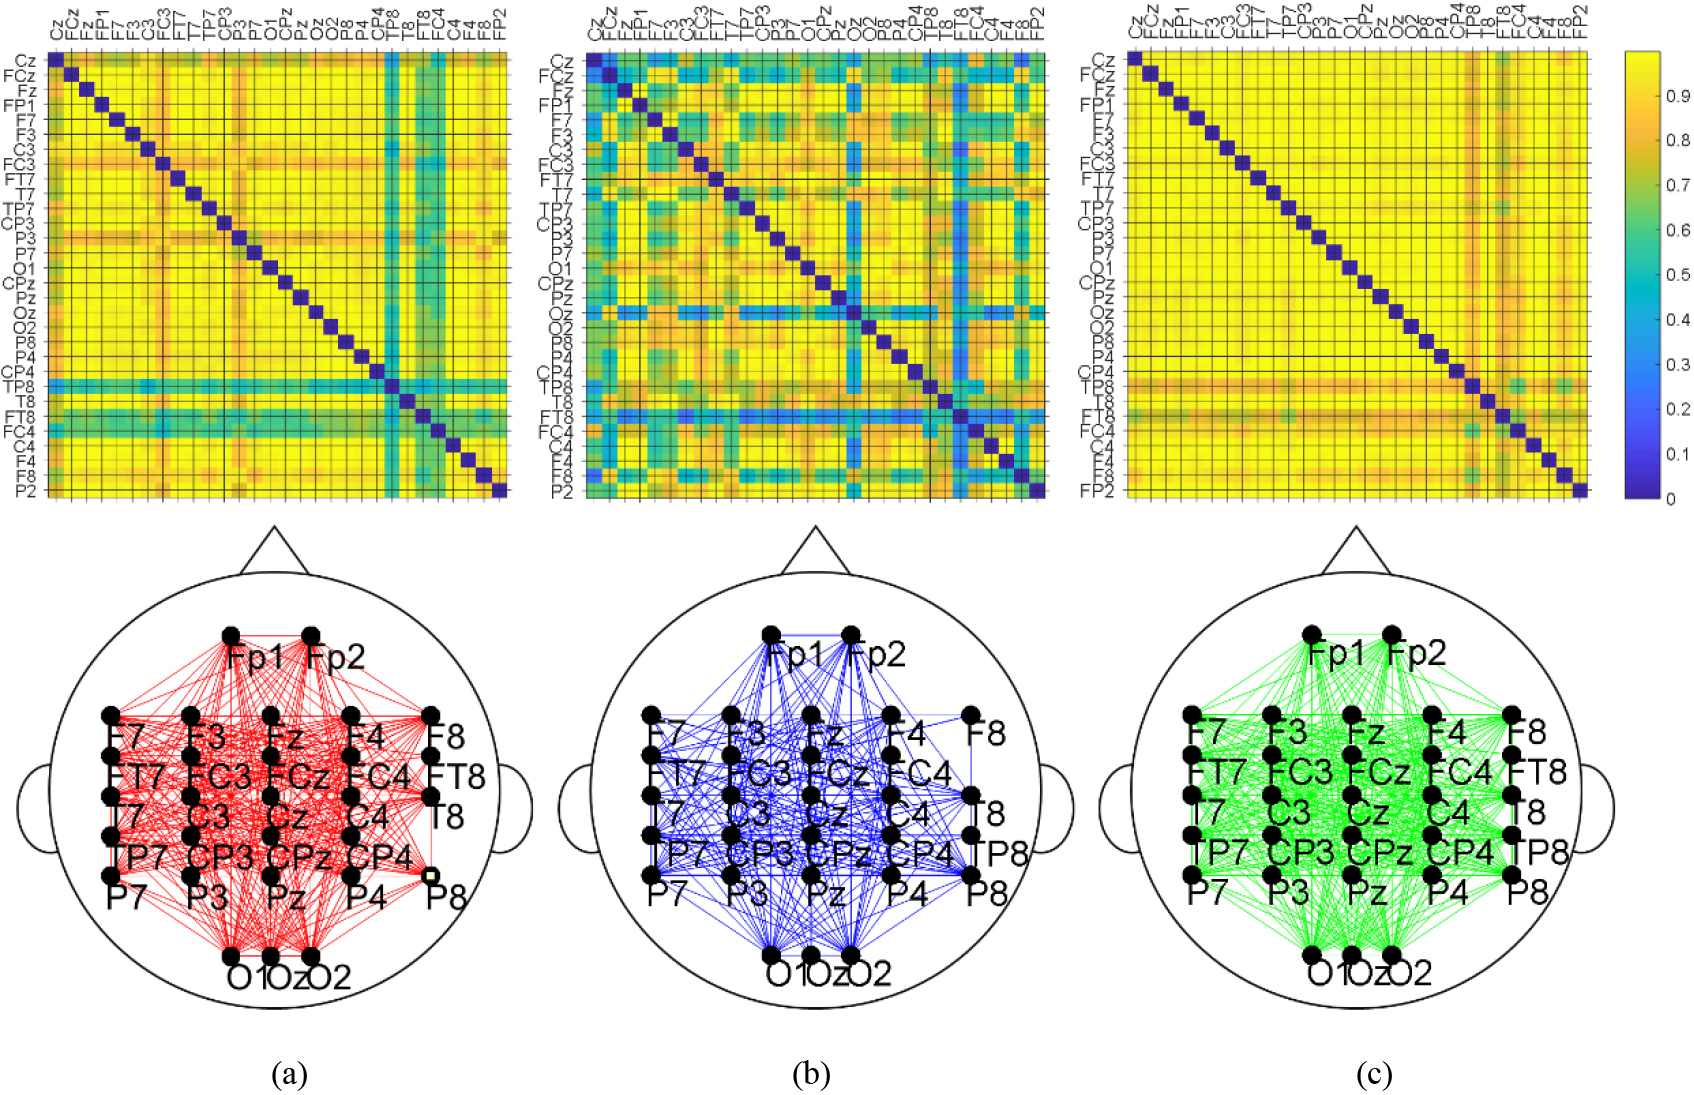
Figure 2.
Brain functional networks before, during, and after acupuncture at a threshold of 0.80. The
2.5Graph theory analysis
We investigated the nodal (average nodal degree) and global network properties (average clustering coefficient, average characteristic path length, and small-worldness) of the “small-world” network in pre-acupuncture, acupuncture, and post-acupuncture conditions [23].
2.5.1Average nodal degree
The nodal degree is an index to evaluate the importance of nodes in the network. It represents the number of sides connected to this node; the larger the value, the more important the node is in the network. The nodal degree can be expressed as:
(3)
Where,
Average nodal degree
(4)
2.5.2Average clustering coefficient
The clustering coefficient
(5)
Where,
2.5.3Average characteristic path length
The average characteristic path length
(6)
Where,
2.5.4Small-worldness
Small-worldness
(7)
Where,
2.6Statistical analysis
The results were expressed as the mean
3.Results
3.1Power spectrum analysis
We calculated the brain-wide averaged energy in each frequency band before, during and after acupuncture operation. Statistically, it was found that the alpha-band EEG spectral power decreased dramatically (169.20
Table 1
Electrodes with observed energy changes during acupuncture at LI 11
| Condition | Electrodes with energy rise | Electrodes with energy drop |
|---|---|---|
| Acupuncture | None | Cz, FCz, Fz, F3, F7, C3, FC3, FT7, T7, TP7, CP3, O1, CPz, P8, CP4, FC4, |
| C4, F8, Fp2, F7 |
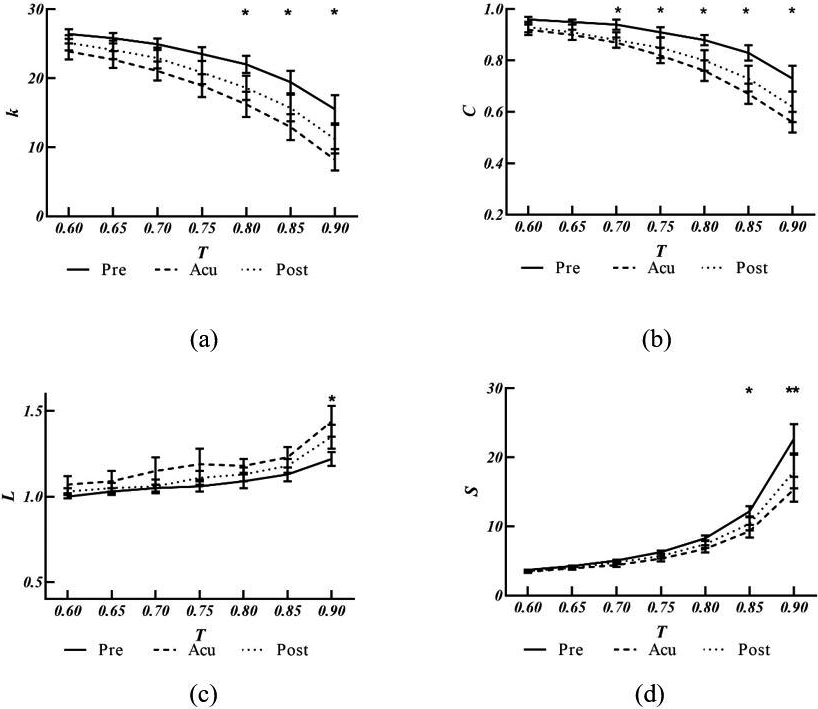
Figure 3.
Comparison of brain network properties under three conditions: pre-acupuncture (Pre), acupuncture (Acu), and post-acupuncture (Post). (a–d) Measure of average nodal degree, average clustering coefficient, average characteristic path length, and small-worldness, respectively. Properties during acupuncture vs. those before acupuncture,
3.2Graph theory analysis
We calculated the average nodal degree, clustering coefficient, characteristic path length and small worldness for the pre-acupuncture, acupuncture, and post-acupuncture conditions with various thresholds. Figure 3 demonstrate that all three cases exhibited small-world properties. Four mean network metrics were also compared before, during and after acupuncture operation. It was discovered that the acupuncture condition exhibited a smaller average nodal degree, clustering coefficient, small-worldness, and a larger characteristic path length than the other two cases.
Figure 3a shows the average nodal degree (
4.Discussion
This study was aimed to investigate the acupuncture effect on the functional networks. We acupunctured acupoint LI 11 in the left arm to acquire EEG signals. Then, the power spectrum densities of five frequency subbands (delta, theta, alpha, beta, and gamma) were analyzed using Welch’s method under three conditions: pre-acupuncture, acupuncture, and post-acupuncture. By computing the MSC, we calculated the degree of synchronizations between each two EEG channels and obtained the functional connectivity matrices. Under a series of thresholds (
With EEG power spectrum analysis, it was found that acupuncture at LI 11 decreased brain rhythms in the alpha band in healthy subjects, including the central region, left parietal lobe, left temporal lobe, and left frontal lobe, indicating that the brain plays a crucial role in acupuncture research [24]. According to traditional Chinese medicine theory, stimulating LI 11 can achieve antihypertensive, analgesic, and sedative effects. Changes in EEG power are closely related to neural activity, which, in turn, can be inhibited or activated by acupuncture [6]. These trends are in concert with those of Gao et al. [5], who reported that electroacupuncture at ST 36, Shenmen (HT 7), and Sanyinjiao (SP 6) acupoints had a sedative effect with the increased delta-frequency power and the decreased alpha-frequency power. Percutaneous electrical stimulation of LI 11 and Neiguan (PC 6) can reduce fluctuations in heart rate, mean arterial pressure, and hemodynamic indicators [25]. Research by Hsu et al. on the evaluation of acupuncture on EEG, heart rate variability, and pulse rate variability revealed that acupuncture at either Sishencong or Shenmen might calm the mind, slow down the heart rate, activate the parasympathetic nerves, and inhibit the sympathetic nerves [26]. Acupuncture also could change EEG activity, especially in the alpha-frequency band. Acupuncture was assumed to play a role by influencing cerebral blood flow (CBF). In addition, the change of alpha-frequency band (8–13 Hz) corresponded spatially to CBF response [27]. Electroacupuncture-induced sedation could lead to changes in EEG delta and alpha oscillations, closely related to an altered state of consciousness [28]. The results of this paper show that acupuncture at LI 11 altered alpha-band power, which might be related to clinical antihypertensive and sedative efficacy.
The paper combined graph theory analysis and brain functional networks to clarify neural plasticity after acupuncture. The human brain is regarded as a large-scale complex network with many topological characteristics [29]. Magnitude-squared coherence (MSC) is a classical method to estimate neural synchronization. By computing the MSC, the synchronization matrices can be obtained. A high MSC usually indicates increased neuronal synchronization. Although it is assumed that functional connectivity depend upon structural and physical connections, MSC measures the statistical dependence of bivariate time series signals. The temporal sequence signals are only partially subjected to physical connection limitations [30]. Given the significant differences in the alpha band during acupuncture, we built up the alpha-band functional network before, during and after acupuncture. EEG-based brain function networks have small-world properties [31]. Different from the random network, small-world networks had higher clustering coefficients, shorter path lengths, and stronger capacity in information transfer. Moreover, the latter better meets the requirement for balancing segregation and integration in the human brain [6]. All three conditions manifested small-world properties, indicating that acupuncture at LI 11 did not alter the functional network’s basic properties [32]. Several previous studies have proven that the small-world property of the brain’s functional network is closely associated with consciousness [33]. Sedation and anesthesia are usually associated with a dramatic reduction in functional network connectivity [34]. The small-worldness of the functional network upon acupuncture at LI 11 decreased significantly compared with before, indicating a significant reduction of the information transfer efficiency.
The results of graph theory analysis show that the average nodal degree and average clustering coefficient during acupuncture are lower than those before acupuncture. In contrast, the average characteristic path length during acupuncture is higher than that before acupuncture. The average clustering coefficient decline suggested that associated nodes were closely connected during acupuncture [35]. Moreover, the decrease in average node degree and the reduction in average characteristic path length indicate decreased integration within functional regions of the network [36]. These changing trends are similar to those of Xu et al. [37], who reported that magnetic stimulation of the HT 7 acupoint resulted in reduced connectivity between nodes in the brain network and weakened node synchronization in the network, which was conducive to calming mood and improving sleep [37]. Therefore, acupuncture at LI 11 can reduce the network’s internal connectivity and information transfer efficiency, which could further result in an inhibitory effect on nervous excitation.
Some limitations of the present work include a limited sample size, which could deteriorate the analysis’s accuracy. Besides, the study covered only healthy subjects. We will conduct further experiments in clinical to verify the relationship between these potential neurodynamics and acupuncture treatment effects. Finally, only the lifting-thrusting method was investigated. Alternative acupuncture manipulation methods (reinforcing and reducing, lifting-thrusting and twirling), their frequency and intensity are known to have different effects on the human body. In the follow-up study, we plan to analyze and compare the effects of various acupuncture manipulation methods on central responses in the brain.
5.Conclusion
In this paper, the brain function network method is used to analyze the EEG induced by acupuncture at LI 11. It was found that acupuncture decreased brain rhythms in the alpha band in healthy subjects, including the central region, left parietal lobe, left temporal lobe, and left frontal lobe. This indicates that acupuncture at LI 11 altered brain electrical activity. In order to evaluate the changes caused by acupuncture quantitatively, this paper calculated the average node degree, average clustering coefficient, average characteristic path length and small-worldness. This study proved that acupuncture reduced the internal connectivity and information transfer efficiency of the network after acupuncture at LI 11 but did not alter the basic properties of the functional connectivity network in the brain. The proposed quantitative approach is considered instrumental in making acupuncture more standardized and visualized, i.e., adding more modern theory to the ancient art of acupuncture.
Acknowledgments
This study was financially supported by the Sailing Program under the Shanghai Scientific and Technological Innovation Action Plan (No. 22YF1449100) and Project within the Budget of the Shanghai University of Traditional Chinese Medicine (No. 2021LK103).
Conflict of interest
None to report.
References
[1] | Zeng F, Liu XG, Tang Y, Liang FR. Application prospect of PET-CT in studying the central mechanism of the needing effect. Zhen Ci Yan Jiu. (2008) ; 33: (4): 284-286. doi: 10.3969/j.issn.1000-0607.2008.04.015. |
[2] | Zuo F, Shi X. Effects of acupuncture on brain functions. Shanghai J Acup Moxib. (2003) ; 22: (01): 42-45. doi: CNKI:SUN:SHZJ.0.2003-01-020. |
[3] | Cai RL, Shen GM, Wang H, Guan YY. Brain functional connectivity network studies of acupuncture: A systematic review on resting-state fMRI. J Integr Med. (2018) ; 16: (1): 26-33. doi: CNKI:SUN:XBZX.0.2018-01-005. |
[4] | Chen AC, Liu FJ, Wang L, Arendt-Nielsen L. Mode and site of acupuncture modulation in the human brain: 3D (124-ch) EEG power spectrum mapping and source imaging. Neuroimage. (2006) ; 29: (4): 1080-91. doi: 10.1016/j.neuroimage.2005.08.066. |
[5] | Gao YF, Song DW, Wang Q, Yan F. Study of sedative effects of electroacupuncture using power spectral density of EEG. Journal of Xi’an Jiaotong University (Medical Sciences). (2019) ; 40: (5): 800-803. doi: 10.7652/jdyxb201905026. |
[6] | Yu H, Wu X, Cai L, Deng B, Wang J. Modulation of spectral power and functional connectivity in human brain by acupuncture stimulation. IEEE Trans Neural Syst Rehabil Eng. (2018) ; 26: (5): 977-986. doi: 10.1109/TNSRE.2018.2828143. |
[7] | Schmidt MT, Kanda PA, Basile LF, da Silva Lopes HF, Baratho R, Demario JL, et al. Index of alpha/theta ratio of the electroencephalogram: A new marker for Alzheimer’s disease. Front Aging Neurosci. (2013) ; 5: : 60. doi: 10.3389/fnagi.2013.00060. |
[8] | Fan RW, Huang X, Li XL, Yan HM, Shu X, Kong Q. Characteristics of electroencephalogram power spectrum network on uninjured side of post-stroke aphasia. Chinese Journal of Rehabilitation Theory and Practice. (2020) ; 26: (6): 692-696. doi: 10.3969/j.issn.1006-9771.2020.06.013. |
[9] | Kim DS, Nordli DR, Zelko F. Spectral power of 1–4 Hz frequency in the ictal phase of childhood absence epilepsy. J Clin Neurophysiol. (2011) ; 28: (5): 463-468. doi: 10.1097/WNP.0b013e318231c2e1. |
[10] | Yu H, Liu J, Cai L, Wang J, Cao Y, Hao C. Functional brain networks in healthy subjects under acupuncture stimulation: An EEG study based on nonlinear synchronization likelihood analysis. Physica A Statistical Mechanics & Its Applications. (2017) ; 468: : 566-577. doi: 10.1016/j.physa.2016.10.068. |
[11] | Li N, Wang J, Deng B, Wei XL, Che YQ, Jia CH, et al. Effects of acupuncture on connections in the brain functional network. Acupuncture Research. (2011) ; 36: (04): 278-287. doi: CNKI:SUN:XCYJ.0.2011-04-010. |
[12] | Song Z, Zhan G, Lin Y, Fang T, Niu L, Zhang X. Electroacupuncture alters BCI-based brain network in stroke patients. Comput Intell Neurosci. (2022) ; 2022: : 8112375. doi: 10.1155/2022/8112375. |
[13] | Zheng W, Yu HL, Ding WG, Wu X, Xu GZ, Guo L. Brain functional network analysis of magnetic stimulation at acupoints for sub-health insomnia based on Granger causality. Chinese Journal of Medical Physics. (2018) ; 35: (2): 228-235. doi: 10.3969/j.issn.1005-202X.2018.02.022. |
[14] | Hsu GL, Zaid UX, Hsieh CH, Huang SJ. Acupuncture assisted local anesthesia for penile surgeries. Transl Androl Urol. (2013) ; 2: (4): 291-300. doi: 10.3978/j.issn.2223-4683.2013.12.02. |
[15] | Zhang S, Tang H, Zhou J, Gu Y. Electroacupuncture attenuates neuropathic pain after brachial plexus injury. Neural Regen Res. (2014) ; 9: (14): 1365-70. doi: 10.4103/1673-5374.137589. |
[16] | Litscher G, Cheng WP, Cheng GY, Wang L, Zhao J, Litscher D. Acupuncture point laterality: Investigation of acute effects of Quchi (LI11) in patients with hypertension using heart rate variability. Evid Based Complement Alternat Med. (2014) ; 2014: : 979067. doi: 10.1155/2014/979067. |
[17] | Yan LP, Sun ZR, Xie B, Ma X. Functional magnetic resonance imaging findings upon electroacupuncture at Quchi acupoint. Journal of Clinical Acupuncture and Moxibustion. (2005) ; 21: (3): 61-63. doi: 10.3969/j.issn.1005-0779.2005.03.045. |
[18] | Luo R, Shi WY, Kuang T, Ye GS, Pan J, Chen C. Observation of instant effect of electroacupuncture at Quchi and Shangjuxu on functional bowel disorders based on R-fMRI. Shanghai J Acup Moxib. (2018) ; 37: (1): 92-96. doi: 10.13460/j.issn.1005-0957.2018.01.0092. |
[19] | Zou F, Lin YF, Chen SG, Cao L, Wang HR, Ye B. The impact of electroacupuncture at Hegu, Shousanli, and Quchi based on the theory “treating flaccid paralysis by Yangming alone” on stroke patients’ EEG: A pilot study. Evid Based Complement Alternat Med. (2020) ; 2020: : 8839491. doi: 10.1155/2020/8839491. |
[20] | Qiaog XY, Hu WL. Sample entropy and wavelet entropy on EEG-EMG signals. Journal of Test and Measurement Technology. (2016) ; 30: (4): 292-298. doi: 10.3969/j.issn.1671-7449.2016.04.003. |
[21] | Yan XP, Wang HX, Zhou WJ, Hong, B. Epileptogenic zone localization and network analysis based on high frequency intracranial EEG during seizure. Beijing Biomedical Engineering. (2017) ; 36: (3): 229-236. doi: 10.3969/j.issn.1002-3208.2017.03.02. |
[22] | Päeske L, Hinrikus H, Lass J, Raik J, Bachmann M. Negative correlation between functional connectivity and small-worldness in the alpha frequency band of a healthy brain. Front Physiol. (2020) ; 11: : 910. doi: 10.3389/fphys.2020.00910. |
[23] | Rubinov M, Sporns O. Complex network measures of brain connectivity: Uses and interpretations. NeuroImage. (2010) ; 52: (3): 1059-69. doi: 10.1016/j.neuroimage.2009.10.003. |
[24] | Pei X, Wang J, Deng B, Wei X, Yu H. WLPVG approach to the analysis of EEG-based functional brain network under manual acupuncture. Cogn Neurodyn. (2014) ; 8: (5): 417-28. doi: 10.1007/s11571-014-9297-x. |
[25] | Guo LL, Wu X, Ye GM. Effects of percutaneous acupoint electrical stimulation on BIS and stress response in pediatric endotracheal intubation. Journal of New Chinese Medicine. (2015) ; 47: (6): 262-264. doi: CNKI:SUN:REND.0.2015-06-126. |
[26] | Hsu CC, Weng CS, Sun MF, Shyu LY, Hu WC, Chang YH. Evaluation of scalp and auricular acupuncture on EEG, HRV, and PRV. Am J Chin Med. (2007) ; 35: (2): 219-30. doi: 10.1142/S0192415X0700476X. |
[27] | Yang X, Yu H, Zhang T, Luo X, Ding L, Chen B. The effects of Jin’s three-needle acupuncture therapy on EEG alpha rhythm of stroke patients. Top Stroke Rehabil. (2019) ; 2: : 1-5. doi: 10.1080/10749357.2018.1484680. |
[28] | Liu Y, Wang XJ, Wang N, Cui CL, Wu LZ. Electroacupuncture ameliorates propofol-induced cognitive impairment via an opioid receptor-independent mechanism. Am J Chin Med (2016) ; 44: (4): 705-19. doi: 10.1142/S0192415X16500385. |
[29] | Hua JC, Xu XM, Xu ZG, Xu JJ, Hu JH, Xue Y, Wu Y. Aberrant functional network of small-world in sudden sensorineural hearing loss with tinnitus. Front Neurosci (2022) ; 16: : 898902. doi: 10.3389/fnins.2022.898902. |
[30] | Miskovic V, Keil A. Reliability of event-related EEG functional connectivity during visual entrainment: Magnitude squared coherence and phase synchrony estimates. Psychophysiology. (2015) ; 52: (1): 81-9. doi: 10.1111/psyp.12287. |
[31] | Smit DJ, Stam CJ, Posthuma D, Boomsma DI, de Geus EJ. Heritability of “small-world” networks in the brain: A graph theoretical analysis of resting-state EEG functional connectivity. Hum Brain Mapp. (2008) ; 29: (12): 1368-78. doi: 10.1002/hbm.20468. |
[32] | Wu X, Yu HL, Ding WG, Zheng W, Chen J, Wei L. Analysis of magnetic stimulation at acupuncture points on sub-health insomnia based on cross-correlation algorithm. Chin Med Dev. (2018) ; 33: (02): 27-32. doi: 10.3969/j.issn.1674-1633.2018.02.008. |
[33] | Coppola P, Spindler LRB, Luppi AI, Adapa R, Naci L, Allanson J. Network dynamics scale with levels of awareness. Neuroimage. (2022) ; 254: : 119128. doi: 10.1016/j.neuroimage.2022.119128. |
[34] | Guldenmund P, Vanhaudenhuyse A, Sanders RD, Sleigh J, Bruno MA, Demertzi A. Brain functional connectivity differentiates dexmedetomidine from propofol and natural sleep. Br J Anaesth. (2017) ; 119: (4): 674-684. doi: 10.1093/bja/aex257. |
[35] | Bullmore E, Sporns O. The economy of brain network organization. Nat Rev Neurosci. (2012) ; 13: (5): 336-49. doi: 10.1038/nrn3214. |
[36] | Bathelt J, O’Reilly H, Clayden JD, Cross JH, de Haan M. Functional brain network organisation of children between 2 and 5 years derived from reconstructed activity of cortical sources of high-density EEG recordings. Neuroimage. (2013) ; 82: : 595-604. doi: 10.1016/j.neuroimage.2013.06.003. |
[37] | Xu GZ, Fu LD, Yu HL, Geng YH, Yin N. Study of brain functional network under magnetic stimulation at Shenmen acupoint based on EEG data. Transactions of Beijing Institute of Technology. (2015) ; 35: (s1): 111-115. |


