
Preliminary study on the effect of ozone exposure on blood glucose level in rats
Abstract
BACKGROUND:
In recent years, people have paid more and more attention to the health hazards caused by O
OBJECTIVE:
To investigate the effects of ozone (O
METHODS:
Eighty rats were divided into control group and three ozone concentration groups. Each group was continuously exposed for 1d, 3d and, 6d, and exposed for 6 hours daily. After exposure, GTT, FBG, and random blood glucose were measured.
RESULTS:
The FBG value increased significantly on the 6th day of 0.5 ppm and the 3rd and 6th days of 1.0 ppm exposure compared with the control group (
CONCLUSION:
After acute O
1.Introduction
In recent years, people have paid increasing attention to the health hazards caused by O
With the deepening of research on the harm caused to the body by O
2.Materials and methods
2.1Animals
Six-week-old SPF male Wistar rats (Huafukang Company, Beijing production license: SCXK (Beijing) 2019-0008); body weight
2.2Main instruments and reagents
O
2.3Experimental grouping and O3
There were 80 Wistar rats in total, of which 40 were exposed to glucose tolerance testing (GTT) detection and randomly divided into 4 groups of 10 according to weight: control group (0 ppm) and 0.1 ppm, 0.5 ppm and 1.0 ppm O
2.4Random blood glucose and fasting blood glucose
Rats in the RBG and FBG detection groups normally ate during exposure. The operation method of the blood glucose meter was the same as that of GTT. Rats in the RBG and FBG groups had their food removed after 22:00, and RBG was measured at 22:00. FBG was detected at 8:00 after exposure to ensure that the fasting time of the rats was more than 8 hours.
2.5Glucose tolerance testing
GTT was conducted using a Roche blood glucose meter to measure blood glucose volume, and glucose dehydrogenase test paper was adopted for testing. In the GTT group, the rats fasted during the exposure period (8:00–14:00) and before the completion of GTT. At 16:00, GTT was conducted, and blood glucose concentration was assessed. The interval between GTT tests was greater than 18 hours of recovery. The test method was to puncture the distal surface of the tail with a sterile needle and obtain a 1
2.6Statistical analysis
SPSS 26.0 software was used to establish a database for the statistical processing and analysis of all detected sample data. When the sample data was normally distributed, measurement data were expressed as mean
3.Results
3.1General conditions of rats after exposure
No death occurred during the exposure period. The rats gained weight with the extension of the exposure time, but the weight gain was not statistically significant.
3.2Fasting blood glucose and random blood glucose results
FBG detection results are shown in Fig. 1A. Compared with the control group, the FBG detection values at 1 day, 3 days and 6 days after exposure to 0.1 ppm concentration had no statistical significance. At a concentration of 0.5 ppm, the blood glucose value on the sixth day was significantly higher than that of the control group (
Figure 1.
FBG and RBG values at 0.1 ppm, 0.5 ppm, and 1.0 ppm O
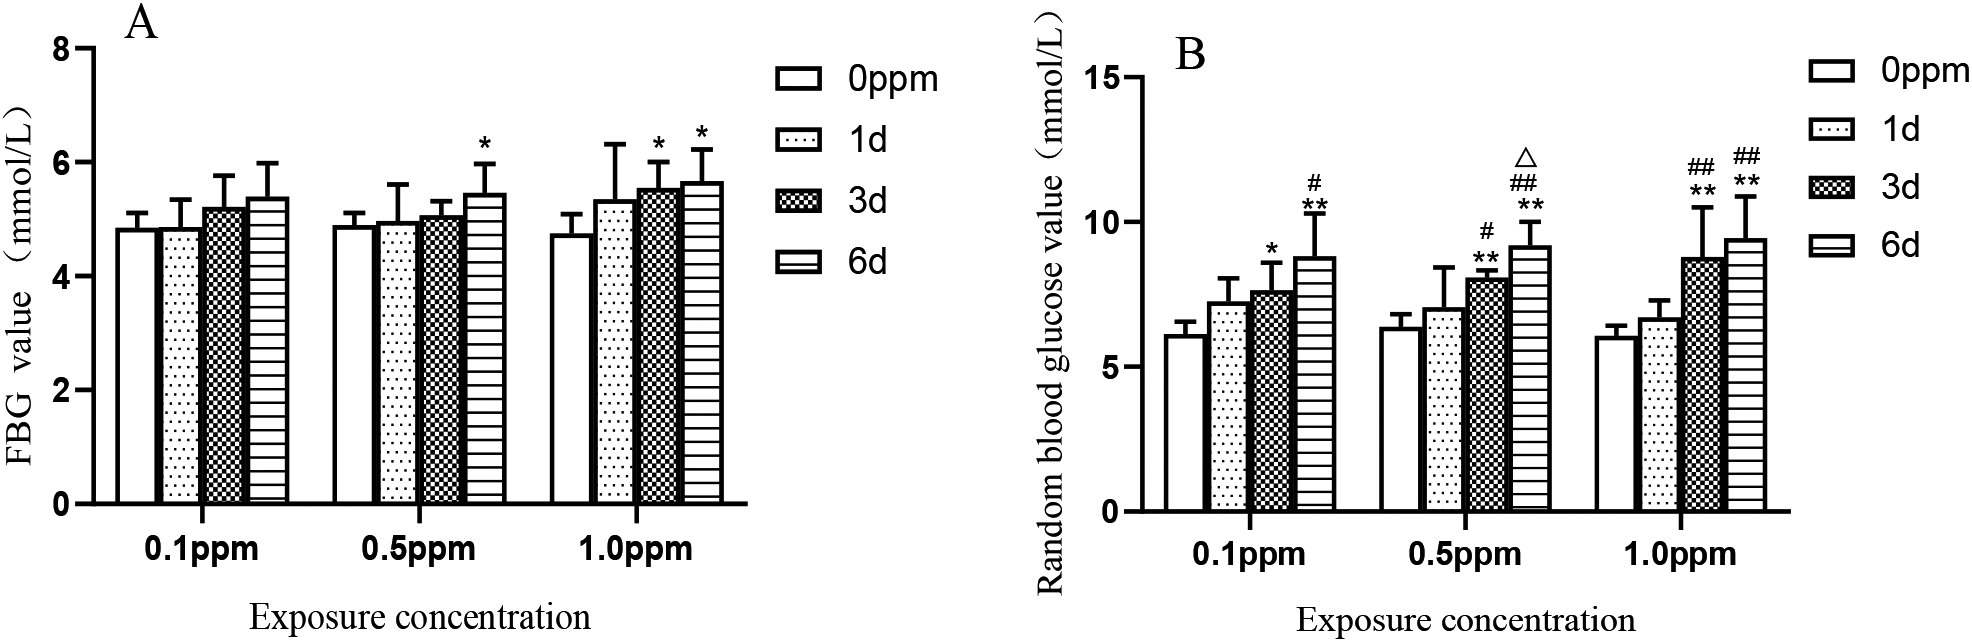
Figure 2.
GTT values at 0.1 ppm, 0.5 ppm, and 1.0 ppm O
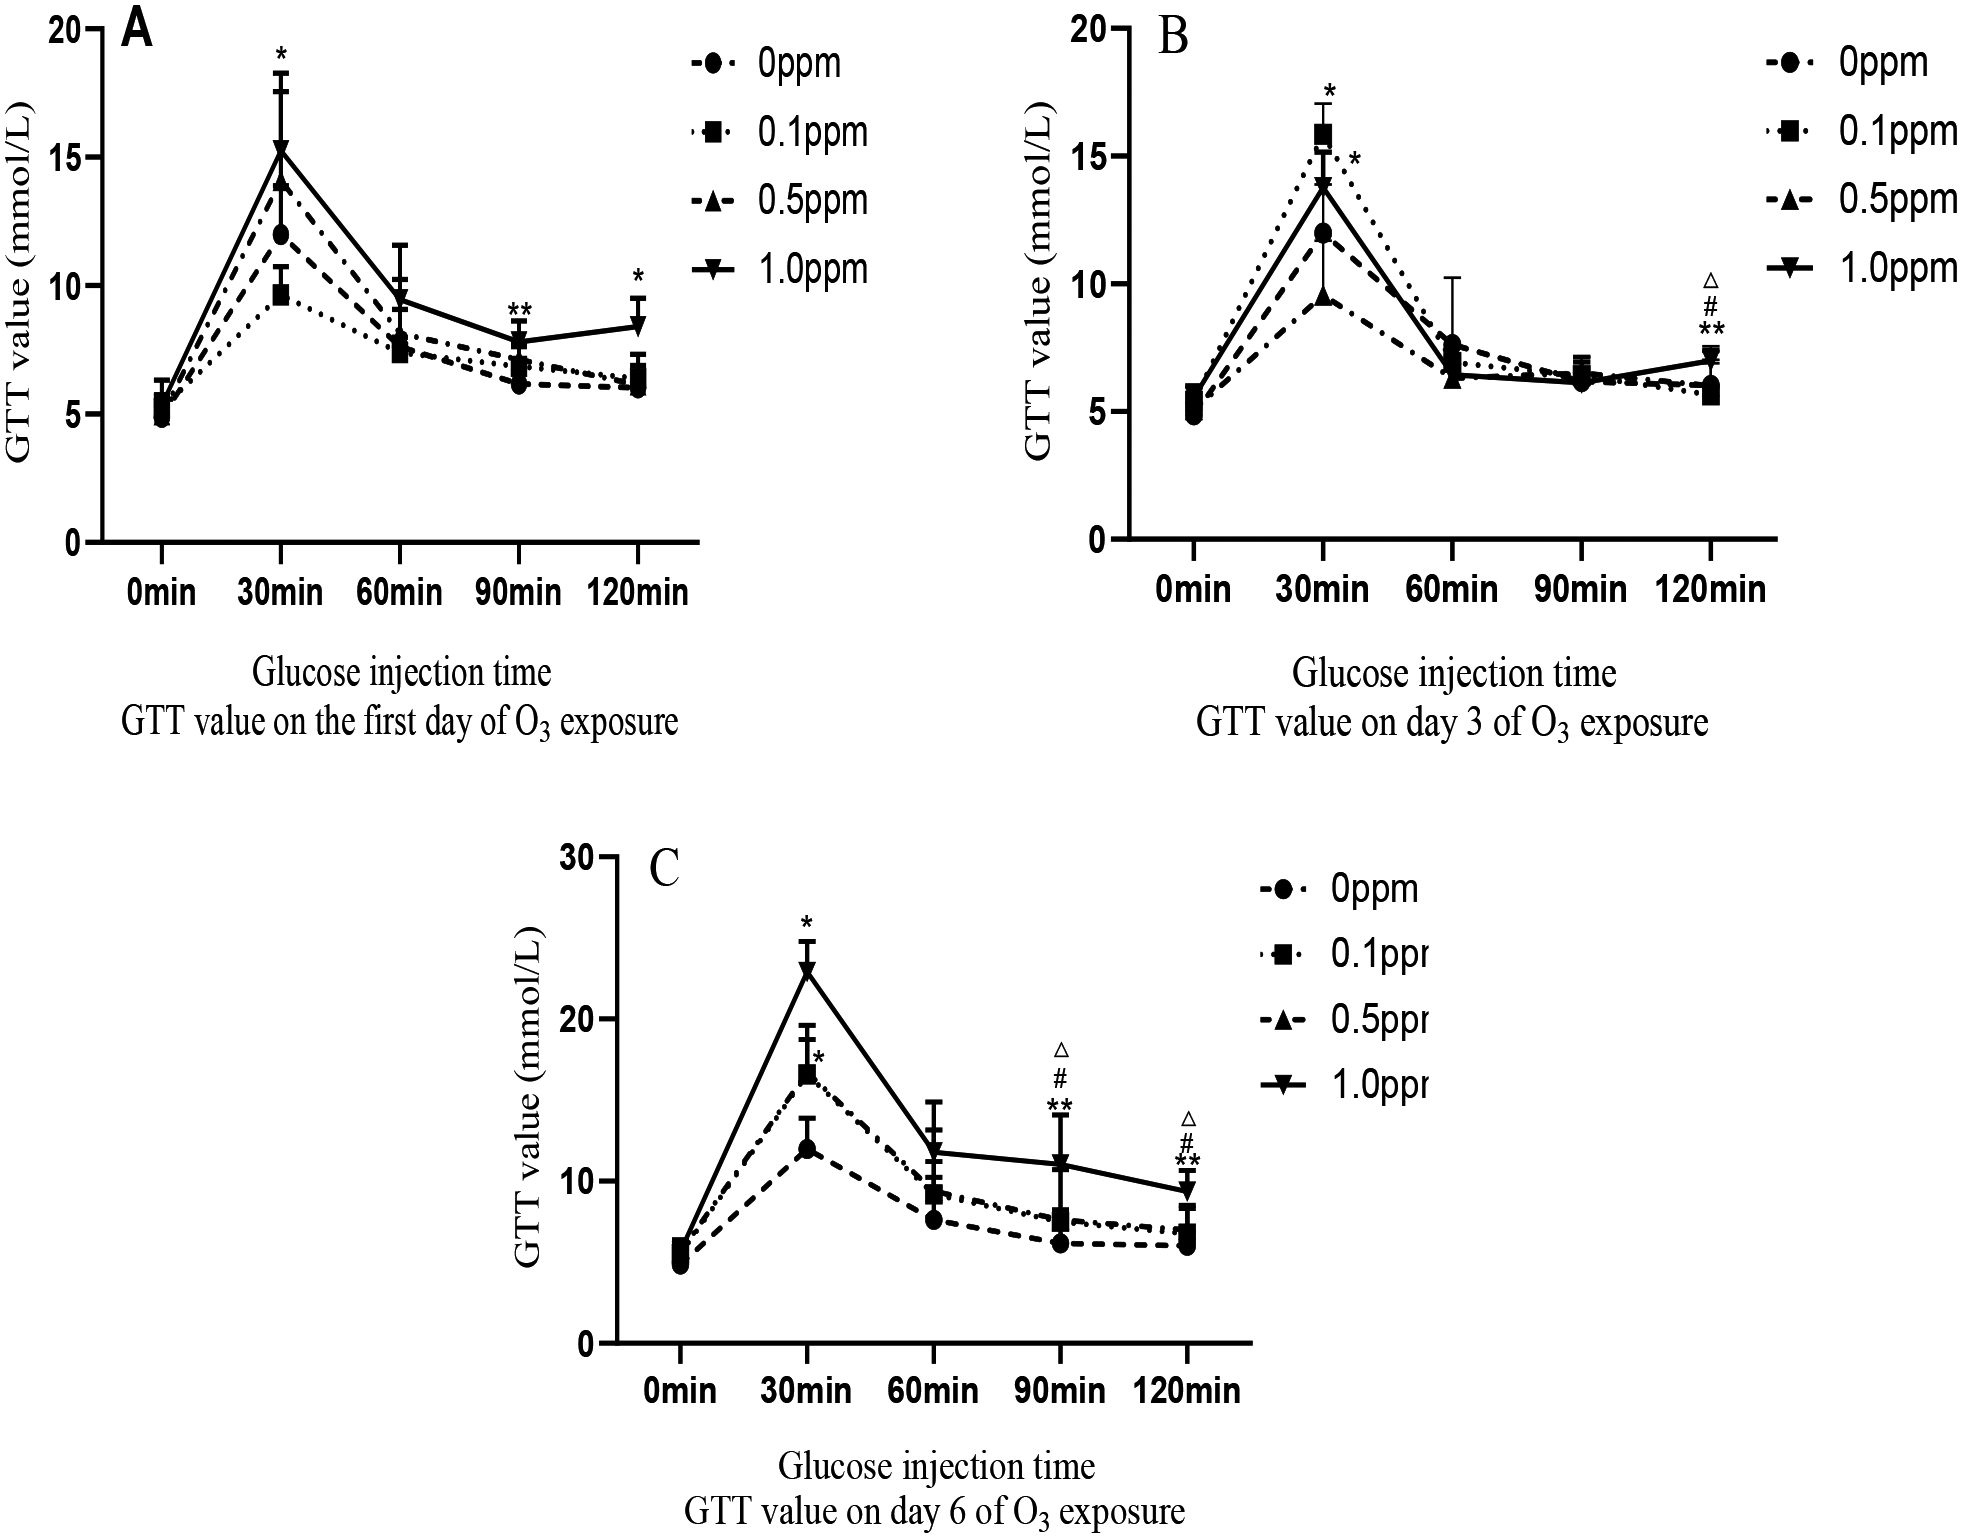
3.3GTT results
In the GTT group, rats exposed to 0.1, 0.5, and 1.0 ppm of O
4.Discussion
In this experiment, rats were exposed to three different O
The mechanism of O
The concentrations of O
5.Conclusion
In this experiment, rats were exposed to O
Conflict of interest
None to report.
References
[1] | Zhu D, Wan W, Liu J, Xue T, Gong JC, Zhang SQ. Interpretation of the revision of the WHO “Global Air Quality Guidelines.” Chinese Science Bulletin. (2022) ; 67: (8): 697-706. |
[2] | Ministry of Environmental Protection of the People’s Republic of China. GB 3095-2012 “Ambient Air Quality Standards.” Beijing: China Environmental Science Press. (2012) ; 3. |
[3] | General Administration of Quality Supervision, Inspection and Quarantine of the People’s Republic of China, Ministry of Health. GB/T18883-2002 “Indoor air quality standard.” Beijing: Standards Press of China. 2002: ; 2. |
[4] | Lyu LZ, Li Y, Ou XX, Guo WQ, Zhang Y, Duan SM, et al. Health effects of occupational exposure to printer emissions on workers in China: Cardiopulmonary function change. NanoImpact. (2021) ; 21: : 100289. |
[5] | Pan XK, Gao YX, Wang DJ, et al. Emission characteristics of pollutants from indoor laser printers. Environmental and Occupational Medicine. (2017) ; 34: (11): 953-957. |
[6] | Wang XH, Jia SL, Zhai LJ, et al. Study on hazards of ozone and nitrogen oxides in photocopying workplaces. Chinese Journal of Preventive Medicine. (2001) ; 2: (3): 201-204. |
[7] | Feng LY, Zhang HW, Zheng CM, Li Y, Liu J, et al. Investigation on the chemical factors of occupational disease hazards in horse racing enterprises in the areas without specified equine animal epidemics. Occupation and Health. (2020) ; 36: (13): 1736-1740. |
[8] | Ma JW, Chen ZX, Wang J, Wang Y, Li L, et al. Diffusion simulation, health risks, ozone and secondary organic aerosol formation potential of gaseous pollutants from rural comprehensive waste treatment plant. Chemosphere. (2022) ; 286: (3): 131857. |
[9] | Guo QH, Niu XH. Investigation and evaluation of occupational health in a metal component factory. Occupational Health and Emergency Rescue. (2014) ; 32: (4): 243-244. |
[10] | Zhao X, Sun Z, Ruan Y, Yan J, Mukherjee B, Yang F, et al. Personal black carbon exposure influences ambulatory blood pressure: Air pollution and cardiometabolic disease (AIRCMD-China) study. Hypertension. (2014) ; 63: (4): 871-878. |
[11] | Li YL, Chuang TW, Chang PY, Lin LY, Su CT, Chien LN, et al. Long-term exposure to ozone and sulfur dioxide increases the incidence of type 2 diabetes mellitus among aged 30 to 50 adult population. Environ Res. (2021) ; 194: : 110624. |
[12] | Paul LA, Burnett RT, Kwong JC, Hystad P, van Donkelaar A, Bai L, et al. The impact of air pollution on the incidence of diabetes and survival among prevalent diabetes cases. Environ Int. (2020) ; 134: : 105333. |
[13] | Hernandez AM, Ruiz G, de Porras D, Marko D, Whitworth KW, et al. The association between PM2.5 and ozone and the prevalence of diabetes mellitus in the United States, 2002 to 2008. J Occup Environ Med. (2018) ; 60: (7): 594-602. |
[14] | Liu XT, Dong XK, Song XQ, Li RY, He YL, Hou J, Mao ZX, Huo WQ, et al. Physical activity attenuated the association of ambient ozone with type 2 diabetes mellitus and fasting blood glucose among rural Chinese population. Environmental Science and Pollution Research. (2022) . doi: 10.1007/s11356-022-22076-y. |
[15] | Bass V, Gordon CJ, Jarema KA, Macphail RC, Cascio WE, Phillips PM, Ledbetter AD, et al. Ozone induces glucose intolerance and systemic metabolic effects in young and aged brown Norway rats. Toxicol Appl Pharmacol. (2013) ; 273: : 551-560. |
[16] | Gordon CJ, Phillips PM, Ledbetter A, Snow SJ, Schladweiler MC, et al. Active vs. sedentary lifestyle from weaning to adulthood and susceptibility to ozone in rats. Am J Physiol Lung Cell Mol Physiol. (2017) ; 312: (1): 100-109. |
[17] | Li A, Mei Y, Zhao M, Xu J, Seery S, Li R et al. The effect of ambient ozone on glucose-homoeostasis: A prospective study of non-diabetic older adults in Beijing. Sci Total Environ. (2021) ; 761: : 143308. |
[18] | LaKind JS, Burns CJ, Pottenger LH, Naiman DQ, Goodman JE, et al. Does ozone inhalation cause adverse metabolic effects in humans? A systematic review. Critical Reviews in Toxicology. (2021) ; 51: (6): 467-508. doi: 10.1080/10408444.2021.1965086. |
[19] | Zhang XX, Wu XL, Fu LZ, et al. Comparison of rapid glucose meter and biochemical meter in blood glucose test of normal rats and type 2 diabetic rats. World’s Latest Medical Information Digest. (2018) ; 18: : 84-86. |
[20] | Ogurtsova K, Huang Y, Linnenkamp U, Guariguata L, Cho NH, et al. IDF Diabetes Atlas: Global estimates for the prevalence of diabetes for 2015 and 2040. Diabetes Res Clin Pract. (2017) ; 128: : 40-50. |
[21] | Miller DB, Karoly ED, Jones JC, et al. Inhaled ozone (O3)-induces changes in serum metabolomic and liver transcriptomic profiles in rats. Oxicology and Applied Pharmacology. (2015) ; 286: (2): 65-79. |
[22] | Miller DB, Snow SJ, Henriquez A, Schladweiler MC, Ledbetter AD, Richards JE, et al. Systemic metabolic derangement, pulmonary effects, and insulin insufficiency following subchronic ozone exposure in rats. Toxicol Appl Pharmacol. (2016) ; 306: (24): 47-57. |
[23] | Delfino RJ, Staimer N, Tjoa T, Polidori A, Arhami M, et al. Circulating biomarkers of inflammation, antioxidant activity, and platelet activation are associated with primary combustion aerosols in subjects with coronary artery disease. Environ. Health Perspect. (2008) ; 116: (5): 898-906. |
[24] | Bao A, Liang L, Li F, et al. Effects of acute ozone exposure on lung peak allergic inflammation of mice. Frontiers in Bioscience. (2013) ; 18: (9): 838-851. |
[25] | Jiang LQ, Duque-Guimaraes DE, Machado UF, et al. Altered response of skeletal muscle to IL-6 in type 2 diabetic patients. Diabetes. (2013) ; 62: (2): 355-361. |
[26] | Kewal RG, Bilan PJ, Klip A. Muscle insulin resistance: Assault by lipids, cytokines and local macrophages. Curr Opin Clin Nutr Metab Care. (2010) ; 13: (4): 382-390. |
[27] | Alvarez HAO, Kubzansky LD, Carnpen MJ, Slavich GM. Early life stress, air pollution, inflammation, and disease: An integrative review and immunologic model of social-environmental adversity and lifespan health. Neurosci Biobehav Rev. (2018) ; 92: : 226-242. |
[28] | Ying Z, Allen K, Zhong J, Chen M, Williams KM, Wagner JG, et al. Subacute inhalation exposure to ozone induces systemic inflammation but not insulin resistance in a diabetic mouse model. Inhalation Toxicology. (2016) ; 28: (4): 155-163. |
[29] | Vella RE, Pillon NJ, Zarrouki B, Croze ML, Koppe L, Guichardant M, et al. Ozone exposure triggers insulin resistance through muscle c-Jun N-terminal kinase activation. Diabetes. (2015) ; 64: (3): 1011-1024. |
[30] | Gackiere F, Saliba L, Baude A, Bosler O, Strube C. Ozone inhalation activates stress-responsive regions of the CNS. Journal of Neurochemistry. (2011) ; 117: : 961-972. |
[31] | Thomson EM, Vladisavljevic D, Mohottalage S, Kumarathasan P, Vincent R. Mapping acute systemic effects of inhaled particulate matter and ozone: Multiorgan gene expression and glucocorticoid activity. Toxicol Sci. (2013) ; 135: : 169-181. |
[32] | Arjomandi M, Wong H, Donde A, Frelinger J, Dalton S, Ching W, Power K, Balmes JR. Exposure to medium and high ambient levels of ozone causes adverse systemic inflammatory and cardiac autonomic effects. Am J Physiol Heart Circ Physiol. (2015) ; 308: (12): H1499-H1509. |
[33] | Millers DB, Ghio AJ, Karoly ED, Bell LN, Snow SJ, Madden MC, et al. Ozone exposure increases circulating stress hormones and lipid metabolites in humans. American Journal of Respiratory and Critical Care Medicine. (2016) ; 193: (12): 1382-1391. |
[34] | Hatch GE, Slade R, Harris LP, McDonnell WF, Devlin RB, et al. Ozone dose and effect in humans and rats. A comparison using oxygen-18 labeling and bronchoalveolar lavage. American Journal of Respiratory and Critical Care Medicine. (1994) ; 150: (3): 676-683. |


