
Study on the detection of anthrax by ICP-MS based on gold nanoparticle labeling
Abstract
BACKGROUND:
In recent years, inductively coupled plasma mass spectrometry (ICP-MS) has been widely used in the field of molecular biology because of its unique advantages. Anthrax is a widespread and long-standing infectious disease, which affects and restricts people’s work and life seriously.
OBJECTIVE:
The study goal is to develop a new method for the detection of anthrax.
METHODS:
A rapid, sensitive and accurate method for the detection of anthrax characteristic DNA was proposed by combing gold nanoparticles (AuNPs) and inductively coupled plasma mass spectrometry.
RESULTS:
The linear range of this method is 100–2500 pmol/L and the limit of detection of 16.61 pmol/L.
CONCLUSION:
The proposed method has numerous advantages, including simplicity of operation, high sensitivity, and specificity, which provides a new idea for the detection of anthrax. Importantly, this methodology has good potential for the detection of other biological substances such as bacteria and viruses by changing the modification sequence on the nanoparticle probe.
1.Introduction
Anthrax is an infectious disease caused by Bacillus Anthracis. It poses a severe public health and safety threat due to its low infectivity, high lethality, ease of production, and transmission. Anthrax infections occur every year, and human cases are often zoonotic. At the same time, Bacillus Anthracis belongs to class A bioterrorism agents, because of their potential to rapidly cause severe disease and death, and may be weaponized [1]. Therefore, accurate and rapid detection of Bacillus Anthracis is essential to ensure public health safety. Currently, there are three main types of methods for detecting anthrax, including the earliest bacteriological test [2], which takes too long; the most commonly used serological test [3, 4], but other bacteria can easily cross-react; and the rapid development of molecular biological test in recent years [5, 6], typical molecular biological detection methods include PCR technology and DNA molecular hybridization technology.
Inductively coupled plasma mass spectrometry (ICP-MS) is an element analysis technology with high sensitivity, strong anti-interference, and multi-component analysis ability [7, 8]. Metal nanoparticles have been widely used in the detection of biological samples by ICP-MS due to their unique advantages. For example, Zhang Xinrong’s team detected and distinguished three clinical diseases (HIV, HAV, and HBV) [9] and six intestinal related bacteria [10], Hu Bin’s team successively detected circulating tumor cells (HepG2) [11], and target DNA in human serum samples [12] has also been applied to the detection of the novel coronavirus disease (SARS-CoV-2) [13, 14]. In particular, Au nanoparticles with a diameter of 10 nm contain about 30, 000 Au atoms [15]. Therefore, the use of gold nanoparticle probes can significantly amplify the signal, making the detection more sensitive and lowering the detection limit. At the same time, ICP-MS is particularly suitable for the detection and analysis of anthrax due to its simpler process for detecting biological samples, its more concise and clear results, and its ability to provide quantitative information while identifying species. However, the application of this technique to anthrax detection has not been studied and reported.
In this study, a complex was generated based on the principle of DNA molecular hybridization using AuNP-labeled report probes, biotin-labeled capture probes, and nucleic acid fragments characteristic of anthrax. The resulting complex was fixed on a plate using a biotin-streptavidin system and the excess reactants were removed after washing. The complex was then pressed on a plate and finally, the
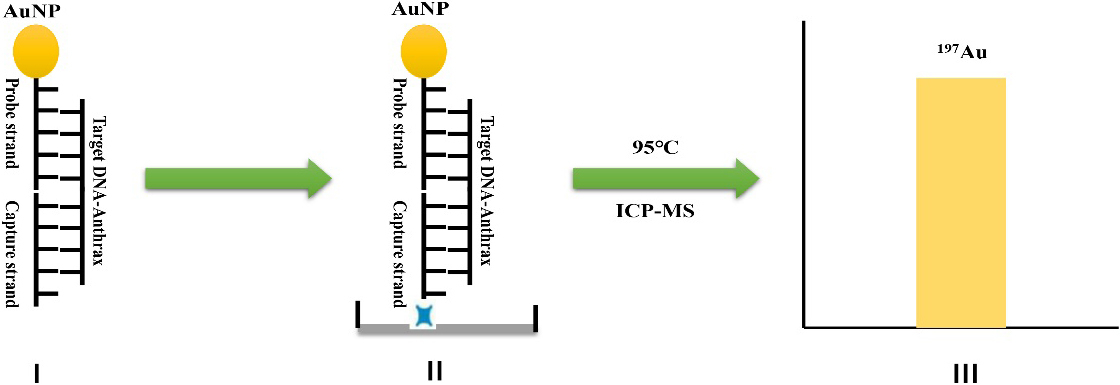
Figure 1.
Schematic diagram of detecting characteristic DNA fragment of anthrax by ICP-MS based on the amplification of gold nanoparticle: (I) hybridization; (II) incubation; (III) detection.
2.Experimental section
2.1Apparatus and reagents
A PQMS Elite ICP-MS (Analytik Jena AG, Jena, Germany) was used for the detection of
Table 1
Instrument parameters for ICP-MS
| Operating parameter | |
|---|---|
| RF power (kW) | 1.35 |
| Plasma flow (L/min) | 9.0 |
| Auxiliary flow (L/min) | 1.65 |
| NebuLizer gas flow (L/min) | 1.10 |
| Dwell time (ms) | 60 |
| Rinse time (s) | 10 |
| Sampling depth (mm) | 5.0 |
Table 2
The DNA sequence used in hybridization reaction
| Names | Sequences (5’-3’) |
|---|---|
| BA-rpoB-target | GTA CGC CAA TCG ATA TCA TGT TAA ACC |
| BA-rpoB-probe | TAT CGA TTA GCG TAC-(A) |
| BA-rpoB-capture | biotin-(A) |
| BA-rpoB-1 | GTA CGT CAA TCG ATA TCA TGT TAA ACC |
| BA-rpoB-2 | GTA CAT CAA TCG ATA TCA TGT TAA ACC |
| YPE-pla-targe | ACT ACG ACT GGA TGA ATG AAA ATC |
| ORF-1ab-target | TGG TAA TGC AAC AGA AGT GCC TGC CAA TTC |
All oligonucleotides used in this study were synthesized and HPLC-purified by Sangon Biotech Co., Ltd. (Shanghai, China), their sequences and modifications are listed in Table 2. BA-rpoB, YPE-pla, ORF-1ab target probes were the characteristic sequences of Bacillus Anthracis, Yersinia Pestis, and SARS-CoV-2, with a length of 24–30 bases. BA-rpoB 1–2 were mismatched oligonucleotides. BA-rpoB probe was a 3’end modified sulfhydryl (-SH) labeled probe, which could be used to label DNA probes by combining sulfhydryl with AuNPs. BA-rpoB capture was a capture probe of 5’end modified biotin, which could capture hybridization products by combining with 96 well microplates coated with streptavidin.
20 nm gold nanoparticles (AuNPs, 0.05 mg/mL) were purchased from Zhongkeleiming Technology Co., Ltd. (Beijing, China). Tris (2-carboxyethyl) phosphine (TCEP, pH 6.8, 0.5 mol/L) was purchased from Phygene Biotechnology Co., Ltd. (Fuzhou, China). Streptavidin-coated 96 well microplates were purchased from Beaver Biomedical Engineering Co., Ltd. (Suzhou, China). Ethylenediaminetetraacetic acid (EDTA, pH 8.00, 5 mol/L,) and tris (hydroxymethyl) aminomethane (Tris-HCl, pH 7.4, 1 mol/L) were purchased from Sangon Biotech Co., Ltd. (Shanghai, China).
A series of buffers used in this work are as follows:
PBS buffer: 137 mmol/L NaCl, 2.7 mmol/L KCl, 8 mmol/L Na
Other conventional reagents were taken from the laboratory, and all reagents used were at least of analytical reagent grade. Ultrapure water (16.7
2.2Preparation and characterization of AuNPs-modified DNA
The method of the AuNPs-modified recognition probe was referred to the relevant literature and modified appropriately [16, 17], as follows.
The company offers DNA fragments attached to the wall of a tube in the shape of a very light dry film. Each tube was equipped with 1 OD and each tube had an identification probe of 3.76 nmol. First centrifuge the centrifuge tube (4000 r/min, 60 s), and then add 37.6
Before modification, the thiolated nucleic acid fragment needs to be reduced to break the S-S bond. 6
The UV-vis absorption spectrum analysis was performed on the nanoparticle solution before and after labeling. According to the red shift of the maximum absorption peak of the solution caused by the increase of the radius of the gold nanoparticle modification, it could be judged whether the nanoparticle and the identification probe were successfully connected [12].
2.3DNA hybridization reaction
First, 10
2.4ICP-MS testing
Before measuring the sample by ICP-MS, first, make sure that the instrument was in normal working condition. Use the tuning solution provided by Jena Instruments, Germany (containing 1 ppb of Be, Mg, Co, Ba, Pb, Ce, In, Bi) for mass spectrometry tuning, mainly to observe whether the signal sizes of
Figure 2.
(A) Results of single ICP-MS measurement of AuNPs solutions with different concentrations; (B) Quantitative relationship between the concentration of AuNPs and the signal intensity of gold detected by ICP-MS.
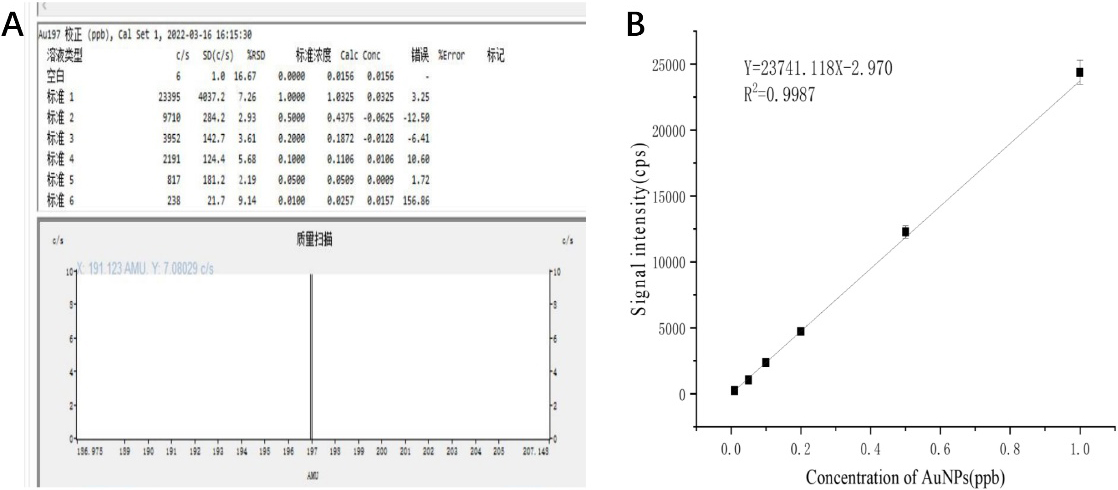
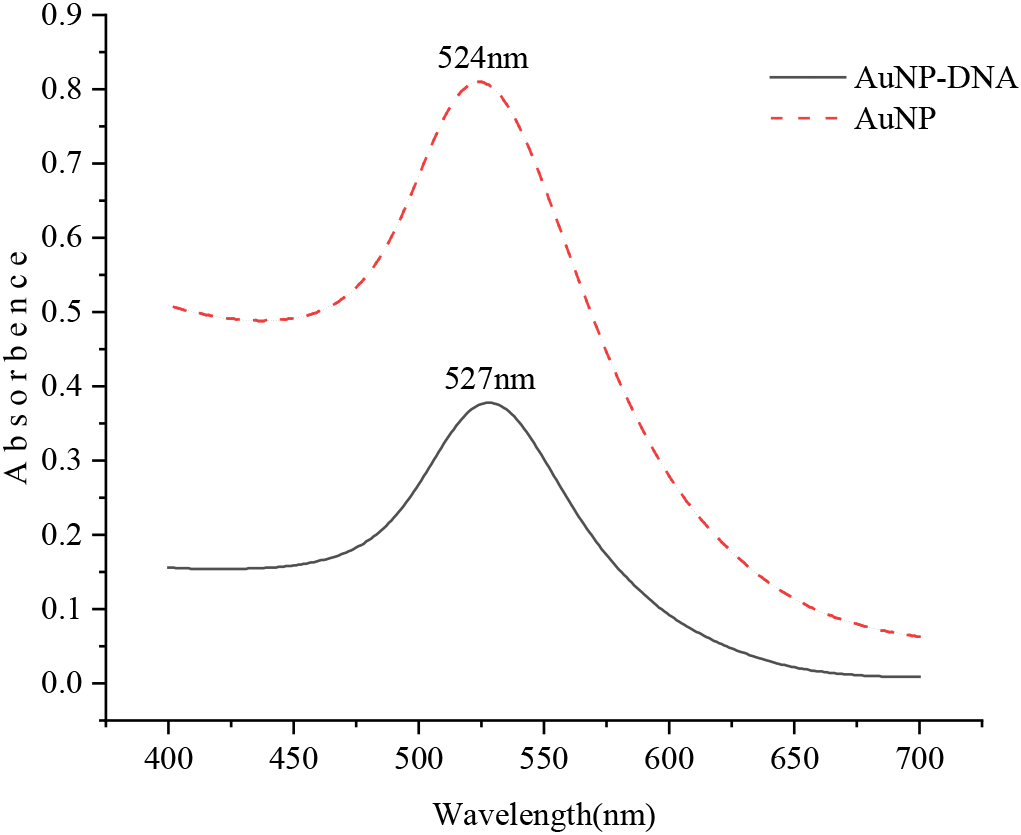
Figure 3.
UV-vis spectra before and after AuNP modified recognition probe.
3.Results and discussion
3.1ICP-MS detection of gold nanoparticle solution
The designed process for the detection of characteristic DNA fragments of anthrax is shown in Fig. 1. In order to verify the feasibility of DNA quantitative detection by ICP-MS based on gold nanoparticle probes, the gold nanoparticle solutions with different solubility were detected by ICP-MS first. 2 mL of gold nanoparticle solution with concentrations of 1.0 ppb, 0.5 ppb, 0.2 ppb, 0.1 ppb, 0.05 ppb, and 0.01 ppb were prepared for machine detection. Figure 2A shows the results of a single ICP-MS measurement on a solution of AuNPs solutions at different concentrations. The ICP-MS instrument will read each sample three times, and we also repeated the experiment three times for each set of samples. As can be seen, linear fitting was performed on the experimental data, as shown in Fig. 2B, the concentration of AuNPs was linearly correlated with the signal intensity of ICP-MS within the range of 0.01 ppb to 1 ppb, Y
3.2Characterization and analysis of labeled probe DNA
The AuNPs solution before and after the reaction was scanned by UV-visible spectrophotometer with a wavelength range of 400–700 nm, as shown in Fig. 3. The highest absorption peak of the AuNPs solution was at 524 nm, and the highest absorption peak of the nanometer particle solution combined with the identification probe was at 527 nm. The absorbance value ranged from 0.810 to 0.378, indicating that the nanoparticles were successfully labeled with the recognition probe. At the same time, it was found that the nanoparticles would accumulate and sink in DNA-free gold nanoparticles solution when the precipitate was dissolved in PBS buffer by centrifugation, and the color of the solution would also change significantly. Nanoparticles modified with DNA, however, do not converge and sink, and the color of the solution is basically unchanged. This phenomenon also suggests that the nanoparticles have modified DNA successfully.
3.3Optimization of experimental conditions
The effect of many key parameters affecting the performance of the method was investigated, including the amount of biotin-labeled probe and AuNPs-labeled probe, the reaction time of hybridization product and microplate, dwell time of ICP-MS [12, 13, 18, 19]. The amount of target probe was investigated as 1 nmol/L.
3.3.1Selection of ICP-MS dwell time
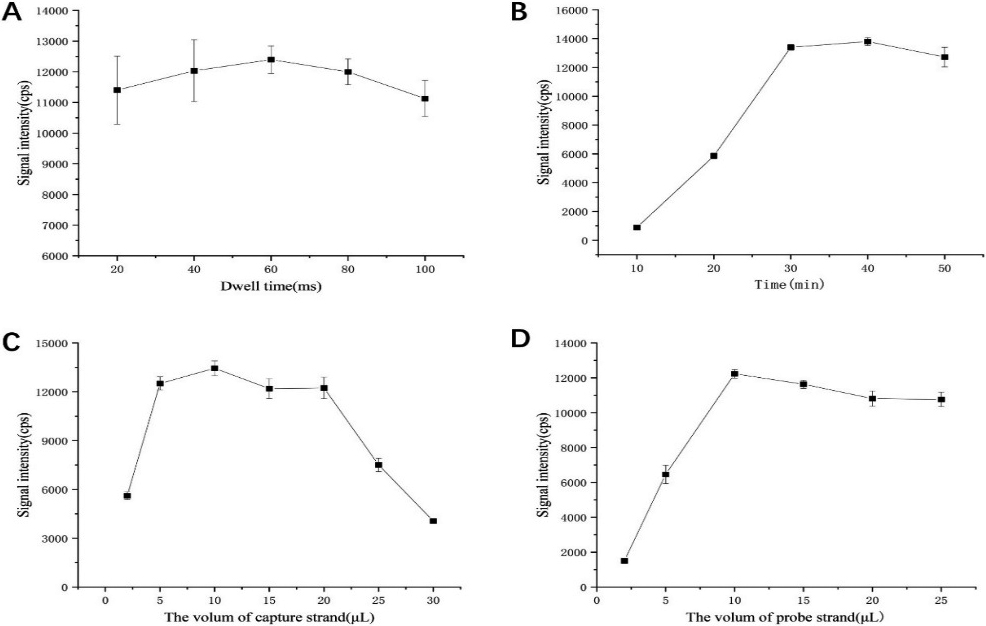
Firstly, the influence of the residence time of ICP-MS in 20–100 ms on the signal intensity detection of gold nanoparticles was studied. Here we directly used 0.5 ppb gold nanoparticle solution to select the best detection conditions by changing the dwell time of the instrument. As can be seen from Fig. 4A, strong signals can be detected within the dwell time of 20–100 ms, reaching the maximum at 60 ms, and the RSD at 60 ms and 80 ms are relatively small. Therefore, the dwell time of ICP-MS was chosen to be 60 ms in the subsequent experiments.
Figure 4.
The optimization of experimental conditions: (A) influence of instrument dwell time; (B) influence of the reaction time between hybrid product and microplate; (C) influence of biotin-labeled probe amount; (B) influence of gold nanoparticle-labeled probe amount.
3.3.2Selection of reaction time between hybrid products and microplates
We selected the effect of reaction time between the hybridization product and microplate in 10–50 min time on the final detected gold signal intensity. As can be seen from Fig. 4B, the signal intensity increases sharply and then almost stays the same within the reaction time of 10–30 min. In order to control the reaction time of the whole reaction, the reaction time between the hybrid product and the microplate was chosen to be 30 min in the subsequent experiments.
3.3.3Selection of biotin-labeled probe amount
We selected the effect of the biotin-labeled probe in a volume of 2–30
3.3.4Selection of AuNPs-labeled probe amount
We selected the effect of AuNPs-labeled probes in a volume of 2–25
3.4Sensitivity and specificity
Under optimized experimental conditions, anthrax target DNA was detected at concentrations ranging from 0 to 10000 pmol/L and repeated the experiment three times for each group of samples. The obtained experimental data are processed and linearly fitted, as can be seen from Fig. 5A, the gold element signal detected by ICP-MS increased linearly (Y
Table 3
Investigation on spiked recovery of complex samples
| Sample | Added (nmol/L) | Theoretical (nmol/L) | Found (nmol/L) | Recovery (nmol/L) |
|---|---|---|---|---|
| 1 | 0.50 | 0.75 | 0.71 | 84.0 |
| 2 | 1.00 | 1.00 | 1.07 | 114.0 |
| 3 | 2.00 | 1.50 | 1.47 | 97.0 |
Figure 5.
(A) Q
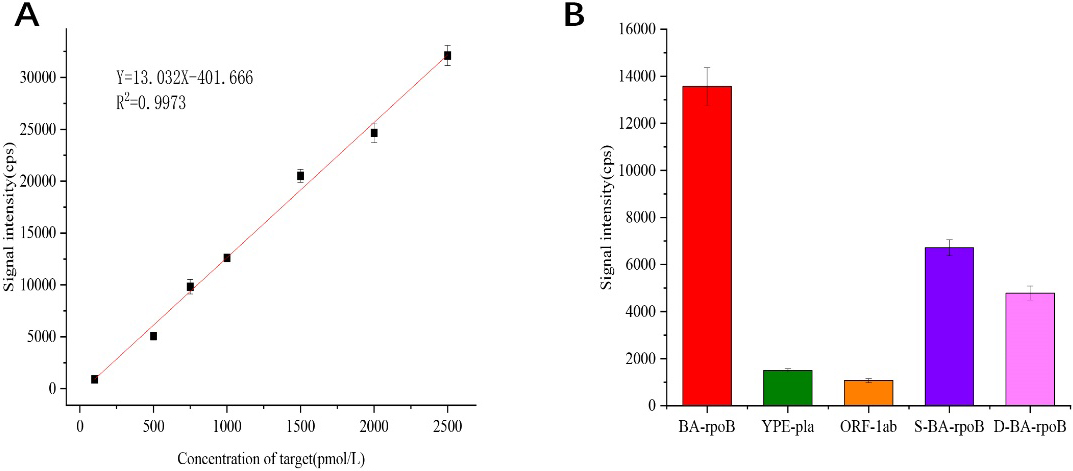
To investigate the specificity of this method for anthrax target DNA detection, different target DNA solutions were analyzed. We tested anthrax (BA-rpob-target), plague (YPE-pla-target), and coronavirus (ORF-1ab-target) target DNA, and DNA with single and double base mismatch with anthrax target sequence (S-BA-rpoB, D-BA-rpoB) solutions at concentrations of 1 nmol/L, and repeated the experiment three times for each set of samples. As can be seen from Fig. 5B, the signal intensity of the perfectly matched anthrax target DNA is significantly different from that of the other four target DNA. It shows that this method has better specificity.
3.5Recovery in complex samples
The detection of anthrax samples commonly requires the extraction of genomic DNA from the organism, and then pyrolysis to make the DNA in a single-strand-free state in practical applications, so there will be a large amount of irrelevant DNA in the sample at this time. Therefore, we added plague (YPE-pla) and novel coronavirus (ORF-1ab) target DNA into the samples to simulate the detection environment in practical application. They had similar DNA strand lengths but entirely different sequences from the targets to be tested. The concentrations of anthrax, plague, and COVID-19 in the above samples were all 1 nmol/L, and the hybridization reaction was carried out and then tested according to the previous experimental procedure. The results showed that anthrax target DNA could be detected. In addition, we also carried out the spiked recovery experiment, and the standard dosage was 10
| Abbreviation: | |||
|---|---|---|---|
| Acronyms | Full Name in English | Acronyms | Full Name in English |
| ICP-MS | Inductively Coupled Plasma Mass | SARS-CoV-2 | Novel Coronavirus |
| Spectrometry | |||
| DNA | Deoxyribonucleic Acid | HPLC | High Performance Liquid Chromatography |
| AuNP | Gold Nanoparticle | TCEP | Tris (2-carboxyethyl) phosphine |
| HIV | Human Immunodeficiency Virus | EDTA | Ethylene Diamine Tetraacetic Acid |
| HAV | Hepatitis A Virus | DECP | Diethyl Pyrocarbonate |
| HBV | Hepatitis B Virus | RSD | Relative Standard Deviation |
| HepG2 | Human Hepatoellular Carcinomas | LOD | Limit of Detection |
4.Conclusion
By combining the signal amplification effect of ICP-MS and AuNPs with powerful elemental analysis ability, we constructed a highly sensitive method for anthrax-characteristic DNA detection. The whole detection process is simple, fast, and specific. The sample volume consumed is only 10
Conflict of interest
None to report.
References
[1] | Banada PP, Deshpande S, Banik S, Shah D, Koshy R, Patel B, Kwiatkowski R, Persing D, Alland D. Multiplex detection of three select agents directly from blood by use of the GeneXpert system. Journal of Clinical Microbiology. (2019) ; 57: (5): e00036-19. |
[2] | Schofield DA, Molineux IJ, Westwater C. ‘Bioluminescent’ reporter phage for the detection of category a bacterial pathogens. Journal of Visualized Experiments. (2011) ; 53: : 1-3. |
[3] | Mechaly A, Vitner E, Levy H, Weiss S, Bar-David E, Gur D, Koren M, Cohen H, Cohen O, Mamroud E, Fisher M. Simultaneous immunodetection of anthrax, plague, and tularemia from blood cultures by use of multiplexed suspension arrays. Journal of Clinical Microbiology. (2018) ; 56: (4): e01479-17. |
[4] | Aloni-Grinstein R, Schuster O, Yitzhaki S, Aftalion M, Maoz S, Steinberger-Levy I, Ber R. Isolation of Francisella tularensis and Yersinia pestis from blood vultures by plasma purification and immunomagnetic separation accelerates antibiotic susceptibility determination. Frontiers in Microbiology. (2017) ; 8: : 00312. |
[5] | Matero P, Hemmila H, Tomaso H, Piiparinen H, Rantakokko-Jalava K, Nuotio L, Nikkari S. Rapid field detection assays for Bacillus anthracis, Brucella spp, Francisella tularensis and Yersinia pestis. Clinical Microbiology and Infection. (2011) ; 17: (1): 34-43. |
[6] | Gargis AS, Cherney B, Conley AB, McLaughlin HP, Sue D. Rapid detection of genetic engineering, structural variation, and antimicrobial resistance markers in bacterial biothreat pathogens by nanopore sequencing. Scientific Reports. (2019) ; 9: : 13501-14. |
[7] | Al-Hakkani MF. Guideline of inductively coupled plasma mass spectrometry “ICP-MS”: Fundamentals, practices, determination of the limits, quality control, and method validation parameters. SN Applied Sciences. (2019) ; 1: (7): 791. |
[8] | Li ZY, Liu R, Lv Y. ICPMS based multiplexed bioassay: Principles, approaches and progresses. Applied Spectroscopy Reviews. (2021) . doi: 10.1080/05704928.2021.1918703. |
[9] | Zhang SX, Han GJ, Xing Z, Zhang SC, Zhang XR. Multiplex DNA assay based on nanoparticle probes by single particle inductively voupled plasma mass spectrometry. Analytical Chemistry. (2014) ; 86: (7): 3541-3547. |
[10] | Zhang YQ, Sun GW, Hu Z, Xing Z, Zhang SC, Zhang XR. A multiplex bacterial assay using an element-labeled strategy for 16S rRNA detection. Analyst. (2020) ; 145: (21): 6821-6825. |
[11] | Li XT, Chen BB, He M, Hu B. Immunodetection and counting of circulating tumor cells (HepG2) by combining gold nanoparticle labeling, rolling circle amplification and ICP-MS detection of gold. Microchimica Acta. (2019) ; 186: (6): 344. |
[12] | Xiao GY, Chen BB, He M, Li XT, Hu B. A highly sensitive assay of DNA based on inductively coupled plasma mass spectrometry detection with gold nanoparticle amplification and isothermal circular strand-displacement polymerization reaction. Talanta. (2019) ; 202: : 207-213. |
[13] | Li ZY, Chen X, Huang ZL, Zhou J, Liu R, Lv Y. Multiplex nucleic acid assay of SARS-CoV-2 via a lanthanide nanoparticle-tagging strategy. Analytical Chemistry. (2021) ; 93: (37): 12714-12722. |
[14] | Xu Y, Chen BB, He M, Hu B. A homogeneous nucleic acid assay for simultaneous detection of SARS-CoV-2 and influenza A (H3N2) by single-particle inductively coupled plasma mass spectrometry. Analytica Chimica Acta. (2021) ; 1186: : 339134. |
[15] | Lores-Padin A, Menero-Valdes P, Fernandez B, Pereiro R. Nanoparticles as labels of specific-recognition reactions for the determination of biomolecules by inductively coupled plasma-mass spectrometry. Analytica Chimica Acta. (2020) ; 1128: : 251-268. |
[16] | Hurst SJ, Lytton-Jean AKR, Mirkin CA. Maximizing DNA loading on a range of gold nanoparticle sizes. Analytical Chemistry. (2006) ; 78: (24): 8313-8318. |
[17] | Li BR, Tang H, Yu RQ, Jiang JH. Single-nanoparticle ICP-MS for sensitive detection of uracil-DNA glycosylase activity. Analytical Chemistry. (2021) ; 93: (24): 8381-8385. |
[18] | Yin X, Chen BB, He M, Hu B. A homogeneous multicomponent nucleic acid enzyme assay for universal nucleic acid detection by single-particle inductively coupled plasma mass spectrometry. Analytical Chemistry. (2021) ; 93: (11): 4952-4959. |
[19] | Xu Y, Xiao GY, Chen BB, He M, Hu B. Single particle inductively coupled plasma mass spectrometry-based homogeneous detection of HBV DNA with rolling circle amplification-induced gold nanoparticle agglomeration. Analytical Chemistry. (2022) ; 94: (28): 10011-10018. |


