
Time-efficient implantable catheters for draining malignant ascites in terminal cancer patients
Abstract
BACKGROUND:
There is a need for an improved version of the implantable catheter for malignant ascites in the abdominal cavity.
OBJECTIVE:
New implantable catheters have been developed that drain ascites from the abdominal cavity to the bladder by applying pressure. Based on pigtail catheters, these newly designed catheters have silicone membranes and apertures.
METHODS:
Experimental instruments controlled flow rates and water level to observe changes of the activation pressure and its cycle time along flow rates and turns of catheters. Furthermore, various normality tests, difference tests and non-parametric tests were investigated to observe statistical validity.
RESULTS:
Cycle times were significantly affected by flow rate (3/4 cases of
CONCLUSION:
Overall, there was no significant difference between cycle times for 1.5 turns and 2.0 turns of catheters. In addition, catheters with 1.5 turns have a lower activation pressure than catheters with 2.0 turns. It is possible to customize catheters based on the ascites excretion and urination rates of various terminal patients.
1.Introduction
In contrast to the poor outcomes associated with past cancer treatments, most cancers are currently considered treatable diseases because the associated mortality rate is gradually decreasing [1, 2]. However, there are many problems with the treatment process, therefore, the disease is still considered a time-limited sentence [3]. Late-stage cancer treatment is occasionally aimed at complete recovery; nonetheless, some patients sign do-not-resuscitate orders of their own volition [4] and receive hospice care, aiming to achieve a greater quality of life while trying to relieve their symptoms and prepare for death [5, 6].
One of the symptoms of cancer that impacts patients’ quality of life is accumulated malignant ascites in the abdominal cavity (AC) [7, 8, 9]. These interfere with the patient’s behavior and daily life; therefore, patients should visit a hospital frequently to drain them. Medical staff use large-volume paracentesis to drain ascites, but at least 30 minutes and up to 24 hours are needed for this process [10, 11]. The times are precious for patients since they only have 20 weeks from the time-limited sentence [12, 13]. Furthermore, ascites drainage may cause infection, bowel perforation, and bleeding.
Various ascites drainage methods and devices have been devised to overcome such surgical complications. Solbach et al. [14] researched a traditional but time-efficient paracentesis catheter. Their research focused on catheter systems that are implantable in the abdomen, allowing patients to drain ascites whenever and wherever they have access to proper drainage devices. Stirnimann et al. and Fotopoulou et al. [15, 16] researched a novel kind of ascites drainage with ‘Alfapump.’ In their research, ascites in the AC are drained through the bladder, and positive results were observed in the paracentesis flow rate and procedure frequency. However, batteries should be prepared to run these electrical devices.
In addition to these studies, we devised another implantable paracentesis method, which helps ascites drainage through the bladder cavity (BC) and urethra by inserting the implantable catheter between the bladder wall and the AC [17]. Although previous catheters did not produce ideal results, we ascertained the possibility of the clinical potential of ascites-draining catheters connecting the AC and BC.
Implantable catheters at the bladder wall are considerably affected by pressure diferntials between the BC and AC. However, this method may cause infection if the fluid in the BC moves to the AC. The pressure in the BC was 8 cmH2O when people feel the need to urinate, and the pressure at the time of urination was between 3 and 5 cmH2O [18]. In addition, the pressure in the AC was 15 and 3 cmH2O before and after the paracentesis procedure, respectively [19].
However, the pressure differential between the AC after paracentesis and the BC when need to urinate makes concerns about urine’s countercurrent. However, the implantable catheter does not release ascites at once but continuously according to pressure relations. Thus, the pressure in the BC may be sustained up to 8 cmH2O, lower than 15 cmH2O in the AC, because people urinate as soon as they feel the need and the catheter would be expected to work well.
An improved version of the implantable catheter for malignant ascites in the AC was designed and fabricated in this study. Following conforming the catheter’s performance, the liquid-releasing activation pressure and cycle time were observed by fluid movement according to the pressure conditions on the catheter. Moreover, experiments were designed to determine whether there were significant differences in cycle times and activation pressures with respect to flow rates and turns of catheters.
2.Methods
The primary function of the catheter is to allow fluid movement from the AC to the BC by pressure differentials, but not vice versa, from the BC to the AC. However, it had to be durable since it can be used in patients until for long periods. Thus, the catheter’s design avoided complex structures to have secure durability as much as possible.
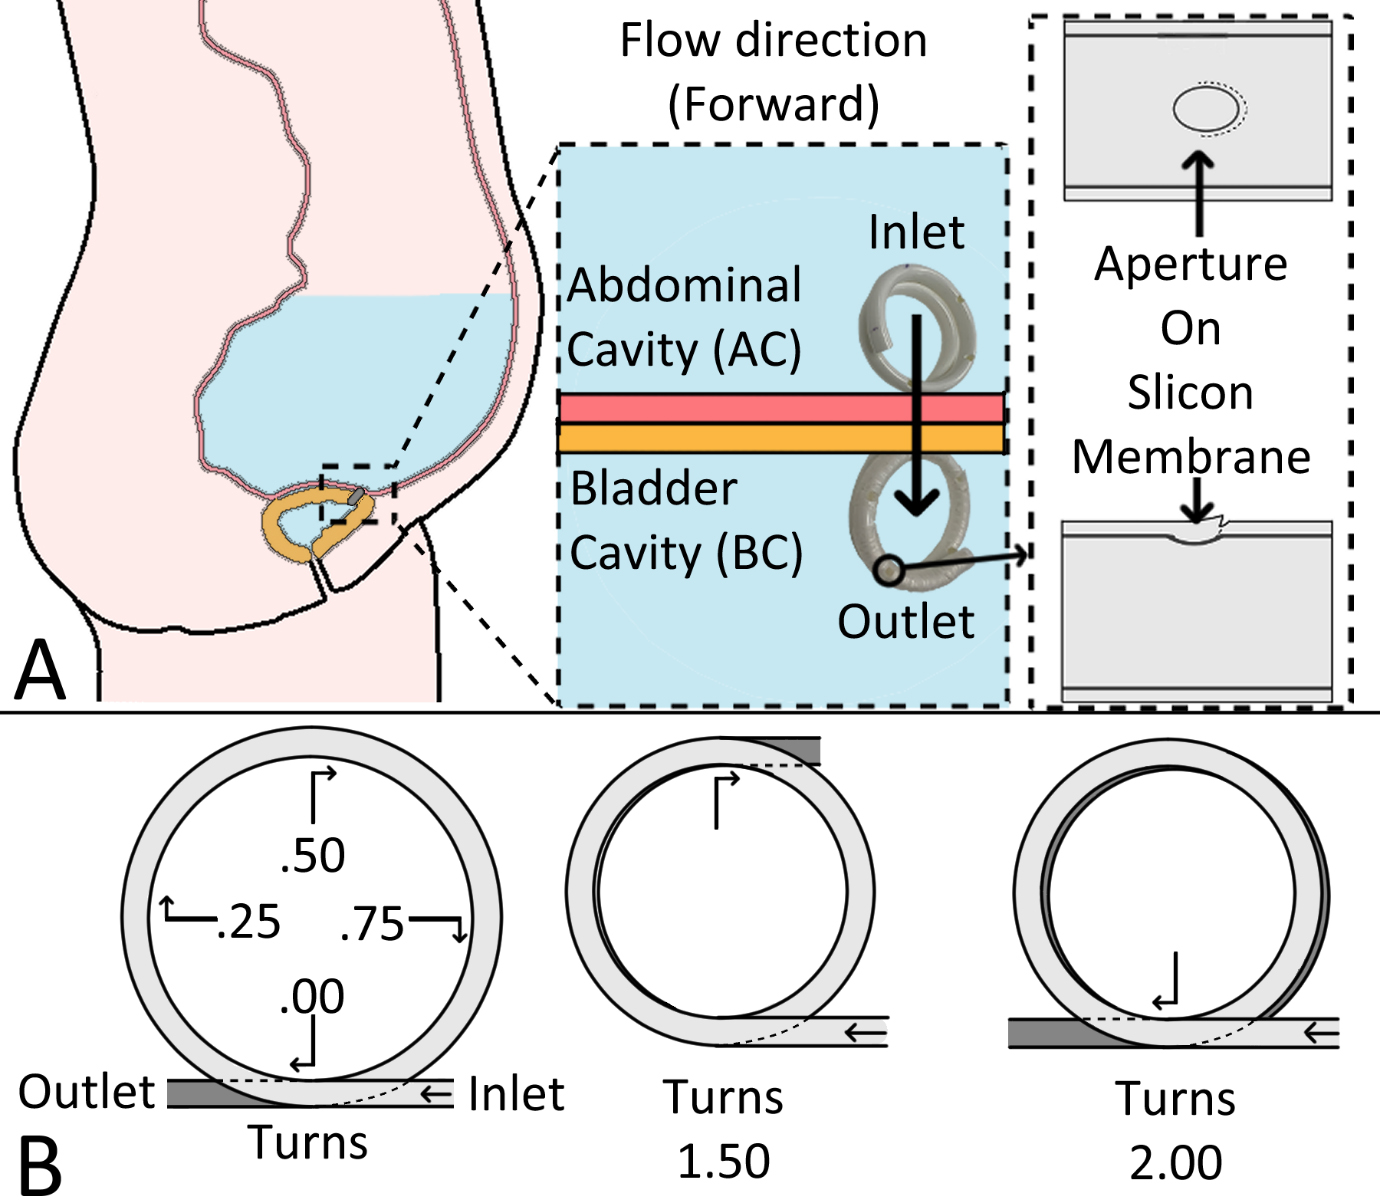
Therefore, we decided to use a improved version of the widely-used pigtail catheter. Based on the original pigtail catheter, which allows fluid to flow in both directions, we designed a new version that allows only unidirectional flow. We used versions of this novel catheter with different numbers of turns: 1.5 and 2 turns, respectively. Figure 1 shows an image of the fabricated catheters and their design.
Figure 1.
The newly-designed implantable catheters with silicone apertures to prevent backflow. A: the expected implanting position of the catheter and its features B: the definition of ‘turns.’
Based on most actual human body conditions, which show relatively higher pressure in the AC than the BC, experimental instruments were placed to apply a higher pressure at the catheter’s inlet and atmospheric pressure at the outlet. Bernoulli’s principle was used to control pressures in a cylinder that contained the catheter’s inlet side; if a number of factors on the catheter’s inlet side are ‘i’, and the outlet side is ‘o’, Bernoulli equation for this condition is the same as Eq. (1). In our experimental condition, current velocity(v) was negligible since it was not significantly different between inlet and outlet of the catheter. In this case, the Bernoulli equation can be transformed into Eq. (2). Furthermore, if the pressure in the cylinder is atmospheric, Eq. (3) can be used. Consequently, the activation pressure compared to atmospheric pressure is the same as the gap between the water levels at the inlet and outlet.
(1)
(2)
(3)
Water to activate the catheters with pressure was supplied from the bottom side of the cylinder through two syringe pumps with stepper motors. The overall experimental setup is shown in Fig. 2.
Figure 2.
Experimental setup to test the designed catheters. The initial water level of the experiments was at the lowest located aperture.
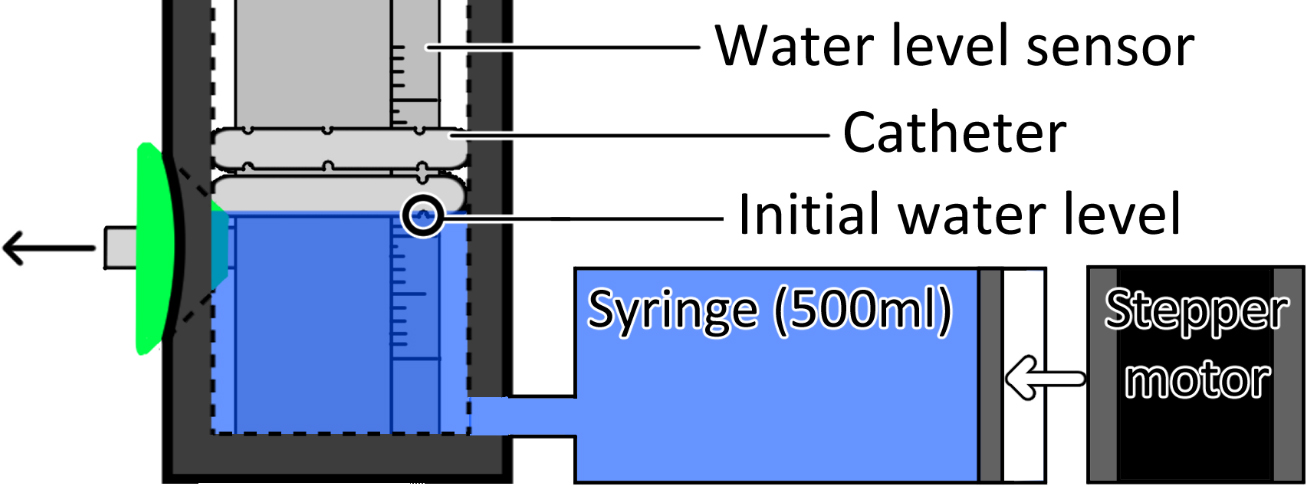
The water height in the cylinder was checked using a water level sensor to calculate the pressure at the catheter in cmH2O. The sinitialwater level was set at the first contact point with catheter’s aperture. We confirmed the relationship between the catheter’s activation pressure and the water level.
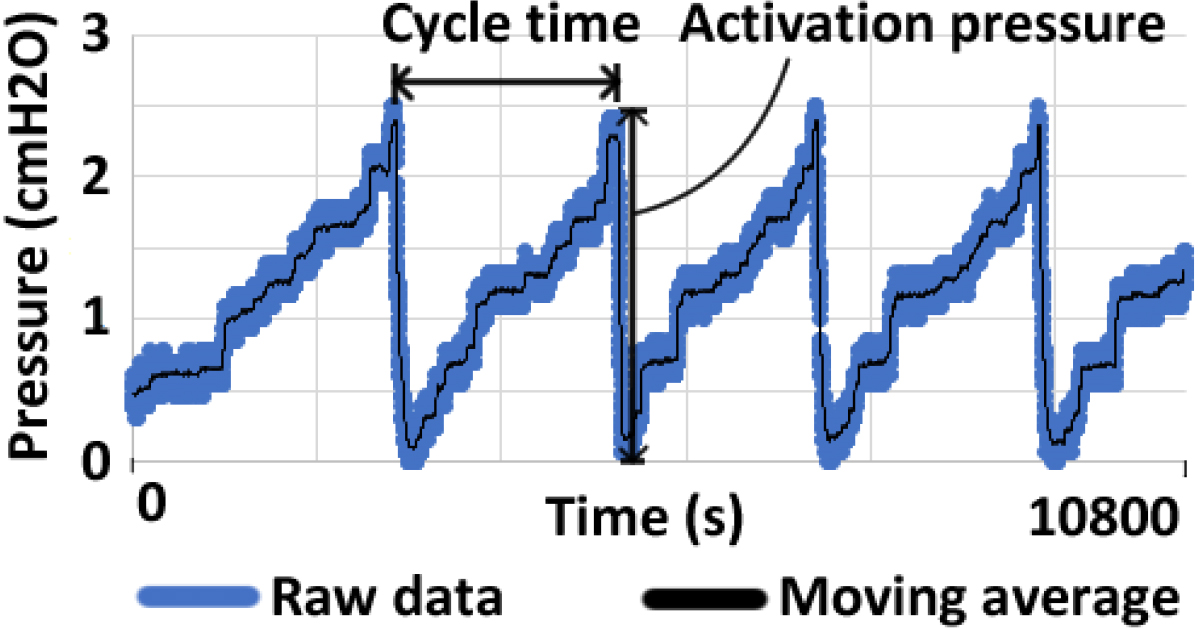
The following procedures were followed in order to conduct the experiments: first, attach the water level sensor and catheter to the cylinder, and then fill the cylinder with water to the initial level as shown in Fig. 2. Second, set the flow rate, ranging from 20 ml per hour to 100 ml per hour for stepper motors. The last step is to start the stepper motor and observe the experimental data over a period of three hours. Using a water level sensor, changes in water level were recorded. As a result of the experiments, the data were processed in the following manner: applying a moving average over 20 samples and smoothing the data. Check the peak point of the data in order to determine the cycle time of the experimental results. After finding the bottom point of data, the activation pressure was observed. Figure 3 illustrates these processes.
In experiments, the catheter’s inlet side was placed in the cylinder to observe whether it allowed water to flow correctly in the forward direction (from the AC to the BC). The outlet side was separately placed in the cylinder to determine whether flow from the opposite direction (from the BC to the AC) was prevented. The former and latter conditions were named ‘forward’ and ‘reverse,’ respectively, in these experiments. We aimed to confirm how much pressure is required for the catheter to allow water flow, how frequently the flow is discharged, and whether different trends were found in the reverse and forward directions.
The flow rates of the syringe pump during experiments were 20, 40, 60, 80, and 100 ml/hour for the forward experiments. In addition, the flow rates of the reverse experiments were 20, 40, and 60 ml/hour. High flow rates, 60 and 80ml/hour, were excluded because they will not be observed in actual condition when the user urinates. In other words, high flow rates for the reverse experiments were not applicable. Four catheters with 1.5 turns (T1.5) and 2.0 turns (T2.0) were used. Each experiments were conducted for 10800 seconds, four times for each flow rate condition. Table 1 shows the experimental variables.
Table 1
Experimental variables of experiments
| Flow rate (forward; ml/hour) | Flow rate (reverse; ml/hour) | Turns of the catheter | Experiment time (seconds) |
| 20 | 20 | 1.5 | 10800 |
| 40 | 40 | 2.0 | |
| 60 | 60 | ||
| 80 | |||
| 100 |
Figure 3.
Image to explain data processing with an example data.
Afterward, data were analyzed using various statistical analysis methods. In order to determine the normality of data, Kolmogorov-Smirnov test and Shapiro-Wilk test were employed, since
(4)
(5)
Also, if the samples did not have a normal distribution, non-parametric tests, Kruskal-Willis and Mann-Whitney U tests, were conducted on the samples in order to identify significant differences between the sample groups. For samples with normal distributions,
(6)
Equations (7) to (12) provide the expression and coefficients of the Mann-Whitney U test. According to Eqs (7) and (8), U values are calculated for each group based on T, the sum of rank, and n, the number of cases. The final U value is smaller than the U value between groups, as shown in Eq. (9). Additionally, Eqs (10) and (11) show the expected U value and standard U error. As a result, Eq. (12) represents the Mann-Whitney U test’s z value.
(7)
(8)
(9)
(10)
(11)
(12)
Equation (13) shows the expressions for independent
(13)
The expressions of One-way ANOVA are shown in Eqs (14) to (16). MST denotes the mean square between groups, while MSE denotes the mean square due to error.
(14)
(15)
(16)
3.Results
Experimental results were compared to observe whether there were significant differences between catheters and flow rates. First, we observed the normality of test results with the Kolmogorov-Smirnov and Shapiro-Wilk methods. The results showed that significant normality was not found in most samples. The results showed that significant normality was not found in most samples. However, samples of only two categories which are the correlation between flow rates and the cycle time of T2.0 catheters, and the activation pressure and the turns of the catheters at flow rate 40 ml/h in the reverse experiment were satisfied with normality. Therefore, those two results analyzed with One-way ANOVA and Independent samples
Table 2
Normality test results from reverse experiments
| Direction | Dependent variable | Catheter | Flowrate | Kolmogorov-Smirnov | Shapiro-Wilk | ||||
|---|---|---|---|---|---|---|---|---|---|
| Statistics | df | Sig. | Statistics | df | Sig. | ||||
| Forward | Period | T1.5 | 20 | 0.240 | 30 | 0.822 | 30 | ||
| 40 | 0.266 | 30 | 0.820 | 30 | |||||
| 60 | 0.154 | 42 | 0.014 | 0.883 | 42 | ||||
| 80 | 0.169 | 37 | 0.009 | 0.833 | 37 | ||||
| 100 | 0.225 | 33 | 0.762 | 33 | |||||
| T2.0 | 20 | 0.153 | 18 | 0.200 | 0.917 | 18 | 0.115 | ||
| 40 | 0.083 | 17 | 0.200 | 0.981 | 17 | 0.969 | |||
| 60 | 0.171 | 25 | 0.056 | 0.935 | 25 | 0.116 | |||
| 80 | 0.211 | 17 | 0.043 | 0.926 | 17 | 0.189 | |||
| 100 | 0.181 | 36 | 0.004 | 0.889 | 36 | 0.002 | |||
| Pressure | T1.5 | 20 | 0.199 | 20 | 0.036 | 0.875 | 20 | 0.014 | |
| 40 | 0.272 | 29 | 0.863 | 29 | 0.001 | ||||
| 60 | 0.223 | 56 | 0.907 | 56 | |||||
| 80 | 0.177 | 49 | 0.911 | 49 | 0.001 | ||||
| 100 | 0.124 | 58 | 0.027 | 0.964 | 58 | 0.079 | |||
| T2.0 | 20 | 0.158 | 20 | 0.200 | 0.925 | 20 | 0.124 | ||
| 40 | 0.170 | 14 | 0.200 | 0.914 | 14 | 0.177 | |||
| 60 | 0.280 | 23 | 0.724 | 23 | |||||
| 80 | 0.279 | 37 | 0.818 | 37 | |||||
| 100 | 0.111 | 40 | 0.200 | 0.947 | 40 | 0.060 | |||
Table 3
Normality test results from reverse experiments
| Direction | Dependent variable | Catheter | Flowrate | Kolmogorov-Smirnov | Shapiro-Wilk | ||||
|---|---|---|---|---|---|---|---|---|---|
| Statistics | df | Sig. | Statistics | df | Sig. | ||||
| Reverse | Period | T1.5 | 20 | 0.318 | 6 | 0.057 | 0.737 | 6 | 0.015 |
| 40 | 0.374 | 9 | 0.676 | 9 | |||||
| 60 | 0.409 | 15 | 0.569 | 15 | |||||
| T2.0 | 20 | 0.351 | 19 | 0.513 | 19 | ||||
| 40 | 0.204 | 12 | 0.182 | 0.933 | 12 | 0.415 | |||
| 60 | 0.298 | 17 | 0.753 | 17 | |||||
| Pressure | T1.5 | 20 | 0.207 | 11 | 0.200 | 0.838 | 11 | 0.029 | |
| 40 | 0.144 | 19 | 0.200 | 0.923 | 19 | 0.131 | |||
| 60 | 0.209 | 22 | 0.014 | 0.845 | 22 | 0.003 | |||
| T2.0 | 20 | 0.105 | 25 | 0.200 | 0.971 | 25 | 0.662 | ||
| 40 | 0.173 | 17 | 0.187 | 0.934 | 17 | 0.254 | |||
| 60 | 0.158 | 24 | 0.123 | 0.944 | 24 | 0.199 | |||
Therefore, those two results analyzed with One-way ANOVA and Independent samples
Secondly, after observing the normality of the data, we checked whether the samples were significantly different or not. Analyzed data showed the distribution of the cycle time from the number of turns across categories of flowrates. Cycle times of T2.0 in forward experiments (
Table 4
Correlation between flow rates, the cycle time and activation pressure throughout turns of catheters
| Dependent variable | Direction | Turns | Null hypothesis | Test | df | N | Sig. | Decision |
|---|---|---|---|---|---|---|---|---|
| Cycle time | Forward | T1.5 | The distribution of cycle time from the catheter is the same across categories of flowrates in forward | Independent-samples Kruskai-Willis | 4 | 172 | 0.353 | Accept |
| T2.0 | experiments | Test | 4 | 113 | Reject | |||
| Reverse | T1.5 | The distribution of cycle time from the catheter is the same across categories of flowrates in reverse | 2 | 3 | 0.029 | Reject | ||
| T2.0 | experiments | 2 | 48 | 0.022 | Reject | |||
| Activation pressure | Forward | T1.5 | The distribution of activation pressure from the catheter is the same across categories of flowrates | 4 | 212 | Reject | ||
| T2.0 | in forward experiments | 4 | 134 | 0.633 | Accept | |||
| Reverse | T1.5 | The distribution of activation pressure from the catheter is the same across categories of flowrates | 2 | 52 | 0.150 | Accept | ||
| T2.0 | in reverse experiments | One-way ANOVA | 2 | 65 | 0.065 | Accept |
Thirdly, both catheters showed that cycle times were mostly the same, except flow rate of 100 ml/hour (
Table 5
Correlation between the number of turns of catheter, the cycle time and activation pressure throughout flow rates
| Dependent variable | Direction | Flowrates | Null hypothesis | Test | N | Sig. | Decision | |
|---|---|---|---|---|---|---|---|---|
| Cycle | Forward | 20 | The distribution of cycle time from | Independent- | 47 | 0.896 | Accept | |
| time | 40 | the flow rate is the same across | Samples | 47 | 0.842 | Accept | ||
| 60 | categories of catheters in forward | Mann-Whitney | 67 | 0.836 | Accept | |||
| 80 | experiments | U test | 54 | 0.222 | Accept | |||
| 100 | 69 |
| 0.001 | Reject | ||||
| Reverse | 20 | The distribution of cycle time from | Independent- | 25 | 0.043 | Reject | ||
| 40 | the flow rate is the same across | Samples | 21 | 0.508 | Accept | |||
| 60 | categories of catheters in forward experiments | Mann-Whitney U test | 32 | 0.008 | Reject | |||
| Activation | Forward | 20 | The distribution of pressure from | Independent- | 47 | 0.046 | Reject | |
| pressure | 40 | flow rates is the same across | Samples | 47 | 0.093 | Accept | ||
| 60 | categories of catheters in forward | Mann-Whitney | 67 |
| 0.001 | Reject | ||
| 80 | experiments | U test | 54 | 0.401 | Accept | |||
| 100 | 69 |
| 0.001 | Reject | ||||
| Reverse | 20 | The distribution of cycle time from | 36 |
| 0.001 | Reject | ||
| 40 | flow rates is the same across categories of catheters in reverse | Independent samples | 36 |
| 0.001 | Reject | ||
| 60 | experiments | Independent-Samples Mann-Whitney U test | 46 |
| 0.001 | Reject | ||
As a result, the T1.5 and T2.0 catheters had cycle times. In the forward experiments, both catheters were activated at every around 3000 seconds regardless of the flow rate. Moreover, the standard deviations of the T1.5 catheter were larger than T2.0, suggesting that the T2.0 catheters had more stable than the T1.5. The average cycle time of T1.5 was 3320 seconds at 20 ml/hour of the flow rate condition. After, the T1.5 catheter’s cycle time trends fluctuated, showing 3864 seconds at 40 ml/hour, 2851 seconds at 60 ml/hour, 2827 seconds at 80 ml/hour, and 2898 seconds at 100 ml/hour. Throughout the flow rates, the average standard deviation of cycle times was 2000 seconds.
On the other hand, the average cycle time of the T2.0 catheter was 2290 seconds. The trend of cycle time was continuously increased throughout the flow rate,the maximum was 3254 seconds at a flow rate of 100 ml/hour. The T1.5 catheter’s pressure trend gradually decreased throughout the flow rates, while the T2.0 catheter’s pressure showed increasing trends.
The average activation pressures of the T1.5 catheter were 2.2 cmH2O at 20 ml/hour, 1.8 cmH2O at 40 ml/hour, 2.2 cmH2O at 60 ml/hour, 2.0 cmH2O at 80 ml/hour, and 1.5 cmH2O at 100 ml/hour. On the other hand, the T2.0 catheter’s average pressure was 2.3 cmH2O at 20 ml/hour, 2.8 cmH2O at 40 ml/hour, 2.8 cmH2O at 60 ml/hour, 2.9 cmH2O at 80 ml/hour, and 3.3 cmH2O at 100 ml/hour. Figure 4 shows plots based on forward experiment results.
Table 6
Experimental results including
| Flow direction | Catheter | Variable | Flow rate (mL/hour) | |||||||||
|---|---|---|---|---|---|---|---|---|---|---|---|---|
| 20 | 40 | 60 | 80 | 100 | ||||||||
| Forward | T1.5 | Cycle time (seconds) | 3320 | 3864 | 2851 | 2827 | 2899 | |||||
| Pressure (cmH2O) | 2.2 | 1.8 | 2.2 | 2.0 | 1.5 | |||||||
| T2.0 | Cycle time (seconds) | 2290 | 2791 | 2608 | 2945 | 3254 | ||||||
| Pressure (cmH2O) | 2.3 | 2.8 | 2.8 | 2.9 | 3.3 | |||||||
| Reverse | T1.5 | Cycle time (seconds) | 6150 | 3605 | 2719 | Not applicable | ||||||
| Pressure (cmH2O) | 0.8 | 1.3 | 1.2 | |||||||||
| T2.0 | Period (seconds) | 1744 | 2331 | 1764 | ||||||||
| Pressure (cmH2O) | 2.5 | 2.2 | 2.5 | |||||||||
Figure 4.
The results of the forward experiments. A: the fluid-releasing cycle time. B: the fluid-releasing activation pressure.
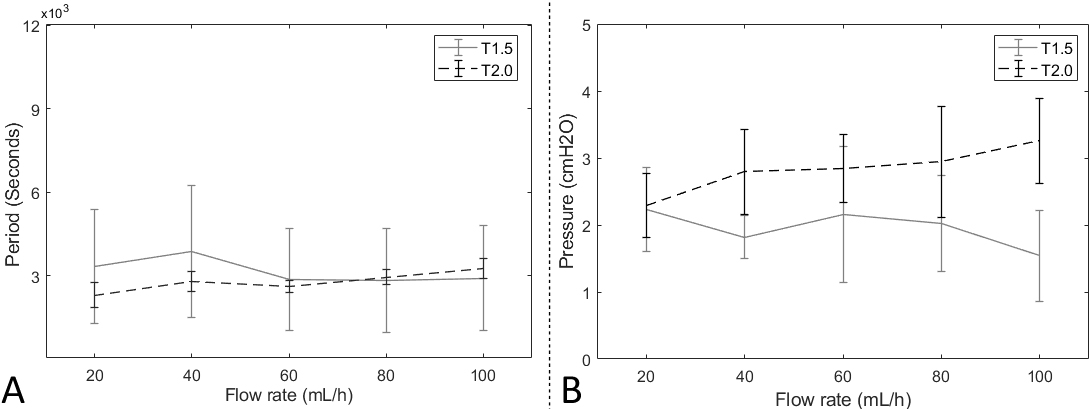
Figure 5.
The results of the reverse experiments. A: the fluid-releasing cycle time. B: the fluid-releasing activation pressure.
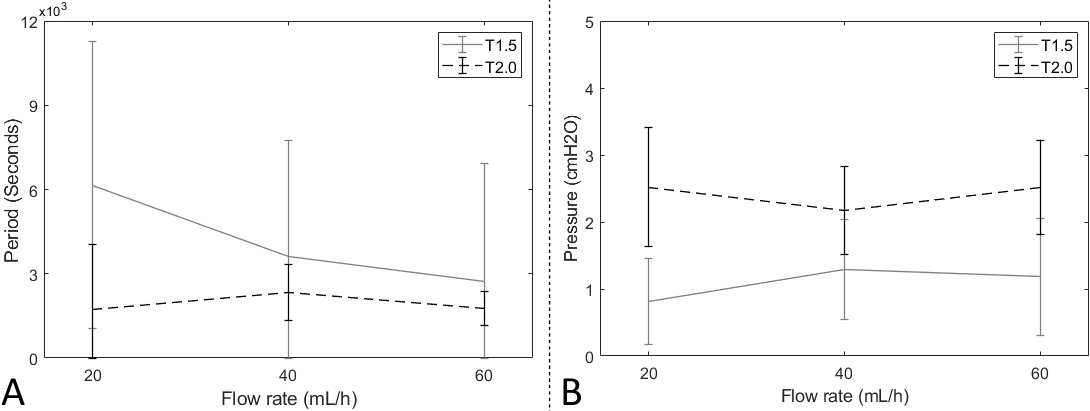
In the reverse experiments, there was significant features on the variation of cycle time according to the flow rate of the T1.5 catheter. On the other hand, the average release cycle time of the T2.0 catheter in the reverse experiments was 1947 seconds throughout all flow rates. The average standard deviation was 1307 seconds.
The activation pressures from the reverse experiments varied according to the number of turns. The average pressure of the T1.5 catheter was 1.1 cmH2O; specifically, it showed a pressure of 0.8 cmH2O at 20 ml/hour, 1.3 cmH2O at 40 ml/hour, and 1.2 cmH2O at 60ml/hour. The pressure of the T2.0 catheter was relatively higher than the T1.5’s, showing 2.5 cmH2O at 20 ml/hour, 2.2 cmH2O at 40 ml/hour, and 2.5 cmH2O at 60 ml/hour. Figure 5 shows result plots based on reverse experiment results. Also, specific experimental data are shown in Table 6.
4.Discussion and conclusion
This study examined novel implantable catheters that can reduce the time taken for hospital visits and paracentesis in terminal cancer patients and improve their quality of life by directly connecting the AC and BC.
The experimental instruments were designed to verify the catheters’ performance, and trends in the flow rate according to pressure differences between the inlet and outlet were evaluated. As a result of the forward experiment, we found that the catheter allowed fluid to flow when the activation pressure was applied at the inlet, and it had a certain cycle times of releasing fluids.
In comparison to the previous study, researchers observed performance of prototype ascites catheters based on relative pressures between the inlet and outlet sides. However, we were not able to determine the exact cycle time of catheter activation and the exact activation pressure based on the previous research. The researchers were only able to uncover the possibility of an ascites catheter concept. This research, however, was able to determine the exact cycle time and activation pressure of newly designed catheters using various statistical analysis methods.In the reverse experiment, the newly-designed catheters allowed fluid when they got a more pressure than over activation pressures, nontheless, they did not show a cycle time of releasing fluid. In the reverse experiment, the average activation pressure of the T2.0 catheter was about two times higher than that of the T1.5 catheter under 2.4 and 1.1 cmH2O of pressure, respectively.
According to the overall trends, the T2.0 catheter was expected to be more effective since it had a more stable flow cycle time and higher activation pressure than the T1.5. Also, T2.0 catheters are expected to better prevent backflow since the activation pressure in reverse experiments was twice as high as that of the T1.5. However, these catheters require further improvement because both the T1.5 and T2.0 catheters allowed backflow, which may cause serious infection problems if implanted in the human body. The reason for this backflow may be due to the irregular aperture positions on the silicone membrane.
The apertures should be precisely placed over the catheter’s outlet hole and have appropriate tension to increase activation pressure. However, it could not block holes appropriately. Moreover, the tension of the silicone was relatively high; thus, pressure from fluid could not make the silicone membrane to block holes. These major improvement points should be considered when researchers design improved versions of these catheters in the future.
However, we found the possibility of optmization. According to results of a trend of experiments, T2.0’s results showed an upward trend and T1.5’s results displayed decreased trend on activation pressure. In addition, at 20 (
Based on the difference of both catheters, they can be used to different patients. For example, if patients who do not excrete ascites much and urinate frequently, they can use the T1.5 catheter since it has a lower activation pressure at 20 and 60 ml/hour of flow rates. On the other hand, if another patient excrete much of ascites and do not urinate frequently, T2.0 catheter can be a good option to them because it has a higher activation pressure than T1.5 at 20 and 60 ml/hour of flow rates. Like this, the newly developed catheters can be adopted to various terminal cancer patients who have different ascites excrete and urinate speeds.
Although problems and limitations were found in this research, connecting BC and AC to reduce and reduce paracentesis procedure time is still effective. To achieve this goal, we must improve and fabricate advanced versions of these catheters in the future.
Acknowledgments
This work was supported by the Commercializations Promotion Agency for R&D Outcomes (COMPA) grant funded by the Korean Government (Ministry of Science and ICT) (R&D project no.1711173698) supported by the National Research Foundation of Korea (NRF) grant funded by the Korean government (MSIT) (No.2017R1C1B5076247), and supported by the Unmanned Vehicles Core Technology Research and Development Program through the National Research Foundation of Korea (NRF) and Unmanned Vehicle Advanced Research Center (UVARC), funded by the Ministry of Science and ICT, the Republic of Korea (NRF-2020M3C1C1A02086321).
Conflict of interest
None to report.
Author contributions
Conceptualization, H. Kim, I. Kim, J. Ko; Methodology, H. Kim, I. Kim, J. Ko; Software: H. Kim, Validation, H. Kim, S. Bae, Y. Kim, S. Jung, J. Park, S. Park, I. Kim, J. Ko; Formal analysis, H. Kim, S. Bae; Investigation, H. Kim, S. Bae; Resources, S. Jung, J. Park, S. Park, I. Kim, J. Ko; Methodology, H. Kim, I. Kim, J. Ko; Writing-original, H. Kim, S. Bae; Draft Preparation, H. Kim, S. Bae; Writing-Review & Editing, Y. Kim, S. Jung, J. Park, S. Park, I. Kim, J. Ko; Visualization, H. Kim, S. Bae; Project Administration, I. Kim, J. Ko; Funding Acquisition, I. Kim.
References
[1] | Hashim D, Boffetta P, La Vecchia C, Rota M, Bertuccio P, Malvezzi M, et al. The global decrease in cancer mortality: Trends and disparities. Annals of Oncology. (2016) May 1; 27: (5): 926-33. |
[2] | Siegel RL, Miller KD, Goding Sauer A, Fedewa SA, Butterly LF, Anderson JC, et al. Colorectal cancer statistics, 2020. CA: A Cancer Journal for Clinicians. (2020) ; 70: (3): 145-64. |
[3] | Moser RP, Arndt J, Jimenez T, Liu B, Hesse BW. Perceptions of cancer as a death sentence: Tracking trends in public perceptions from 2008 to 2017. Psycho-Oncology. (2021) ; 30: (4): 511-9. |
[4] | Robinson F, Cupples M, Corrigan M. Implementing a resuscitation policy for patients at the end of life in an acute hospital setting: Qualitative study. Palliat Med. (2007) Jun 1; 21: (4): 305-12. |
[5] | Follwell M, Burman D, Le LW, Wakimoto K, Seccareccia D, Bryson J, et al. Phase II study of an outpatient palliative care intervention in patients with metastatic cancer. J Clin Oncol. (2009) Jan 10; 27: (2): 206-13. |
[6] | Setoguchi S, Glynn RJ, Stedman M, Flavell CM, Levin R, Stevenson LW. Hospice, opiates, and acute care service use among the elderly before death from heart failure or cancer. American Heart Journal. (2010) Jul 1; 160: (1): 139-44. |
[7] | Parsons SL, Watson SA, Steele RJC. Malignant ascites. British Journal of Surgery. (1996) Jan 1; 83: (1): 6-14. |
[8] | Kipps E, Tan DSP, Kaye SB. Meeting the challenge of ascites in ovarian cancer: New avenues for therapy and research. Nat Rev Cancer. (2013) Apr; 13: (4): 273-82. |
[9] | Kietpeerakool C, Rattanakanokchai S, Jampathong N, Srisomboon J, Lumbiganon P. Management of drainage for malignant ascites in gynaecological cancer. Cochrane Database of Systematic Reviews [Internet]. (2019) [cited 2022 Jun 2]; (12). |
[10] | Garrison RN, Kaelin LD, Galloway RH, Heuser LS. Malignant ascites. Clinical and experimental observations. Ann Surg. (1986) Jun; 203: (6): 644-51. |
[11] | Jackson GL, Blosser NM. Intracavitary chromic phosphate (32p) colloidal suspension therapy. Cancer. (1981) ; 48: (12): 2596-8. |
[12] | Gotlieb WH, Feldman B, Feldman-Moran O, Zmira N, Kreizer D, Segal Y, et al. Intraperitoneal pressures and clinical parameters of total paracentesis for palliation of symptomatic ascites in ovarian cancer. Gynecologic Oncology. (1998) Dec 1; 71: (3): 381-5. |
[13] | Appelqvist P, Silvo J, Salmela L, Kostiainen S. On the treatment and prognosis of malignant ascites: Is the survival time determined when the abdominal paracentesis is needed? Journal of Surgical Oncology. (1982) ; 20: (4): 238-42. |
[14] | Solbach P, Höner zu Siederdissen C, Taubert R, Ziegert S, Port K, Schneider A, et al. Home-based drainage of refractory ascites by a permanent-tunneled peritoneal catheter can safely replace large-volume paracentesis. European Journal of Gastroenterology & Hepatology. (2017) May 1; 29: (5): 539-46. |
[15] | Stirnimann G, Berg T, Spahr L, Zeuzem S, McPherson S, Lammert F, et al. Treatment of refractory ascites with an automated low-flow ascites pump in patients with cirrhosis. Alimentary Pharmacology & Therapeutics. (2017) ; 46: (10): 981-91. |
[16] | Fotopoulou C, Berg T, Hausen A, Hennig R, Jalan R, Malagó M, et al. Continuous low flow ascites drainage through the urinary bladder via the Alfapump system in palliative patients with malignant ascites. BMC Palliative Care. (2019) Dec 5; 18: (1): 109. |
[17] | Kim H, Kwon H, Park BS, Park SH, Park JH, Oh CK, et al. Implantable ascites drainage stent designs and experiments to improve the quality of life in terminal cancer patients. jamet. (2021) Oct 31; 45: (5): 269-74. |
[18] | Boron WF, Boulpaep EL. Medical Physiology E-Book. Elsevier Health Sciences; (2016) . 1907 p. |
[19] | Navarro-Rodriguez T, Hashimoto CL, Carrilho FJ, Strauss E, Laudanna AA, Moraes-Filho JPP. Reduction of abdominal pressure in patients with ascites reduces gastroesophageal reflux. Diseases of the Esophagus. (2003) Jun 1; 16: (2): 77-82. |


