
Variations in protein expression associated with oral cancer
Abstract
BACKGROUND:
Differential protein expression of the oral microbiome is related to human diseases, including cancer.
OBJECTIVE:
In order to reveal the potential relationship between oral bacterial protein expression in oral squamous cell carcinoma (OSCC), we designed this study.
METHODS:
We obtained samples of the same patient from cancer lesion and anatomically matched normal site. Then, we used the label free quantitative technique based on liquid chromatography tandem mass spectrometry (LC-MS/MS) to analyze the bacteria in the samples of oral squamous cell carcinoma at the protein level, so as to detect the functional proteins.
RESULTS:
Protein diversity in the cancer samples was significantly greater than in the normal samples. We identified a substantially higher number of the taxa than those detected in previous studies, demonstrating the presence of a remarkable number of proteins in the groups. In particular, proteins involved in energy production and conversion, proton transport, hydrogen transport and hydrogen ion transmembrane transport, ATP-binding cassette (ABC) transporter, PTS system, and L-serine dehydratase were enriched significantly in the experimental group. Moreover, some proteins associated with Actinomyces and Fusobacterium were highly associated with OSCC and provided a good diagnostic outcome.
CONCLUSION:
The present study revealed considerable changes in the expression of bacterial proteins in OSCC and enrich our understanding in this point.
1.Introduction
Oral cancer is the sixth most common malignant tumor in the world. Oral squamous cell carcinoma (OSCC) accounts for more than 90% of oral cancer cases. OSCC originates from oral mucosal epithelium and is the most common malignant tumor of the head and neck. Approximately 300,000 new cases of OSCC are diagnosed every year [1]. Patients with early- and middle-stage oral squamous cell carcinoma are usually treated surgically. For patients with multiple positive lymph nodes or metastasis, this treatment is usually supplemented with postoperative radiotherapy and chemotherapy. The 5-year survival rate of patients with OSCC is less than 60% [2]. Generally, smoking and alcoholism are considered the main risk factors for OSCC. HPV infection, poor oral hygiene, long-term chronic stimulation and other factors are also related to the occurrence and development [3]. Candida infection is also considered a predisposing factor of OSCC. However, whether other bacteria and microorganisms and proteins they secrete are involved in the occurrence, development, and prognostic assessment of OSCC is not been fully studied. Recent relevant studies have shown that bacteria or microorganisms may be involved in the occurrence of cancer [4].
Most of the cellular activities occur at the protein level, and small changes in protein expression have a great impact on vital activities and operation of the organisms. Surface proteins are important proteins, which contact with external environment directly. These proteins are closely related to environmental adaptability, pathogenicity, and drug resistance of bacteria. Secretory proteins are released by the cells to mediate interactions between a pathogen and the host.
So far, some changes in protein variation have been related to several types of cancer [5]. Some early studies using molecular techniques evaluated changes in cancer-related protein expression [6, 7, 8, 9, 10, 11]; However, due to the limited number of strains/clones that can be tested, no consensus has been reached.
In the postgenomic era, the emergence of label-free quantitative technology based on liquid chromatography-tandem mass spectrometry (label-free LC-MS/MS) enables accurate comparative analysis of all proteins expressed by the cells under various physiological and pathological conditions. Quantification and identification of these proteins will help us to find biomolecules directly related to specific physiological or pathological states. The emergence of LS/MS enables profiling of microbial communities at an unprecedented depth and coverage. This technology can be used to determine what changes in the surface and secretory proteins are present in OSCC versus normal mucosa.
Some studies have employed LS/MS to assess protein expression in OSCC. Pushalkar et al. [12] studied relative abundance and the diversity of proteins in the saliva of subjects with OSCC; however, only three OSCC cases and two healthy controls were included. Another paper evaluated salivary bacterial communities in six OSCC patients by pyrosequencing, and paired taxa within the Enterobacteriaceae family together with the Oribacterium genus, which were suggested to distinguish OSCC samples from the subjects with oropharyngeal squamous cell carcinoma (OPSCC) and normal ones [13]. These studies failed to analyze all the differences in the protein composition in healthy versus diseased mucosa, even though specific proteins are sometimes involved in a disease.Al-hebshi successfully profiled bacterial communities in 23 OSCC tissue samples from Yemeni patients at the species level, this is the first epidemiological evidence for associations of Fusobacterium nucleatum and Pseudomonas aeruginosa with OSCC [14, 15]. But because the number of OSCC patients included is too limited, it is hard to make sure the significance of the findings. Additional studies to validate these results are needed. In the present study, the samples of cancer lesions and matched controls were acquired from 30 Chinese subjects with OSCC. Protein profiles of the samples were characterized. We analyzed the changes in protein composition and functions associated with OSCC. Moreover, a group of periodontitis-related bacteria that was significantly enriched in OSCC samples were found in our study. Our findings may contribute to further clarification of a connection between OSCC and protein expression.
We hypothesized that the changes in oral bacterial protein expression were correlated with the occurrence, development, and prognosis of oral squamous cell carcinoma; oral bacterial infection may directly or indirectly cause epigenetic variations in the genes of regional epithelial cells through chronic inflammation or along with other stimulating factors (smoking, alcoholism, chronic stimulation, etc.) thus participating in the reconstruction of the tumor microenvironment.
2.Materials and methods
2.1Subject recruitment and sample collection
Thirty OSCC patients (15 males and 15 females) in the early stage with a mean age of 55 were recruited from the Department of Oral and Maxillofacial-Head and Neck Oncology of the Ninth People’s Hospital (Shanghai, China). The patients did not have detectable periodontal inflammation, oral mucosal diseases, visible carious lesions, or any severe systemic disorders (such as immune compromise, diabetes, or genetic diseases). Furthermore, the patients had not taken antibiotics or received treatment for OSCC at least two weeks prior to the sampling and consented to clinical examination and sampling. The present study was approved by the Ethics Committee of Shanghai Ninth People’s Hospital affiliated with the Shanghai Jiao Tong University School of Medicine. Written informed consent was obtained from all subjects. All experiments were performed according to approved guidelines.
The swabs of oral lesions and anatomically matched normal sites were collected according to a well-defined clinical protocol [13]. Subjects were prevented from drinking and eating for at least 2 h before the sampling. All samples were transported to the laboratory on ice within 2 h of collection and were stored at
2.2Sample preparation
Use liquid nitrogen to grind the sample into powder in mortar. Quickly transfer all powder samples to 1.5 ml centrifuge tubes precooled in liquid nitrogen, and add 200 to each tube
After thawing the samples at 4
2.3Protein extraction and peptide sample preparation for mass spectrometry
100 per sample in total
2.4Liquid chromatography-tandem mass spectrometry analysis
Solvent A is an aqueous solution of 0.1% formic acid, and solvent B is a solution of 0.1% formic acid in 100% acetonitrile. Use 95% solvent A to balance the thermal scientific analysis column (75
2.5Database creation and searching for identification and quantification of the peptides and proteins
To increase the sensitivity of a large data search, the MetaPro-IQ approach was used to identify and quantify the peptides and proteins using the raw data of mass spectrometry. Briefly, the whole oral microbiome gene catalog database was initially downloaded from the Human Oral Microbiome Database (HOME, version: 9.0, http://www.homd.org). Then, Proteome Discoverer (version 2.1) was used to search against this database to generate a “pseudometaproteome” database for each sample. A reduced database containing all possible proteins derived from the peptide spectrum matches was generated and hyphenated using reversed sequences for each sample for a typical target-decoy database search. FDR
2.6Microbial taxonomic analysis
All peptide sequences identified by MaxQuant were submitted to the ‘Metaproteome analysis’ module of the UniPept web application (version: 4.2) for microbial taxonomic analysis with the “Equate I and L” and “Advanced missing cleavage handling” options. Moreover, all identified top rank proteins were assigned to the corresponding taxa by an in-house Perl script based on the taxonomic level file obtained from the HOMD. Unmatched top proteins were manually searched using the Taxonomy database of the NCBI by keywords (genus name) in protein description. Statistics and plots of taxonomic analysis were assessed by R (version: 3.5.1, https://www.r-project.org/). The Krona charts of identified bacteria were created by the Krona Excel template based on protein counts and LFQ intensity accumulation (Krona Excel template: https://github.com/marbl/Krona/wiki/ExcelTemplate).
At all taxa levels, the Mann-Whitney U test and paired sample t test were used to identify differentially abundant taxa in the two groups based on log10-transformed cumulative LFQ intensity calculated using R.
2.7Microbial function and pathway analysis
A standalone BLASTP(version:2.2.31+) was used to match all identified microbial proteins to the UniProtKB/Swiss-Prot database, which included 560,118 sequences, and the COG database (version: 2014), which included 1,781,653 sequences for obtaining function annotations. Furthermore, gene ontology (GO) functional annotations were predicted by InterProScan (version: 5.35–74.0) with default parameters. Moreover, KEGG Orthology Based Annotation System (KOBAS version:3.0), parameters: E-value<=1e-05, rank<=5) was performed for the KEGG Orthology (KO) annotation prediction and binomial tests were performed between the B and Z groups at the KEGG pathway level. Then, the KronaTools was used to plot the Krona chart for visualizing assignment of the proteins at the KEGG pathway level. Besides, statistical analysis and graphics drawing were completed with R (version:3.6.3) .
2.8Statistical and multivariate data analysis
We used the equation log10(LFQ intensity
2.9Verification with parallel reaction monitoring technology
The appropriated target peptides were selected by analyzing the results of the original label-free-based quantitative. Then, these peptides were performed targeted shotgun MS to select peptides for PRM quantification analysis. Finally, the Xcalibur software was used to implement Parallel Reaction Monitoring (PRM) analysis of target peptides.
Statistical analysis was performed by R and the ‘MetaboAnalystR’ package.
2.10Data availability
All MS raw files were submitted to the ProteomeXchange Consortium (http://www.proteomexchange. com) via the PRIDE partner repository with the dataset identifier.
3.Results
3.1Statistics of the number of identified peptide sequences and protein groups
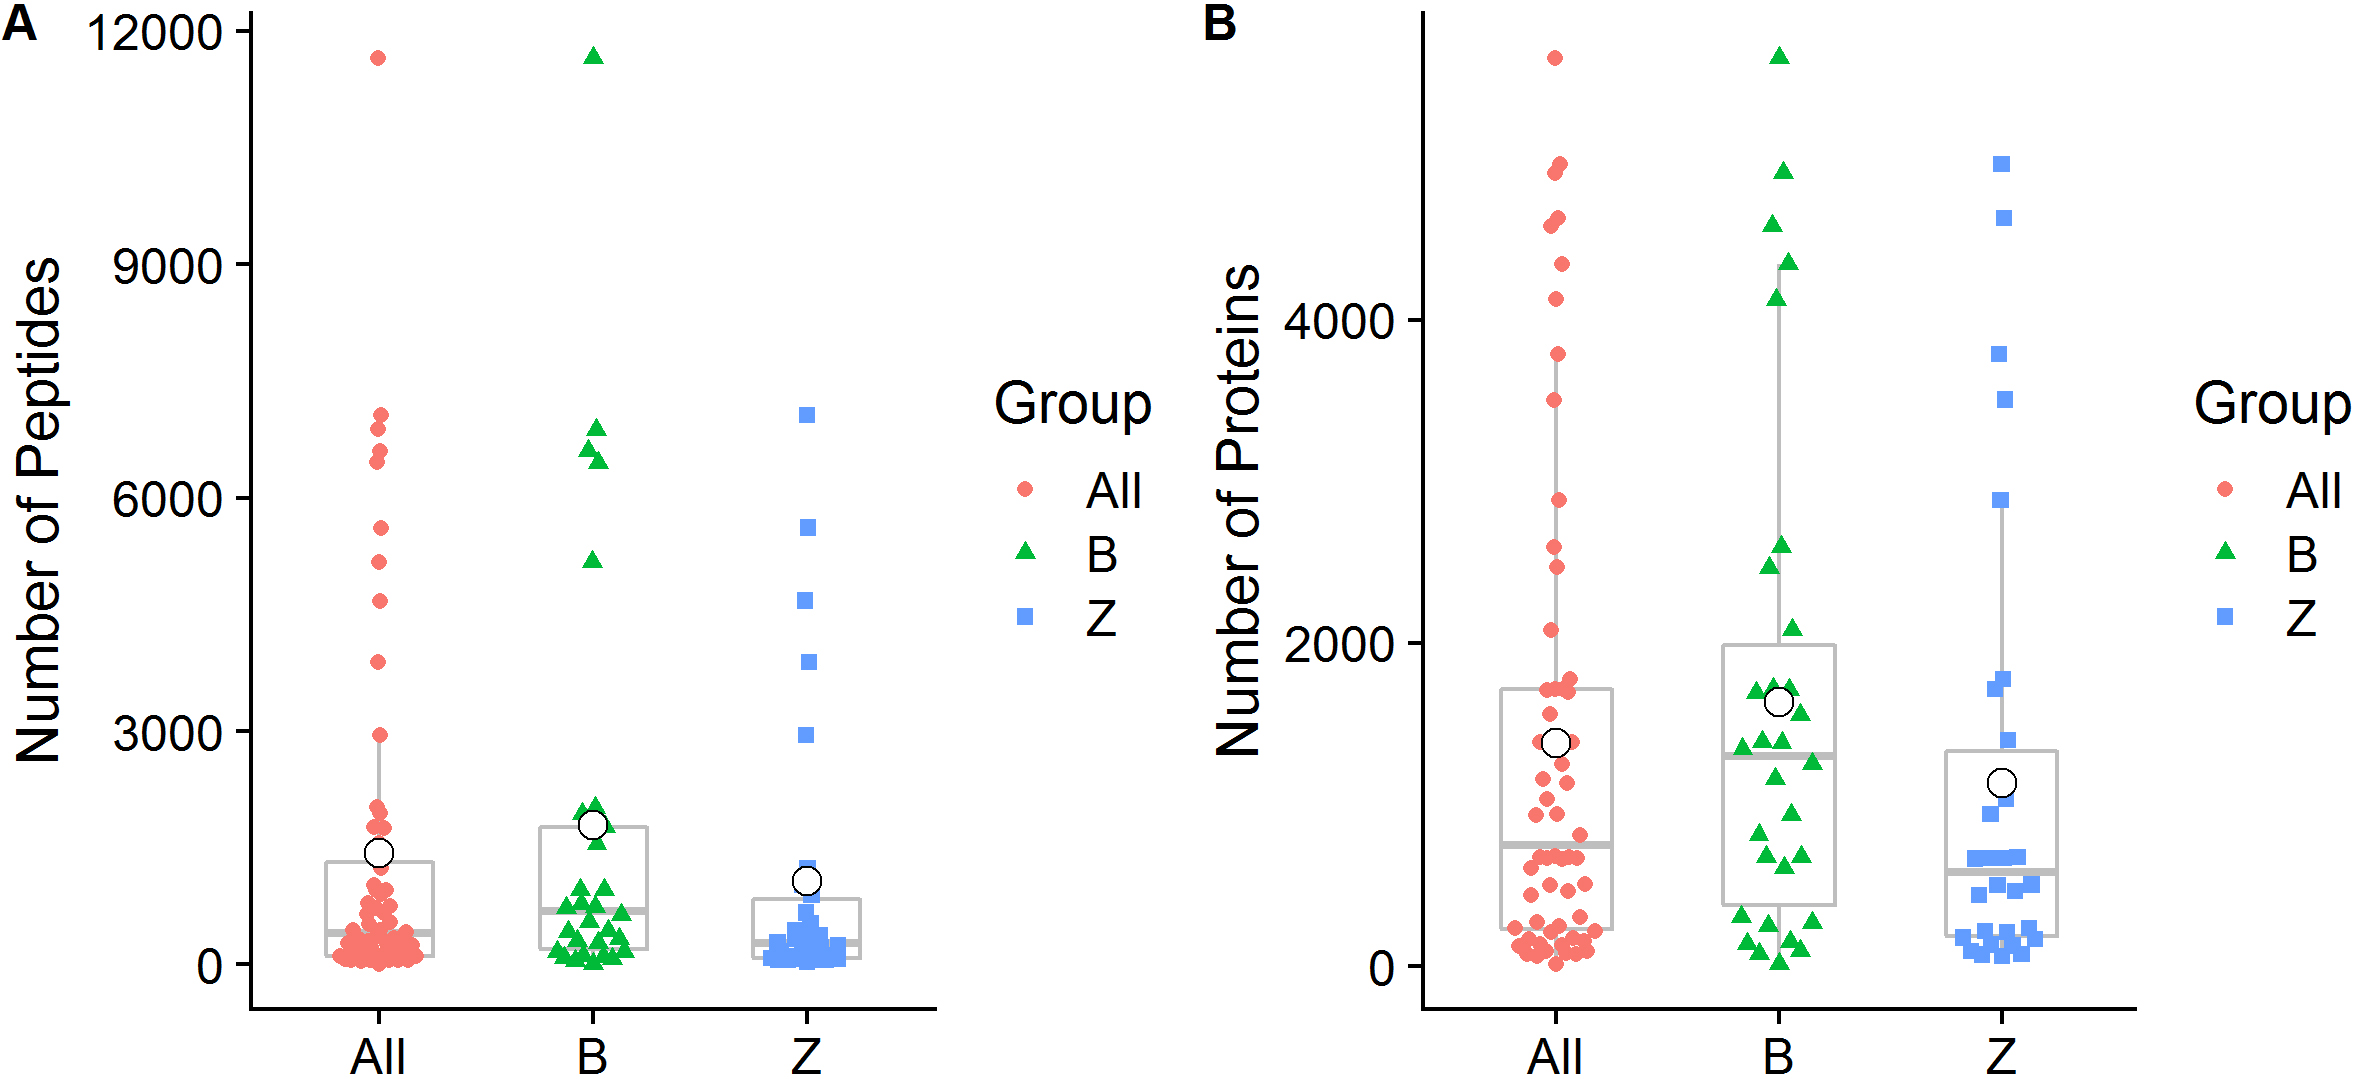
We quantified a total of 38,536 peptide sequences and 11,469 protein groups that covered at least one peptide in 60 samples of 30 OSCC patients. A total of 26,389 (68.48%) of these peptide sequences were confirmed as unique peptides. On average, 1,428
Figure 1.
Peptide and protein group identification by oral metaproteomics. (A) Box plot representations of the number of peptides identified in the present study. (B) Box plot representations of the number of identified proteins. Different colors of the symbols are used to represent individual samples, and the median (central lines), mean (white small dot), 25% and 75% quartile ranges (box width), and upper and lower limits (asterisk) are shown. All: All samples from 30 OSCC patients; B: Swabs of lesion surfaces; Z: Contralateral normal mucosa.
3.2Taxonomic analysis of the microbiome by metaproteomics
Taxonomic characterization is important in microbiome studies. In the present study, we attempted to use two strategies to explore the taxonomic composition of the microbiome. According to the first strategy, all 38,536 identified peptide sequences were submitted to UniPept (version: 4.2) to perform the lowest common ancestor (LCA) analysis. A total of 37,475 (98.79%) peptides were matched by the UniPept. A sunburst diagram was generated to provide a comprehensive view of the four taxonomic levels (Fig. 2).
Figure 2.
Sunburst diagram for bacteria taxonomic composition.
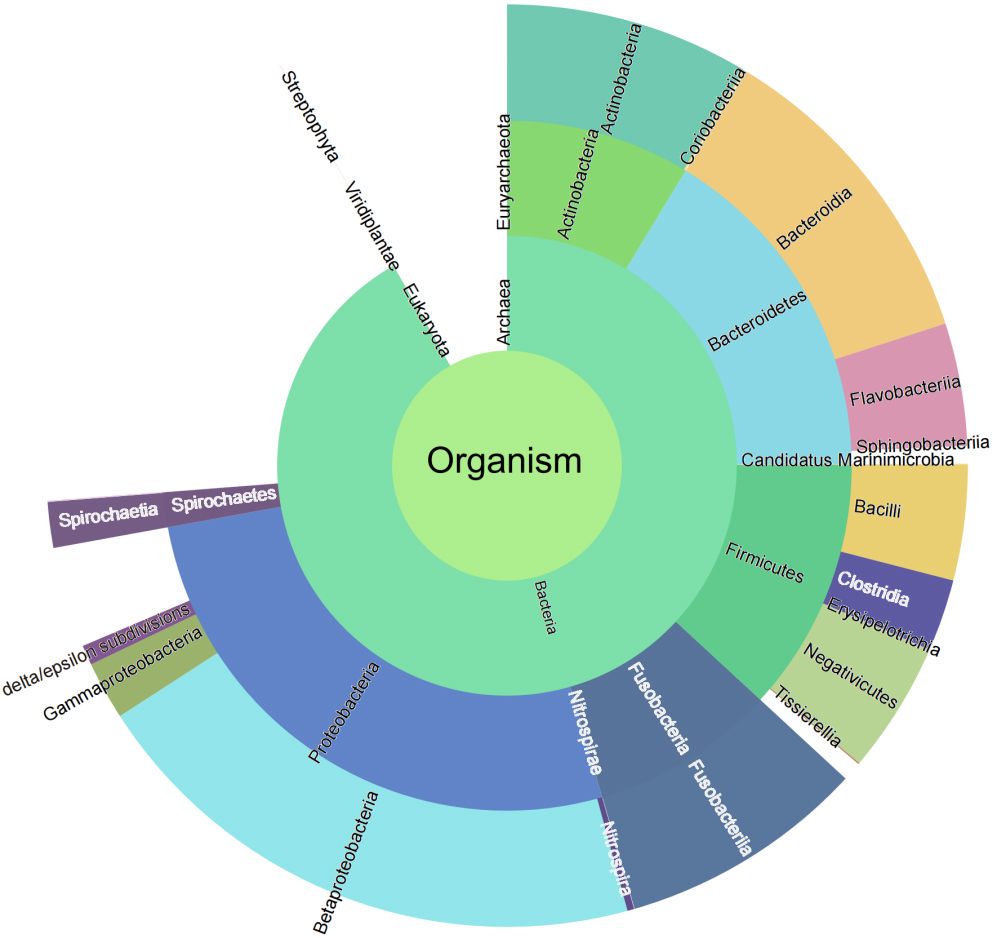
Table 1
Significantly different taxa
| Level | Taxa | |
|---|---|---|
| Phylum | Synergistetes | 0.0128 |
| Phylum | Spirochaetes | 0.0353 |
| Class | Flavobacteriia | 0.0039 |
| Class | Epsilonproteobacteria | 0.0082 |
| Class | Spirochaetia | 0.0353 |
| Order | Flavobacteriales | 0.0039 |
| Order | Pasteurellales | 0.0048 |
| Order | Campylobacterales | 0.0082 |
| Order | Spirochaetales | 0.0353 |
| Order | Xanthomonadales | 0.0438 |
| Order | Coriobacteriales | 0.0450 |
| Family | Flavobacteriaceae | 0.0039 |
| Family | Pasteurellaceae | 0.0048 |
| Family | Lactobacillaceae | 0.0246 |
| Family | Brucellaceae | 0.0257 |
| Family | Campylobacteraceae | 0.0289 |
| Family | Coriobacteriaceae | 0.0328 |
| Family | Spirochaetaceae | 0.0353 |
| Family | Xanthomonadaceae | 0.0438 |
| Family | Enterococcaceae | 0.0469 |
| Family | Bradyrhizobiaceae | 0.0498 |
| Family | Eubacteriaceae [XV] | 0.0681 |
| Genus | Capnocytophaga | 0.0039 |
| Genus | Haemophilus | 0.0119 |
| Genus | Candidate | 0.0164 |
| Genus | Lactobacillus | 0.0246 |
| Genus | Corynebacterium | 0.0256 |
| Genus | Ochrobactrum | 0.0257 |
| Genus | Campylobacter | 0.0289 |
| Genus | Treponema | 0.0353 |
| Genus | Eikenella | 0.0407 |
| Genus | Stenotrophomonas | 0.0438 |
| Genus | Peptostreptococcacea [13][G-1] | 0.0438 |
| Genus | Enterococcus | 0.0469 |
| Species | Haemophilus parainfluenzae | 0.0011 |
| Species | Capnocytophaga sputigena | 0.0054 |
| Species | Fusobacterium sp. | 0.0065 |
| Species | Neisseria subflava | 0.0140 |
| Species | Haemophilus sp. | 0.0141 |
| Species | Prevotella intermedia | 0.0149 |
| Species | Prevotella sp. | 0.0151 |
| Species | Aggregatibacter actinomycetemcomitans | 0.0151 |
| Species | Neisseria mucosa | 0.0152 |
| Species | Candidate division | 0.0164 |
| Species | Capnocytophaga sp. | 0.0188 |
| Species | Aggregatibacter sp. | 0.0189 |
| Species | Treponema medium | 0.0197 |
| Species | Streptococcus anginosus | 0.0209 |
| Species | Capnocytophaga gingivalis | 0.0210 |
| Species | Haemophilus influenzae | 0.0212 |
| Species | Propionibacterium sp. | 0.0212 |
| Species | Selenomonas noxia | 0.0215 |
| Species | Neisseria flavescens | 0.0223 |
|
Table 1, continued | ||
|---|---|---|
| Level | Taxa | |
| Species | Tannerella forsythia | 0.0232 |
| Species | Ochrobactrum anthropi | 0.0257 |
| Species | Cardiobacterium valvarum | 0.0264 |
| Species | Leptotrichia shahii | 0.0264 |
| Species | Kingella denitrificans | 0.0306 |
| Species | Campylobacter concisus | 0.0326 |
| Species | Eikenella corrodens | 0.0407 |
| Species | Prevotella salivae | 0.0412 |
| Species | Selenomonas artemidis | 0.0437 |
| Species | Stenotrophomonas maltophilia | 0.0438 |
| Species | Peptostreptococcacea (13)[G-1] sp. | 0.0438 |
| Species | Neisseria bacilliformis | 0.0450 |
| Species | Prevotella marshii | 0.0466 |
| Species | Fusobacterium periodonticum | 0.0479 |
| Species | Selenomonas flueggei | 0.0549 |
T: paired sample T test.
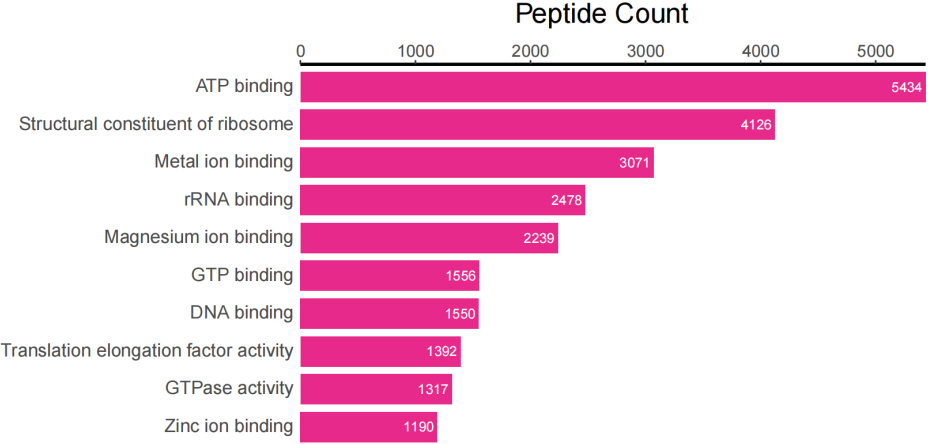
In addition to taxonomic analysis, matched peptides were related to enzymes, and gene ontology (GO) functional categories included GO biological processes (GOBP), GO cellular components (GOCC), and GO molecular functions (GOMF) in UniPept. A total of 1,326 enzymes, 966 GOBP terms, 255 GOCC terms, and 1,288 GOMF terms were matched. The top 20 and top 10 peptide count-related enzymes and GO categories are shown as bar charts (Fig. 3).
Figure 3A.
Top 20 of peptide counts related to enzymes.
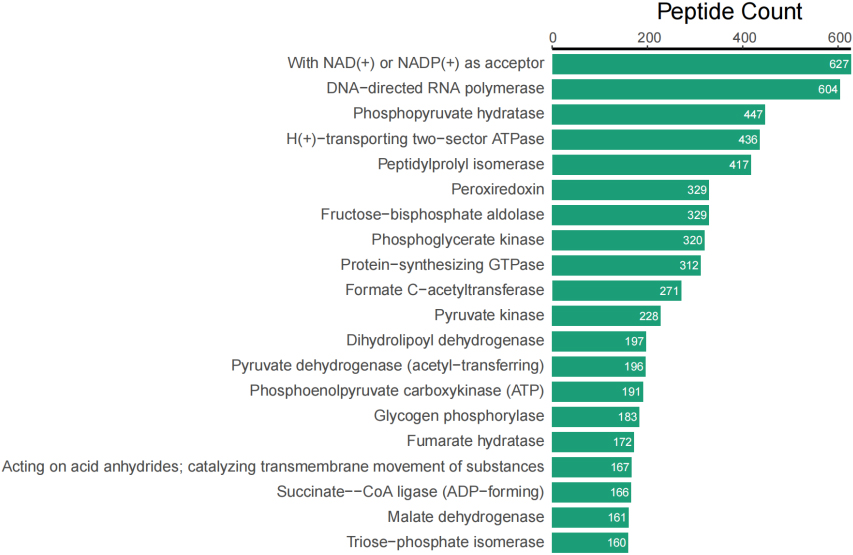
Figure 3B.
Top 10 peptide counts related to GOBP terms.
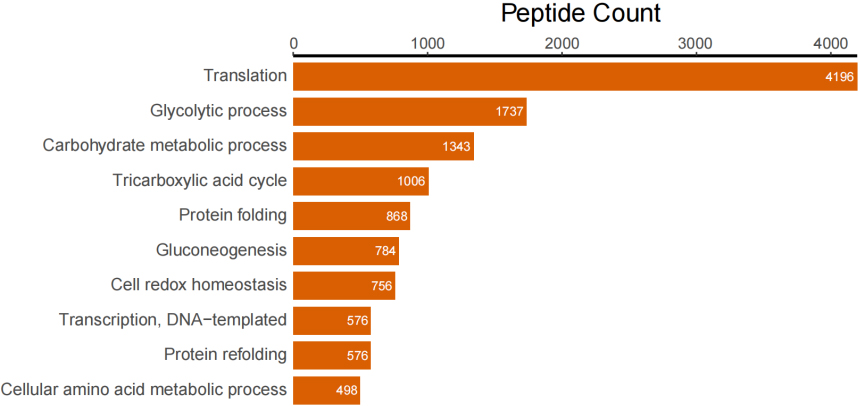
Figure 3C.
Top 10 peptide counts related to GOCC terms.
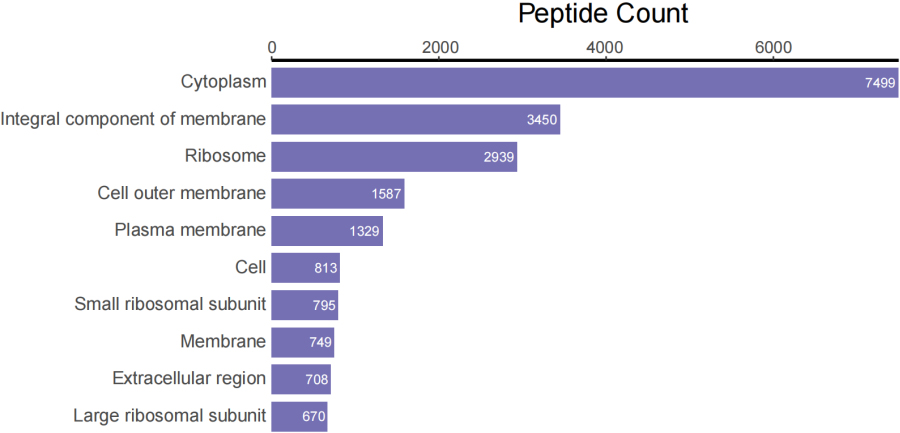
Figure 3D.
Top 10 peptide counts related to GOMF terms.
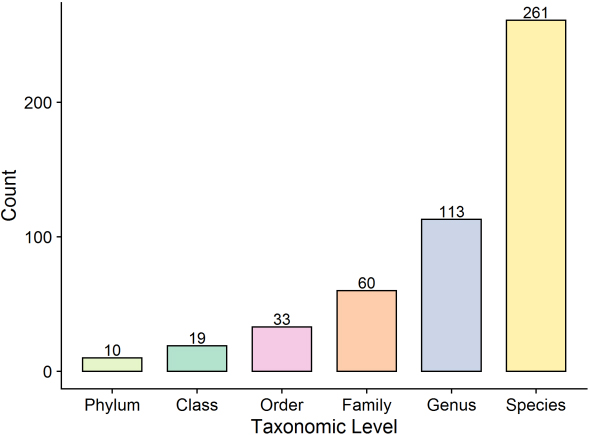
The second strategy involved assignment of all identified top proteins assigned to the taxa using an in-house Perl script to search for top protein descriptions using the taxonomic level file downloaded from the HOMD. A total of 10 phyla, 19 classes, 33 orders, 60 families, 113 genera, and 261 species were identified in the present study based on at least one top protein (Fig. 4).
Figure 4.
Protein count of taxonomic levels.
Using cumulative LFQ intensity transformed by log10, the Mann-Whitney U test and paired sample T test were performed at the phylum, class, order, family, genus, and species levels. Based on the values of the Mann-Whitney U test of
3.3COG functional analysis of identified microbial proteins
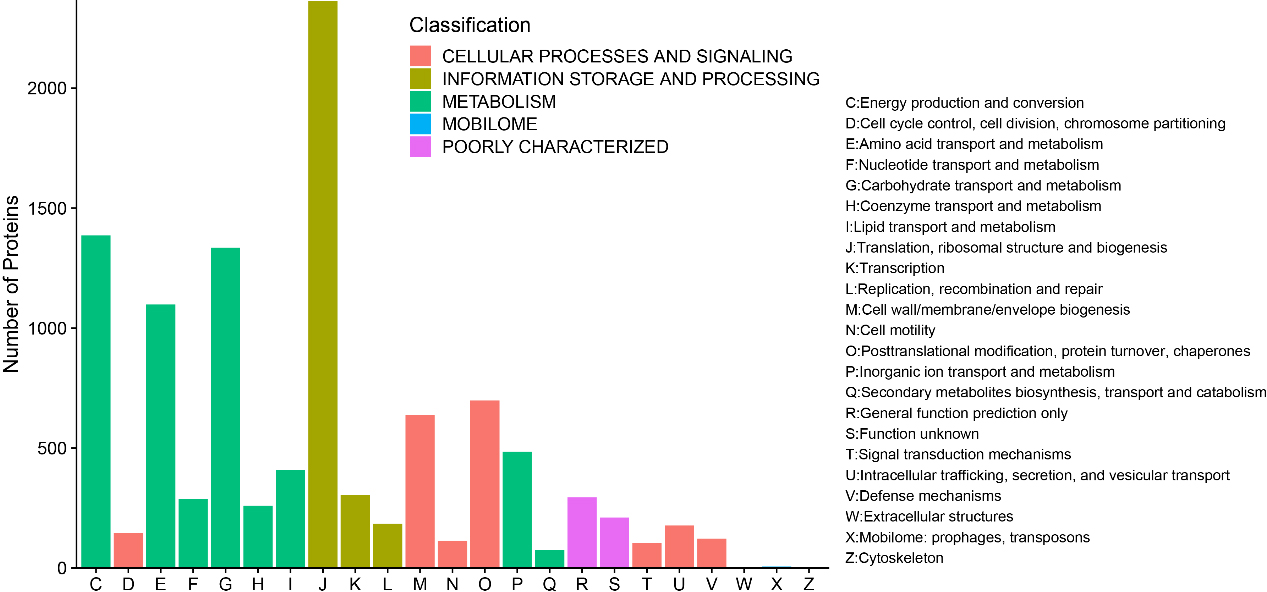
A total of 10,696 (93.26%) identified microbial proteins were annotated by using BLASTP to search against the COG database, and 1,388 COGs were obtained based on only the best hit for each protein. These proteins were assigned to 23 COG categories in five top level classifications, including 1,386 proteins in “Energy production and conversion”, 146 proteins in “Cell cycle control, cell division, chromosome partitioning”, 1,098 proteins in “Amino acid transport and metabolism”, 287 proteins in “Nucleotide transport and metabolism”, 1,335 proteins in “Carbohydrate transport and metabolism”, 259 proteins in “Coenzyme transport and metabolism”, 408 proteins in “Lipid transport and metabolism”, 2,364 proteins in “Translation, ribosomal structure and biogenesis”, 303 proteins in “Transcription”, 184 proteins in “Replication, recombination and repair”, 637 proteins in “Posttranslational modification, protein turnover, chaperones”, 113 proteins in “Cell motility”, 698 proteins in “Posttranslational modification, protein turnover, chaperones”, 484 proteins in “Inorganic ion transport and metabolism”, 74 proteins in “Secondary metabolites biosynthesis, transport and catabolism”, 294 proteins in “General function prediction only”, 210 proteins in “Function unknown”, 105 proteins in “Signal transduction mechanisms”, 177 proteins in “Intracellular trafficking, secretion, and vesicular transport”, 122 proteins in “Defense mechanisms”, 2 proteins in “Extracellular structures”, 6 proteins in “Mobilome: prophages, transposons”, and 4 proteins in “Cytoskeleton” (Fig. 5).
Figure 5.
Bar chart for COG functional classification.
At the COG category level, we used the same methods to identify significant differentially abundant categories. Unexpectedly, no significant differentially abundant categories were detected. All p values of the Mann-Whitney U test were greater than 0.05, and the maximum VIP value was less than 2 (R: general function prediction only; VIP
Figure 6.
Pie charts of protein count at the GO level 2 of biological process, cellular component, and molecular function ontology.
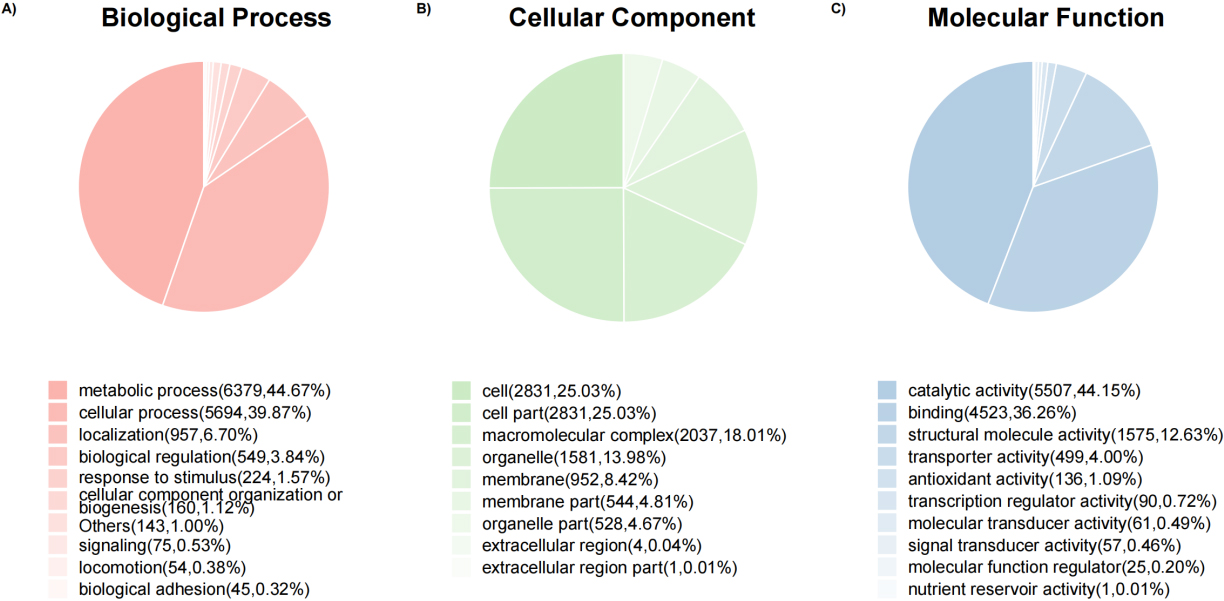
3.4Gene ontology functional analysis
Overall, 9194 (80.16%) top identified microbial proteins in general, according to interproscan and internal Perl scripts, these top identified microbial proteins correspond to at least one go term. The number of proteins is counted at the GO level 2 of biological processes, cellular components and molecular functional Ontology
(Fig. 6). Then, Fisher’s exact test was performed to compare the difference in the number of proteomes between group B and group Z. Based on
Figure 7.
Bubble charts of top 10 GO terms. Left: Top 10 GO terms of Group B significantly more abundant than those of Group Z. Right: Top 10 GO terms of Group Z significantly more abundant than those of Group B. Y-axis corresponds to significant GO terms, and X-axis corresponds to negative log10 transformed
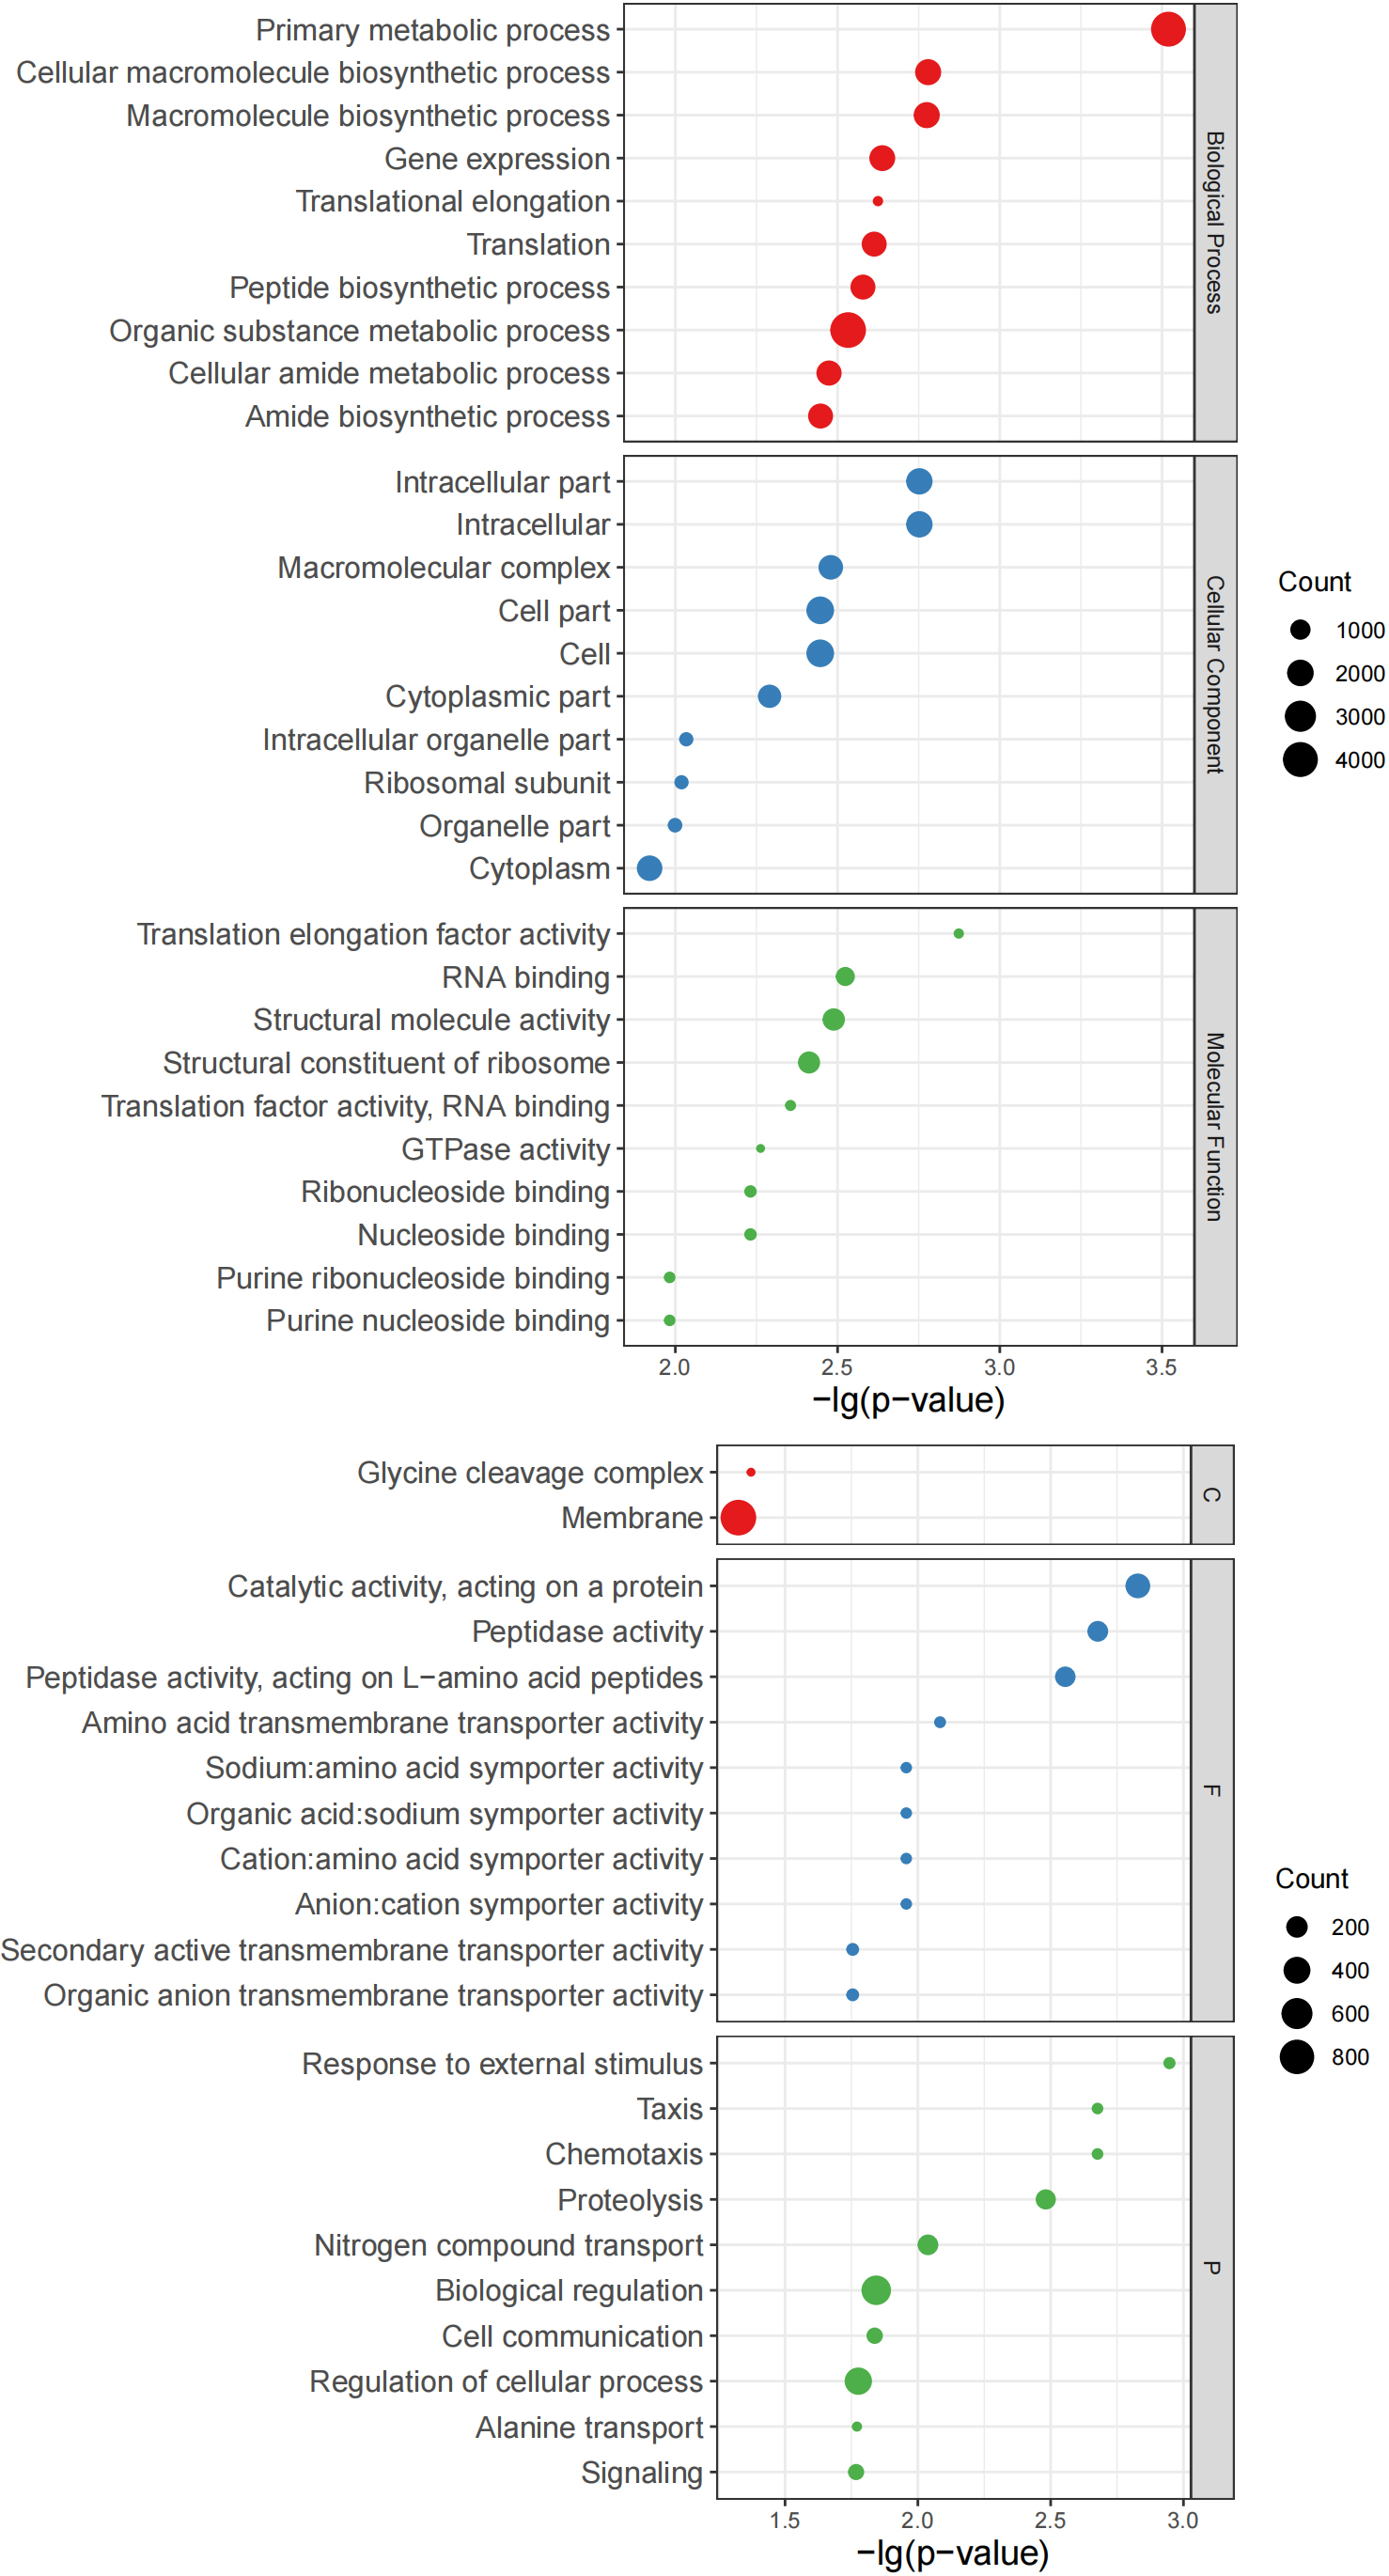
Use internal Perl and R scripts to enumerate the proteins corresponding to the go items of all samples. Fisher’s exact test was performed using R to determine important GO items based on the number of proteins in paired samples from the same patient. At
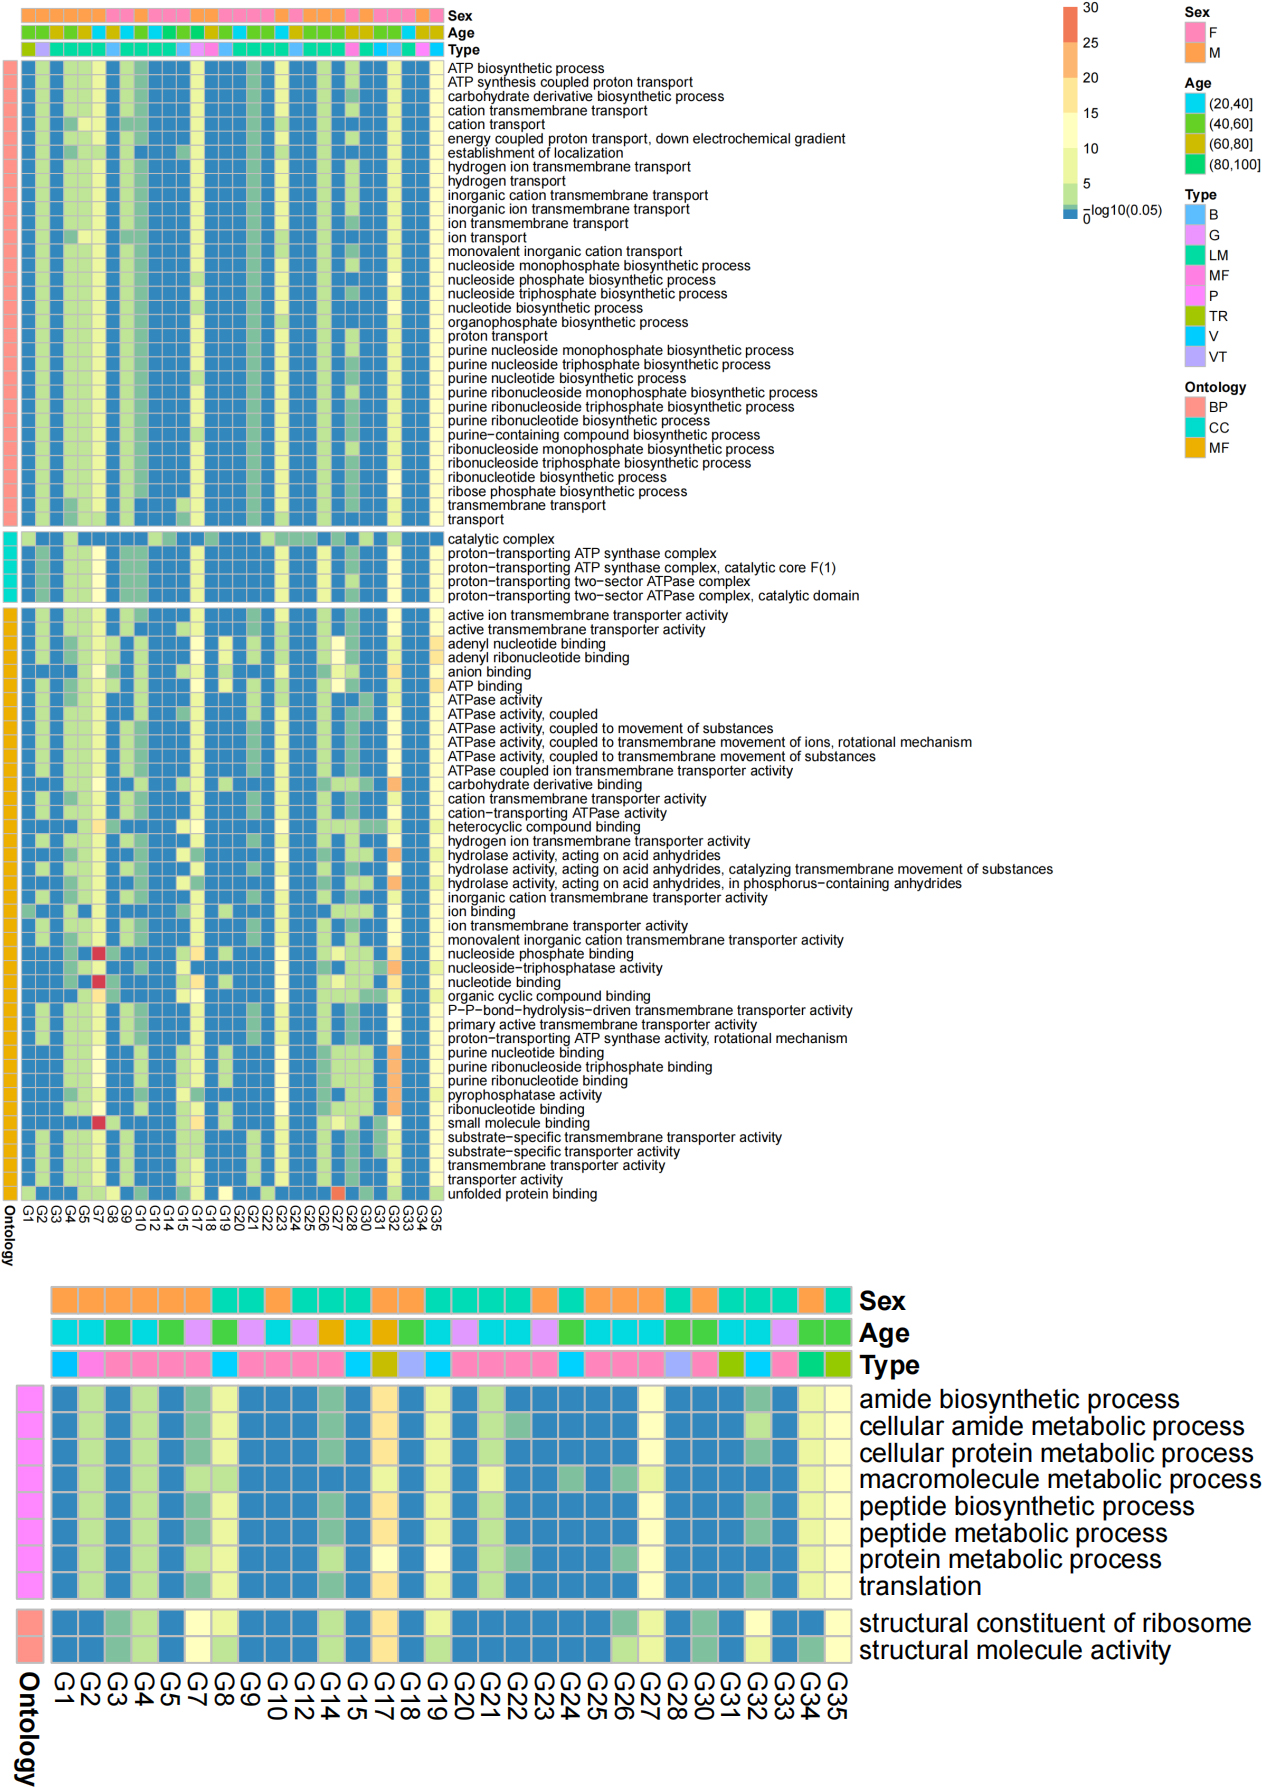
Figure 8.
Heatmaps of transformed p values of significant GO terms in at least 12 sample pairs. A) Significant GO terms of the Z group were more abundant than those of the B group; B) Significant GO terms of the B group were more abundant than those of the Z group.
3.5Pathway analysis based on KEGG
A total of 9,039 top identified microbial proteins were annotated in the KEGG database using KOBAS 3.0. These proteins were related to 1,385 nonredundant KO identifiers and assigned to 196 KEGG pathways belonging to 41 KEGG categories of the 6 top classifications (Fig. 9).
Figure 9.
Krona plot of proteins corresponding to the KEGG pathways. Krona plot shows the proportion of proteins assigned to the KEGG pathways from the top levels to specific pathways.
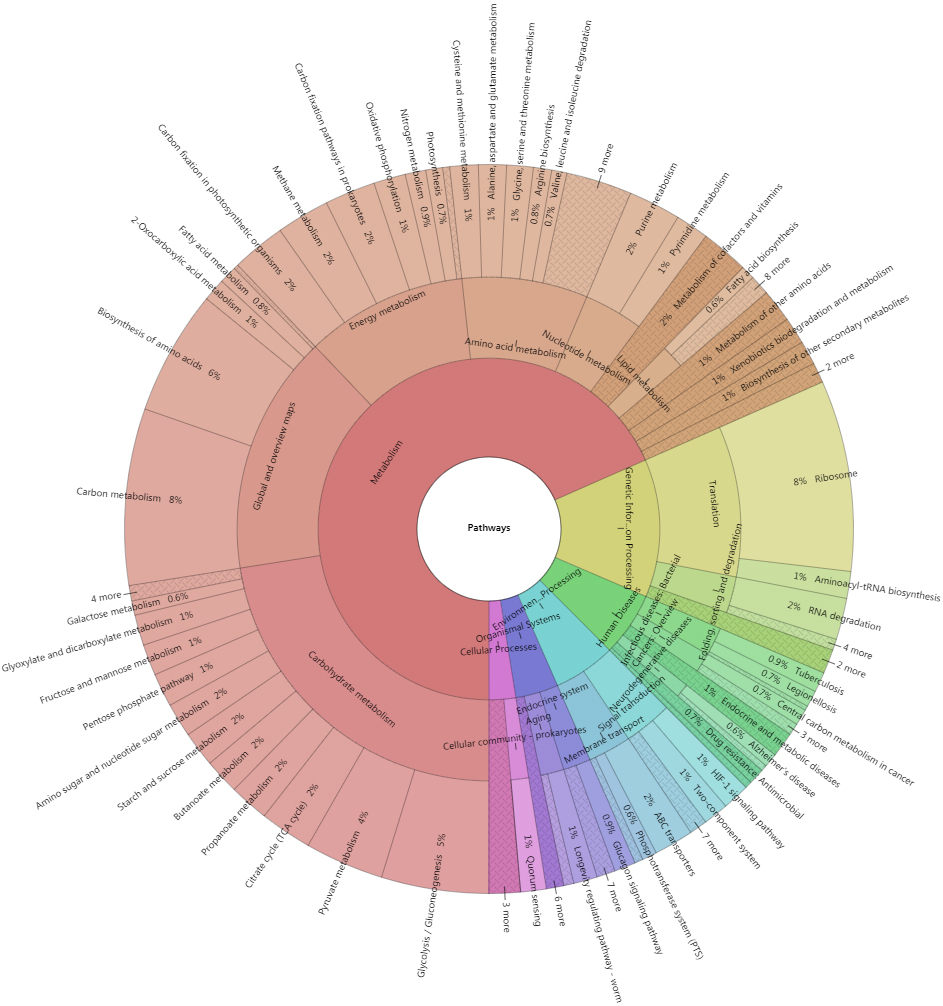
Table 2
Significantly different pathways
| Significantly different pathways in Group B vs. Group Z evaluated by statistical methods. | ||||
|---|---|---|---|---|
| Term | Protein count in Group B | Protein count in Group Z | FDR | |
| Bacterial secretion system | 68 | 32 | 1.21 | 1.70 |
| Protein export | 61 | 29 | 3.34 | 2.35 |
| Lipopolysaccharide biosynthesis | 24 | 9 | 1.14 | 5.37 |
| Aminoacyl-tRNA biosynthesis | 209 | 133 | 4.97 | 1.75 |
| Phenylalanine, tyrosine and tryptophan biosynthesis | 35 | 17 | 7.35 | 2.07 |
| Porphyrin and chlorophyll metabolism | 59 | 34 | 2.09 | 4.92 |
| Bacterial chemotaxis | 65 | 39 | 3.28 | 6.61 |
| Phenylalanine metabolism | 33 | 18 | 3.77 | 6.64 |
| Significantly different pathways in Group Z vs. Group B evaluated by statistical methods. | ||||
| Term | Protein count in Group Z | Protein count in Group B | FDR | |
| Glycolysis/Gluconeogenesis | 784 | 885 | 1.06 | 1.63 |
| Ribosome | 1298 | 1545 | 1.09 | 5.83 |
| Carbon metabolism | 1195 | 1417 | 1.29 | 5.83 |
| RNA degradation | 321 | 342 | 1.52 | 5.83 |
| Biosynthesis of amino acids | 851 | 996 | 3.59 | 1.08 |
| HIF-1 signaling pathway | 219 | 227 | 4.20 | 1.08 |
| Methane metabolism | 381 | 422 | 6.28 | 1.38 |
| Tuberculosis | 165 | 168 | 9.84 | 1.89 |
| Carbon fixation in photosynthetic organisms | 399 | 449 | 1.36 | 2.32 |
| Longevity regulating pathway – worm | 181 | 194 | 4.67 | 7.19 |
| Alzheimer’s disease | 113 | 117 | 8.74 | 1.19 |
| Legionellosis | 129 | 136 | 9.28 | 1.19 |
| Type I diabetes mellitus | 84 | 85 | 1.29 | 1.48 |
| Pyruvate metabolism | 531 | 632 | 1.35 | 1.48 |
| Glucagon signaling pathway | 159 | 174 | 1.46 | 1.50 |
| Propanoate metabolism | 269 | 312 | 2.56 | 2.47 |
| Photosynthesis | 128 | 141 | 3.04 | 2.75 |
| Insulin resistance | 61 | 63 | 4.11 | 3.52 |
Significantly different pathways with
Figure 10A.
Venn diagram for candidate DEPs identified by PLS-DA (VIP), Mann-Whitney U test (MWT), and paired sample T test (PSTT).
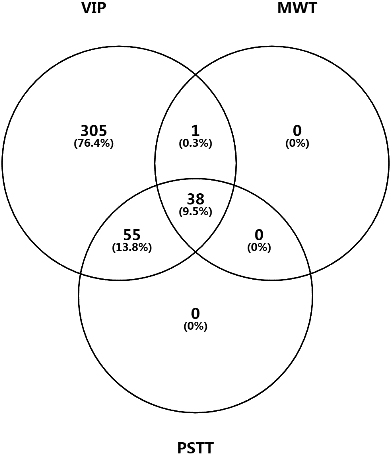
Figure 10B.
Heatmap of DEPs. Row clustering includes Manhattan distance and complete linkage.
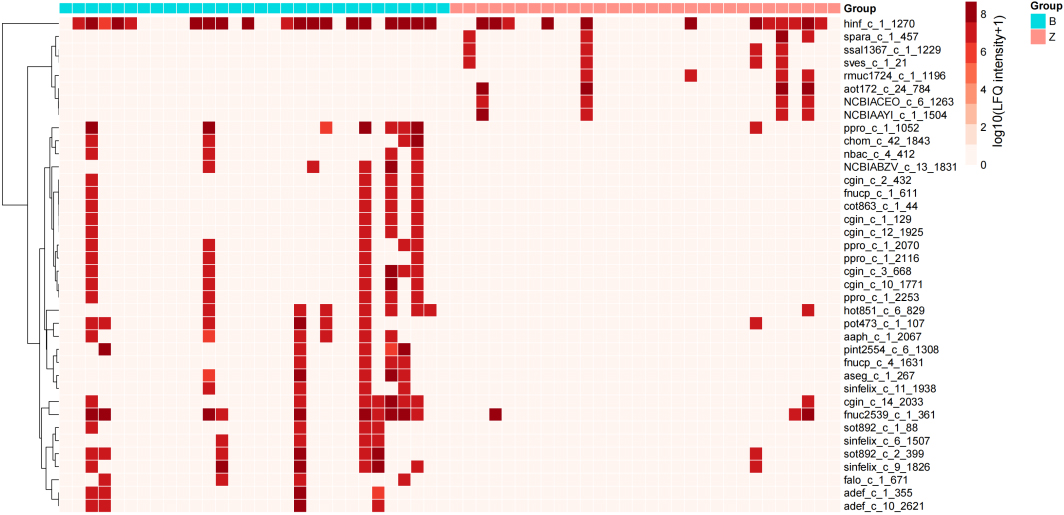
3.6Selection of differentially expressed proteins
Log10-transformed LFQ intensities were used to identify a total of 39 protein groups as candidate significantly differentially expressed proteins (DEPs) in the B versus Z groups according to the Mann-Whitney U test at a cutoff
Figure 11.
PCA score plot of proteins quantified in
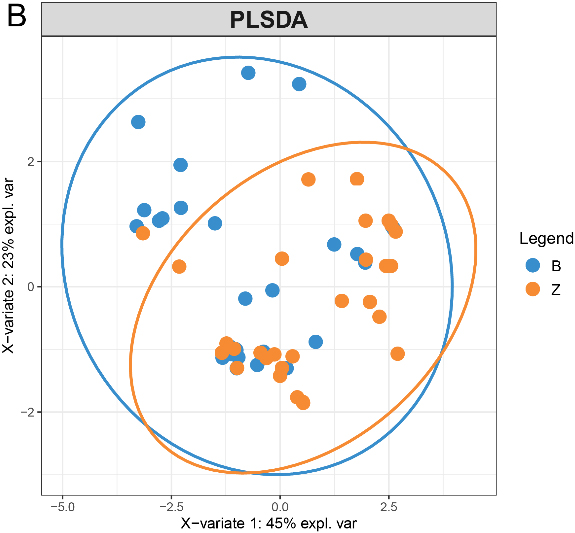
3.7Multidimensional variable analysis
We selected proteins quantified in
3.8Mass spectrometry analysis of PRM validation candidate peptides and proteins
The results of PRM indicated that the 22Z and 22B samples were unsuitable for analysis. Therefore, these two samples were removed from the analysis. Finally, the results of 56 samples from 28 patients were used to perform differentially expressed peptides and protein analysis. We used R (version 3.5.1) software to perform paired sample T test for the selection of differentially expressed peptides and proteins, respectively.
The results of the analysis of proteins identified 10 and 11 candidate differentially expressed proteins according to the paired sample T test with
Table 3
Candidate differentially expressed proteins confirmed by the paired sample T test
| Protein ID | Fold change | |
|---|---|---|
| cgra1653_c_8_2197 | 1.25*10 | 1.84 |
| chom_c_55_2089 | 9.10*10 | 3.50 |
| cot326_c_18_1175 | 3.32*10 | 3.71 |
| cot338_c_14_1730 | 6.62*10 | 2.73 |
| cper_c_3_388 | 2.20*10 | 31.33 |
| esak_c_1_3563 | 4.18*10 | 2.50 |
| fnuc2539_c_1_361 | 4.63*10 | 8.51 |
| fnuc420_c_16_2114 | 7.68*10 | 1.98 |
| fnucp_c_1_589 | 5.86*10 | 3.74 |
| hinf_c_1_1270 | 1.04*10 | 3.29 |
| NCBIACEO_c_3_753 | 4.56*10 | 2.64 |
| NCBIACEO_c_3_844 | 4.47*10 | 2.15 |
| NCBIACEO_c_7_1474 | 3.12*10 | 2.22 |
| nsic_c_12_1571 | 4.43*10 | 5.20 |
| pend_c_10_1352 | 2.64*10 | 2.84 |
| rmuc_c_1_178 | 4.74*10 | 2.31 |
4.Discussion
Consistency of the results obtained by three different approaches used in the present study was high, and there were no significant differences between these results, indicating that the experiment had very good repeatability, and the results were relatively stable. Statistical evaluation identified upregulated and downregulated proteins to illustrate that the number of DEPs was the largest in the B group versus those in the Z group. The heatmap demonstrated that variation in DEP expression in the B group was greater than that in the Z group.
COG functional analysis illustrated that “energy production and conversion” was significantly enriched in the B group. In this category, the number of proteins downregulated in the B group versus those in the Z group was higher than the number of the corresponding upregulated proteins. Thus, energy production and conversion of bacteria was weaker in the B group. Quantitative proteomics analysis performed by Suriyanarayanan demonstrated that metabolic activity of strong biofilm-forming bacteria was weaker than that of weak biofilm-forming bacteria [16]. The authors suggested that lower metabolic activity may promote adhesion instead of dispersal to protect the bacteria from harmful conditions.
Moreover, “proton transport”, “hydrogen transport”, and “hydrogen ion transmembrane transport” were the top 3 enriched GO categories of the B group versus the Z group. The major downregulated DEPs were related to F-type ATP synthase, and the major upregulated DEPs were related to V-type ATP synthase. Significant downregulation of F1F0 ATP synthase subunits encoded by atpABCDEFG suggested that proton motive force-driven ATP synthesis was weakened. Upregulation of V-ATP synthase subunits encoded by atpABD implied that ATP-dependent proton pumps were enhanced, which induced acidification of luminal environments [17]. This process may be due to an external environment, which forced the bacteria to pump hydrogen ions to adjust the pH of their microenvironment to maintain acid-base balance. As a result, the activity of hydrogen-dependent ATP synthesis was decreased, and the proteins related to F-type ATP synthase were downregulated. Additionally, a protein related to H+-transporting two-sector ATPase encoded by EFNG_00349 was significantly increased in both groups in accordance with this phenomenon.
ATP-binding cassette (ABC) transporters represent another category of numerous proteins undergoing significant changes. Two types of ABC transporters with different functions were upregulated and downregulated. Upregulated proteins included ATP-binding proteins related to ATPase activity in the B group versus Z group. These proteins may be related to ATP-dependent proton pump activity mediated by V-ATP synthase, as described above. Downregulated proteins included permease proteins that were mainly responsible for transmembrane transport in the B group versus Z group. Zhu et al. [18] reported that the G_1771 gene of Listeria monocytogenes, which encodes a putative ABC transporter permease, is involved in negative regulation of biofilm formation. The authors analyzed an lm.G_1771 gene deletant strain by phenotypic, proteomic, and genomic methods and demonstrated that certain genes are downregulated, including dltABCD operons involved in negative regulation of biofilm formation [18]. DltABCD plays a role in the binding of positively charged D-alanine residues to lipoteichoic acid of the bacterial membrane. Downregulation of these genes may lead to a negative charge on the bacterial surface. In the present study, permease proteins of ABC transporters, proteins encoded by dltC, and alanine racemase involved in D-alanine biosynthesis all decreased. A decrease in permease ABC transporters suggested a stronger biofilm-forming ability. Downregulation of the D-alanine carrier protein encoded by dltC [19] and alanine racemase reduces the amount of D-alanine bound to LTA on the bacterial surface, which leads to a negative charge on the bacterial surface to resist an increase in OH
Additionally, the phosphotransferase system (PTS) was another category of proteins significantly altered in the present study. PTS system mannose/fructose/sorbose family IID component, PTS mannose transporter subunit IID, PTS system mannose/fructose/N-acetylgalactosamine-transporter subunit IIB, and PTS system lactose/cellobiose specific IIA subunit were downregulated in the B group, and PTS system cellobiose-specific IIA component was upregulated. PTS plays an important role in the uptake and phosphorylation of sugars. All PTSs consist of two cytoplasmic phosphotransferase proteins and the sugar-specific enzyme II complex. The latter complex consists of the IIA, IIB, and IIC or IICIID subunits [20]. The results of the present study suggested downregulation of the mannose/fructose/sorbose/lactose metabolism pathway. PTS participates in important interactions that regulate bacterial adaptation to stressful environments and antibiotic resistance. Peng et al. [21] demonstrated that intact PTS promotes the adaption of bacteria to stressful conditions by enhancing their resistance to hydrogen peroxide and acid, production of more harmful substances, such as SOD, survival in macrophages, and regulation of antioxidant and catabolite genes. Wei et al. [22] demonstrated that PTS mediates resistance to multiple drugs by regulating potA and/or OG1RF_10526 to enhance resistance to nisin, repressing biosynthesis of ribosomes to improve sensitivity to gentamycin and increasing sensitivity to daptomycin. This regulation suggests that PTS may be a direction that should be explored.
In the present study, L-serine dehydratase-related proteins were greatly reduced in the B group. An iron-sulfur cluster-binding protein encoded by WO5_01154 was also significantly downregulated since L-serine dehydratases are iron-sulfur proteins [23]. This binding protein may participate in the catalysis of dehydratase. Lindenstrauss et al. [24] demonstrated that the alpha subunit of L-serine dehydratase is anaerobically induced in the OG1RF strain. L-Serine dehydratase participates in the degradation of L-serine to ammonium (NH
A protein encoded by esp was downregulated in the B group. There are many contradictory studies on the relationships between esp and biofilm formation. Some authors suggested that esp is related to formation and degree of the biofilm [26, 27, 28], and other authors suggested that esp is irrelevant to biofilm [29, 30, 31, 32]. In the present study, a trend in transcription was consistent with a trend in protein expression (Fig. 10A and B). A protein encoded by sea1 was upregulated in the B group; The protein is located on the surface of donor bacterial cells, and its main function is to reduce the ineffective binding frequency of sexual pheromones between donor strains [33].
Yan et al. [34] detected the up regulation of SEA1 protein in low-level linezolid resistant strains of E faecalis.
A universal stress protein encoded by EFNG_00797 and the chaperone protein DnaK were upregulated in the B group. The chaperone protein dnaK is considered a stress protein, folding newly synthesized proteins [35].
qPCR and PRM were used to verify the TMT in the present study. The results of qPCR are somewhat different from the data of TMT, and consistency of the PRM data is ideal. These differences may be due to the fact that transcript mRNA levels correspond to only 29–55% of the protein levels in prokaryotes [36], especially in the presence of perturbation-induced changes. PRM is an ion monitoring technology based on high-resolution and high-precision mass spectrometry. The principle of PRM technology is similar to that of SRM/MRM; however, PRM is more commonly used for absolute quantification of proteins and peptides in the development of analytical methods [37, 38, 39]. The results of TMT and PRM obtained in the present study are in good agreement, indicating that the results of TMT are reliable.
5.Conclusion
Bacterial dysbiosis was observed in the samples of OSCC surface lesions in the present study, with considerable changes in bacterial composition and protein functions compared to those in the control samples. In particular, a group of proteins involved in energy production and conversion, proton transport, hydrogen transport and hydrogen ion transmembrane transport, ATP-binding cassette (ABC) transporter, PTS system, and L-serine dehydratase were significantly enriched in OSCC samples. In addition, we found that some proteins related to actinomycetes and Clostridium are highly involved in oral squamous cell carcinoma, which may have good diagnostic ability. The microbiota in oral squamous cell carcinoma is considered to be a synergistic pathogenic factor. From our research results, it is difficult to determine whether dysbacteriosis will change the local microenvironment, so that bacteria suitable for the tumor microenvironment thrive, and then cause cancer. More investigation is still needed. The present study revealed considerable changes in bacterial protein expression in OSCC. These findings provide additional information about an association between the expression of oral bacterial proteins and oral cancer.
Author contributions
WJ, YZ and SR designed the project and wrote the manuscript. ZS supervised the experiments. WXC and ZYH performed the experiments and analyzed the data. All authors read and revised the manuscript.
Funding
The study was supported by the Shanghai Natural Science Foundation of China (Contract grant number: 18zr1422300); Innovative research team of high-level local universities in Shanghai (SSMU-ZDCX20180901); Fundamental research program funding of Ninth People’s Hospital affiliated with Shanghai Jiao Tong University School of Medicine (JYZZ139); Shanghai Science & Technology Development Foundation (HY202211TUE03); Natural Science Foundation of Tibet Autonomous Region (XZ2019ZR-ZY43(Z)); and the Research Discipline Fund (No. KQYJXK2020) from Ninth People’s Hospital, Shanghai Jiao Tong University School of Medicine, and College of Stomatology, Shanghai Jiao Tong University.
Acknowledgments
The authors thank Shanghai Shengzi Biotechnology Co., Ltd for their effort on LS/MS experiments.
Conflict of interest
The authors declare that they have no conflict of interest.
References
[1] | Chen AY, Myers JN. Cancer of the oral cavity. Dis Mon. (2001) ; 47: : 275-361. doi: 10.1067/mcd.2001.109374. |
[2] | Flach GB, Verdonck-de Leeuw IM, Witte BI, Klop WM, van Es RJ, Schepman KP, et al. Patients’ perspective on the impact of sentinel node biopsy in oral cancer treatment. Oral Surg Oral Med Oral Pathol Oral Radiol. (2016) ; 122: : 279-86. doi: 10.1016/j.oooo.2016.03.014. |
[3] | Dediol E, Sabol I, Virag M, Grce M, Muller D, Manojlović S. HPV prevalence and p16INKa overexpression in non-smoking non-drinking oral cavity cancer patients. Oral Dis. (2016) ; 22: : 517-22. doi: 10.1111/odi.12476. |
[4] | Pollard J. Bacteria, inflammation and cancer. Nat Rev Immunol. (2015) ; 15: : 528. doi: 10.1038/nri3899. |
[5] | Bultman SJ. Emerging roles of the microbiome in cancer. Carcinogenesis. (2014) ; 35: : 249-55. doi: 10.1093/carcin/bgt392. |
[6] | Nagy KN, Sonkodi I, Szöke I, Nagy E, Newman HN. The microflora associated with human oral carcinomas. Oral Oncol. (1998) ; 34: : 304-8. doi: 10.1016/S1368-8375(98)80012-2. |
[7] | Hooper SJ, Crean SJ, Lewis MA, Spratt DA, Wade WG, Wilson MJ. Viable bacteria present within oral squamous cell carcinoma tissue. J Clin Microbiol. (2006) ; 44: : 1719-25. doi: 10.1128/jcm.44.5.1719-1725.2006. |
[8] | Hooper SJ, Crean SJ, Fardy MJ, Lewis MAO, Spratt DA, Wade WG, et al. A molecular analysis of the bacteria present within oral squamous cell carcinoma. J Med Microbiol. (2007) ; 56: : 1651-9. doi: 10.1099/jmm.0.46918-0. |
[9] | Pushalkar S, Ji X, Li Y, Estilo C, Yegnanarayana R, Singh B, et al. Comparison of oral microbiota in tumor and non-tumor tissues of patients with oral squamous cell carcinoma. BMC Microbiol. (2012) ; 12: : 144. doi: 10.1186/1471-2180-12-144. |
[10] | Bebek G, Bennett KL, Funchain P, Campbell R, Seth R, Scharpf J, et al. Microbiomic subprofiles and MDR1 promoter methylation in head and neck squamous cell carcinoma. Hum Mol Genet. (2012) ; 21: : 1557-65. doi: 10.1093/hmg/ddr593. |
[11] | Wang H, Funchain P, Bebek G, Altemus J, Zhang H, Niazi F, et al. Microbiomic differences in tumor and paired-normal tissue in head and neck squamous cell carcinomas. Genome Med. (2017) ; 9: : 14. doi: 10.1186/s13073-017-0405-5. |
[12] | Pushalkar S, Mane SP, Ji X, Li Y, Evans C, Crasta OR, et al. Microbial diversity in saliva of oral squamous cell carcinoma. FEMS Immunol Med Microbiol. (2011) ; 61: : 269-77. doi: 10.1111/j.1574-695X.2010.00773.x. |
[13] | Guerrero-Preston R, Godoy-Vitorino F, Jedlicka A, Rodríguez-Hilario A, González H, Bondy J, et al. 16S rRNA amplicon sequencing identifies microbiota associated with oral cancer, human papilloma virus infection and surgical treatment. Oncotarget. (2016) ; 7: : 51320-34. doi: 10.18632/oncotarget.9710. |
[14] | Al-Hebshi NN, Nasher AT, Idris AM, Chen T. Robust species taxonomy assignment algorithm for 16S rRNA NGS reads: application to oral carcinoma samples. J Oral Microbiol. (2015) ; 7: : 28934. doi: 10.3402/jom.v7.28934. |
[15] | Al-Hebshi NN, Nasher AT, Maryoud MY, Homeida HE, Chen T, Idris AM, et al. Inflammatory bacteriome featuring Fusobacterium nucleatum and Pseudomonas aeruginosa identified in association with oral squamous cell carcinoma. Sci Rep. (2017) ; 7: : 1834. doi: 10.1038/s41598-017-02079-3. |
[16] | Suriyanarayanan T, Qingsong L, Kwang LT, Mun LY, Truong T, Seneviratne CJ. Quantitative proteomics of strong and weak biofilm formers of Enterococcus faecalis reveals novel regulators of biofilm formation. Mol Cell Proteomics. (2018) ; 17: : 643-54. doi: 10.1074/mcp.RA117.000461. |
[17] | Kane PM. The where, when, and how of organelle acidification by the yeast vacuolar H+-ATPase. Microbiol Mol Biol Rev. (2006) ; 70: : 177-91. doi: 10.1128/mmbr.70.1.177-191.2006. |
[18] | Zhu X, Liu W, Lametsch R, Aarestrup F, Shi C, She Q, et al. Phenotypic, proteomic, and genomic characterization of a putative ABC-transporter permease involved in Listeria monocytogenes biofilm formation. Foodborne Pathog Dis. (2011) ; 8: : 495-501. doi: 10.1089/fpd.2010.0697. |
[19] | Fabretti F, Theilacker C, Baldassarri L, Kaczynski Z, Kropec A, Holst O, et al. Alanine esters of enterococcal lipoteichoic acid play a role in biofilm formation and resistance to antimicrobial peptides. Infect Immun. (2006) ; 74: : 4164-71. doi: 10.1128/iai.00111-06. |
[20] | Jeckelmann JM, Erni B. The mannose phosphotransferase system (Man-PTS) – Mannose transporter and receptor for bacteriocins and bacteriophages. Biochim Biophys Acta Biomembr. (2020) ; 1862: : 183412. doi: 10.1016/j.bbamem.2020.183412. |
[21] | Peng Z, Ehrmann MA, Waldhuber A, Niemeyer C, Miethke T, Frick JS, et al. Phosphotransferase systems in Enterococcus faecalis OG1RF enhance anti-stress capacity in vitro and in vivo. Res Microbiol. (2017) ; 168: : 558-66. doi: 10.1016/j.resmic.2017.03.003. |
[22] | Wei L, Li M, Xia F, Wang J, Ran S, Huang Z, et al. Phosphate transport system mediates the resistance of Enterococcus faecalis to multidrug. Microbiol Res. (2021) ; 249: : 126772. doi: 10.1016/j.micres.2021.126772. |
[23] | Cicchillo RM, Baker MA, Schnitzer EJ, Newman EB, Krebs C, Booker SJ. Escherichia coli L-serine deaminase requires a [4Fe-4S] cluster in catalysis. J Biol Chem. (2004) ; 279: : 32418-25. doi: 10.1074/jbc.M404381200. |
[24] | Lindenstrauss AG, Behr J, Ehrmann MA, Haller D, Vogel RF. Identification of fitness determinants in Enterococcus faecalis by differential proteomics. Arch Microbiol. (2013) ; 195: : 121-30. doi: 10.1007/s00203-012-0857-3. |
[25] | Großeholz R, Koh CC, Veith N, Fiedler T, Strauss M, Olivier B, et al. Integrating highly quantitative proteomics and genome-scale metabolic modeling to study pH adaptation in the human pathogen Enterococcus faecalis. NPJ Syst Biol Appl. (2016) ; 2: : 16017. doi: 10.1038/npjsba.2016.17. |
[26] | Tendolkar PM, Baghdayan AS, Gilmore MS, Shankar N. Enterococcal surface protein, Esp, enhances biofilm formation by Enterococcus faecalis. Infect Immun. (2004) ; 72: : 6032-9. doi: 10.1128/iai.72.10.6032-6039.2004. |
[27] | Tendolkar PM, Baghdayan AS, Shankar N. The N-terminal domain of enterococcal surface protein, Esp, is sufficient for Esp-mediated biofilm enhancement in Enterococcus faecalis. J Bacteriol. (2005) ; 187: : 6213-22. doi: 10.1128/jb.187.17.6213-6222.2005. |
[28] | Toledo-Arana A, Valle J, Solano C, Arrizubieta MJ, Cucarella C, Lamata M, et al. The enterococcal surface protein, Esp, is involved in Enterococcus faecalis biofilm formation. Appl Environ Microbiol. (2001) ; 67: : 4538-45. doi: 10.1128/aem.67.10.4538-4545.2001. |
[29] | Dworniczek E, Wojciech Ł, Sobieszczańska B, Seniuk A. Virulence of Enterococcus isolates collected in Lower Silesia (Poland). Scand J Infect Dis. (2005) ; 37: : 630-6. doi: 10.1080/00365540510031421. |
[30] | Kristich CJ, Li YH, Cvitkovitch DG, Dunny GM. Esp-independent biofilm formation by Enterococcus faecalis. J Bacteriol. (2004) ; 186: : 154-63. doi: 10.1128/jb.186.1.154-163.2004. |
[31] | Mohamed JA, Murray BE. Lack of correlation of gelatinase production and biofilm formation in a large collection of Enterococcus faecalis isolates. J Clin Microbiol. (2005) ; 43: : 5405-7. doi: 10.1128/jcm.43.10.5405-5407.2005. |
[32] | Ramadhan AA, Hegedus E. Biofilm formation and esp gene carriage in enterococci. J Clin Pathol. (2005) ; 58: : 685-6. doi: 10.1136/jcp.2004.024109. |
[33] | Weidlich G, Wirth R, Galli D. Sex pheromone plasmid pAD1-encoded surface exclusion protein of Enterococcus faecalis. Mol Gen Genet. (1992) ; 233: : 161-8. doi: 10.1007/bf00587575. |
[34] | Yan J, Xia Y, Yang M, Zou J, Chen Y, Zhang D, et al. Quantitative proteomics analysis of membrane proteins in Enterococcus faecalis with low-level linezolid-resistance. Front Microbiol. (2018) ; 9: : 1698. doi: 10.3389/fmicb.2018.01698. |
[35] | Pfanner N. Who chaperones nascent chains in bacteria? Curr Biol. (1999) ; 9: : R720-4. doi: 10.1016/s0960-9822(99)80467-9. |
[36] | Taniguchi Y, Choi PJ, Li GW, Chen H, Babu M, Hearn J, et al. Quantifying E. coli proteome and transcriptome with single-molecule sensitivity in single cells. Science. (2010) ; 329: : 533-8. doi: 10.1126/science.1188308. |
[37] | Bourmaud A, Gallien S, Domon B. Parallel reaction monitoring using quadrupole-Orbitrap mass spectrometer: principle and applications. Proteomics. (2016) ; 16: : 2146-59. doi: 10.1002/pmic.201500543. |
[38] | Peterson AC, Russell JD, Bailey DJ, Westphall MS, Coon JJ. Parallel reaction monitoring for high resolution and high mass accuracy quantitative, targeted proteomics. Mol Cell Proteomics. (2012) ; 11: : 1475-88. doi: 10.1074/mcp.O112.020131. |
[39] | Mesuere B, Debyser G, Aerts M, Devreese B, Vandamme P, Dawyndt P. The Unipept metaproteomics analysis pipeline. Proteomics. (2015) ; 15: : 1437-42. doi: 10.1002/pmic.201400361. |


