
Assessment of the risk of unexplained recurrent spontaneous abortion based on the proportion and correlation of NK cells and T cells in peripheral blood
Abstract
BACKGROUND:
Unexplained recurrent spontaneous abortion (URSA) is difficult to diagnose and treat clinically due to its unknown cause
OBJECTIVE:
Changes in natural killer (NK) cells, T lymphocytes, and Th1(IFN
METHODS:
For this study, we selected patients with URSA as the case group and included normal women in the control group. Flow cytometry was performed to detect lymphocytes and cytokines in the peripheral blood of all subjects.
RESULTS:
The proportion of NK cells, Th1 cells, and the Th1/Th2 ratio were significantly higher in the URSA group compared to the control group; whereas the proportion of CD3+T cells was lower. Pairwise correlation analysis revealed a positive correlation between the percentage of NK cells and CD3+T cells, as well as CD3+CD4+T cells. Canonical correlation analysis indicated a significant correlation between NK cells and T cells, including their subgroups.
CONCLUSION:
Patients with URSA have immune balance disorders, characterised by an increased proportion of peripheral blood NK cells, Th1, and Th1/Th2 ratio along with a decreased proportion of CD3+T cells. The proportion of NK cells and CD3+T may serve as predictive factors for URSA, while NK cells are closely related to the regulation of CD3+T cells and their subsets. By regulating the level of IFN-
1.Introduction
Recurrent spontaneous abortion (RSA) refers to the occurrence of spontaneous abortion on two or more occasions with the same sexual partner before 20 weeks of pregnancy [1] and has an incidence as high as 5% in women of childbearing age [2]. The aetiology of RSA is complex and includes genetic factors, endocrine disorders, anatomical abnormalities, immune factors, and the prethrombotic state [3, 4, 5, 6]. However, more than 50% of patients with RSA have an unknown aetiology, which is known as unexplained RSA (URSA). The pathogenesis of URSA has been suggested to be related to acquired immune disorders (including T/B lymphocytes, and cytokine abnormalities) and innate immune disorders (including increased numbers and activity of natural killer (NK) cells, abnormal function of macrophages and dendritic cells, and abnormal complement system) [7, 8, 9]. Studies have indicated that the regulation of peripheral blood NK (pNK) and various lymphocytes is associated with reproductive immunopathologies such as RSA, implantation failure, and preeclampsia, among other conditions [10]. Based on these hypotheses change that may be detectable in the peripheral blood of patients with URSA. This study aimed to analyze changes in T, B, and NK lymphocyte subsets and T-helper 1 (Th1)/T-helper 2 (Th2) cytokines in the peripheral blood of women with URSA and analysed the changes in lymphocytes and cytokines. Understanding the immunological contributors to the pathogenesis of URSA may provide a basis for clinical diagnosis and treatment.
2.Materials and methods
2.1Subjects
2.1.1URSA group
In total, 269 patients with URSA were admitted to the Family Planning Hospital of Guangdong Province from January 2014 to October 2021 and were enrolled in the study. Patients meeting the following criteria are considered URSA: (1) previously had two or more consecutive spontaneous abortions occurring at a gestational age of less than 12 weeks; (2) No abnormal chromosomal karyotype of parents; (3) No abnormality or infection of reproductive tract; (4) No abnormality in menstrual cycle, basic sex hormones, thyroid function, fasting blood sugar, etc.; (5) Autoantibodies (antinuclear antibodies, anti- Thyroid antibody, antiphospholipid antibody) were never positive; and (6) No abnormality was found in the father’s semen.
2.1.2Control group
Within the same period of time, 35 women at a similar gestational age who visited the hospital for routine check-up were enrolled as the control group. The individuals in the control group were selected based on the following criteria: (1) a history of
In the morning, 10 ml of peripheral blood (non-pregnancy, non-menstrual period) was collected without food and water, of which 5 ml was stored in an anticoagulation tube containing 2% EDTA, and aliquoted in EP tubes and stored at
2.2Research methods
2.2.1Instruments and reagents
Assays were performed using an ABD FACSCalibur Cell flow cytometer (BD Biosciences, Franklin Lakes, NJ, USA) and its analysis software Cell Quest Pro. Detection reagents were obtained from BD Biosciences and included hemolysin, buffer (0.1% in phosphate buffered saline (PBS) sodium azide, 0. 1% sodium azide in PBS prepared with paraformaldehyde solution), T cells, B cells, NK cells and interferon (IFN)-
2.2.2Detection of B cells, T cells, NK cells and related cell subtypes using flow cytometry
Blood samples were collected from all subjects during the non-pregnancy and non-menstrual periods, and 3–5 days after menstruation. Add 100
2.2.3Detection of Th1 (IFNγ
To a 150-
2.2.4Statistical analysis
Data analysis was conducted using SPSS version 26 software (SPSS, Inc., Chicago, IL, USA). Normality of the data was assessed and data with normal distribution were tested for homogeneity of variance. Two-sample t-test was used for comparing the two datasets, while rank test was used for non-normally distributed data. Statistical significance was set at
3.Results
3.1General data comparison
As presented in Table 1, the age of URSA group patients ranged from 19 to 40 years, with a mean age of 28.59
Table 1
Comparison of basic data between case group and control group
| Group | Control ( | URSA ( |
|
|---|---|---|---|
| Age | 28.29 | 28.59 | 0.661 |
| BMI | 20.82 | 20.81 | 0.958 |
3.2Comparison of NK cells, B cells, and T cells and Th1 (IFNγ
The percentage of NK cells was significantly higher in the URSA group compared to the control group (20.20
Table 2
Comparison of NK cell, and B cell among control and URSA
| Cohort | Control(35) | URSA(269) | |||||||
|---|---|---|---|---|---|---|---|---|---|
| Variable | Mean | Median | Range | SD | Mean | Median | Range | SD |
|
| NK(%)* | 10.56 | 10.24 | 6.10–18.64 | 2.71 | 20.20 | 19.91 | 3.34–40.50 | 5.34 | 0.000 |
| CD3+CD56+(%) | 5.7 | 4.9 | 1.02–23.17 | 4.48 | 5.33 | 4.68 | 0.38–27.64 | 3.37 | 0.971 |
| CD56dimCD16+(%) | 92.71 | 95.12 | 74.75–99.17 | 6.91 | 95.86 | 97.27 | 70.87–99.72 | 4.08 | 0.006 |
| CD56brightCD16-(%) | 2.31 | 2.03 | 0.31–6.62 | 1.59 | 1.81 | 1.38 | 0.00–11.41 | 1.53 | 0.052 |
| B-cell | 13.05 | 12.21 | 6.06–24.58 | 4.32 | 12.17 | 11.86 | 1.78–41.99 | 4.57 | 0.207 |
| CD19+CD5+B | 18.68 | 11.66 | 2.80–59.49 | 15.55 | 14.16 | 12.23 | 0.52–59.62 | 9.86 | 0.409 |
Note.
Table 3
Comparison of T cell, Th1(IFN
| Cohort | Control (35) | Mean URSA (269) | |||||||
| Variable | Mean | Median | Range | SD | Mean | Median | Range | SD |
|
| CD3+T | 69.40 | 70.59 | 40.80–80.99 | 8.81 | 63.93 | 64.22 | 3.00–94.95 | 8.52 | 0.000 |
| CD3+CD4+T | 35.94 | 34.93 | 23.95–50.35 | 6.50 | 34.37 | 34.19 | 2.44–49.08 | 6.13 | 0.154 |
| CD3+CD8+T | 31.50 | 31.04 | 9.42–45.89 | 6.76 | 31.05 | 30.85 | 0.85–48.01 | 6.92 | 0.717 |
| Th/Ts | 1.33 | 1.2 | 0.52–3.10 | 0.51 | 1.43 | 1.37 | 0.58–3.46 | 0.50 | 0.273 |
| Th1(IFN | 16.56 | 14.71 | 7.60–34.39 | 6.44 | 22.62 | 21.86 | 0.16–61.42 | 10.60 | 0.000 |
| Th2(IL-4) | 2.17 | 1.5 | 0.39–13.40 | 2.25 | 2 | 1.39 | 0.03–10.45 | 1.77 | 0.379 |
| Th1(IFN | 11.33 | 9.88 | 0.84–31.87 | 6.66 | 20.01 | 14.30 | 1.60–185 | 21.26 | 0.008 |
Note.
Table 4
The area under the curve (AUC) for NK cells and CD3+T cell
| Group | AUC | Cut off | Sensitivity (%) | Specificity (%) |
|
|---|---|---|---|---|---|
| NK1 | 0.954 | 13.51 | 93.7 | 94.3 | 0.000 |
| CD3+T2 | 0.717 | 69.86 | 79.9 | 62.9 | 0.000 |
Note. 1, The larger the value, the more likely it is URSA, 2, The smaller the value, the more likely it is to be URSA.
Figure 1.
Histogram of NK cell, T cell, B cell, Th1(IFN
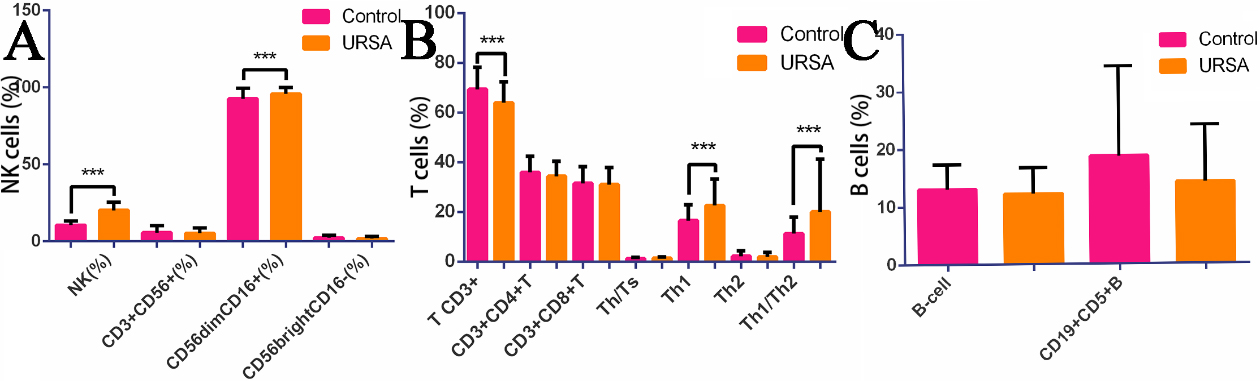
Figure 2.
ROC map of NK cells and CD3+T.
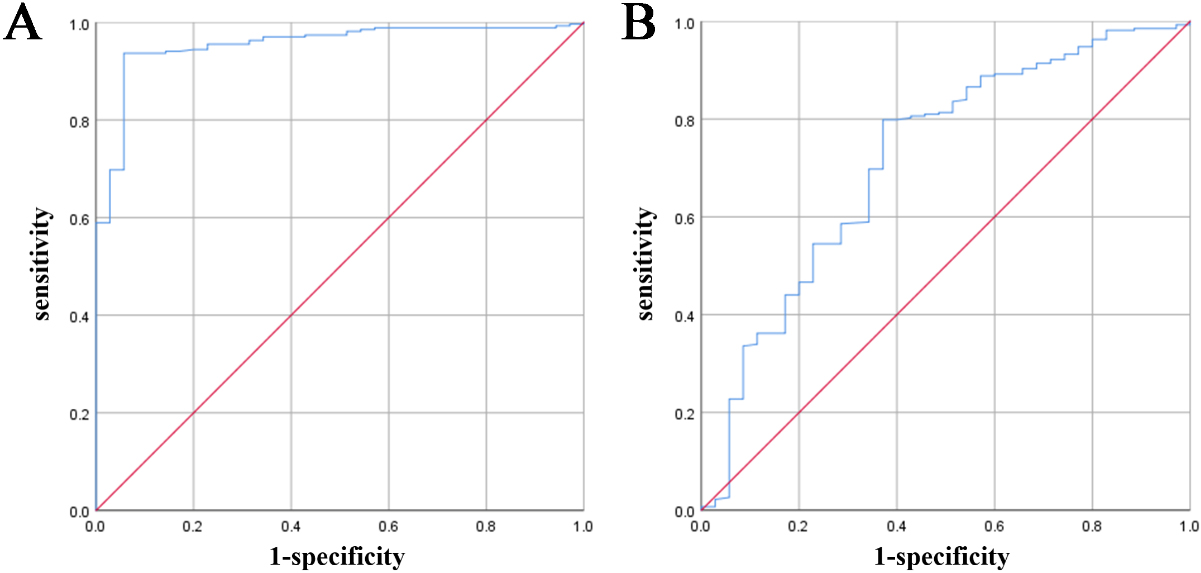
3.3Diagnostic value of the NK cell and CD3+T ratio for URSA
Comparison of the ratios of lymphocytes and their subgroups between the URSA group and normal control group showed that the ratios of NK cells and CD3+T were significantly different. To further analyse the diagnostic value of NK cells and CD3+T lymphocytes in recurrent miscarriage, we draw a receiver operating characteristic (ROC) curve, as shown in Table 4 and Fig. 2. The area under the ROC curve of NK cells was 0.954 (
3.4Correlation analysis of NK cells, T cell subsets, and cytokines
3.4.1Pairwise comparison between NK cell and T cell subsets
As described in Section 3.1, we compared the ratio of lymphocytes and subgroups between the URSA and control groups. The results revealed significant differences in NK cells, CD3+T, and Th1(IFN
Table 5
Relationship between NK cell and T cell in Ursa group
| Group | NK(%) | CD3+T | CD3+CD4+T | CD3+CD8+T | Th/Ts | Th1(IF | |||||||
|---|---|---|---|---|---|---|---|---|---|---|---|---|---|
| NK(%) |
| 1 | .500 | | .396 | | .32 | 0 | .080 | .012 | |||
|
| – | 0 | .000 | 0 | .000 | 0 | .597 | 0 | .192 | 0 | .845 | ||
| CD3+T |
| .500 | 1 | 0 | .471 | 0 | .438 | .184 | .024 | ||||
|
| 0 | .000 | – | 0 | .000 | 0 | .000 | 0 | .002 | 0 | .702 | ||
| CD3+CD4+T |
| .396 | 0 | .471 | 1 | .304 | 0 | .571 | .144 | ||||
|
| 0 | .000 | 0 | .000 | – | 0 | .000 | 0 | .000 | 0 | .023 | ||
| CD3+CD8+T |
| .032 | 0 | .438 | .304 | 1 | .680 | 0 | .048 | ||||
|
| 0 | .597 | 0 | .000 | 0 | .000 | – | 0 | .000 | 0 | .449 | ||
| Th/Ts |
| 0 | .080 | .184 | 0 | .571 | .680 | 1 | .166 | ||||
|
| 0 | .192 | 0 | .002 | 0 | .000 | 0 | .000 | – | 0 | .009 | ||
| Th1(IF |
| .012 | .024 | .144 | 0 | .048 | .166 | 1 | |||||
|
| 0 | .845 | 0 | .702 | 0 | .023 | 0 | .449 | 0 | .009 | – | ||
Figure 3.
Correlation diagram.
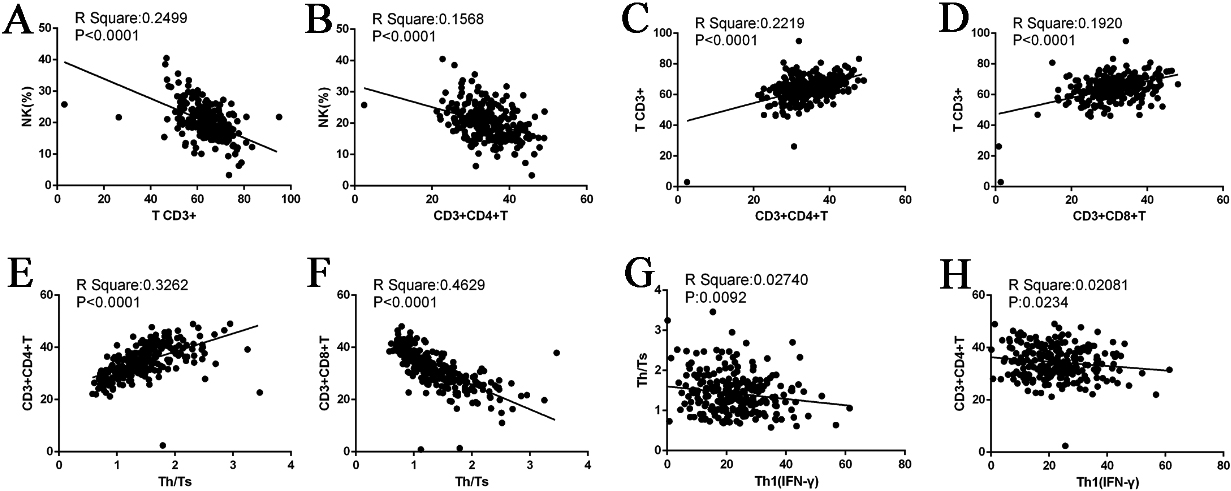
3.4.2Correlation between NK and T cell groups
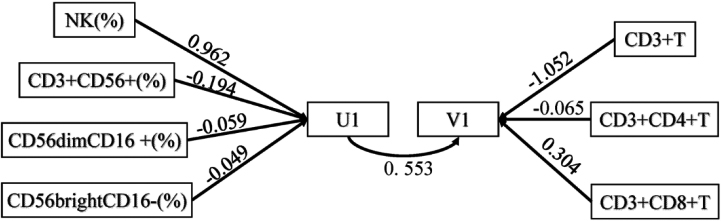
Correlation analysis showed that NK cells are significantly related to T cells. Therefore, NK cells and their three subgroups U1 (including NK, CD3+ CD56+, CD56dimCD16+, CD56brightCD16-) and T cells and their two subgroups V1 (including CD3+T, CD3+CD4+T, CD3+CD8+T) were analysed to determine their canonical correlation. Through canonical correlation analysis, two pairs of variables were generated. The two pair coefficients were 0.553 and 0.349, respectively, which were significant (
Table 6
Canonical correlation variables and coefficients. (NK cell and T cell)
| Typical variable | Canonical correlation coefficient | Wilk’s |
|
|
|---|---|---|---|---|
| 1 | 0.553 | 0.568 | 13.767 | 0 |
| 2 | 0.349 | 0.818 | 9.241 | 0 |
| 3 | 0.261 | 0.932 | – | – |
Table 7
Normalized canonical correlation coefficient of set 1
| Group | 1 | 2 | 3 |
|---|---|---|---|
| NK | 0.962 | 0.014 | |
| CD3+CD56+ | 0.466 | ||
| CD56dimCD16+ | 0.455 | 1.007 | |
| CD56brightCD16- | 0.397 | 0.167 | |
| CD3+T | |||
| CD3+CD4+T | 1.413 | 0.440 | |
| CD3+CD8+T | 0.304 | 0.592 | 1.292 |
U1
V1
For the first pair of typical variables, U1 was positively correlated with the original NK data with a correlation coefficient
Figure 4.
Path map of canonical correlation analysis.
4.Discussion
Pregnancy is a process of immune tolerance during allogeneic transplantation. The process from embryo implantation to successful delivery largely depends on the formation of immune tolerance at the maternal – foetal interface [11, 12]. The establishment and maintenance of maternal-foetal immune balance are thought to be closely related to Th1 (IFN
4.1Role and predictive value of T cells in URSA
T cells play a key role in immune responses. According to their phenotypes, they can be divided into CD3+CD4+T cells and CD3+CD8+T cells, which are responsible for different immune effects. CD3+CD4+T-mediated cellular immunity accounts for approximately 65% of total T lymphocytes in the normal peripheral blood and increased or hyperfunction leads to enhanced maternal cellular immunity [16, 17]. Pregnancy is considered a type of allotransplantation; when cellular immunity is enhanced, the embryo is strongly rejected, resulting in pregnancy failure. CD3+CD8+T cells can inhibit B cell-mediated humoral immunity, inhibit the delayed anti-allergy response mediated by CD4+T cells, and interact with CD3+CD4+T cells to reach a relative equilibrium state [18]. Hence, the ratio of CD4+T/CD8+T cells can serve as an indicator of the body’s immune function status. During the initial phase of normal pregnancy, the number of CD8+T cells increases and the ratio of CD4+T/CD8+T decreases, which helps in preventing the maternal immune system from rejecting the embryo. Zhao et al. reported that the percentage of CD3+CD8+T cells in the peripheral blood of patients decreased significantly and the ratio of CD4+T/CD8+T increased significantly, which was reversed by effective treatment. This indicates that the ratio of CD4+T/CD8+T in the normal range is very important for maintaining pregnancy. Previous studies demonstrated no difference in the percentage levels of peripheral blood CD3+T lymphocytes and CD3+CD4+T cells in non-pregnant patients with RSA and non-pregnant women with normal fertility, whereas the increase in the percentage of CD3+CD8+T cells was significant [19]. In this study, a decrease in the ratio of CD3+T lymphocytes was observed in the URSA group compared to the control group, while no significant differences were found in the CD3+CD4+T cell subset, CD3+CD8+T cell subset, and CD4+T/CD8+T ratio between the two groups. To evaluate the predictive value of CD3+T in URSA, a ROC curve was drawn. The results showed that the area under the ROC curve of CD3+T was 0.717, the critical value for predicting URSA was 69.86%, sensitivity was 79.9%, and specificity was 62.9%, suggesting that the percentage of CD3+T can be used to predict URSA.
4.2Role and predictive value of NK cells in URSA
Peripheral NK (pNK) cells account for 10–15% of lymphocytes and are important intrinsic immune cells in the body [20]. According to the surface expression of CD56 and CD16 markers, mature human NK cells can be divided into two subsets, CD56dimCD16+ and CD56brightCD16- [21, 22], which are related to cytotoxicity and cytokine production [23]. CD56dimCD16+NK cells dominate in the peripheral blood and are rich in granulysin and perforin, which can effectively lyse cells and are highly cytotoxic [24]. NK cell parameters, including absolute numbers or proportions (%), subsets, and functional activities such as cytotoxicity or secretion of cytokines, and other factors, have been extensively investigated in patients with URSA. The increase in the proportion and killing activity of NK cells in peripheral blood are among the parameters that may predict the risk of miscarriage, and are considered causal and prognostic factors for pregnancy loss [25].
Therefore, high levels of NK cells may play an important role in RSA. Current research has demonstrated that the use of immunoglobulin as a treatment for URSA patients has been effective. Studies have compared the percentage of peripheral blood NK cells before and after treatment and found that the number and toxicity of NK cells were reduced, leading to an improved success rate of pregnancy [26]. Ebina et al. conducted a cohort study that found an association between increased activity of peripheral blood NK cells before pregnancy and RSA, with a relative risk of 3.4 and a 95% confidence interval of 1.3–8.7 [27]. The levels of NK cells in the peripheral blood of normal pregnant women were similar to those of non-pregnant women, suggesting that NK cell levels in the peripheral blood are lower during pregnancy (similar to those before pregnancy). In addition, a meta-analysis evaluating the number and proportion of NK cells in peripheral blood of women with RSA showed that the proportion of NK cells in patients with RSA was significantly higher than the control group [25].
King et al. also reported that the total number of PNK in patients who had an abortion was higher than that in normal pregnant women [7, 28]. The findings from these studies indicate a potential link between NK cell changes and pregnancy loss. It is suggested that the alteration in the number of circulating NK cells could be a primary event that plays a crucial role in the development of RSA In this study, the proportion of NK cells was significantly increased in the URSA group compared to in the normal control group, which is consistent with the results of Ly Zhu et al. [29]. To further evaluate the predictive value of NK cell ratio on URSA, we performed ROC analysis, and the results showed that the area under the ROC curve was 0.954, indicating an excellent screening effect. The Youden index was determined to be 13.51. The sensitivity and specificity at this time were 0.937 and 0.943, respectively, indicating their usefulness as predictors of URSA. By comparing the ROC curve (cut-off value, 18%) of the percentage of NK cells in the RSA group and control group, King et al. [28] suggested that the proportion of NK cells had a predictive value in evaluating patients with RSA, which is different from URSA, and thus the results of this study differ from those of the previous study.
4.3Th1 (IFNγ
Immune cells at the maternal-foetal interface mainly exert immune effects by secreting cytokines. In recent years, studies of Th1 type cytokines have increased, with the results showing that IFN-
Furthermore, the activation or inhibition of NK cells can be influenced by imbalances in the Th1/Th2 response, as an imbalance in proinflammatory and anti-inflammatory cytokines may occur. This creates an environment in which Th1 cytokines are prevalent in the periphery, which may lead to NK cell activation and proliferation. Thus, NK cells and Th1/Th2 interact and participate in the pathogenesis of abortion.
4.4Correlation between NK cells and T cells in patients with URSA
Traditionally, NK cells were thought to constitute an important part of the innate immune system. However, as studies have advanced, new roles for NK cells in adaptive immunity have been continuously revealed. pNK cells act not only as killers but also as regulators of adaptive immunity. Immune disorders in patients with URSA may be related to the regulation of multiple lymphocytes. In this study, a two-by-two analysis of the ratios of NK cells, CD3+T, and Th1 (IFN
5.Conclusion
Our results indicate that the secretion of IFN-
We found that patients with URSA have immune dysfunction reflected as changes in peripheral blood lymphocytes. The main manifestations are increases in the proportion of NK cells and Th1 and Th1/Th2 ratio and a decrease in the proportion of CD3+T cells. The proportion of NK cells and CD3+T cells appear to have a predictive value for URSA. In addition, different types of immune cells are correlated, making it difficult to accurately evaluate the immune disorder using a single index. Further studies are needed to confirm the mechanism underlying the mutual regulation of various immune cells.
Funding
This work was supported by the Guangzhou Science and Technology Plan Project (grant number: 202102080062) and the medical scientific research fund of Guangdong (grant numbers: B2021304 and A2020467).
Ethics statement
The experimental protocol was approved by the Research Ethics Committee of the Family Planning Research Institute of Guangdong Province.
Data availability statement
The data that support the findings of this study are available from the corresponding author upon reasonable request.
Conflict of interest
The authors declare that no conflict of interest could be perceived as prejudicing the impartiality of the research reported.
References
[1] | Definitions of infertility and recurrent pregnancy loss: a committee opinion. Fertility and Sterility. (2013) ; 99: (1): 63. |
[2] | El Hachem H, Crepaux V, May-Panloup P, Descamps P, Legendre G, Bouet PE. Recurrent pregnancy loss: current perspectives. International Journal of Women’s Health. (2017) ; 9: : 331-45. |
[3] | Quintero-Ronderos P, Laissue P. Genetic Variants Contributing to Early Recurrent Pregnancy Loss Etiology Identified by Sequencing Approaches. Reproductive Sciences (Thousand Oaks, Calif). (2020) ; 27: (8): 1541-52. |
[4] | Karim S, Jamal HS, Rouzi A, Ardawi MSM, Schulten HJ, Mirza Z, et al. Genomic answers for recurrent spontaneous abortion in Saudi Arabia: An array comparative genomic hybridization approach. Reproductive Biology. (2017) ; 17: (2): 133-43. |
[5] | Zwierzchowska A, Iwan A, Hyc A, Suchońska B, Malejczyk J, Barcz E. Recurrent miscarriage is associated with increased ghrelin mRNA expression in the endometrium- a case-control study. Reproductive Biology. (2018) ; 18: (1): 12-7. |
[6] | Tošić-Pajić J, Šeklić D, Radenković J, Marković S, Čukić J, Baskić D, et al. Augmented oxidative stress in infertile women with persistent chlamydial infection. Reproductive Biology. (2017) ; 17: (2): 120-5. |
[7] | Hosseini S, Zarnani AH, Asgarian-Omran H, Vahedian-Dargahi Z, Eshraghian MR, Akbarzadeh-Pasha Z, et al. Comparative analysis of NK cell subsets in menstrual and peripheral blood of patients with unexplained recurrent spontaneous abortion and fertile subjects. Journal of Reproductive Immunology. (2014) ; 103: : 9-17. |
[8] | Perricone R, Perricone C, De Carolis C, Shoenfeld Y. NK cells in autoimmunity: a two-edg’d weapon of the immune system. Autoimmunity Reviews. (2008) ; 7: (5): 384-90. |
[9] | Liu M, Zhen X, Song H, Chen J, Sun X, Li X, et al. Low-dose lymphocyte immunotherapy rebalances the peripheral blood Th1/Th2/Treg paradigm in patients with unexplained recurrent miscarriage. Reproductive Biology and Endocrinology: RB&E. (2017) ; 15: (1): 95. |
[10] | Li D, Zheng L, Zhao D, Xu Y, Wang Y. The Role of Immune Cells in Recurrent Spontaneous Abortion. Reproductive Sciences (Thousand Oaks, Calif). (2021) ; 28: (12): 3303-15. |
[11] | Hosseini S, Shokri F, Pour SA, Khoshnoodi J, Jeddi-Tehrani M, Zarnani AH. Diminished Frequency of Menstrual and Peripheral Blood NKT-Like Cells in Patients With Unexplained Recurrent Spontaneous Abortion and Infertile Women. Reproductive Sciences (Thousand Oaks, Calif). (2019) ; 26: (1): 97-108. |
[12] | Prado-Drayer A, Teppa J, Sánchez P, Camejo MI. Immunophenotype of peripheral T lymphocytes, NK cells and expression of CD69 activation marker in patients with recurrent spontaneous abortions, during the mid-luteal phase. American Journal of Reproductive Immunology (New York, NY: 1989). (2008) ; 60: (1): 66-74. |
[13] | Chaouat G. Innately moving away from the Th1/Th2 paradigm in pregnancy. Clinical and Experimental Immunology. (2003) ; 131: (3): 393-5. |
[14] | Piccinni MP, Beloni L, Livi C, Maggi E, Scarselli G, Romagnani S. Defective production of both leukemia inhibitory factor and type 2 T-helper cytokines by decidual T cells in unexplained recurrent abortions. Nature Medicine. (1998) ; 4: (9): 1020-4. |
[15] | De Carolis C, Perricone C, Perricone R. NK cells, autoantibodies, and immunologic infertility: a complex interplay. Clinical Reviews in Allergy & Immunology. (2010) ; 39: (3): 166-75. |
[16] | Triggianese P, Perricone C, Chimenti MS, De Carolis C, Perricone R. Innate Immune System at the Maternal-Fetal Interface: Mechanisms of Disease and Targets of Therapy in Pregnancy Syndromes. American Journal of Reproductive Immunology (New York, NY: 1989). (2016) ; 76: (4): 245-57. |
[17] | Ali SB, Jeelall Y, Pennell CE, Hart R, McLean-Tooke A, Lucas M. The role of immunological testing and intervention in reproductive medicine: A fertile collaboration? American Journal of Reproductive Immunology (New York, NY: 1989). (2018) ; 79: (3). |
[18] | Christiansen OB, Nielsen HS, Pedersen B. Active or passive immunization in unexplained recurrent miscarriage. Journal of Reproductive Immunology. (2004) ; 62: (1-2): 41-52. |
[19] | Ghafourian M, Abuhamidy A, Karami N. Increase of peripheral blood TCD8+ cells in women with recurrent miscarriage. Journal of Obstetrics and Gynaecology: The Journal of the Institute of Obstetrics and Gynaecology. (2014) ; 34: (1): 36-9. |
[20] | Jabrane-Ferrat N, Siewiera J. The up side of decidual natural killer cells: new developments in immunology of pregnancy. Immunology. (2014) ; 141: (4): 490-7. |
[21] | Fang F, Xiao W, Tian Z. NK cell-based immunotherapy for cancer. Seminars in Immunology. (2017) ; 31: : 37-54. |
[22] | Park DW, Lee HJ, Park CW, Hong SR, Kwak-Kim J, Yang KM. Peripheral blood NK cells reflect changes in decidual NK cells in women with recurrent miscarriages. American Journal of Reproductive Immunology (New York, NY: 1989). (2010) ; 63: (2): 173-80. |
[23] | Bulmer JN, Lash GE. The Role of Uterine NK Cells in Normal Reproduction and Reproductive Disorders. Advances in Experimental Medicine and Biology. (2015) ; 868: : 95-126. |
[24] | Seshadri S, Sunkara SK. Natural killer cells in female infertility and recurrent miscarriage: a systematic review and meta-analysis. Human Reproduction Update. (2014) ; 20: (3): 429-38. |
[25] | Perricone C, De Carolis C, Giacomelli R, Zaccari G, Cipriani P, Bizzi E, et al. High levels of NK cells in the peripheral blood of patients affected with anti-phospholipid syndrome and recurrent spontaneous abortion: a potential new hypothesis. Rheumatology (Oxford, England). (2007) ; 46: (10): 1574-8. |
[26] | Ahmadi M, Abdolmohammadi-Vahid S, Ghaebi M, Aghebati-Maleki L, Afkham A, Danaii S, et al. Effect of Intravenous immunoglobulin on Th1 and Th2 lymphocytes and improvement of pregnancy outcome in recurrent pregnancy loss (RPL). Biomedicine & Pharmacotherapy = Biomedecine & Pharmacotherapie. (2017) ; 92: : 1095-102. |
[27] | Ebina Y, Nishino Y, Deguchi M, Maesawa Y, Nakashima Y, Yamada H. Natural killer cell activity in women with recurrent miscarriage: Etiology and pregnancy outcome. Journal of Reproductive Immunology. (2017) ; 120: : 42-7. |
[28] | King K, Smith S, Chapman M, Sacks G. Detailed analysis of peripheral blood natural killer (NK) cells in women with recurrent miscarriage. Human Reproduction (Oxford, England). (2010) ; 25: (1): 52-8. |
[29] | Zhu LY, Chen X, Xu ZZ, Xu L, Mao T, Zhang H. Changes and clinical significance of peripheral blood helper T lymphocyte and natural killer (NK) cells in unexplained recurrent spontaneous abortion (URSA) patients after abortion and successful pregnancy. Clinical and Experimental Obstetrics & Gynecology. (2015) ; 42: (1): 62-6. |
[30] | Chaouat G, Zourbas S, Ostojic S, Lappree-Delage G, Dubanchet S, Ledee N, et al. A brief review of recent data on some cytokine expressions at the materno-foetal interface which might challenge the classical Th1/Th2 dichotomy. Journal of Reproductive Immunology. (2002) ; 53: (1-2): 241-56. |
[31] | Abdolmohammadi Vahid S, Ghaebi M, Ahmadi M, Nouri M, Danaei S, Aghebati-Maleki L, et al. Altered T-cell subpopulations in recurrent pregnancy loss patients with cellular immune abnormalities. Journal of Cellular Physiology. (2019) ; 234: (4): 4924-33. |
[32] | Schuster IS, Coudert JD, Andoniou CE, Degli-Esposti MA. “Natural Regulators”: NK Cells as Modulators of T Cell Immunity. Frontiers in Immunology. (2016) ; 7: : 235. |
[33] | Crome SQ, Lang PA, Lang KS, Ohashi PS. Natural killer cells regulate diverse T cell responses. Trends in Immunology. (2013) ; 34: (7): 342-9. |
[34] | Tu MM, Mahmoud AB, Makrigiannis AP. Licensed and Unlicensed NK Cells: Differential Roles in Cancer and Viral Control. Frontiers in Immunology. (2016) ; 7: : 166. |
[35] | Lanier LL. Evolutionary struggles between NK cells and viruses. Nature Reviews Immunology. (2008) ; 8: (4): 259-68. |
[36] | Moretta A, Marcenaro E, Sivori S, Della Chiesa M, Vitale M, Moretta L. Early liaisons between cells of the innate immune system in inflamed peripheral tissues. Trends in Immunology. (2005) ; 26: (12): 668-75. |
[37] | Walzer T, Dalod M, Robbins SH, Zitvogel L, Vivier E. Natural-killer cells and dendritic cells: “l’union fait la force”. Blood. (2005) ; 106: (7): 2252-8. |
[38] | Fort MM, Leach MW, Rennick DM. A role for NK cells as regulators of CD4+ T cells in a transfer model of colitis. Journal of Immunology (Baltimore, Md: 1950). (1998) ; 161: (7): 3256-61. |
[39] | Vankayalapati R, Klucar P, Wizel B, Weis SE, Samten B, Safi H, et al. NK cells regulate CD8+T cell effector function in response to an intracellular pathogen. Journal of Immunology (Baltimore, Md: 1950). (2004) ; 172: (1): 130-7. |
[40] | Pallmer K, Oxenius A. Recognition and Regulation of T Cells by NK Cells. Frontiers in Immunology. (2016) ; 7: : 251. |
[41] | De Rose V, Cappello P, Sorbello V, Ceccarini B, Gani F, Bosticardo M, et al. IFN-gamma inhibits the proliferation of allergen-activated T lymphocytes from atopic, asthmatic patients by inducing Fas/FasL-mediated apoptosis. Journal of Leukocyte Biology. (2004) ; 76: (2): 423-32. |
[42] | Zhu J, Paul WE. CD4 T cells: fates, functions, and faults. Blood. (2008) ; 112: (5): 1557-69. |
[43] | Lee SH, Kim KS, Fodil-Cornu N, Vidal SM, Biron CA. Activating receptors promote NK cell expansion for maintenance, IL-10 production, and CD8 T cell regulation during viral infection. The Journal of Experimental Medicine. (2009) ; 206: (10): 2235-51. |
[44] | Deniz G, Erten G, Kücüksezer UC, Kocacik D, Karagiannidis C, Aktas E, et al. Regulatory NK cells suppress antigen-specific T cell responses. Journal of Immunology (Baltimore, Md: 1950). (2008) ; 180: (2): 850-7. |
[45] | Mandal A, Viswanathan C. Natural killer cells: In health and disease. Hematology/Oncology and Stem Cell Therapy. (2015) ; 8: (2): 47-55. |
[46] | Waggoner SN, Cornberg M, Selin LK, Welsh RM. Natural killer cells act as rheostats modulating antiviral T cells. Nature. (2011) ; 481: (7381): 394-8. |
[47] | Lang PA, Lang KS, Xu HC, Grusdat M, Parish IA, Recher M, et al. Natural killer cell activation enhances immune pathology and promotes chronic infection by limiting CD8+T-cell immunity. Proceedings of the National Academy of Sciences of the United States of America. (2012) ; 109: (4): 1210-5. |


