
Comparison of cell subsets in chronic obstructive pulmonary disease and controls based on single-cell transcriptome sequencing
Abstract
BACKGROUND:
Currently, chronic obstructive pulmonary disease (COPD) significantly impacts patients’ quality of life and survival as it has a high morbidity and mortality rate. COPD progression is associated with infiltration of adaptive inflammatory immune cells that form lymphatic follicles into the lung.
OBJECTIVE:
The rapid development of single-cell RNA sequencing technology (scRNA-seq) provided us with powerful tools for studying the classification of cell subtypes. Additionally, it is known that COPD is closely related to the abnormal function of long-chain non-coding RNAs (lncRNAs), and scRNA-seq can help to study the expression of lncRNA from a single cell level.
METHODS:
We reanalyzed the scRNA-seq data of peripheral blood mononuclear cells of COPD patients downloaded from Gene Expression Omnibus (GEO) database, and performed the mRNA-based and lncRNA-based single cell clustering to compare the cell subsets in COPD and controls without COPD. Furthermore, we performed Gene Ontology (GO) enrichment analysis for the top ranked differentially expressed genes and target genes of differentially expressed lncRNAs in different cell subtypes for COPD and controls respectively.
RESULTS:
Differences in cell subtypes were found between COPD and controls.
CONCLUSION:
This study may help us to further understand the mechanism of the human adaptive immune cell response of COPD.
1.Introduction
Currently, chronic obstructive pulmonary disease (COPD) is still the main cause of incidence rate and mortality, which seriously affects the quality of life and survival of patients [1]. Although smoking is the main potential cause of COPD, only a small number of chronic and severe smokers develop symptomatic COPD [2]. In the lower airways, COPD is characterized by an abnormal immune response and its progression is related to the infiltration of innate and adaptive inflammatory immune cells, which form lymphoid follicles and enter the lung [3]. More and more evidence shows that cellular- and antibody-mediated autoimmunity plays an important role in the pathogenesis of stable COPD [4]. Therefore, the potential role of autoimmune reaction in the pathogenesis of exacerbation of COPD is still under study. As a heterogeneous disease, the epithelial and immune cells contribute to their potential effects in different clinical phenotypes of COPD. Pulmonary inflammation of COPD is characterized by both innate and adaptive immune responses; However, their roles in the pathogenesis of COPD are unclear. T lymphocytes are one of the main kinds of immune cells that mediate adaptive cellular immune responses. It is reported that T/B lymphocytes and group 2 innate lymphoid cells (ILC2s) play a role in airway collagen deposition/fibrosis in experimental COPD, but not in inflammation [5]. The cytotoxic lymphocytes in the airways of COPD patients were observed increase and a recent study reported that the increase in the proportion of Natural Killer (NK) cells in BAL fluid were associated with COPD. Interestingly, the percentage of NK cells in COPD subjects who quit smoking did not normalize, indicating that even after quitting smoking, these cells may play a role in the continuous disease progression of COPD [6].
Currently, the rapid development of single-cell RNA sequencing technology (scRNA-seq) provided us with powerful tools for studying the classification of cells and help understanding the heterogeneity at the cell-type level [7]. In addition, it is known that COPD are closely related to the abnormal function of long-chain non-coding RNAs (lncRNAs) [8]. Recent evidence suggested that lncRNAs play fundamental roles in immune regulation [9]. The scRNA-seq will help to study the expression of lncRNAs from a single cell level.
In this study, we reanalyzed the scRNA-seq data obtained from peripheral blood mononuclear cells of COPD patients, which were downloaded from GEO database. We performed the mRNA-based and lncRNA-based single cell clustering to compare cell subsets in COPD and controls without COPD. Based on mRNAs, cells were clustered into 13 and 19 subtypes for COPD and controls respectively. Based on the heterogeneity of lncRNAs, cells were clustered into 8 and 11 subtypes for COPD and controls respectively. Further analysis of the differentially expressed mRNAs and lncRNAs between different cell subtypes combining with the lncRNA-target gene information revealed the potential differences in cell subtypes between COPD and controls. Furthermore, we performed the GO enrichment analysis for the top ranked differentially expressed genes and target genes of differentially expressed lncRNAs for COPD and controls respectively, and the function differences of cell subtypes were also observed. However, when cells were clustered by lncRNAs, we found that there was no significant demarcation between of cell subsets, indicating some of their continuity and consistency. This study may help us to further understand the mechanism of the human adaptive immune cell response of COPD.
2.Materials and methods
2.1Data download
The data was downloaded from the GEO database (https://www.ncbi.nlm.nih.gov/gds/), and the accession ID is GSE130148 [10]. The transcripts per million (TPM) format data were selected. The lung tissues of 4 subjects were included: one is COPD patient and the other three were controls without COPD. The sing cell sequence data were obtained from 4 Illumina HiSeq 4000 (Homo sapiens), and the number of total cells is 10,360. The detailed information of these four subjects is shown in Table 1.
Table 1
The detailed information of four subjects
| ID | Gender | Age | Smoker | Segment | COPD | The number of cells |
|---|---|---|---|---|---|---|
| Muc3843 | Male | 62 | Yes, | Lower lobe, left | COPD Gold II | 2189 |
| Muc4658 | Male | 58 | Yes, 45 py | Upper lobe, left | No | 3314 |
| Muc5103 | Male | 58 | No | Main brochus | No | 2485 |
| Muc5104 | Male | 69 | Yes, | Upper lobe, left | No | 2372 |
2.2Extraction of lncRNAs expression matrix
We applied GENCODE annotation. [11] to extract lncRNAs expression matrix. In GENCODE annotation, the genes with gene_type of “lincRNA” were selected, and the corresponding expression matrix was extracted.
2.3Data processing
2.3.1Determine the number threshold of mRNAs and lncRNAs
Here, the quality control (QC) to filter cell indicators includes the following points: (1) Consider the low-quality cells usually contain only a small number of genes, we need determine the number of individual genes detected in the cell. (2) In order to set an appropriate number threshold, we need to observe the number of independent genes detected by cells and the total amount of expression for mRNAs or lncRNAs detected in the cell. Here, the numbers of total expression of mRNAs for COPD and controls are all more than 3000, and therefore the number threshold of mRNAs is determined as 3000. The numbers of total expression of lncRNAs for COPD and controls are all more than 40, and therefore the number threshold of lncRNAs is determined as 40.
2.3.2The data normalization
The mRNAs and lncRNAs expression of each cell were normalized. The global scale standardization method named “lognormalize” is used. This method standardizes the characteristic mRNAs and lncRNAs expression of each cell by the total expression and multiplies it by a scaling factor (10000 by default), and the log transformation is then performed [12].
2.3.3Identification of highly variable features (mRNAs or lncRNAs)
Next, we identified a series of highly variable features (mRNAs or lncRNAs) between cells. These features are highly expressed in some cells whereas displayed the low expression in other cells, and the standard deviation of their expression is relatively large. It is implemented with findvariablefeatures function in Seurat package of R software (https://www.r-project.org/). Some features will be used for downstream analysis, such as Principal Component Analysis (PCA).
2.3.4Data scaling
We performed linear transformation for data scaling, which is a standard method before dimension reduction such as PCA. We used the scaledata function in Seurat to scale the expression of each feature so that the average expression and the variance of this feature between cells is 0 and 1. This process gives each highly variable feature in the downstream analysis the same weight with other features so that the highly expressed features do not show their dominate effect.
2.4Cell clusters
2.4.1Linear dimension reduction
In the present study, PCA is used for linear dimensionality reduction. The principal components (PC) ranking the top can show the robustness of the data set. The jackstrawplot function in Seurat was used to compare the p-value distribution of each PC with a uniform distribution, which determines the importance of each PC. For mRNAs datasets of COPD and controls, we found that p-values increased stable after the first 10 PCs, and the obvious turning points can be observed around the 9–10 PC. This indicates that the first 10 PC can represent most of the information of the data set; we thus selected the first 10 PC for further analysis. For lncRNAs datasets of COPD and controls, p-values increased significantly after the first 5 PCs which means the importance decreased significantly, and the first 5 PC was thus selected.
2.4.2Cell clusters and differentially expressed markers identification
The nonlinear dimensionality reduction method named t-distributed Stochastic Neighborhood Embedding (
2.5GO Enrichment analysis
For the mRNAs datasets, in the comparison between each specified cluster and other clusters, the top 10 ranked differentially expressed mRNAs were selected. We performed the GO enrichment analysis for all of these genes. For lncRNAs datasets, we extracted all of differentially expressed lncRNAs in the comparison between each specified cluster and other clusters, and performed GO enrichment analysis for the target genes of these lncRNAs. The GO enrichment was performed for COPD and controls respectively. The target genes of lncRNAs were obtained from LncRNA2Target database [14] and
2.6Identification of potential cell–cell interaction networks
For the most significant differentially expressed gene in the comparison between each specified cluster and other clusters of COPD and controls, we applied CellPhoneDB (https://www.cellphonedb.org/) database to construct the molecular interaction networks among the cell subtypes. CellPhoneDB [15] is a Python-based computational analysis tool which can perform the cell-cell communication at the molecular level, and can construct the molecular interaction networks among the cell subtypes. We then combined with the CellMarker database which can map the genes to the corresponding cell subtypes to get the cell-cell interaction networks. The Cytoscape software [16] was used to visualize the networks.
2.7Pseudotime analysis
To further infer differentiation trajectories of cell subsets in COPD and controls, we performed the pseudotime analysis for four subjects respectively. The algorithm is used to learn the expression patterns of all genes to arrange each cell to its own development track. The calculation process includes choosing genes that define a cell’s progress, reducing data dimensionality and ordering cells along the trajectory. We applied monocle 2 package of R software to perform the pseudotime analysis.
2.8Immune infiltration analysis
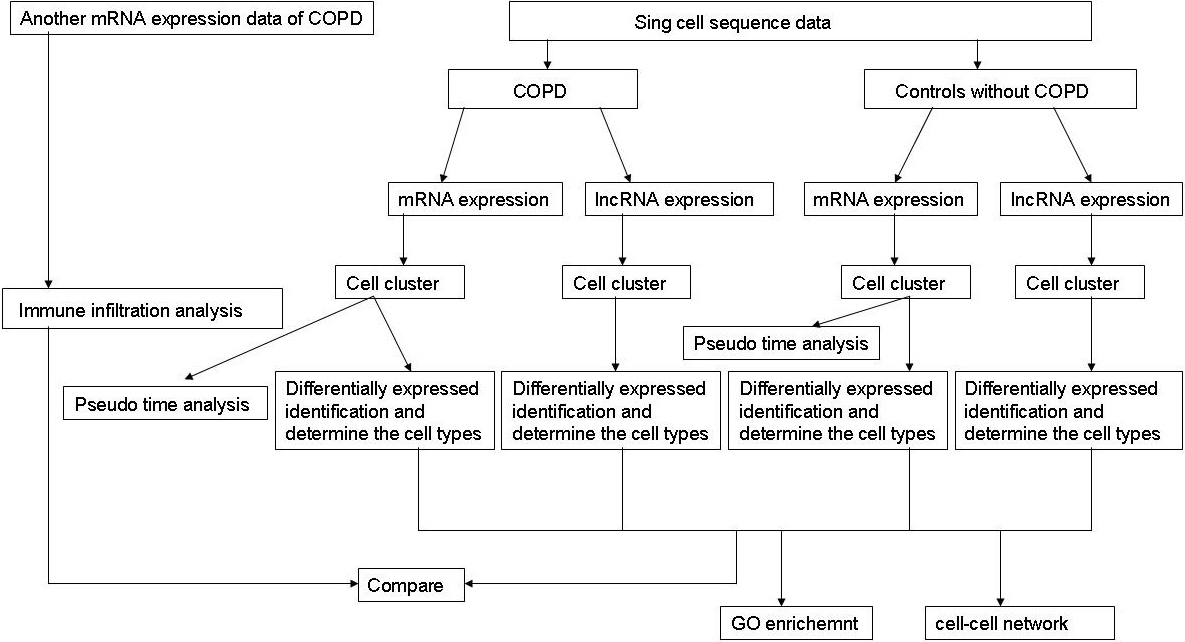
To evaluate the identified cell clusters, we used TIMER (https://cistrome.shinyapps.io/timer/) to estimate the infiltration abundance of the six immune cells (B cells, CD4+ T cells, CD8+ T cells, Neutrphils cells, Macrophages cells and Dendirtic cells). Expression matrix was constructed using the differentially expressed genes obtained from another COPD expression profile data (GSM28386, platform: GPL96 [Hg-U133A]) which includes 22,283 genes from 18 COPD patients and 12 normal controls. We calculated and compared the relative abundance of each cell cluster. The student-t test was performed to validate whether the relative abundance of the cell clusters was different between COPD and normal controls, and these results were compared with the identified cell clusters by scRNA-seq data analysis The flowchart of our work is shown in Fig. 1.
Figure 1.
The flowchart of our work.
3.Results
3.1Cell clusters based on mRNAs datasets and lncRNAs datasets
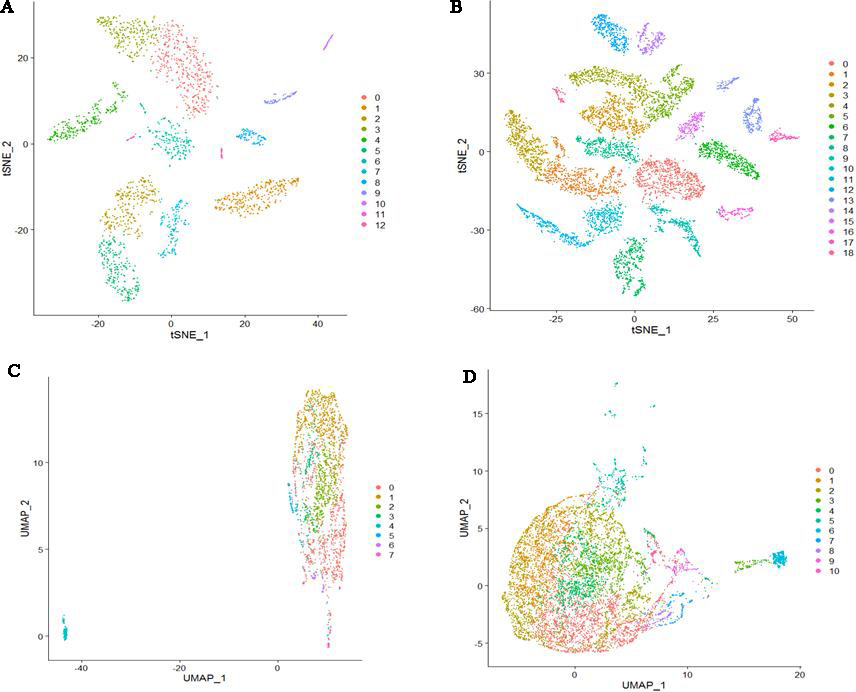
For mRNAs datasets, cells were clustered into 13 clusters (0–12) and 19 clusters (0–18) for COPD and controls respectively (Fig. 2A and B). For lncRNAs datasets, cells were clustered into 8 clusters (0–7) and 11 clusters (0–10) for COPD and controls respectively (Fig. 2C and D). We can see that there was clear classification for clustered cell subtypes based on mRNAs datasets. However, there were no clear boundaries for clustered cell subtypes based on lncRNAs datasets.
Figure 2.
Cell clusters based on four datasets. (A) Cells were clustered into 13 clusters based on COPD mRNAs dataset (B) Cells were clustered into 19 clusters based on mRNAs dataset of controls. (C) Cells were clustered into 8 clusters based on COPD lncRNAs dataset (D) Cells were clustered into 11 clusters based on lncRNAs dataset of controls.
3.2Comparison of cell subsets in COPD and controls based on mRNAs datasets
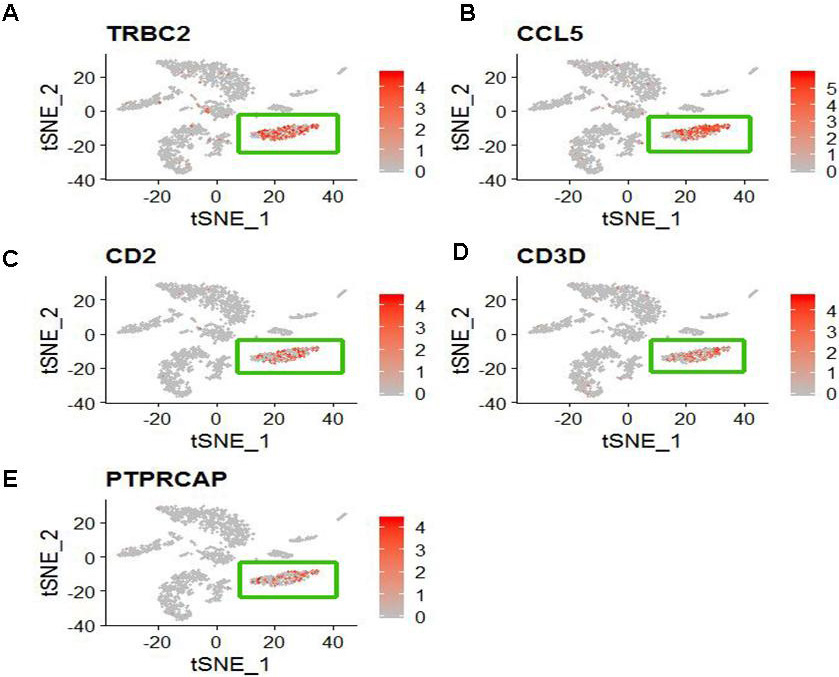
We identified differentially expressed genes between the specified cell clusters with the other cell clusters. Then we applied CellMarker web tool and user-friendly web portal (www.lungcellatlas.org) to mapping marker genes into cell subtypes. According to the top five ranked differentially expressed genes distinguishing each cluster from other clusters, we identified some cell subtypes. For COPD patient, CD8+ T cell characterized by high expression of TRBC2, CCL5, CD2, CD3D and PTPRCAP (Fig. 3). FOXN4+ cell characterized by high expression of MARCO. SLC16A7+ cell characterized by high expression of AGER. Oligdendrocyte cell characterized by high expression of XIST and NME1. Ionocyte cell characterized by high expression of FGL2, MARCKS and MS4A6A. Microglial cell characterized by high expression of GNG11, CLDN5, MMRN1, TFF3 and IGFBP7. Ciliated cell characterized by high expression of RSPH1, C20orf85, PIFO, C9orf24 and C11orf88. Mast cell characterized by high expression of TPSD1, TPSAB1, CPA3, SLC18A2 and RGS13. Delta cell characterized by high expression of TFPI2, CCDC80, PLA2G2A, PRG4 and RP11-572C15.6. However, other marker genes did not identify a unique cell population.
Figure 3.
The distribution of five specific high expression genes in CD8+ T cell (The cluster 1). (A) TRBC2 (B) CCL5 (C) CD2 (D) CD3D and (E) PTPRCAP.
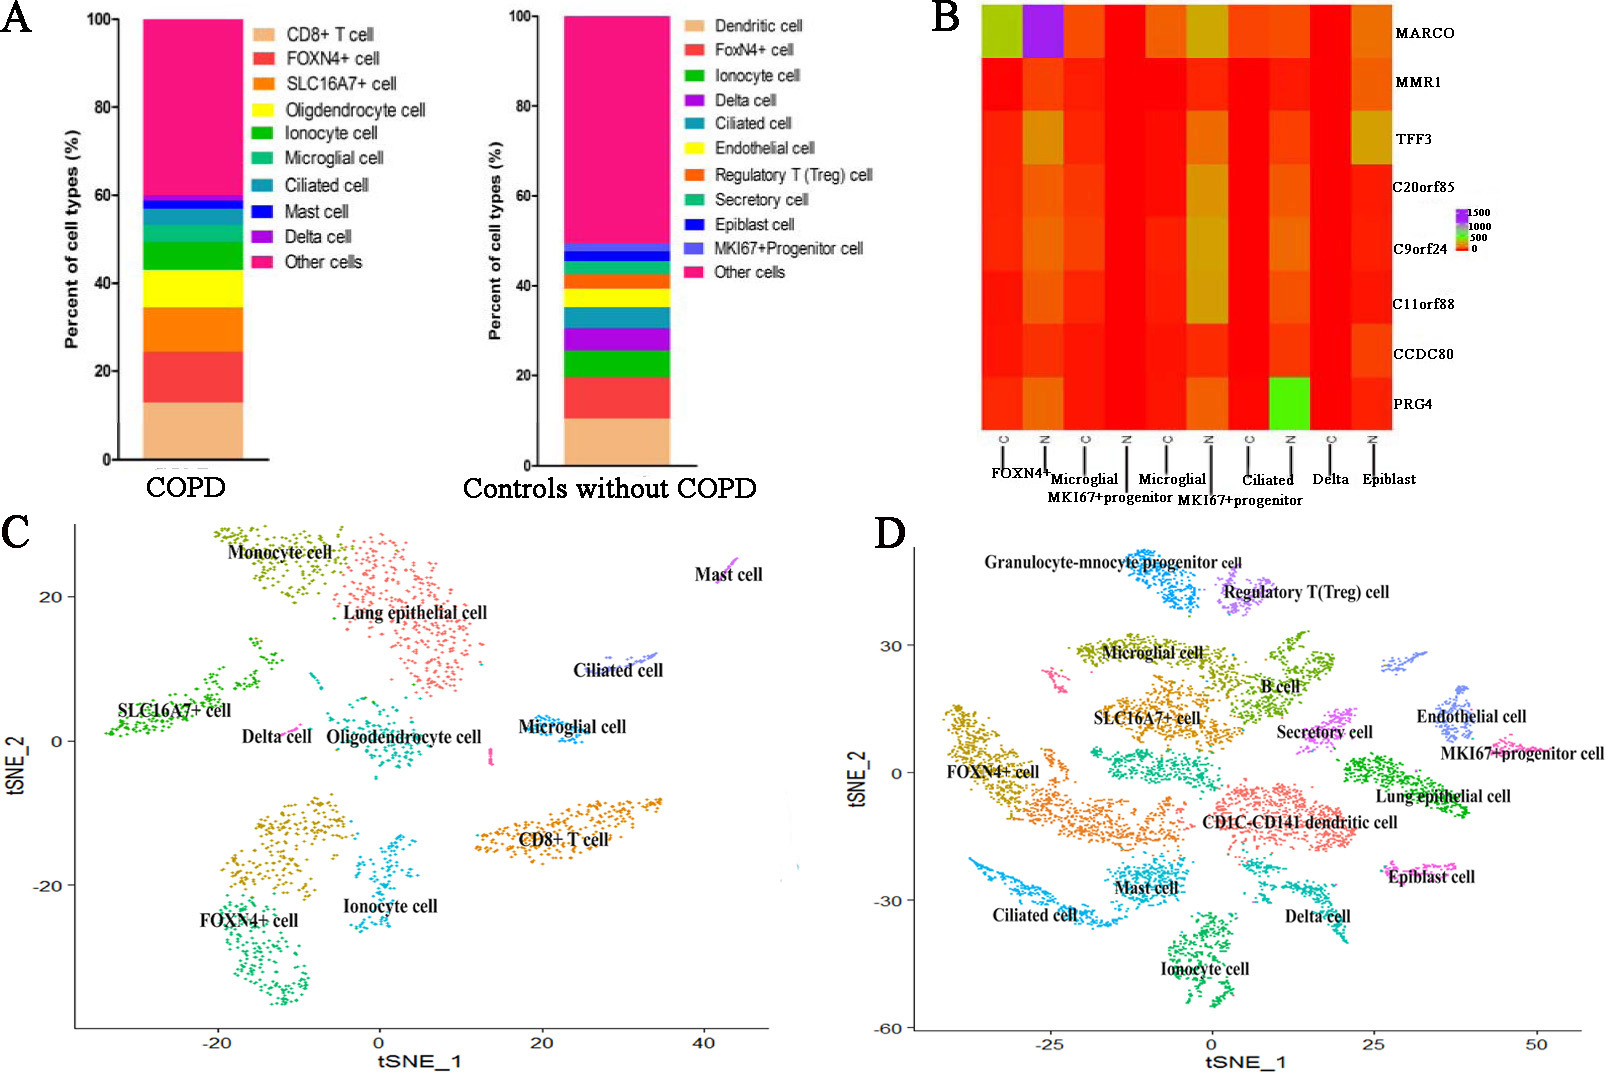
For cell clusters of controls, CD1C-CD141 dendritic cell characterized by high expression of APOBEC3A and CD300E. SLC16A7+ cell characterized by high expression of NAMPTL and TRAC (Fig. 4A and B). FOXN4+ cell characterized by high expression of MARCO. Ionocyte cell characterized by high expression of FMO2. Ciliated cell characterized by high expression of RSPH1, C20orf85, PIFO, C9orf24 and C11orf88. Delta cell characterized by high expression of PRG4 (Fig. 4C and D). Endothelial cell characterized by high expression of FAM107A. Regulatory T (Treg) cell characterized by high expression of IL2RA. Secretory cell characterized by high expression of SLC6A14 Epiblast cell characterized by high expression of DCN, COL1A2, CCDC80, ADH1B and FBLN1. MKI67+ progenitor cell characterized by high expression of CCL21, TFF3, LYVE1, MMRN1 and ECSCR. However, other marker genes did not identify a unique cell population. The comparison of cell subtypes between COPD and controls is shown in Fig. 5. From Fig. 5A, we can see that the proportion of Delta cell is lower in COPD than in controls. Figure 5B displays the heatmap of major marker genes and the corresponding cell subtypes for COPD and controls. Figure 5C and D show the cell subtypes recognized based on CellMarker database for COPD and controls respectively.
Figure 4.
The expression and distribution of high expressed genes in specified cell clusters. (A) The expression level of TRAC in different cell clusters. (B) The expression distribution of TRAC in SLC16A7+ cell (The cluster 2). (C) The expression level of PRG4 in different cell clusters. (D) The expression distribution of PRG4 in Delta cell (The cluster 9).

Figure 5.
The comparison of cell subtypes between COPD and controls. (A) The proportion distribution of different cell subtypes in COPD and controls. (B) The heatmap of major marker genes and the corresponding cell subtypes between COPD and controls. Meanwhile, C indicates COPD patient whereas N indicates controls. (C) The clustered cell subtypes recognized based on CellMarker database for COPD. (D) The clustered cell subtypes recognized based on CellMarker database for controls.
3.3Comparison of cell subsets in COPD and controls based on lncRNAs datasets
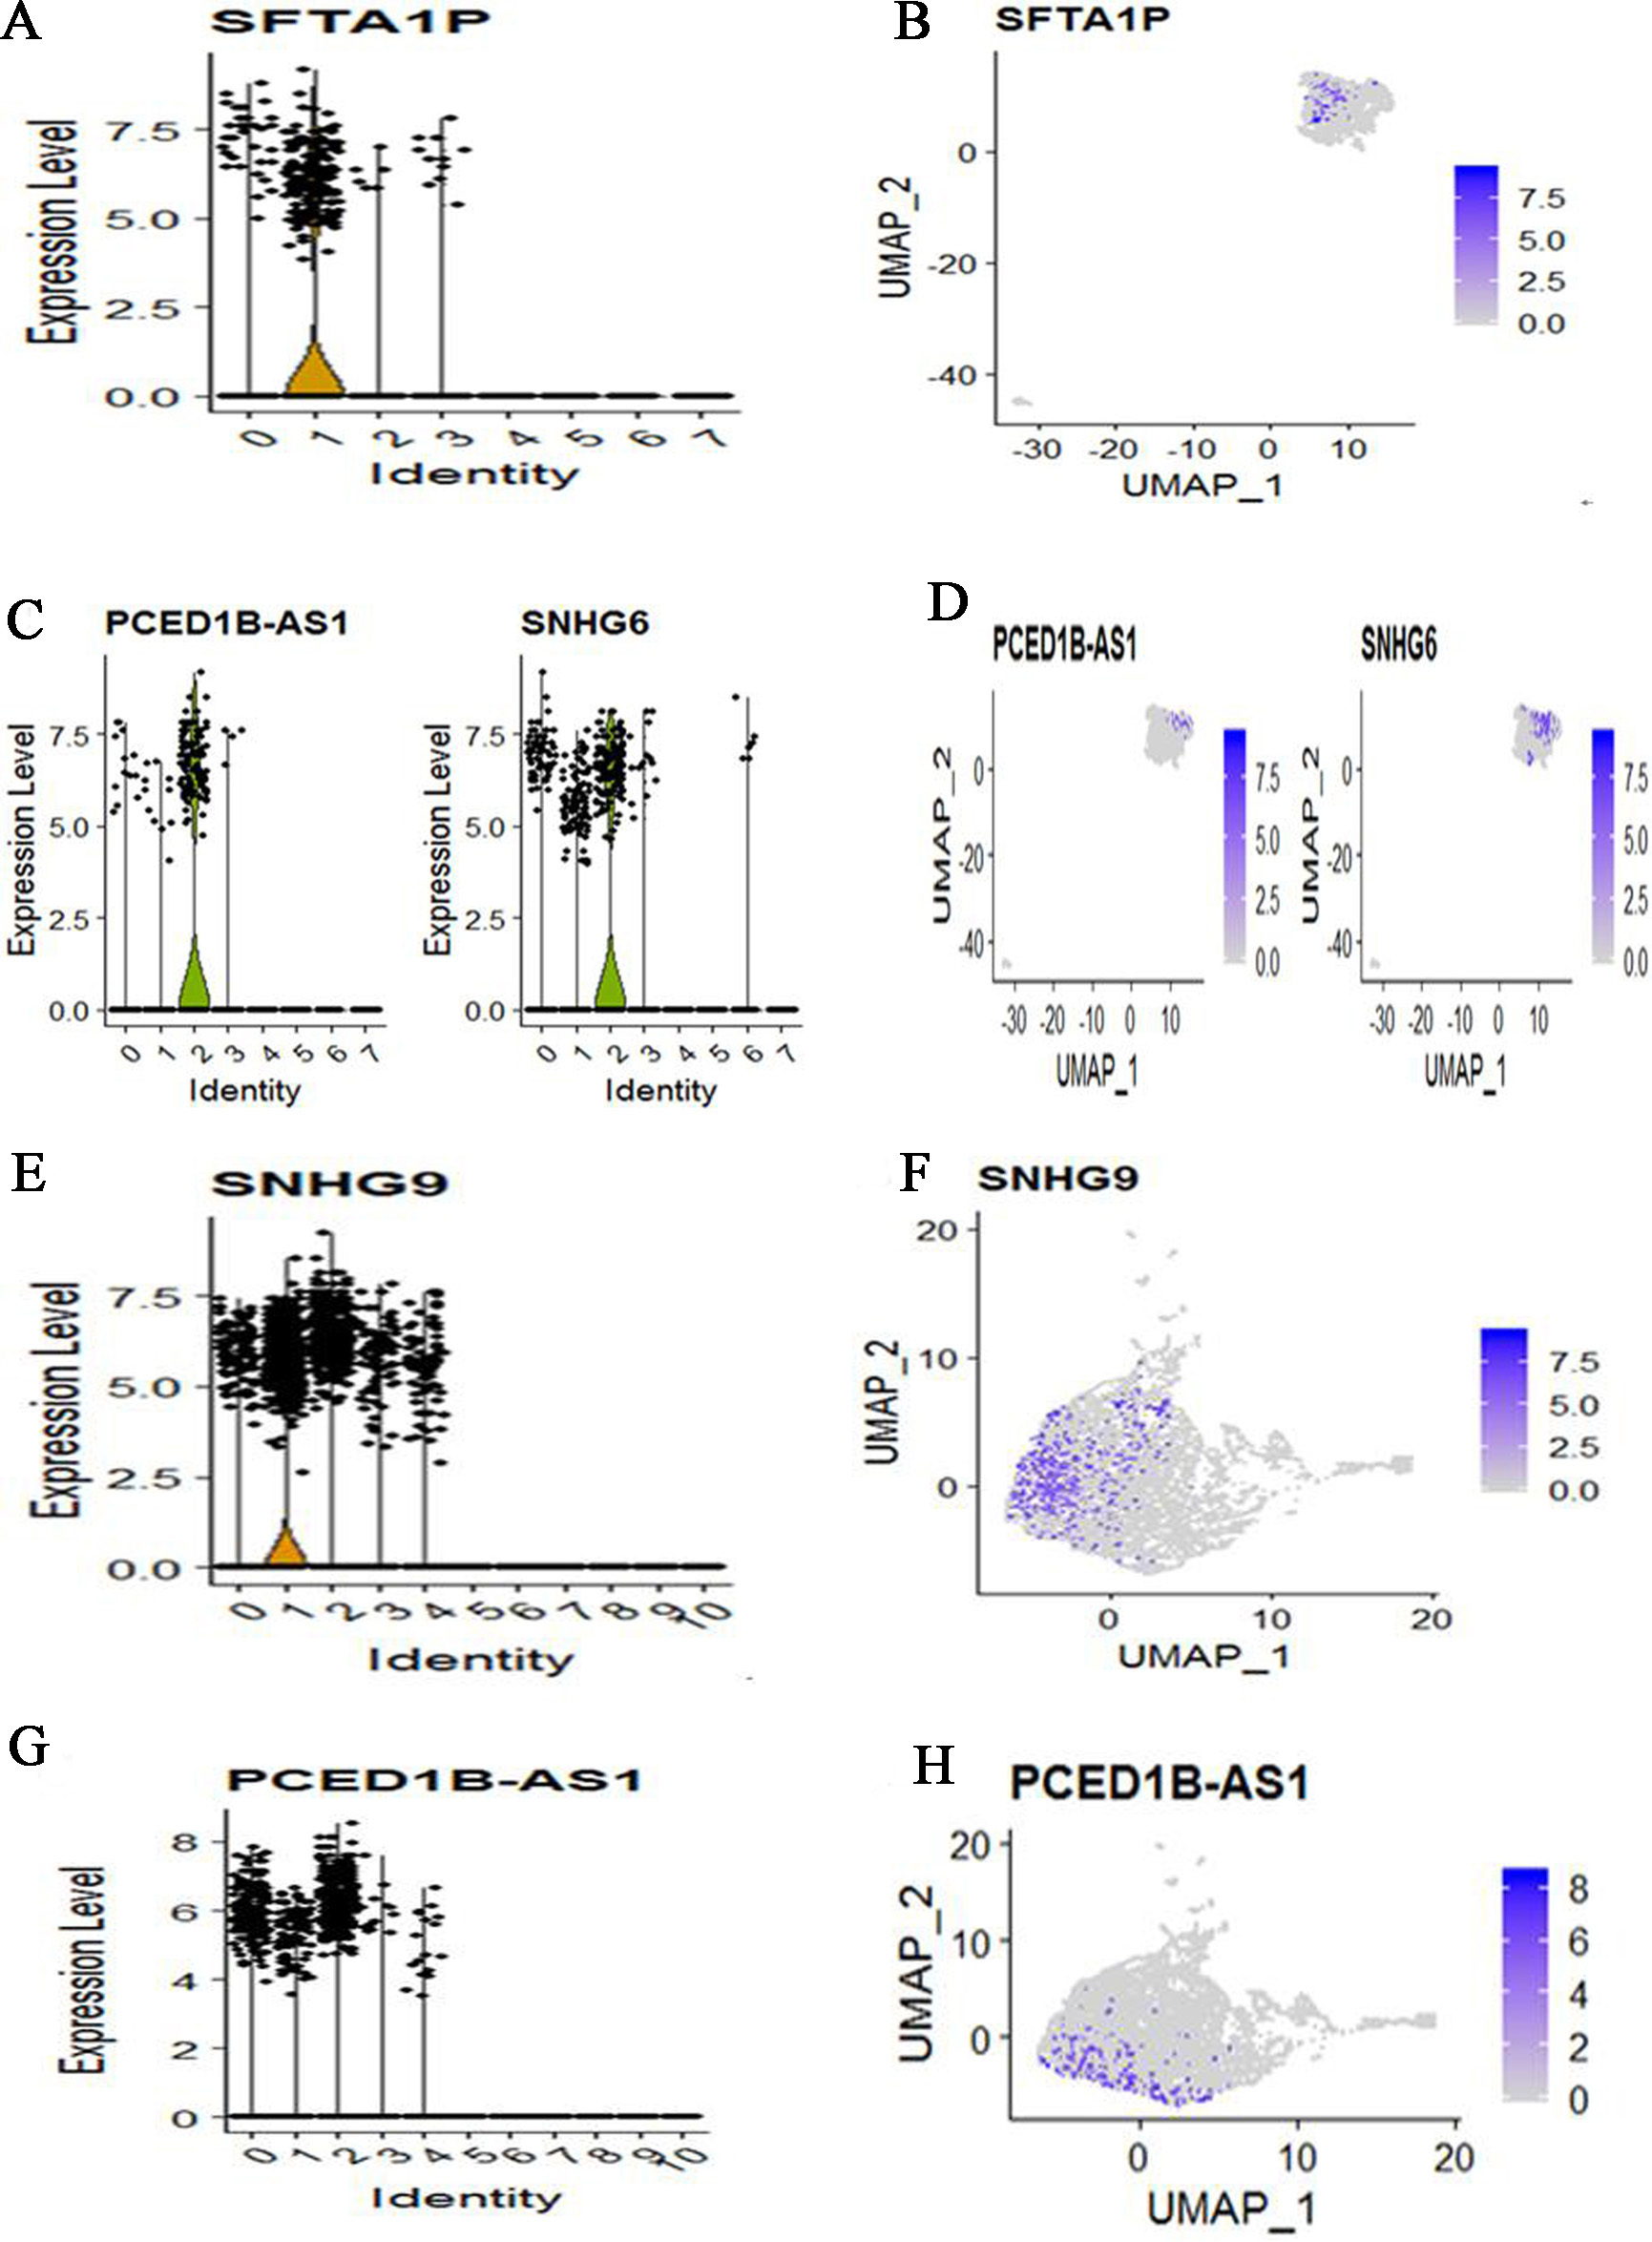
We also applied CellMarker web tool to mapping marker lnRNAs into cell subtypes. For COPD patient, cells were clustered into 8 subtypes based on lncRNAs dataset. Meanwhile, lung epithelial cell characterized by high expression of SFTA1P (Fig. 6A and B). SLC16A7+ cell characterized by high expression of PCED1B-AS1 and SNHG6 (Fig. 6C and D). Other marker lncRNAs did not identify a unique cell population. For three control subjects, cells were clustered into 11 subtypes based on lncRNAs dataset. Meanwhile, Natural killer T (NKT) cell characterized by high expression of SNHG9 (Fig. 6E and F). SLC16A7+ cell characterized by high expression of PCED1B-AS1 (Fig. 6G and H). Other marker lncRNAs did not identify a unique cell population. Compare COPD with controls, we found that the identified cell subtypes all include SLC16A7+ cell. The two different cell subtypes are lung epithelial cell for COPD and Natural killer T cell for controls.
Figure 6.
The expression and distribution of high expression lncRNAs in specified cell clusters. (A) The expression level of SFTA1P in different cell clusters. (B) The expression distribution of SFTA1P in lung epithelial cell (The cluster 1). (C) The expression level of PCED1B-AS1 and SNHG6 in different cell clusters. (D) The expression distribution of PCED1B-AS1 and SNHG6 in SLC16A7+ cell (The cluster 2). (E) The expression level of SNHG9 in different cell clusters. (F) The expression distribution of SNHG9 in Natural killer T (NKT) cell (The cluster 1). (G) The expression level of PCED1B-AS1 in different cell clusters. (H) The expression distribution of PCED1B-AS1 in SLC16A7+ cell (The cluster 0, cluster 1 and cluster 2).
3.4GO enrichment analysis
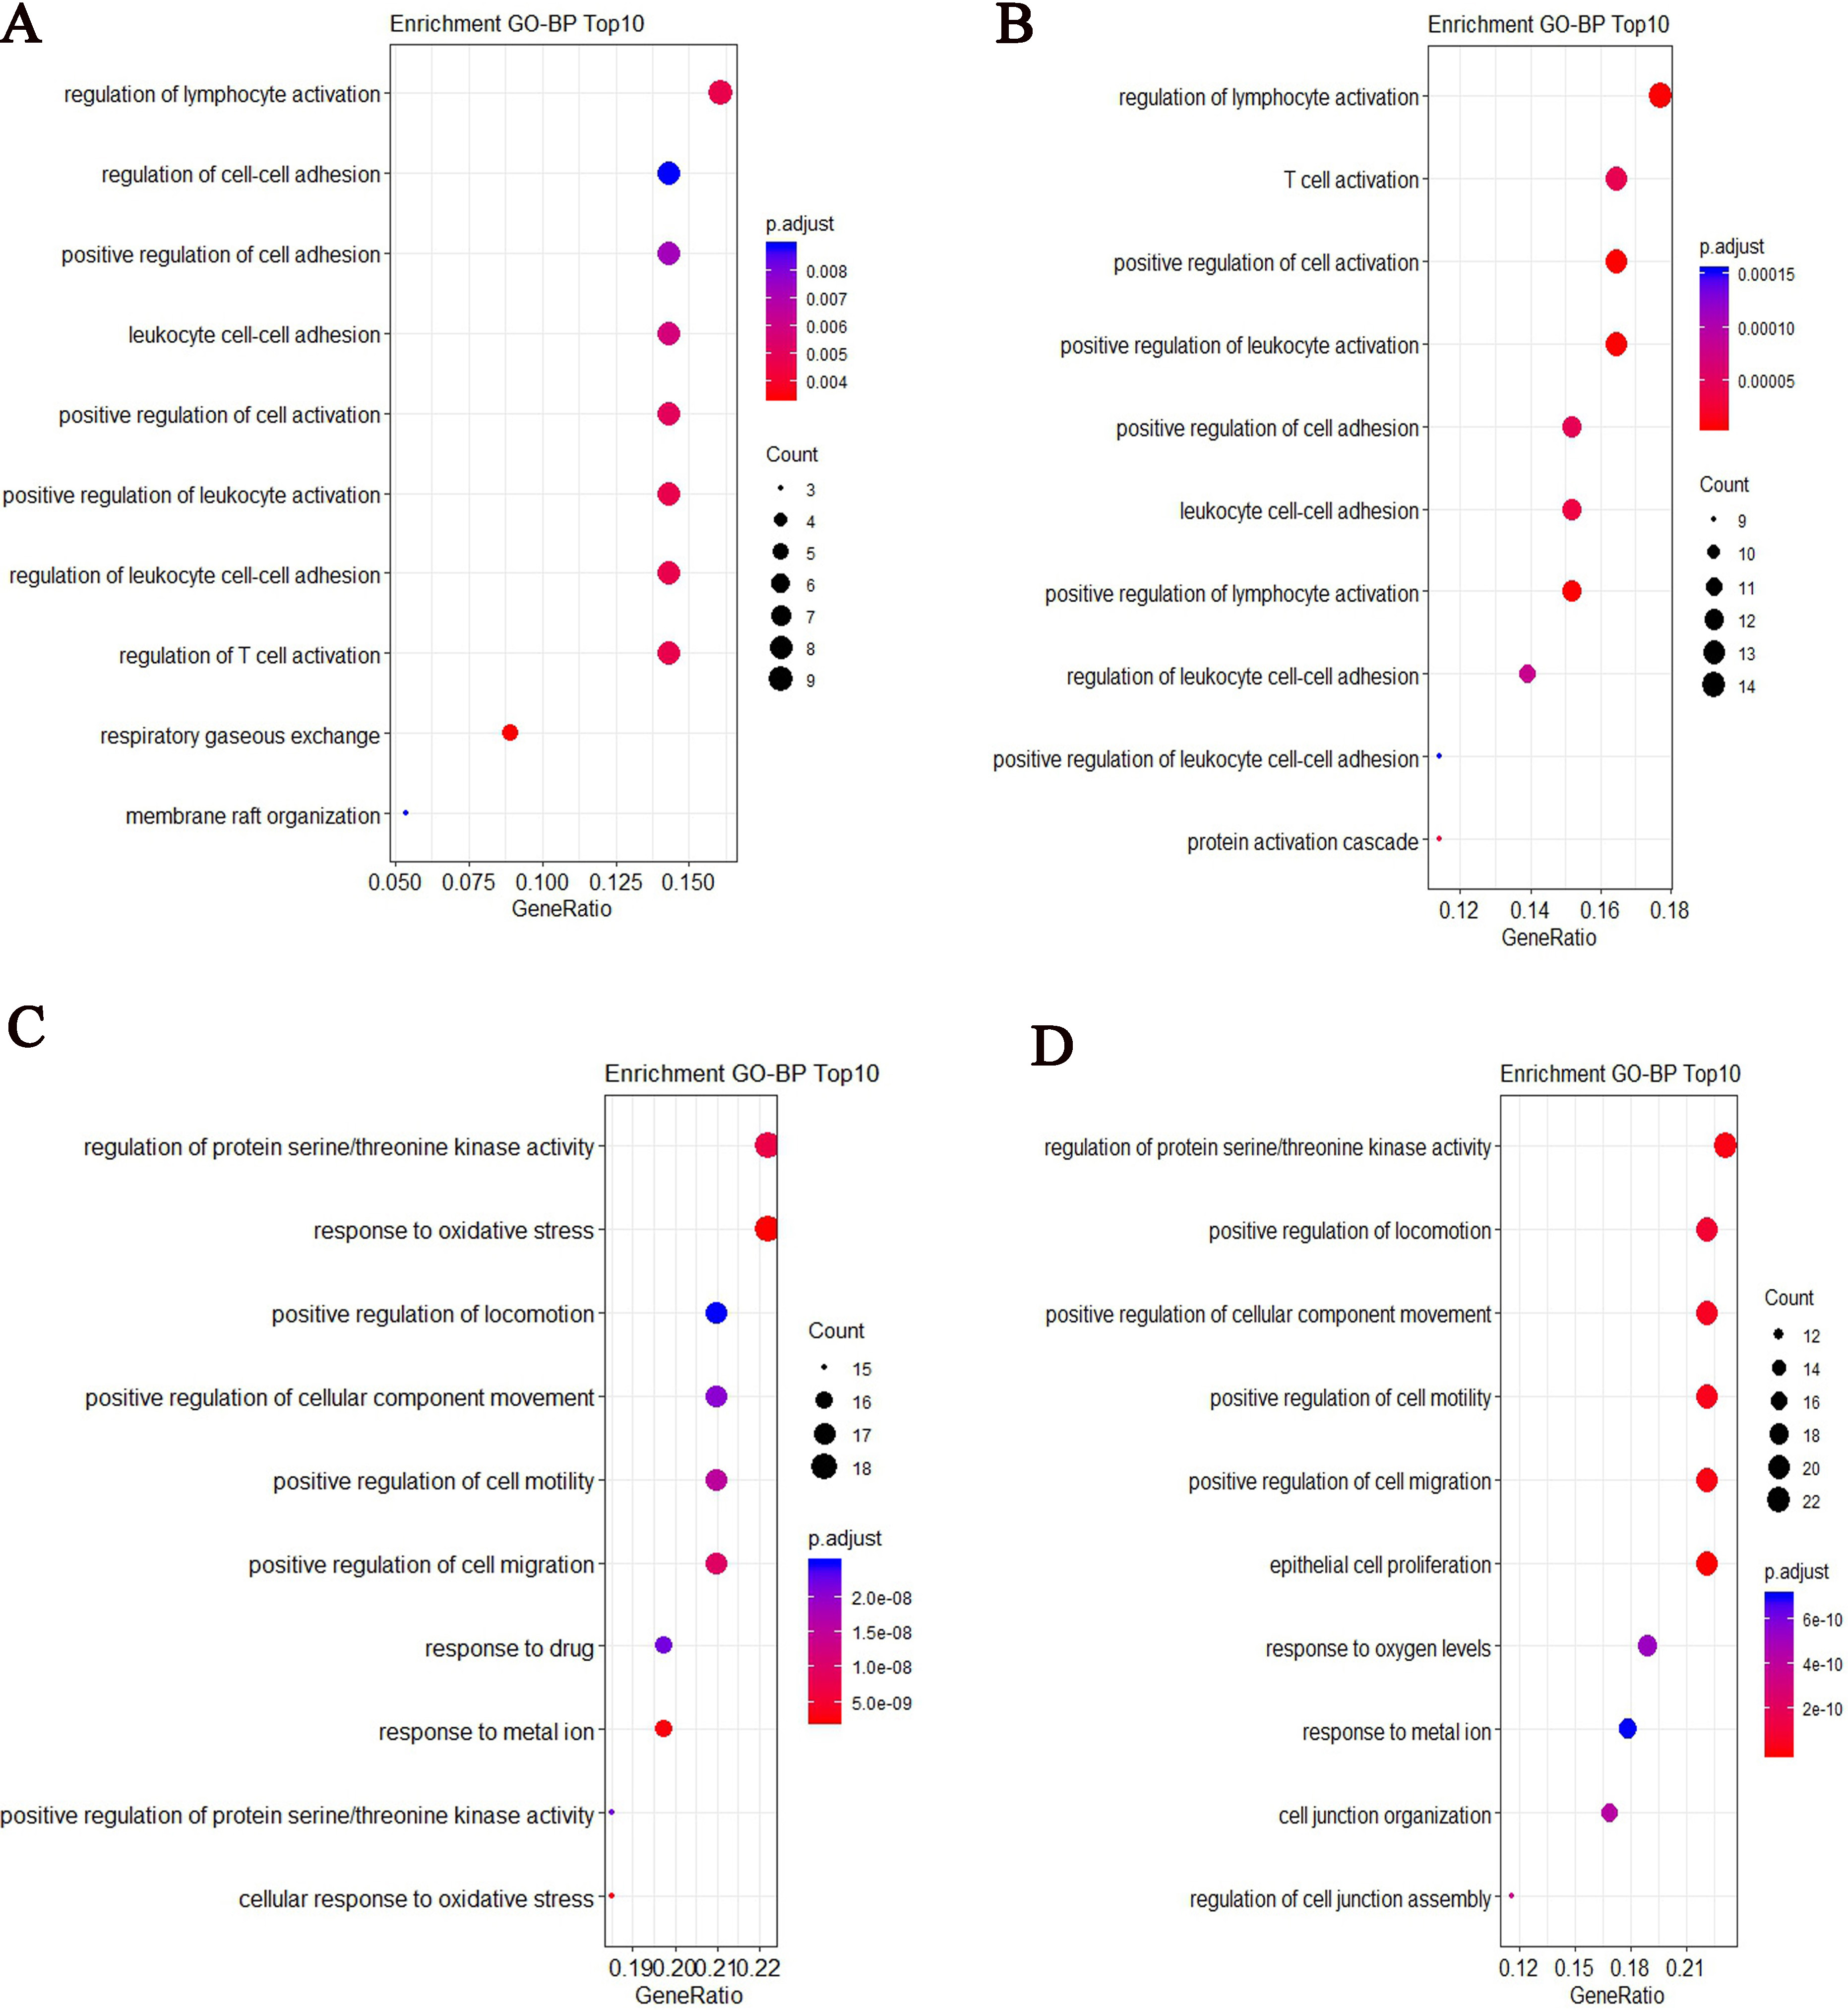
After performed GO enrichment analysis, we showed the top 10 most significant GO-BP (Biology Process) enrichment results. Some enriched GO terms were similar for two groups, such as regulation of lymphocyte activation, positive regulation of cell adhesion and regulation of leukocyte cell-cell adhesion. For COPD patient, the specified biological process focuses on respiratory gaseous exchange (Fig. 7A). For controls, the specified biological process focuses on protein activation cascade (Fig. 7B). From the top 10 most significant GO-BP enrichment results for target genes of differentially expressed lncRNAs, some slight differences were found between two groups. For COPD patient, the biological process focuses on response to oxidative stress and cellular response to oxidative stress (Fig. 7C). For controls, it focuses on cell junction and cell migration (Fig. 7D).
Figure 7.
GO-BP enrichment results based on the top ranked differentially expressed mRNAs and target genes of differentially expressed lncRNAs for COPD and controls respectively. (A) The top 10 most significant GO-BP terms based on the top ranked differentially expressed mRNAs for COPD (B) The top 10 most significant GO-BP terms based on the top ranked differentially expressed mRNAs for controls (C) The top 10 most significant GO-BP terms based on targets of differentially expressed lncRNAs for COPD (D) The top 10 most significant GO-BP terms based on targets of differentially expressed lncRNAs for controls.
3.5Identification of cell-cell interaction networks
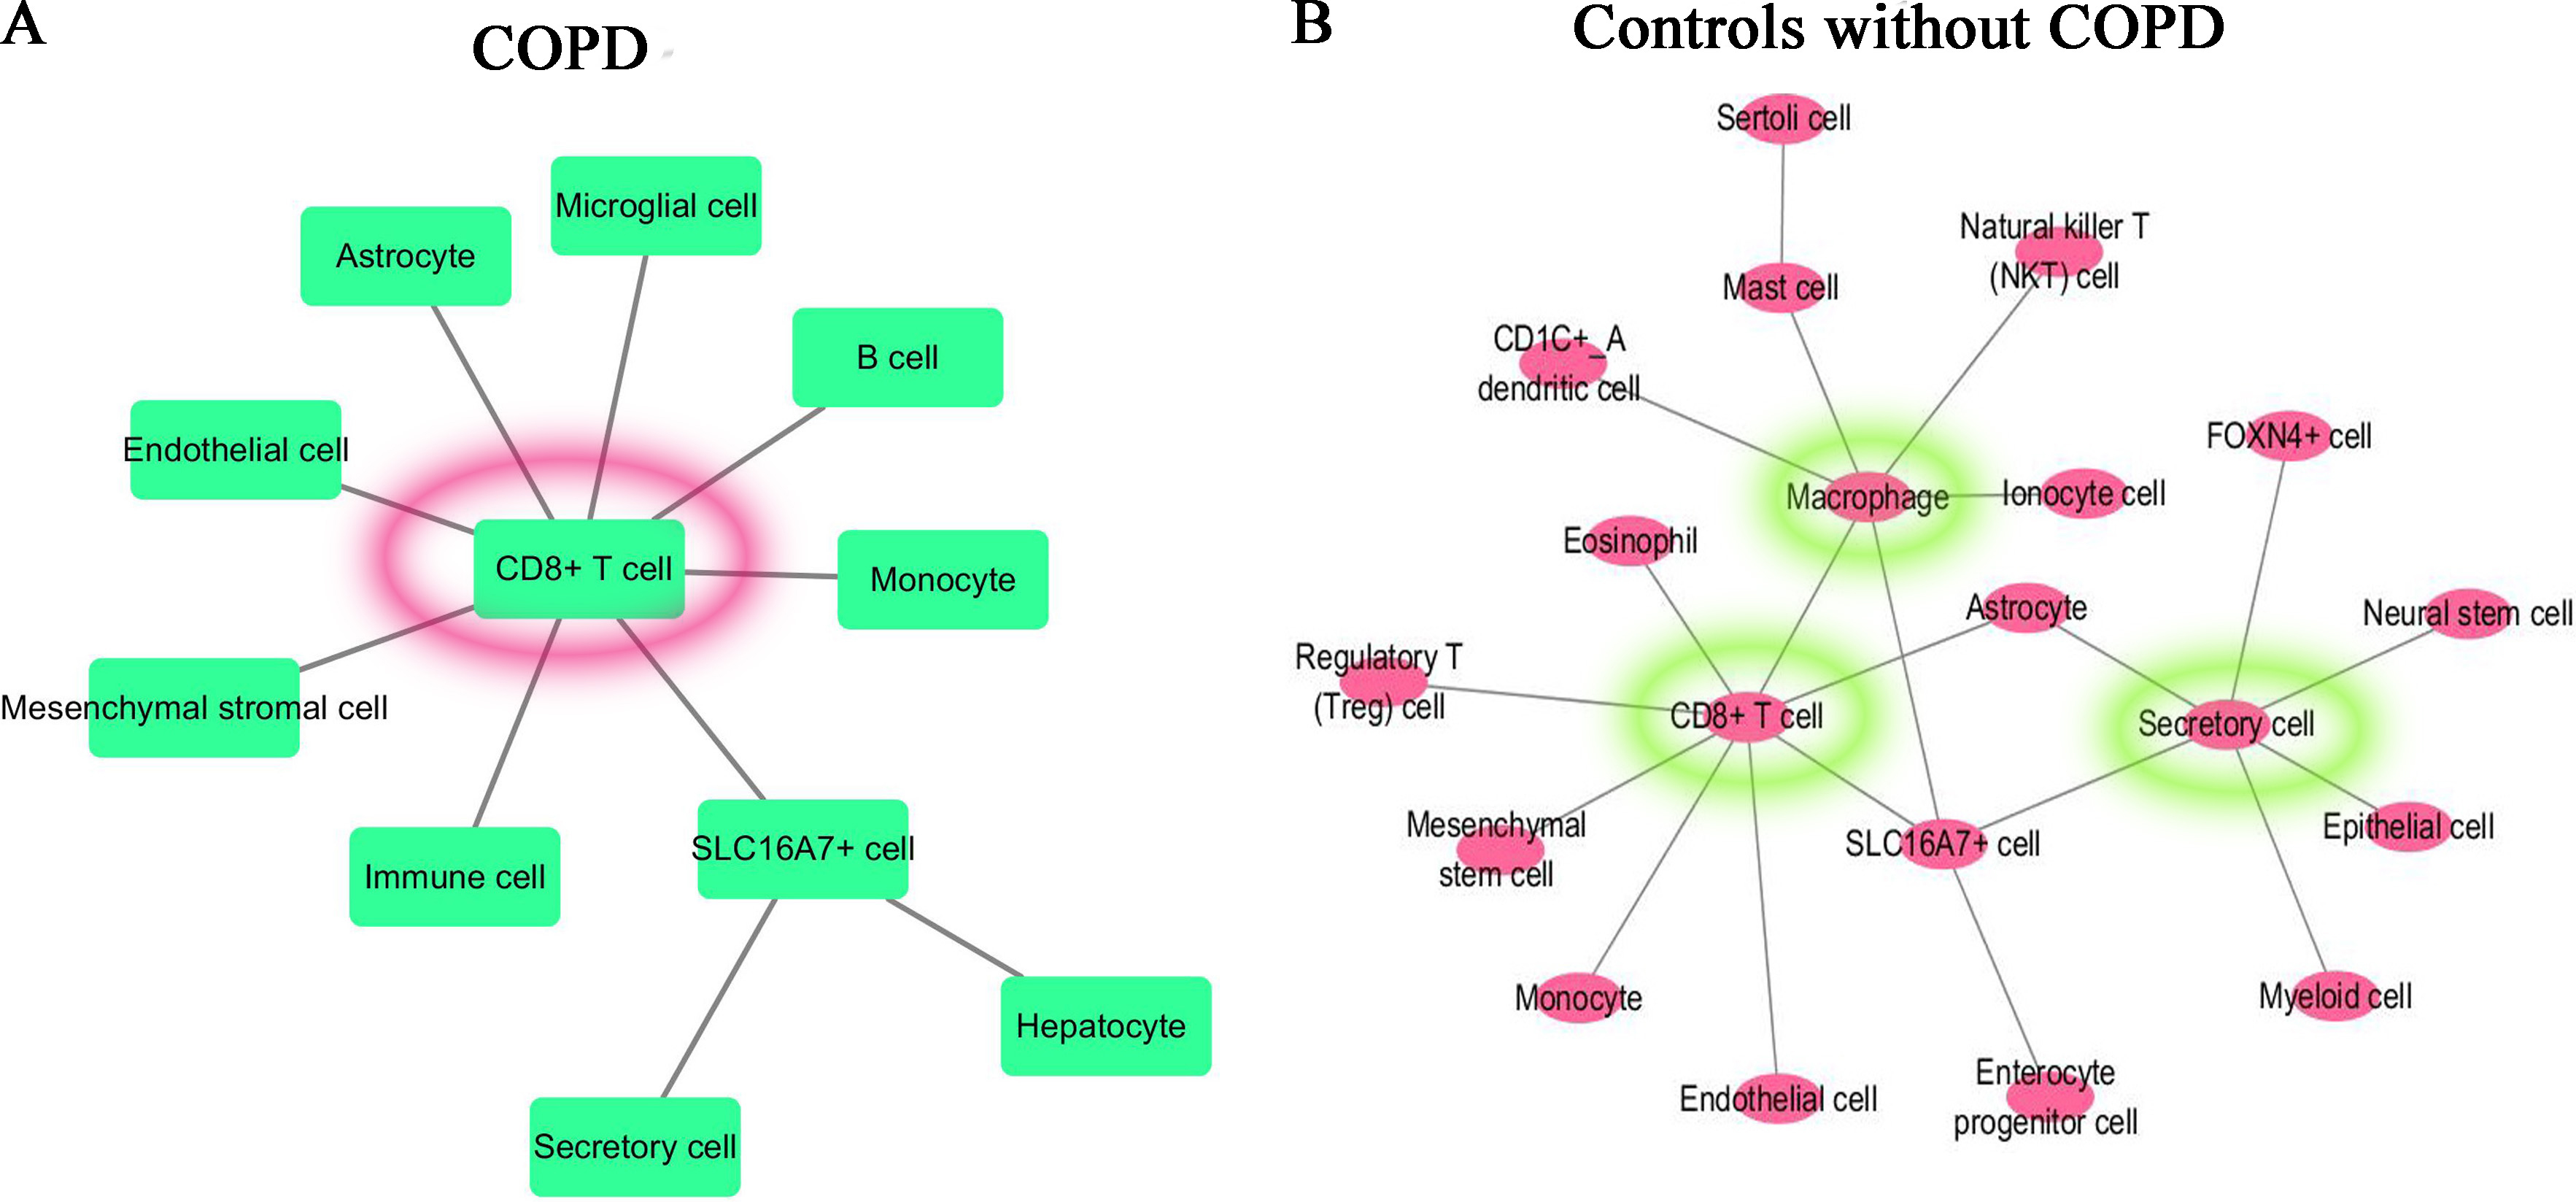
For the most significant differentially expressed gene in the comparison between each specified cluster and other clusters of COPD and controls, we applied CellPhoneDB database to construct the molecular interaction networks among the cell subtypes. We then combined with the CellMarker database which can map the genes to the corresponding cell subtypes to get the cell-cell interaction networks. The cell-cell interaction networks of COPD and controls are shown in Fig. 8A and B respectively. From Fig. 8, it is shown that the cell–cell interaction networks was dominated by CD8+ T cell in COPD patient and was dominated by CD8+ T cell, Macrophage cell and Secretory cell in controls.
Figure 8.
Cell-cell interaction networks. (A) For COPD patient, the cell–cell interaction network was dominated by CD8+ T cell. (B) For controls, the cell-cell interaction network was dominated by CD8+ T cell, Macrophage cell and Secretory cell.
3.6Pseudotime analysis for COPD and controls
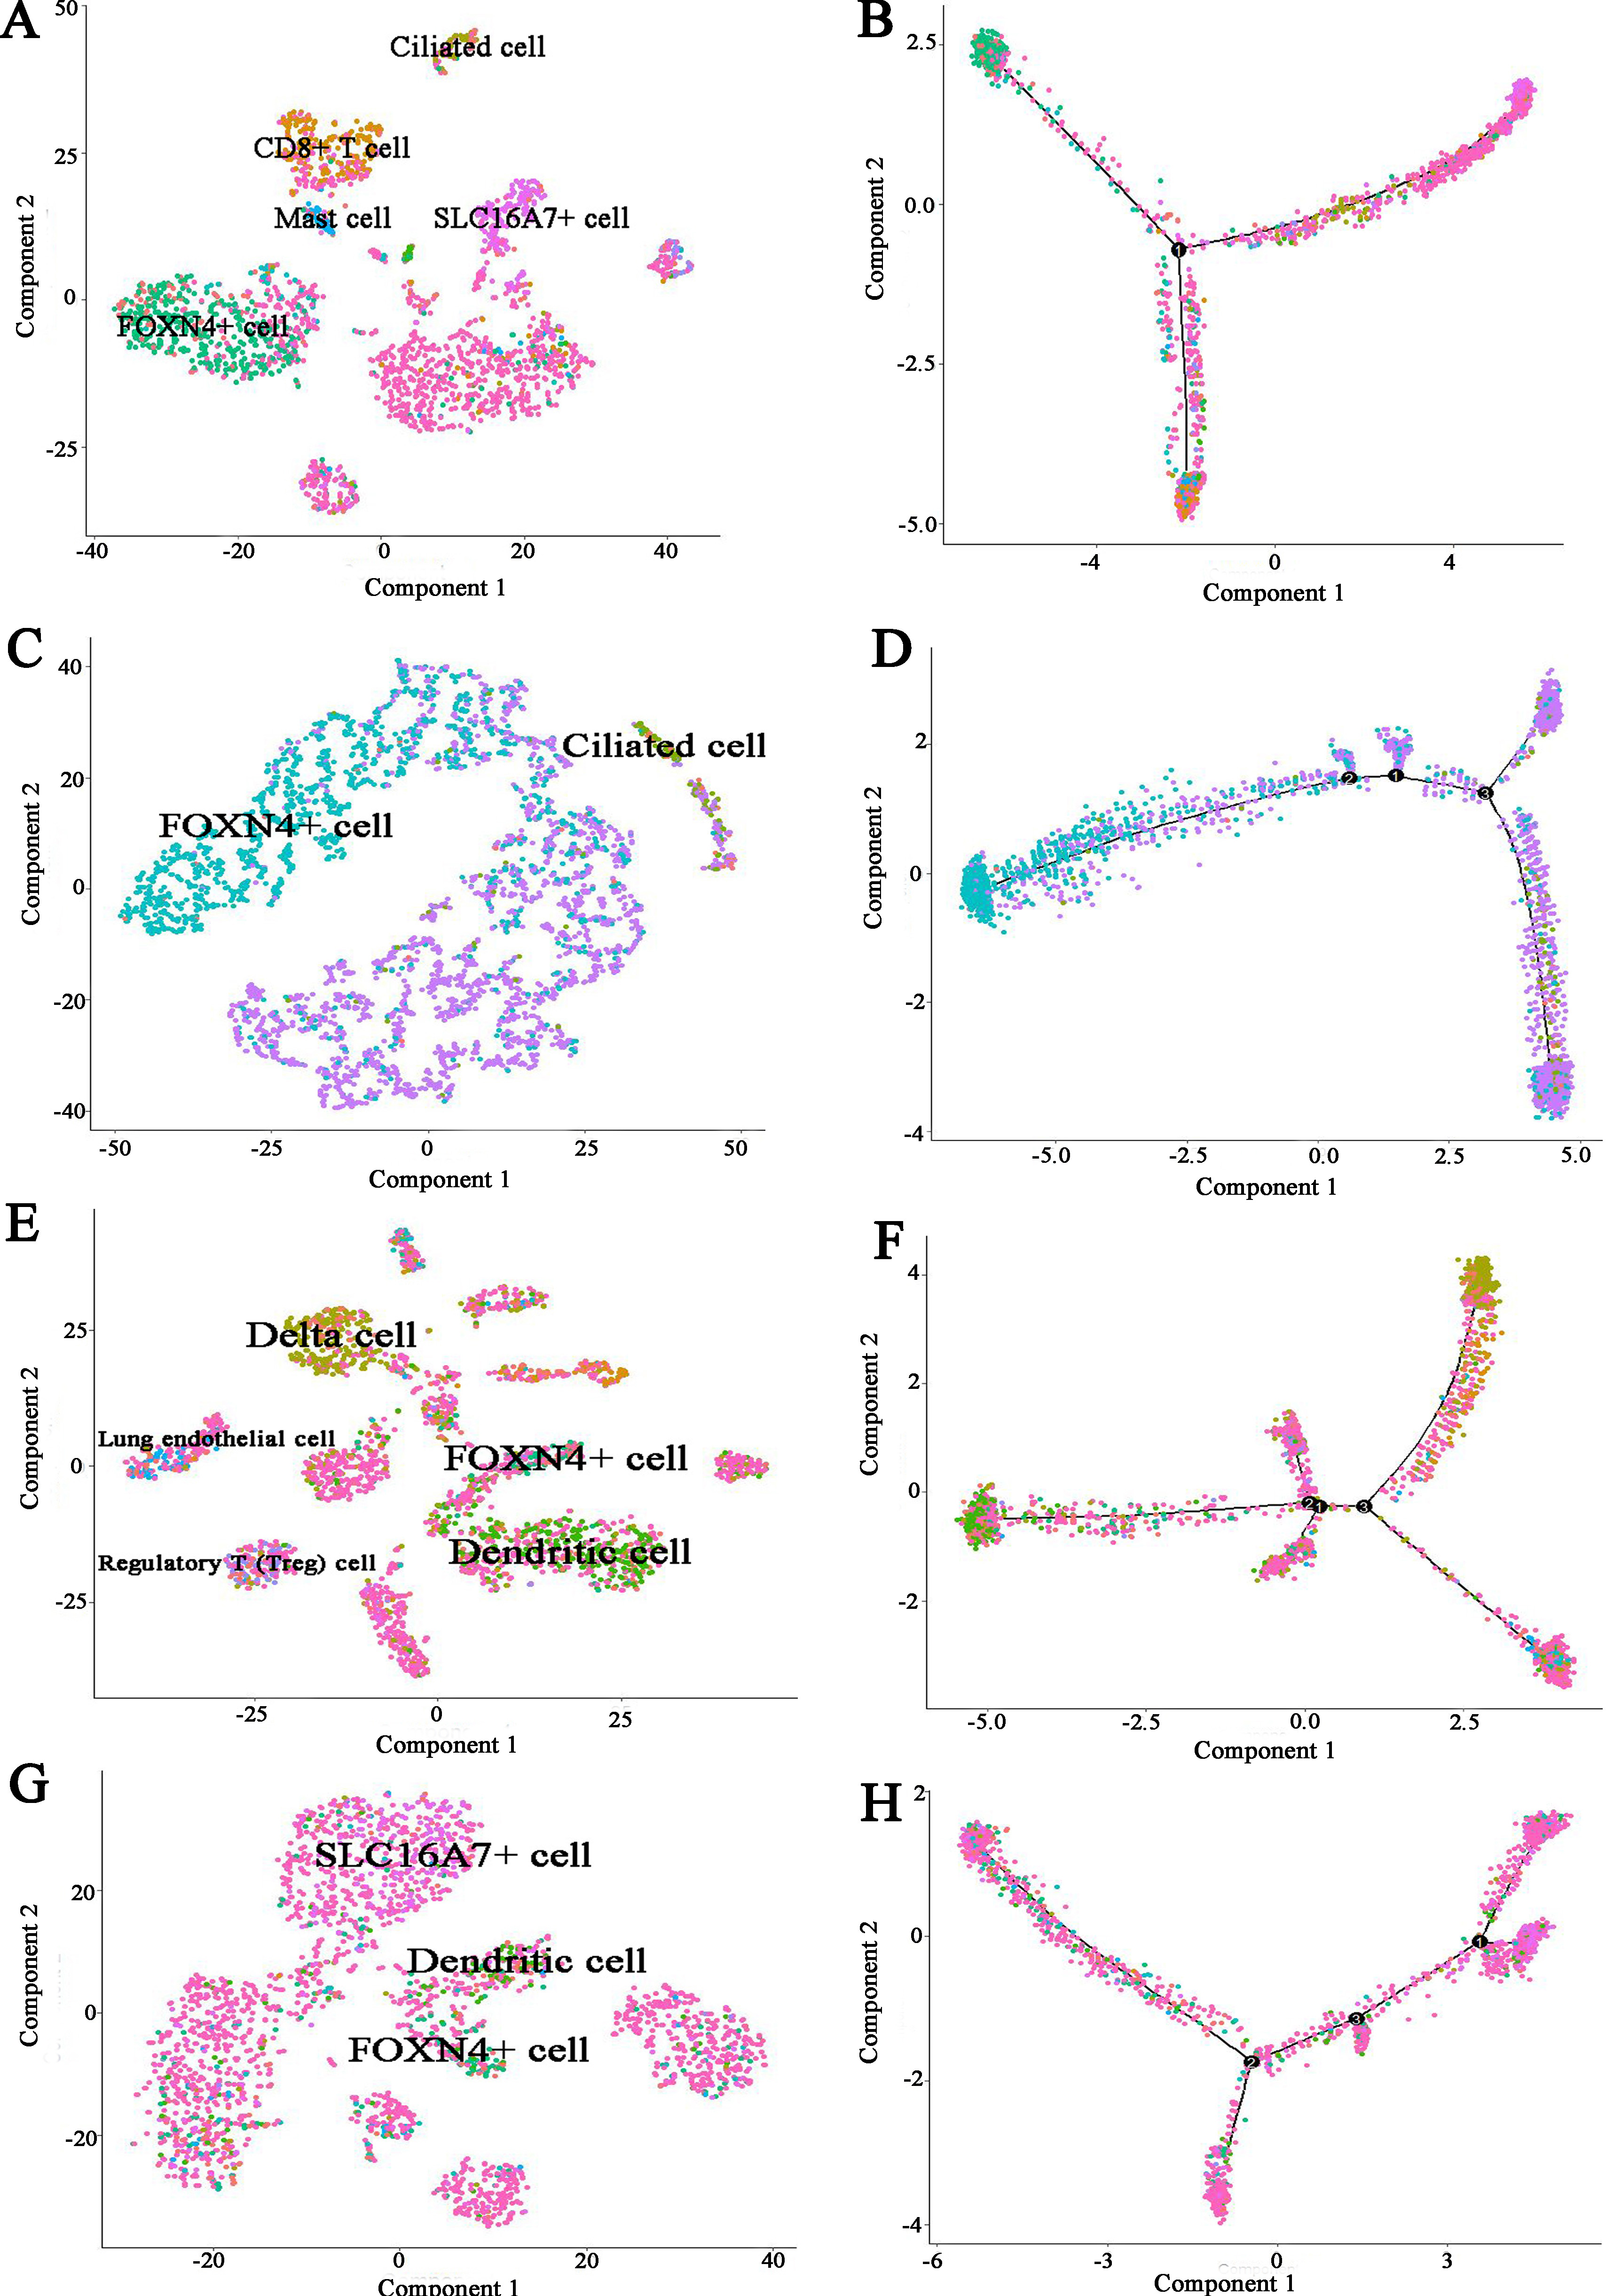
To further infer the differentiation trajectories of cell subtypes in COPD and controls, we performed pseudotime analysis for four subjects respectively. For COPD sample (Muc3843), the result reveals a trajectory starting with FOXN4+ cell bifurcating into ciliated cell and CD8+ T cell (Fig. 9A and B). For three controls, they showed the different trajectory. For example, for Muc4658 sample, there was no obvious trajectory branch (Fig. 9C and D). For Muc5103 sample, the dendritic cell bifurcating into Delta cell (Fig. 9E and F). For Muc5104 sample, there was no obvious trajectory branch (Fig. 9G and H).
Figure 9.
Pseudotime developmental trajectory analysis from Monocle depicting how each of the cell subtypes relates to each other for COPD and controls respectively. (A) COPD (Muc3843) cell subtypes (B) COPD (Muc3843) trajectory analysis (C) Control subject (Muc4658) cell subtypes (D) Control subject (Muc4658) trajectory analysis (E) Control subject (Muc5103) cell subtypes (F) Control subject (Muc5103) trajectory analysis (G) Control subject (Muc5104) cell subtypes (H) Control subject (Muc5104) trajectory analysis.
3.7Immune infiltration analysis
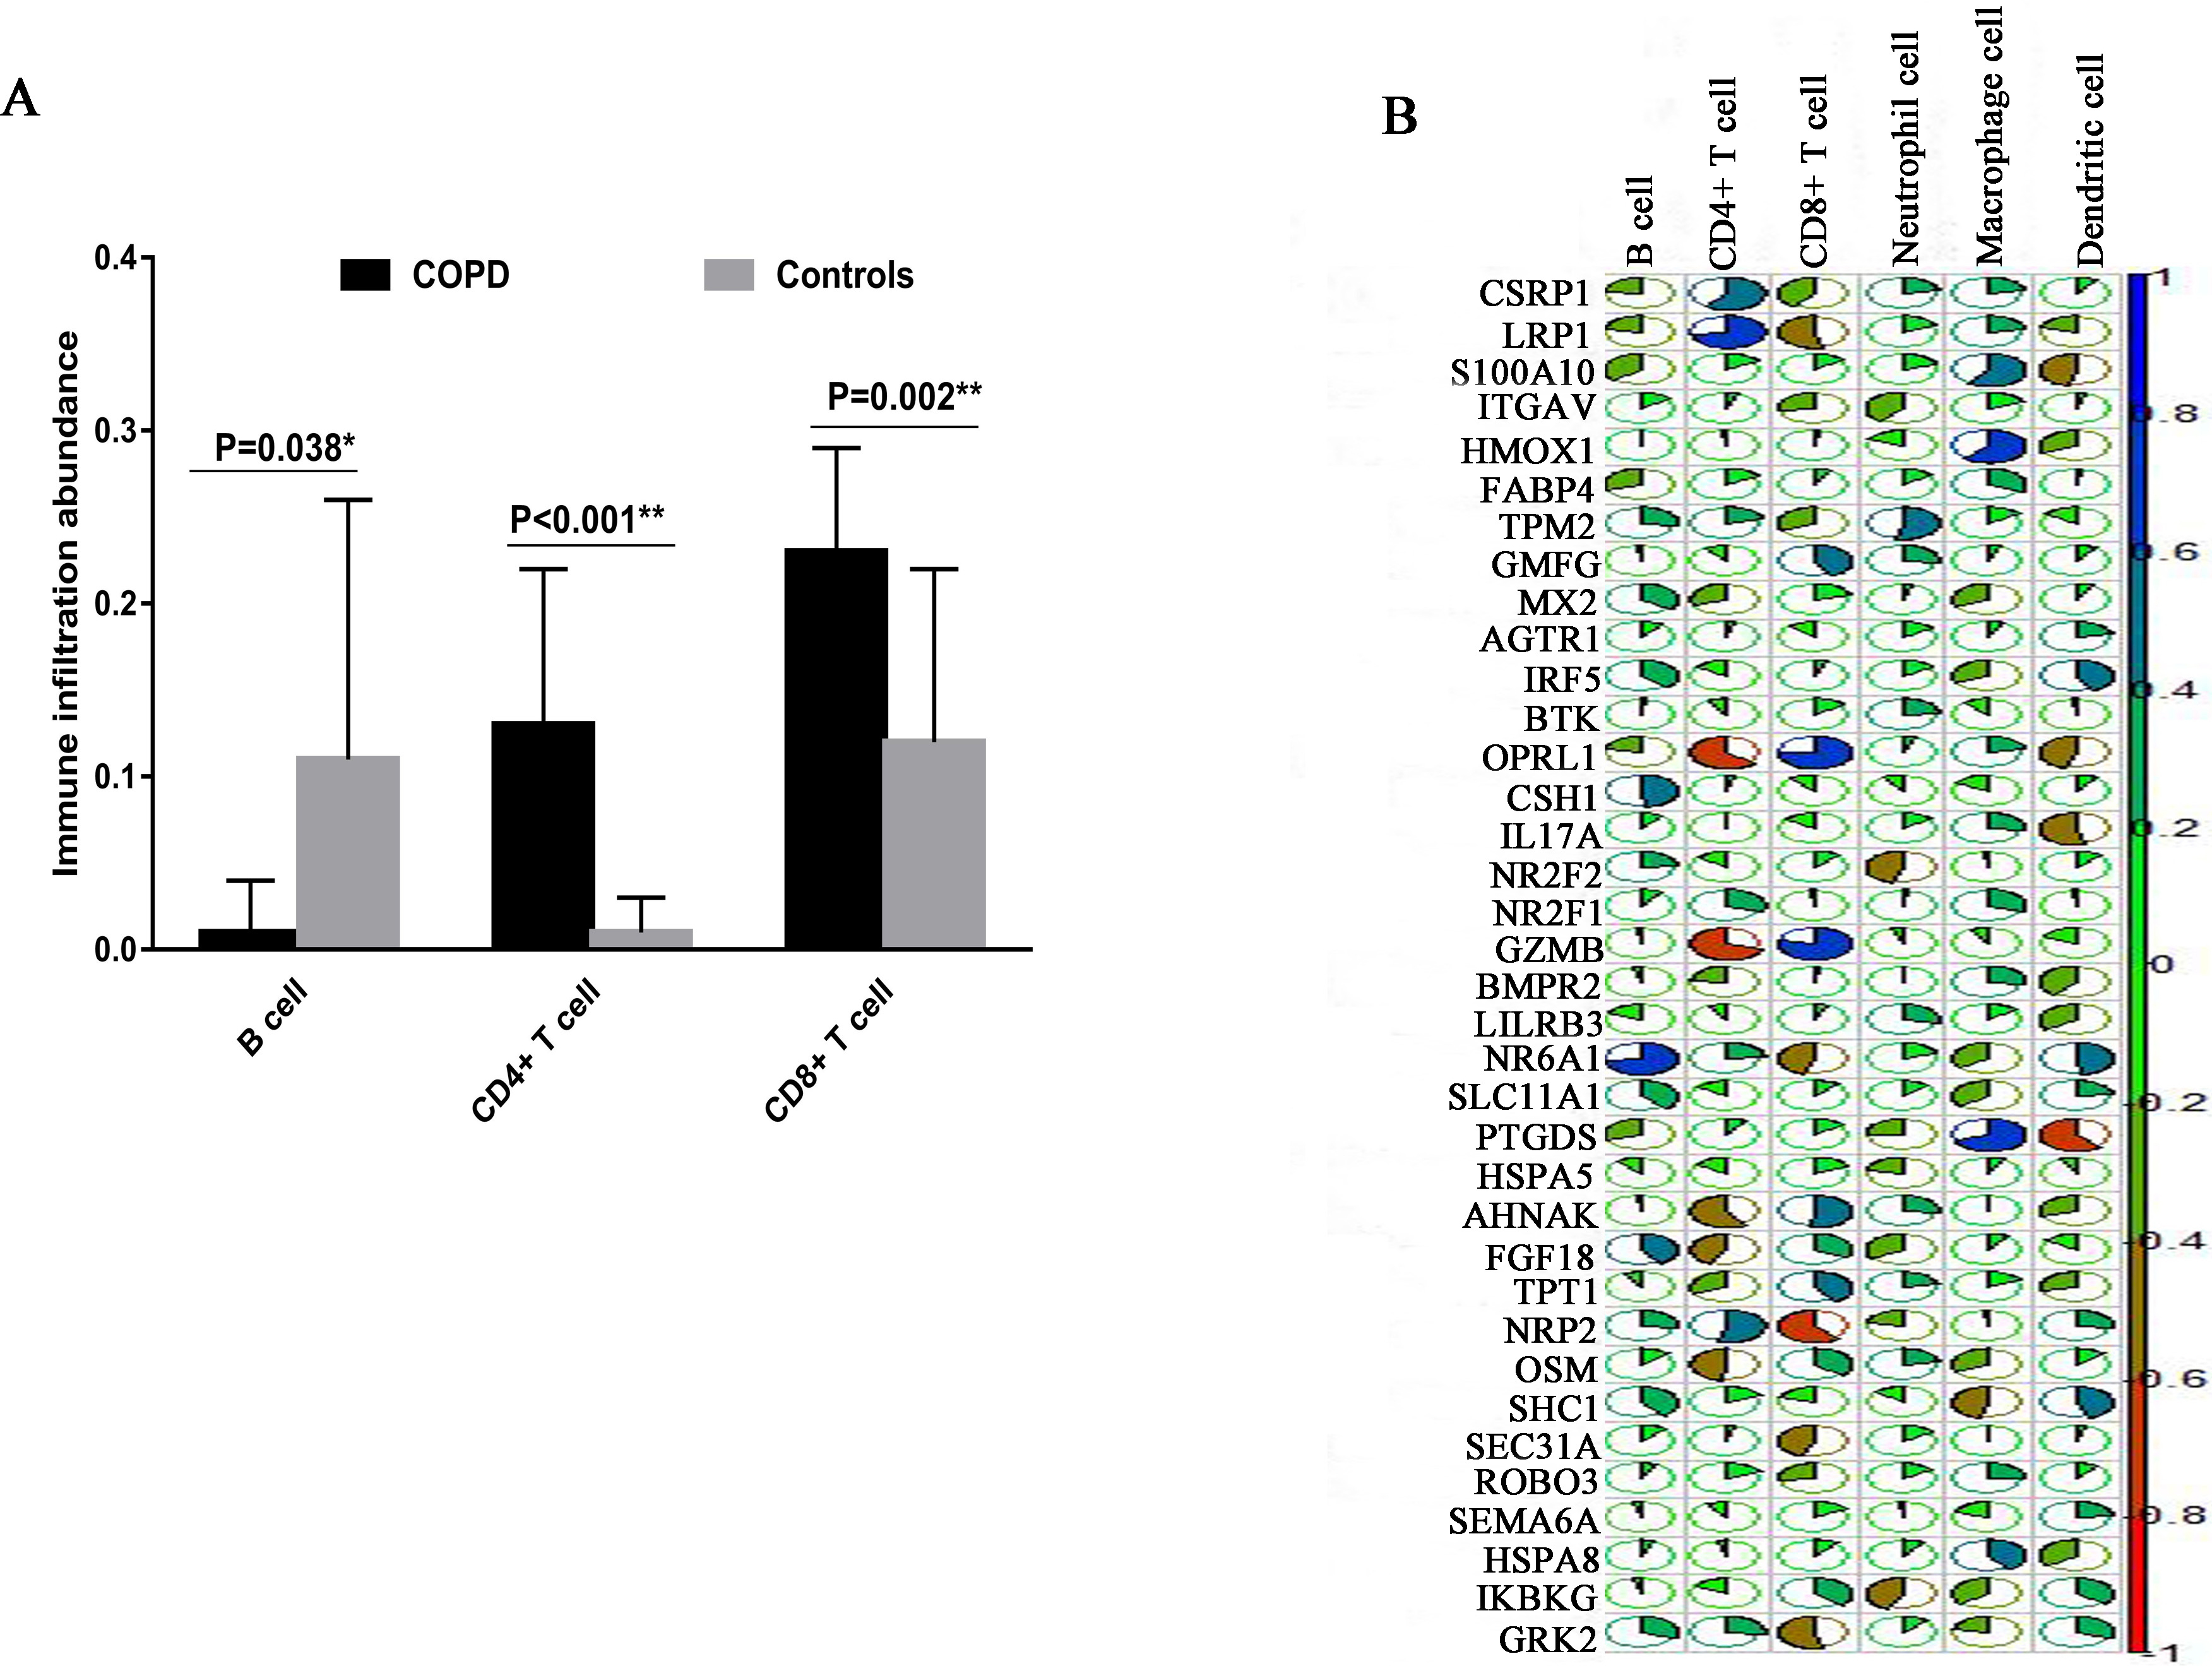
To compare and evaluate the identified cell clusters, we used TIMER web tool to estimate the infiltration abundance of the six immune cells (B cells, CD4+ T cells, CD8+ T cells, Neutrphils, Macrophages and Dendirtic cells) using the COPD microarray data. We calculated and compared the relative abundance of each cell cluster using the student-t test. We found B cell, CD4+ T cells and CD8+ T cells showed the significant differences between COPD and controls. Specially, CD8+ T cells showed the higher immune infiltration abundance in COPD patients than in controls (
Figure 10.
The immune infiltration analysis based on COPD microarray data. (A) The comparison of immune infiltration abundance between COPD and Controls. (B) The correlation analysis between the expression and immune infiltration abundance of COPD immune-related genes. The blue color indicates the high positive correlation whereas the red color indicates the high negative correlation.
4.Discussion and conclusion
In this study, we reanalyzed peripheral blood mononuclear cells scRNA-seq data of COPD and controls without COPD from GEO database. The cells were re-clustered into subgroups based on mRNAs and lncRNAs, and the results suggested the differences in cellular heterogeneity between COPD and controls. Compare clustered cell subtypes between COPD and controls based on mRNAs datasets, we found that the cell subsets include: Lung epithelial cell, Micoglial cell, SLC16A7+ cell, FOXN4+ cell, Delta cell, Mast cell, Ionocyte cell and Ciliated cell. Meanwhile, Ionocyte cell is suggested a pathological role in bronchiectasis, and cystic fibrosis [18]. It is reported that the airway epithelium of COPD shows changes in the differentiation of ciliated cells, at least partially through TGF-
After we performed the GO function enrichment analysis, we identified some significant enriched GO terms. For COPD patient, the specified biological process focuses on respiratory gaseous exchange. It is known that in the respiratory tract, immune homeostasis requires strict control mechanisms to protect the important and fragile gaseous exchange barrier from uncontrolled and damaging inflammation, or excessive immune response to harmless allergen, such as allergic asthma [22]. From the top 10 most significant enriched GO-BP terms based on target genes of lncRNAs, we found some differences between COPD and controls. For COPD, the biological process specially focuses on response to oxidative stress and cellular response to oxidative stress. In the practice, oxidative stress and inflammation are considered to have contribute to the pathogenesis of COPD. A recent finding indicates that resveratrol had a therapeutic effect related to inhibition of oxidative stress and inflammatory response in their rat COPD model [23]. In addition, we constructed the cell-cell interaction networks for COPD and controls respectively. It is shown that the cell-cell interaction network was dominated by CD8+ T cell in COPD patient while was dominated by CD8+ T cell, Macrophage cell and Secretory cell in controls. This result is consistency with the immune infiltration analysis in which CD8+ T cells showed the higher immune infiltration abundance in COPD patients than in controls.
Although the identification of immune-related markers may provide insight into molecular mechanisms regulating immune cells activity in COPD, this study is not without limitations. A major limitation is the small sample size. On one hand, the cost of single cell sequencing is relatively expensive at present, and most of the research groups just want to perform the explore study using the small sample size. On the other hand, compared with the single cell sequencing data of tumors, the COPD-related data is a serious deficiency. As more COPD-related single-cell sequencing data are available, we will perform more in-depth data analysis to validate the reliability of the results. In addition, the lack of experiment validation is another major limitation. In future studies, enlarged sample sizes and feasibility experiments will be needed to validate these findings.
Conflict of interest
None to report.
References
[1] | Yuan C, Chang D, Lu G, Deng X. Genetic Polymorphism and Chronic Obstructive Pulmonary Disease. Int J Chron Obstruct Pulmon Dis. (2017) ; 12: : 1385-93. doi: 10.2147/COPD.S134161. |
[2] | Najafinobar N, Venkatesan S, Sydow L, Klarqvist M, Olsson H, Zhou X-H, et al. ToF-SIMS mediated analysis of human lung tissue reveals increased iron deposition in COPD (GOLD IV) patients. Scientific Reports. (2019) ; 9: (10060). doi: 10.1038/s41598-019-46471-7. |
[3] | Caramori G, Casolari P, Barczyk A, Durham AL, Stefano AD, Adcock I. COPD Immunopathology. Semin Immunopathol. (2016) ; 38: (4): 497-515. doi: 10.1007/s00281-016-0561-5. |
[4] | Caramori G, Ruggeri P, Stefano AD, Mumby S, Girbino G, Adcock IM, et al. Autoimmunity and COPD: Clinical Implications. Chest. (2018) ; 153: (6): 1424-31. doi: 10.1016/j.chest.2017.10.033. |
[5] | Donovan C, Starkey MR, Kim RY, Rana BMJ, Barlow JL, Jones B, et al. Roles for T/B Lymphocytes and ILC2s in Experimental Chronic Obstructive Pulmonary Disease. J Leukoc Biol. (2019) ; 105: (1): 143-50. doi: 10.1002/JLB.3AB0518-178R. |
[6] | Ström JE, Pourazar J, Linder R, Blomberg A, Lindberg A, Bucht A, et al. Cytotoxic Lymphocytes in COPD Airways: Increased NK Cells Associated With Disease, iNKT and NKT-like Cells With Current Smoking. Respir Res. (2018) ; 19: (1): 244. doi: 10.1186/s12931-018-0940-7. |
[7] | Picelli S. Single-cell RNA-sequencing: The Future of Genome Biology Is Now. RNA Biol. (2017) ; 14: (5): 637-50. doi: 10.1080/15476286.2016.1201618. |
[8] | Qi X, Chen H, Fu B, Huang Z, Mou Y, Liu J, et al. LncRNAs NR-026690 and ENST00000447867 Are Upregulated in CD4+ T Cells in Patients With Acute Exacerbation of COPD. Int J Chron Obstruct Pulmon Dis. (2019) ; 14: : 699-711. doi: 10.2147/COPD.S191815. |
[9] | Chen YG, Satpathy AT, Chang HY. Gene regulation in the immune system by long noncoding RNAs. Nat Immunol. (2017) ; 18: (9): 962-72. doi: 10.1038/ni.3771. |
[10] | Braga FAV, Kar G, Berg M, Carpaij OA, Polanski K, Simon LM, et al. A cellular census of human lungs identifies novel cell states in health and in asthma. Nat Med. (2019) ; 25: (7): 1153-63. doi: 10.1038/s41591-019-0468-5. |
[11] | Harrow J, Frankish A, Gonzalez JM, Tapanari E, Diekhans M, Kokocinski F, et al. GENCODE: The Reference Human Genome Annotation for The ENCODE Project. Genome Res. (2012) ; 22: (9): 1760-4. doi: 10.1101/gr.135350.111. |
[12] | Hwang B, Lee JH, Bang D. Single-cell RNA sequencing technologies and bioinformatics pipelines. Exp Mol Med. (2018) ; 50: (8): 1-14. doi: 10.1038/s12276-018-0071-8. |
[13] | Linderman GC, Rachh M, Hoskins JG, Steinerberger S, Kluger Y. Fast Interpolation-Based t-SNE for Improved Visualization of Single-Cell RNA-seq Data. Nat Methods. (2019) ; 16: (3): 243-5. doi: 10.1038/s41592-018-0308-4. |
[14] | Cheng L, Wang P, Tian R, Wang S, Guo Q, Luo M, et al. LncRNA2Target v20: A Comprehensive Database for Target Genes of lncRNAs in Human and Mouse. Nucleic Acids Res. (2019) ; 47: (D1): D140-D4. doi: 10.1093/nar/gky1051. |
[15] | Efremova M, Vento-Tormo M, Teichmann SA, Vento-Tormo R. CellPhoneDB: inferring cell-cell communication from combined expression of multi-subunit ligand-receptor complexes. Nat Protoc. (2020) ; 15: (4): 1484-506. doi: 10.1038/s41596-020-0292-x. |
[16] | Díaz-Montaña JJ, Díaz-Díaz ND, Barranco C, Ponzoni I. Development and use of a Cytoscape app for GRNCOP2. Comput Methods Programs Biomed. (2019) ; 177: : 211-8. doi: 10.1016/j.cmpb.2019.05.030. |
[17] | Bhattacharya S, Dunn P, Thomas CG, Smith B, Schaefer H, Chen J, et al. ImmPort, toward repurposing of open access immunological assay data for translational and clinical research. SCiData. (2018) ; 5: : 180015. doi: 10.1038/sdata.2018.15. |
[18] | Krotova K, Marek GW, Wang RL, Aslanidi G, Hoffman BE, Khodayari N, et al. Alpha-1 Antitrypsin-Deficient Macrophages Have Increased Matriptase-Mediated Proteolytic Activity. Am J Respir Cell Mol Biol. (2017) ; 57: (2): 238-47. doi: 10.1165/rcmb.2016-0366OC. |
[19] | Gohy S, Carlier FM, Fregimilicka C, Detry B, Lecocq M, Ladjemi MZ, et al. Altered Generation of Ciliated Cells in Chronic Obstructive Pulmonary Disease. Sci Rep. (2019) ; 9: (1): 17963. doi: 10.1038/s41598-019-54292-x. |
[20] | Paats MS, Bergen IM, Hoogsteden HC, Eerden MMvd, Hendriks RW. Systemic CD4+ and CD8+ T-cell Cytokine Profiles Correlate With GOLD Stage in Stable COPD. Eur Respir J. (2012) ; 40: (2): 330-7. doi: 10.1183/09031936.00079611. |
[21] | Rijavec M, Volarevic S, Osolnik K, Kosnik M, Korosec P. Natural Killer T Cells in Pulmonary Disorders. Respir Med. (2011) ; 105: (Suppl 1): S20-S5. doi: 10.1016/S0954-6111(11)70006-3. |
[22] | Garnier CV, Nicod LP. Immunology Taught by Lung Dendritic Cells. Swiss Med Wkly. (2009) ; 139: (13-14): 186-92. doi: 10.4414/smw.2009.12151. |
[23] | Wang X-L, Li T, Li J-H, Miao S-Y, Xiao X-Z. The Effects of Resveratrol on Inflammation and Oxidative Stress in a Rat Model of Chronic Obstructive Pulmonary Disease. Molecules. (2017) ; 22: (9): 1529. doi: 10.3390/molecules22091529. |


