
Assessment of the disease severity in patients hospitalized for COVID-19 based on the National Early Warning Score (NEWS) using statistical and machine learning methods: An electronic health records database analysis
Abstract
BACKGROUND:
The coronavirus disease 2019 (COVID-19) was a cause of concern in the healthcare system and increased the need for disease severity indicators. However, they still vary in use to evaluate in-hospital outcomes and severity. The National Early Warning Score (NEWS) is routinely used to evaluate patient health status at the hospital. Further research is needed to ensure if NEWS can be a good instrument for an overall health status assessment with or without additional information like laboratory tests, intensive care needs, and history of chronic diseases.
OBJECTIVE:
To evaluate if NEWS can be an indicator to measure COVID-19 patient status in-hospital.
METHODS:
We used the fully anonymized Electronic Health Records (EHR) characterizing patients admitted to the hospital with COVID-19. Data was obtained from Vilnius University Hospital Santaros Klinikos EHR system (SANTA-HIS) from 01-03-2020 to 31-12-2022. The study sample included 3875 patients. We created several statistical and machine learning models for discrimination between in-hospital death/discharge for evaluation NEWS as a disease severity measure for COVID-19 patients. In these models, two variable sets were considered: median NEWS and its combination with clinical parameters and medians of laboratory test results. Assessment of models’ performance was based on the scoring metrics: accuracy, sensitivity, specificity, area under the ROC curve (AUC), and F1-score.
RESULTS:
Our analysis revealed that NEWS predictive ability for describing patient health status during the stay in the hospital can be increased by adding the patient’s age at hospitalization, gender, clinical and laboratory variables (0.853 sensitivity, 0.992 specificity and F1-score – 0.859) in comparison with single NEWS (0.603, 0.995, 0.719, respectively). A comparison of different models showed that stepwise logistic regression was the best method for in-hospital mortality classification. Our findings suggest employing models like ours for advisory routine usage.
CONCLUSION:
Our model demonstrated incremental value for COVID-19 patient’s status evaluation.
1.Introduction
The coronavirus disease 2019 (COVID-19) caused great concern in the health system. Many studies have been conducted to determine what might be associated with poorer outcomes and a more severe disease course. Healthcare institutions are in high demand of tools for quick evaluation of patient status severity or resource planning. However, assessments of the severity of the condition often vary, ranging from outcomes like in-hospital death [1, 2, 3] or need for intensive care [4] to specific health indicators like respiratory distress [5, 6, 7] or organ failure markers [8, 7]. Although there is an essential need to stratify patients according to their disease severity, the diversity in assessments makes it challenging to establish a standardized approach to measure and compare the severity of COVID-19 cases across different healthcare facilities and regions. Consequently, there is a demand for a comprehensive severity scoring system that incorporates various aspects of the disease course and provides a more holistic view of patients’ conditions. However, the question of which specific indicators best represent a patient’s overall condition during their hospital stay remains an object for discussion.
Often, especially when analyzing real-world healthcare data such as electronic health records, the ability to assess possible indicators is limited by the information recorded in databases during routine patient care. The most common tools to assess conditions used in practice are patient examination records with an evaluation of the patient’s vital signs, laboratory tests, treatment statuses such as the need for intensive therapy, and medical history of chronic diseases. Scientific data suggests that some tools useful for ongoing health monitoring and incorporated into routine practice may be appropriate for generally assessing patient’s condition.
The choice of scoring system depends on various factors, including the clinical context, patient population and there are many alternatives, such as MEWS [9], PEWS [10], SOFA [11], qSOFA [12], PRISM [13], APACHE II [14], NEWS [15] has gained significant recognition and widespread adoption in many healthcare settings due to standardization, extensive validation as well as integration into clinical pathways. The National Early Warning Score (NEWS) is often used to assess the condition of patients at the time of hospitalization [16] or to monitor their condition during hospitalization [17]. Although it is designed to assess immediate severe health events, usually limited to a 24-hour interval, it may be used to assess the overall complexity of patients’ conditions, for example, as an additional indicator to monitor the number of severe patients in the hospital.
This study aimed to use anonymized electronic health records from an existing healthcare facility to assess the potential of routinely performed NEWS measurement (alone or combined with other clinical data) to assess the patient’s health status during hospitalization period.
2.Materials and method
2.1Study population
The database of personalized electronic health records was built on routinely stored data. The database included patients presenting to admission with COVID-19 (diagnosis code – U07.1) and hospitalized within 24 hours at Vilnius University Hospital Santaros Klinikos (VUH SK) from March 2020 to December 2022. The research was approved by the Vilnius Regional Biomedical Research Ethics Committee (permission no. 2022/2-1411-882).
The inclusion criteria for this study were: (1) aged 18 years or older, (2) had at least 5 NEWS measurements assessed during the time of hospital admission, (3) had a NEWS score within the first two days of admission, (4) a frequency of NEWS recording of at least once per day.
During the 1 March 2020 and 31 December 2022 period in Vilnius University Hospital Santaros Klinikos EHR system (SANTA-HIS), there were 7240 admissions for COVID-19, of which 3875 patients met the selection criteria and were included in this analysis. The age of the patients ranged from 18 to 98, average age was 57 (SD
Table 1
Baseline characteristics of the study patients
| Total ( | Discharged patients ( | In-hospital death ( | ||
| Demographic characteristics | ||||
| Sex | ||||
| Female | 1779 (45.9) | 1651 (45.7) | 128 (48.5) | 0.420 |
| Male | 2096 (54.1) | 1960 (54.3) | 136 (51.5) | |
| Age, years | ||||
| Mean (SD) | 57.0 (16.0) | 55.6 (15.3) | 76 (12.0) | |
| Median [Min, Max] | 57.0 [18, 98] | 56.0 [18.0, 96.0] | 78.0 [38.0, 98.0] | |
| Clinical data | ||||
| Length of stay in hospital, days | ||||
| Mean (SD) | 11.4 (6.06) | 11.5 (5.95) | 9.44 (7.05) | |
| Median [Min, Max] | 10 [1, 64] | 10.0 [3.00, 64.0] | 8.00 [1.00, 40.0] | |
| Intensive therapy at ICU (%) | ||||
| No | 3565 (92.0) | 3375 (93.5) | 190 (72.0) | |
| Yes | 310 (8.0) | 236 (6.5) | 74 (28.0) | |
| Patient with at least one chronic disease, (%) | ||||
| No | 2528 (65.2) | 2420 (67.0) | 108 (40.9) | |
| Yes | 1347 (34.8) | 1191 (33.0) | 156 (59.1) | |
| NEW scores | ||||
| First NEW score | ||||
| Mean (SD) | 2.57 (2.03) | 2.44 (1.87) | 4.40 (3.03) | |
| Median [Min, Max] | 2 [0, 14] | 2.00 [0, 12.0] | 4.00 [0, 14.0] | |
| Max NEW score | ||||
| Mean (SD) | 4.68 (2.52) | 4.30 (1.97) | 9.91 (3.27) | |
| Median [Min, Max] | 4.00 [0, 19.0] | 4.00 [0, 14.0] | 10.0 [2.00, 19.0] | |
| Median NEW score | ||||
| Mean (SD) | 2.45 (1.47) | 2.22 (1.04) | 5.71 (2.36) | |
| Median [Min, Max] | 2.00 [0, 14] | 2.00 [0, 6.00] | 5.50 [1.00, 14.0] | |
| Laboratory tests | ||||
| Leukocytes count x10*9/L | ||||
| Mean (SD) | 8.09 (12.66) | 7.87 (12.7) | 11.1 (12.4) | |
| Median [Min, Max] | 6.84 [0.295, 406] | 6.73 [0.295, 406] | 9.31 [0.800, 173] | |
| Missing | 2 (0.1) | 2 (0.1) | 0 (0) | |
| Lymphocytes count x10*9/L | ||||
| Mean (SD) | 2.09 (10.44) | 2.10 (10.4) | 1.95 (10.8) | 0.836 |
| Median [Min, Max] | 1.3 [0, 367] | 1.35 [0.100, 367] | 0.655 [0, 161] | |
| Missing | 2 (0.1) | 2 (0.1) | 0 (0) | |
| Neutrophils count x10*9/L | ||||
| Mean (SD) | 5.25 (5.44) | 5.02 (5.42) | 8.33 (4.70) | |
| Median [Min, Max] | 4.61 [0.100, 288] | 4.50 [0.100, 288] | 7.79 [0.100, 28.4] | |
| Missing | 2 (0.1) | 2 (0.1) | 0 (0) | |
| CRP, mg/L | ||||
| Mean (SD) | 53.53 (50.68) | 48.9 (44.3) | 117 (81.0) | |
| Median [Min, Max] | 38.5 [0.160, 405] | 36.3 [0.160, 370] | 97.4 [1.09, 405] | |
| Missing | 10 (0.3) | 10 (0.3) | 0 (0) | |
| ALT, U/L | ||||
| Mean (SD) | 8.09 (12.66) | 58.7 (67.2) | 73.8 (292) | 0.413 |
| Median [Min, Max] | 6.84 [1.00, 3840] | 41.0 [2.00, 1950] | 30.0 [1.00, 3840] | |
| Missing | 98 (2.5) | 85 (2.4) | 13 (4.9) | |
| AST, U/L | ||||
| Mean (SD) | 53.73 (218.87) | 46.8 (38.8) | 152 (834) | 0.047 |
| Median [Min, Max] | 38 [4.00, 11900] | 37.0 [4.00, 975] | 53.0 [8.00, 11900] | |
| Missing | 111 (2,9) | 96 (2.7) | 15 (5.7) | |
|
Table 1, continued | ||||
|---|---|---|---|---|
| Total ( | Discharged patients ( | In-hospital death ( | ||
| Urea, | ||||
| Mean (SD) | 9.95 (25.25) | 9.13 (24.8) | 20.7 (29.0) | |
| Median [Min, Max] | 5.385 [0.650, 463] | 5.20 [0.650, 463] | 15.6 [3.00, 422] | |
| Missing | 160 (4.1) | 160 (4.4) | 0 (0) | |
| D-dimers, | ||||
| Mean (SD) | 925.67 (2619.57) | 767 (2130) | 3140 (5820) | |
| Median [Min, Max] | 450 [50.0, 80100] | 430 [50.0, 80100] | 1140 [145, 42100] | |
| Missing | 244 (6.3) | 223 (6.2) | 21 (8.0) | |
| IL-6, ng/L | ||||
| Mean (SD) | 74.34 (834.63) | 52.9 (451) | 420 (2930) | 0.083 |
| Median [Min, Max] | 27.4 [0.500, 40000] | 26.3 [0.500, 24000] | 66.2 [3.75, 40000] | |
| Missing | 550 (14.2) | 480 (13.3) | 70 (26.5) | |
| LDH, U/L | ||||
| Mean (SD) | 346.51 (400.43) | 330 (149) | 632 (1560) | 0.009 |
| Median [Min, Max] | 303 [80.0, 19900] | 300 [80.0, 3350] | 396 [159, 19900] | |
| Missing | 518 (13.4) | 440 (12.2) | 78 (29.5) | |
| BNP, ng/L | ||||
| Mean (SD) | 1072.58 (3853.36) | 786 (2930) | 5340 (9430) | |
| Median [Min, Max] | 176 [2.00, 41400] | 164 [2.00, 38200] | 1100 [10.0, 41400] | |
| Missing | 771 (19.9) | 702 (19.4) | 69 (26.1) | |
| Creatinine, | ||||
| Mean (SD) | 102.51 (116.7) | 96.3 (111) | 173 (149) | |
| Median [Min, Max] | 74 [19.6, 1380] | 72.5 [29.0, 1380] | 125 [19.6, 928] | |
| Missing | 864 (22.3) | 843 (23.3) | 21 (8.0) | |
| Ferritin, | ||||
| Mean (SD) | 826.53 (1238.76) | 772 (897) | 1610 (3370) | |
| Median [Min, Max] | 473 [0.200, 33000] | 461 [0.200, 14100] | 715 [0.200, 33000] | |
| Missing | 889 (22.9) | 821 (22.7) | 68 (25.8) | |
| Lactate. mmol/L | ||||
| Mean (SD) | 1.71 (0.95) | 1.63 (0.701) | 2.71 (2.26) | |
| Median [Min, Max] | 1.51 [0.370, 18.4] | 1.49 [0.370, 7.27] | 2.07 [0.850, 18.4] | |
| Missing | 1012 (26.1) | 956 (26.5) | 56 (21.2) | |
ALT – Alanine Aminotransferase AST – Aspartate Aminotransferase BNP: B-type Natriuretic Peptide CRP: C-Reactive Protein ICU: Intensive Care Unit IL-6: Interleukin-6 LDH: Lactate Dehydrogenase NEWS: National Early Warning Score WBC: White Blood Cell.
2.2NEWS score and its measurements during hospitalization
As a clinical tool used to assess the severity of a patient’s illness and determine their risk of deterioration, the NEWS is based on a set of physiological parameters, each assigned a score depending on their abnormality. These parameters include respiration rate, oxygen saturation, systolic blood pressure, heart rate, body temperature, level of consciousness. If a parameter falls within the normative range defined in the NEWS calculation chart [15, Fig. 1], it receives a score of 0. As the parameter deviates from the normative range, the score increases accordingly. The parameters’ scores are then added up to give the total NEWS score (0–20 points). The NEWS data utilized in the analysis were derived from the patient’s initial recorded NEWS values, representing the median of all documented NEWS scores available for each participant.
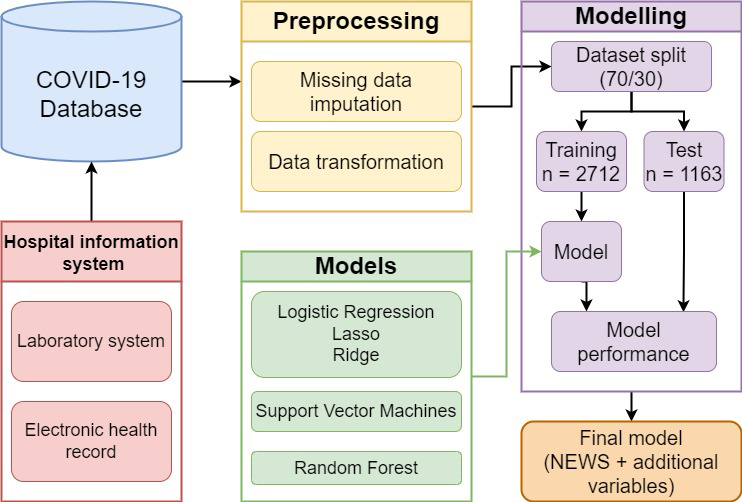
Figure 1.
Schematic representation of the models’ development workflow.
2.3Clinical and laboratory test data included for model development
Our dataset contained information about patients’ demographic data (age, sex), length of hospitalization, the status of having at least one chronic disease and intensive care needs during hospitalization.
In addition, we incorporated medians of laboratory test data obtained during the patients’ hospitalization period to assess and analyze their clinical parameters. Laboratory investigations were performed as part of daily medical care, and the recorded results were utilized for the purpose of this investigation. The laboratory investigations encompassed a comprehensive panel of tests, including inflammatory markers such as C-reactive protein (CRP), interleukin-6 (IL-6), lymphocytes, neutrophils, and white blood cell count (WBC), which were measured to evaluate the patients’ immune response and inflammatory status.
Furthermore, liver function tests including alanine aminotransferase (ALT) and aspartate aminotransferase (AST) were conducted to assess hepatic health, while renal function was evaluated through measurements of blood urea and creatinine levels.
In addition, blood-clotting status was assessed by measuring D-dimers, and lactate dehydrogenase (LDH) levels were used as a marker of cell damage. B-type natriuretic peptide (BNP) was included as an indicator of heart failure, and ferritin levels were measured to evaluate the presence of anaemia.
The inclusion of this comprehensive panel of laboratory tests allowed for a thorough investigation of the patients’ biochemical, haematological, and physiological profiles during their hospital stay, providing valuable insights into their overall health status and potential associations with clinical outcomes.
2.4Development of models
A detailed workflow of the models’ development process is shown in Fig. 1.
2.4.1Data preprocessing
For data preparation, medians were calculated for each patient’s laboratory measurements if there were more than one test for the patient during hospitalization. The total sample was randomly divided into training (
2.4.2Statistical and machine learning models
In model creation, we used outcomes stratification as following positive (in hospital death) and negative (discharge), a set of models was considered. It included logistic regression (LR), support vector machines (SVM) and random forest classifiers with optimized hyper-parameters. In the case of LR, regularized and non-regularized versions were considered with both L1 (lasso regression) and L2 (ridge regression) regularizations. Additionally, selection of variables by making use of Forward (F), Backward (B) and Stepwise (S) methods was (or was not) employed. In SVM’s case, the models with different kernels (linear, radial, polynomial and sigmoid) were tuned. Finally, in the case of RF, the best model search was based on selecting the maximal tree depth and the number of trees in the forest. R software (version 4.2.1) and R packages e1071, glmnet, MASS, random forest and stats were used for models’ development.
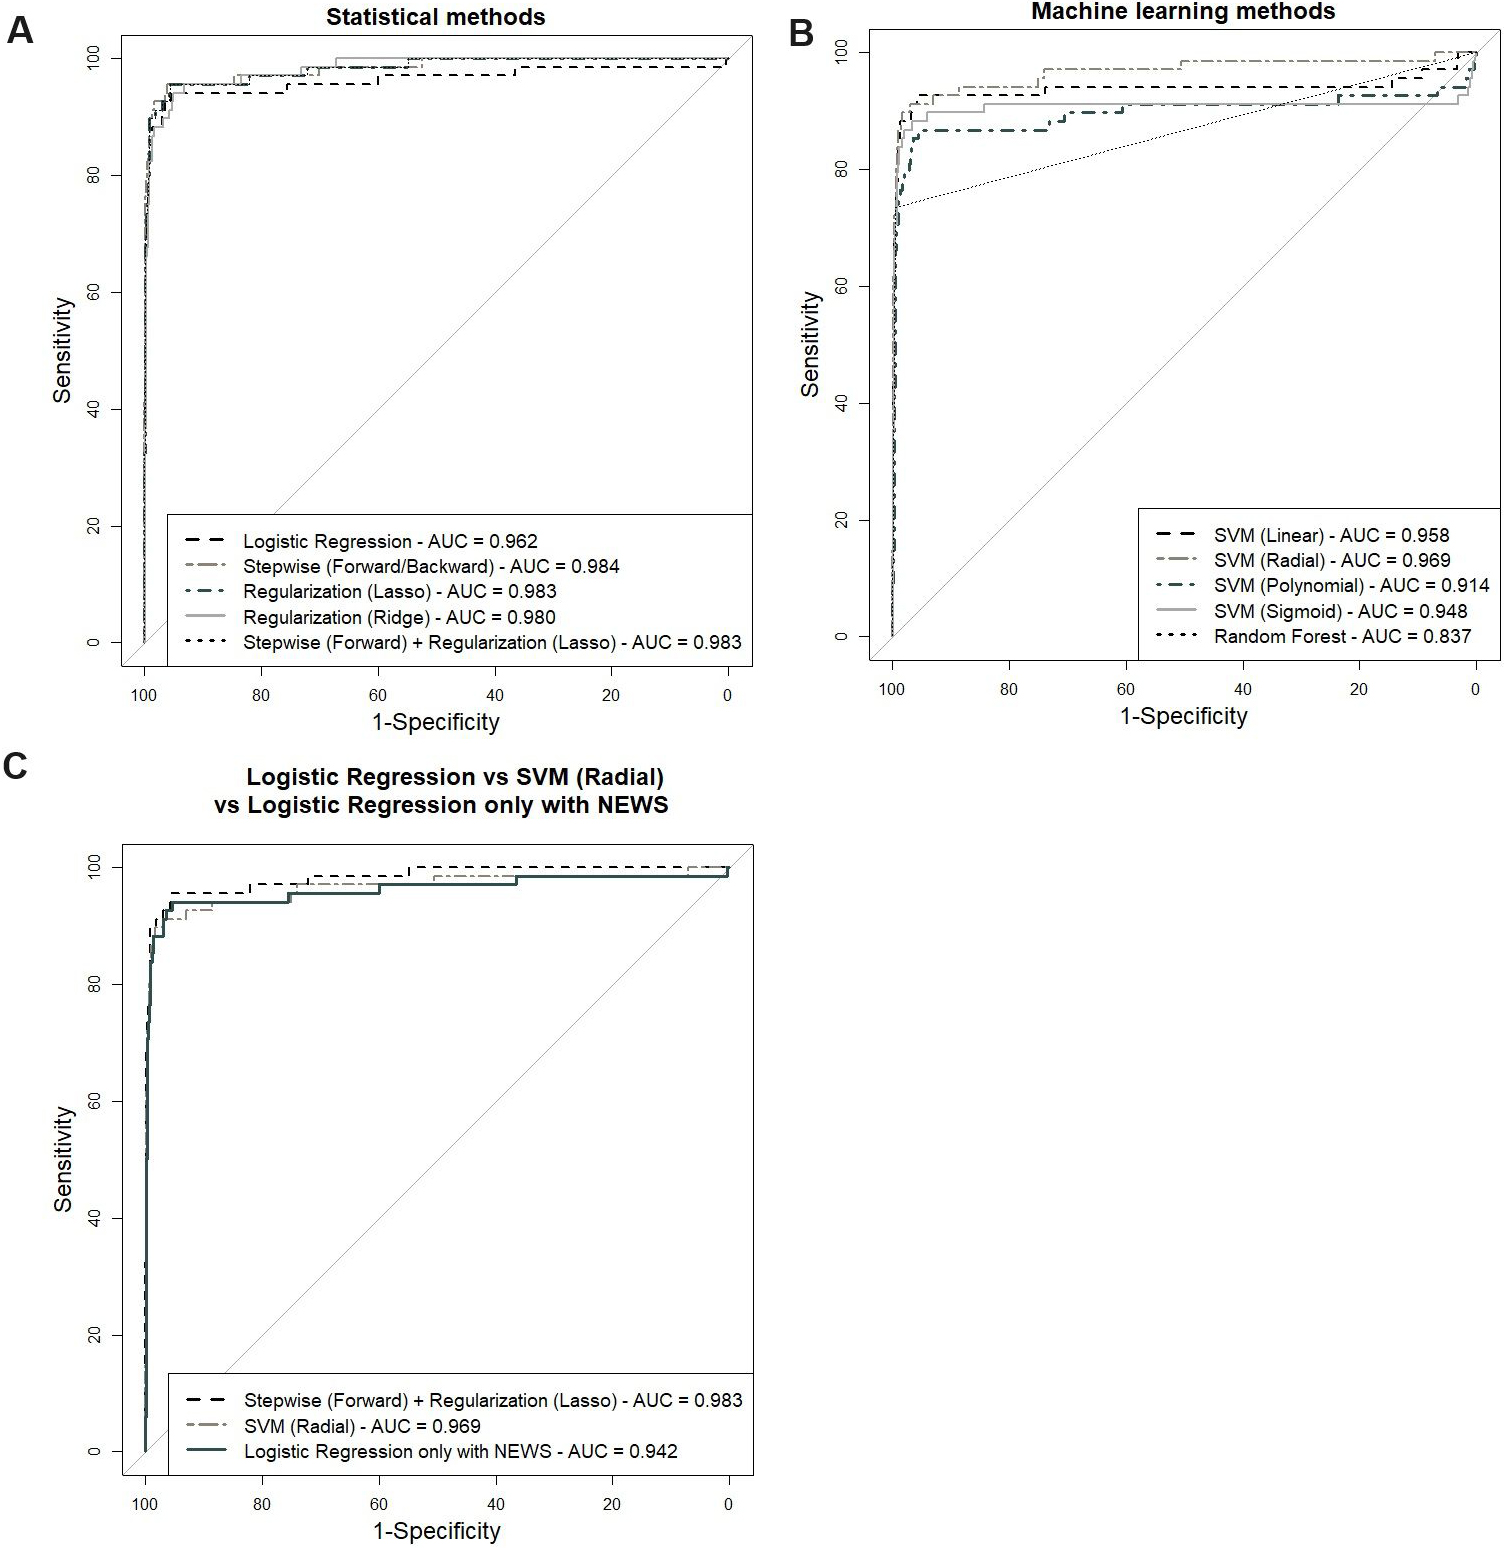
2.4.3Classification quality evaluation
Discrimination metrics (accuracy, sensitivity, specificity, positive predictive value, negative predictive value, F1-score) were calculated to assess classification discrimination abilities.
Additionally, a plot of the receiver operating characteristic (ROC) was plotted and an area under the ROC (AUC) was calculated for each model. The best model was selected using F1-score and AUC.
2.5Statistical analysis
The chi-square and Mann-Whitney
3.Results
Patients with positive outcome significantly differed from those with negative with respect to majority of characteristics (see Table 1; insignificant differences were observed only with respect to gender and two lab measurements).
Models’ quality was evaluated by making use of several common scoring metrics (for a full list see Subsection 2.7 and for complete numerical results are presented in Table 2). However, for ranking, we relied on F1 score and AUC. Concerning F1, the top three lines were as follows: stepwise logistic regression with L1 regularization (F1
Table 2
Comparison of results of statistical and machine learning models (NEWS
| Acc | Se | Sp | PPV | NPV | F1-score | AUC | |
|---|---|---|---|---|---|---|---|
| Logistic regression | 0.981 | 0.824 | 0.991 | 0.848 | 0.989 | 0.836 | 0.962 |
| Stepwise logistic regression | 0.984 | 0.794 | 0.995 | 0.915 | 0.987 | 0.850 | 0.984 |
| Logistic regression with L1 regularization (Lasso) | 0.982 | 0.838 | 0.991 | 0.851 | 0.99 | 0.844 | 0.983 |
| Logistic regression with L2 regularization (Ridge) | 0.979 | 0.809 | 0.989 | 0.821 | 0.988 | 0.815 | 0.98 |
| Stepwise logistic regression with L1 regularization (Lasso) | 0.984 | 0.853 | 0.992 | 0.866 | 0.991 | 0.859 | 0.983 |
| Support vector machine with linear kernel | 0.979 | 0.779 | 0.992 | 0.855 | 0.986 | 0.815 | 0.958 |
| Support vector machine with radial kernel | 0.985 | 0.779 | 0.997 | 0.946 | 0.986 | 0.855 | 0.969 |
| Support vector machine with polynomial kernel | 0.974 | 0.691 | 0.992 | 0.839 | 0.981 | 0.758 | 0.914 |
| Support vector machine with sigmoid kernel | 0.978 | 0.779 | 0.99 | 0.828 | 0.986 | 0.803 | 0.948 |
| Random forest | 0.979 | 0.676 | 0.997 | 0.939 | 0.98 | 0.786 | 0.837 |
Acc: accuracy Se: sensitivity Sp: specificity PPV: positive predictive value NPV: negative predictive value AUC: area under a receiver operating characteristic (ROC) curve
Table 3
Significant variables for logistic regression and final model with best performance measures
| Logistic regression | Stepwise logistic regression with L1 regularization (Lasso) | |
|---|---|---|
| Sex |
| |
| Age | *** | *** |
| ICU | *** | *** |
| First NEWS | * | *** |
| Median NEWS | *** | *** |
| At least one chronic disease |
| * |
| CRP | *** | *** |
| Ferritin | ||
| WBC | ||
| BNP | *** | *** |
| ALT | *** | *** |
| D-dimers | * |
|
| IL-6 | ||
| AST | *** | *** |
| Blood urea |
| ** |
| Neutrophils | ||
| Lymphocytes | ||
| WBC | ||
| Lactate | *** | *** |
| Creatinine | * | *** |
| LDH |
Since our goal was to contrast the single NEWS and NEWS’s predictive ability with variables, we have also built a logistic regression model based only on Median NEWS. The latter model had F1
Figure 2.
ROC curves of all models and best models: (A) logistic regression models, (B) machine learning models, (C) best models and single NEWS model.
4.Discussion
Based on our analysis, we can conclude that single Median NEWS has a high predictive ability when predicting in-hospital mortality. The results coincide with those obtained by other researchers who considered NEWS and NEWS2 for the same purpose [19, 20, 21, 22, 23, 24]. However, combined with other routinely taken measurements, the predictive value can increase even more. This is again in agreement with findings of others [19].
In our case, advanced Machine Learning models did not surpass commonly used logistic regression (LR). Several studies also report the same result [26, 27]. Since LR has an advantage of model-based interpretation of significance of variables employed in the model, it can be considered as a primary option for integrating NEWS into routine usage in a form of predictive models investigated by us. For this purpose, we are going to develop an enhanced version of the model suitable for predicting with incomplete data and integrate it into the hospital information system in a form of a dynamic Microsoft Power BI Report Server based webpage. In addition to the previously mentioned problem of incomplete data, there are other challenges to address within a frame of this task. The shortlist is as follows:
1) The present study aimed to investigate the suitability of NEWS for making generalized conclusions from data obtained during the whole hospitalization period. This usage of NEWS is valuable yet when moving to routine usage for monitoring and investigation of possible outcome for hospitalized patients in a short time of their stay, one has to rethink model building logic.
2) Since NEWS measurements are taken during the whole hospitalization period, one has to decide which one of these to use and how to combine them and with other routine measurements to get more reliable predictions of the severity of the outcome of the stay.
Summing up, our pilot study reveals several new directions of NEWS usage and poses new challenges. To our best knowledge, there are not many studies devoted to the analysis of NEWS as a measurement for making resumptive conclusions. Therefore, our input seems reasonable.
We hope that soon we’ll be able to make good use of NEWS in combination with other routine measurements both for monitoring purposes and for summarizing the whole in-hospital period as in the present study. This way, it will be possible to expand the present use of this score by practitioners and decision-makers.
4.1Study limitations
There are several aspects to consider when interpreting our findings.
First, not all hospitalized patients had NEWS measurements. Thus, the study population was limited to those who had it. The latter population excluded extreme cases (patients exhibiting excellent or critical overall clinical status) and mainly included those requiring constant monitoring.
Second, we used imputation before conducting our analysis. This way, we have tacitly modelled the case with no missing values. It would be beneficial to model the situation when predictions are made by making use of incomplete data. For this, one can design separate models for the imputation of missing values and then prediction. In this research, this scenario was not considered due to time constraint and is deferred for future research.
Third, there was a high disbalance in our data (the fraction of dead patients was 6.8%).
5.Conclusions
Our model demonstrated incremental value for COVID-19 patient’s status evaluation. The National Early Warning Score (NEWS) is a valuable tool to predict in-patient mortality and its performance can be enhanced more by combining it with other clinical data, such as age, ICU need, at least one chronic disease, CPB, BNP, ALT, AST, lactate, creatinine and urea. Machine learning techniques showed a reasonably high accuracy of models. Nevertheless, logistic regression models remain compelling, especially when using the regularization approach. Incorporating the NEWS into hospitals may be a good option for monitoring purposes. However, processing incomplete data in a real-world setting is essential for optimal results and needs more attention in future studies.
Ethics statement
The research was authorized by the Vilnius Regional Biomedical Research Ethics Committee (permission no. 2022/2-1411-882). Personal patient consent was not required since anonymized data was used.
Data availability statement
The data presented in this study are available from the authors upon reasonable request, following institutional approval.
Author contributions
Conceptualization: V.L., R.P., G.T., G.B. and A.J.; Methodology: V.L., R.P., V.S., G.T., G.B., E.K.; Software: V.L.; Validation: G.T.; Formal analysis: V.L.; Visualization: V.L., R.P., G.T. and J.T.; Interpretation of the results: V.L., R.P., P.N., V.S.; Data curation: V.L., R.P. and G.T.; Supervision: J.T., G.B., E.K. and A.J.; Writing original draft preparation: V.L., R.P., V.S., P.N. and G.T. All authors have read and agreed to the published version of the manuscript.
Acknowledgments
The authors thank colleagues from the Information Systems Department of Vilnius University Hospital Santaros Klinikos, especially Paulius Ulbinas, for their help with preparing the database.
Conflict of interest
The authors declare no conflict of interest.
References
[1] | Department of Medicine, Foundation University Medical College, Foundation University, DHA Phase 1 Islamabad, Pakistan, Jamil Z, Samreen S, Foundation University Medical College, Foundation University, DHA Phase 1 Islamabad, Pakistan, Mukhtar B, Foundation University Medical College, Foundation University, DHA Phase 1 Islamabad, Pakistan, Khaliq M, Foundation University Medical College, Foundation University, DHA Phase 1 Islamabad, Pakistan, Abbasi SM, Fauji Foundation Hospital, Rawalpindi, Pakistan, et al. The Clinical Implementation of NEWS, SOFA, and CALL Scores in Predicting the In-Hospital Outcome of Severe or Critical COVID-19 Patients. Eurasian J Med. (2022) ; 54: : 231-218. doi: 10.5152/eurasianjmed.2021.21149. |
[2] | Prasad PA, Correia J, Fang MC, Fisher A, Correll M, Oreper S, Auerbach A. Performance of point-of-care severity scores to predict prognosis in patients admitted through the emergency department with COVID-19. Journal of Hospital Medicine. (2023) ; 18: : 413-423. doi: 10.1002/jhm.13106. |
[3] | Hoseini B, Rahmatinejad Z, Reihani H, Hanna AA, Pourmand A, Tabatabaei SM, Rahmatinejad F, Eslami S. Comparison of Six Scoring Systems for Predicting In-hospital Mortality among Patients with SARS-COV2 Presenting to the Emergency Department. Indian Journal of Critical Care Medicine. (2023) ; 27: : 416-425. doi: 10.5005/jp-journals-10071-24463. |
[4] | As AK, Erdolu B, Duman B, Yazgan E, Eris C, Aydin U, Ata Y, Sengoren Dikis O, Türk T. Can a modified-simplified pulmonary embolism severity index (m-sPESI) be used to predict the need for intensive care in hospitalized COVID-19 patients? J Thromb Thrombolysis. (2021) ; 52: : 759-765. doi: 10.1007/s11239-021-02405-7. |
[5] | Neves FF, Pott-Junior H, Yamashita KMC, De Sousa Santos S, Cominetti MR, De Melo Freire CC, Cunha AFD, Jordão Júnior AA. Do the oxidative stress biomarkers predict COVID-19 outcome? An in-hospital cohort study. Free Radical Biology and Medicine. (2023) ; 207: : 194-199. doi: 10.1016/j.freeradbiomed.2023.06.026. |
[6] | Cugnata F, Scarale MG, De Lorenzo R, Simonini M, Citterio L, Querini PR, Castagna A, Di Serio C, Lanzani C. Profiling Covid-19 patients with respect to level of severity: an integrated statistical approach. Sci Rep. (2023) ; 13: : 5498. doi: 10.1038/s41598-023-32089-3. |
[7] | Li C, Wang K, Wu L, Song B, Tan J, Su H. Prehospital physiological parameters related illness severity scores can accurately discriminate the severe/critical state in adult patients with COVID-19. Annals of Medicine. (2023) ; 55: : 2239829. doi: 10.1080/07853890.2023.2239829. |
[8] | Del Toro-Cisneros N, Berman-Parks N, Uribe-Pérez A, Caballero-Islas AE, Vega-Vega O. A modified renal angina index in critically ill patients with COVID-19. Renal Failure. (2023) ; 45: : 2205958. doi: 10.1080/0886022X.2023.2205958. |
[9] | Subbe CP. Validation of a modified Early Warning Score in medical admissions. QJM. (2001) ; 94: : 521-526. doi: 10.1093/qjmed/94.10.521. |
[10] | Monaghan A. Detecting and managing deterioration in children: Alan Monaghan describes how the introduction of a critical care outreach service and a Paediatric Early Warning Score improved management of acutely ill children. Paediatric Care. (2005) ; 17: : 32-35. doi: 10.7748/paed2005.02.17.1.32.c964. |
[11] | Vincent J-L, Moreno R, Takala J, Willatts S, De Mendonça A, Bruining H, Reinhart CK, Suter PM, Thijs LG. The SOFA (Sepsis-related Organ Failure Assessment) score to describe organ dysfunction/failure: On behalf of the Working Group on Sepsis-Related Problems of the European Society of Intensive Care Medicine (see contributors to the project in the appendix). Intensive Care Med. (1996) ; 22: : 707-710. doi: 10.1007/BF01709751. |
[12] | Seymour CW, Liu VX, Iwashyna TJ, Brunkhorst FM, Rea TD, Scherag A, Rubenfeld G, Kahn JM, Shankar-Hari M, Singer M, et al. Assessment of Clinical Criteria for Sepsis: For the Third International Consensus Definitions for Sepsis and Septic Shock (Sepsis-3). JAMA. (2016) ; 315: : 762. doi: 10.1001/jama.2016.0288. |
[13] | Cowen ME, Strawderman RL, Czerwinski JL, Smith MJ, Halasyamani LK. Mortality predictions on admission as a context for organizing care activities. Journal of Hospital Medicine. (2013) ; 8: : 229-235. doi: 10.1002/jhm.1998. |
[14] | Knaus WA, Draper EA, Wagner DP, Zimmerman JE. APACHE II: A severity of disease classification system. Critical Care Medicine. (1985) ; 13: : 818-829. doi: 10.1097/00003246-198510000-00009. |
[15] | Smith GB, Prytherch DR, Meredith P, Schmidt PE, Featherstone PI. The ability of the National Early Warning Score (NEWS) to discriminate patients at risk of early cardiac arrest, unanticipated intensive care unit admission, and death. Resuscitation. (2013) ; 84: : 465-470. doi: 10.1016/j.resuscitation.2012.12.016. |
[16] | Lee YS, Choi JW, Park YH, Chung C, Park DI, Lee JE, Lee HS, Moon JY. Evaluation of the efficacy of the National Early Warning Score in predicting in-hospital mortality via the risk stratification. Journal of Critical Care. (2018) ; 47: : 222-226. doi: 10.1016/j.jcrc.2018.07.011. |
[17] | Capan M, Ivy JS, Rohleder T, Hickman J, Huddleston JM. Individualizing and optimizing the use of early warning scores in acute medical care for deteriorating hospitalized patients. Resuscitation. (2015) ; 93: : 107-112. doi: 10.1016/j.resuscitation.2014.12.032. |
[18] | Buuren SV, Groothuis-Oudshoorn K. mice: Multivariate Imputation by Chained Equations in R. J Stat Soft. (2011) ; 45: . doi: 10.18637/jss.v045.i03. |
[19] | Covino M, De Matteis G, Burzo ML, Russo A, Forte E, Carnicelli A, Piccioni A, Simeoni B, Gasbarrini A, Franceschi F, et al. Predicting In-Hospital Mortality in COVID-19 Older Patients with Specifically Developed Scores. J Am Geriatr Soc. (2021) ; 69: : 37-43. doi: 10.1111/jgs.16956. |
[20] | Alencar J, Marina Gómez Gómez L, Cortez AL, Possolo De Souza H, Levin AS, Salomão MC. Performance of NEWS, qSOFA, and SIRS Scores for Assessing Mortality, Early Bacterial Infection, and Admission to ICU in COVID-19 Patients in the Emergency Department. Front Med. (2022) ; 9: : 779516. doi: 10.3389/fmed.2022.779516. |
[21] | Myrstad M, Ihle-Hansen H, Tveita AA, Andersen EL, Nygård S, Tveit A, Berge T. National Early Warning Score 2 (NEWS2) on admission predicts severe disease and in-hospital mortality from COVID-19 – a prospective cohort study. Scand J Trauma Resusc Emerg Med. (2020) ; 28: : 66. doi: 10.1186/s13049-020-00764-3. |
[22] | Citu C, Gorun F, Motoc A, Ratiu A, Gorun OM, Burlea B, Neagoe O, Citu IM, Rosca O, Bratosin F, et al. Evaluation and Comparison of the Predictive Value of 4C Mortality Score, NEWS, and CURB-65 in Poor Outcomes in COVID-19 Patients: A Retrospective Study from a Single Center in Romania. Diagnostics. (2022) ; 12: : 703. doi: 10.3390/diagnostics12030703. |
[23] | Pokeerbux MR, Yelnik CM, Faure E, Drumez E, Bruandet A, Labreuche J, Assaf A, Goffard A, Garabedian C, Poissy J, et al. National early warning score to predict intensive care unit transfer and mortality in COVID-19 in a French cohort. Int J Clin Pract. (2021) ; 75: . doi: 10.1111/ijcp.14121. |
[24] | Martín-Rodríguez F, Sanz-García A, Ortega GJ, Delgado-Benito JF, García Villena E, Mazas Pérez-Oleaga C, López-Izquierdo R, Castro Villamor MA. One-on-one comparison between qCSI and NEWS scores for mortality risk assessment in patients with COVID-19. Annals of Medicine. (2022) ; 54: : 646-654. doi: 10.1080/07853890.2022.2042590. |
[25] | Akdur G, Daş M, Bardakci O, Akman C, Sıddıkoğlu D, Akdur O, Akçalı A, Erbaş M, Reşorlu M, Beyazit Y. Prediction of mortality in COVID-19 through combing CT severity score with NEWS, qSOFA, or peripheral perfusion index. The American Journal of Emergency Medicine. (2021) ; 50: : 546-552. doi: 10.1016/j.ajem.2021.08.079. |
[26] | Ma X, Ng M, Xu S, Xu Z, Qiu H, Liu Y, Lyu J, You J, Zhao P, Wang S, et al. Development and validation of prognosis model of mortality risk in patients with COVID-19. Epidemiol Infect. (2020) ; 148: : e168. doi: 10.1017/S0950268820001727. |
[27] | Sánchez-Montañés M, Rodríguez-Belenguer P, Serrano-López AJ, Soria-Olivas E, Alakhdar-Mohmara Y. Machine Learning for Mortality Analysis in Patients with COVID-19. IJERPH. (2020) ; 17: : 8386. doi: 10.3390/ijerph17228386. |


