
Estimation of the knee joint load using plantar pressure data measured by smart socks: A feasibility study
Abstract
BACKGROUND:
Unsupervised sports activities could cause traumas, about 70% of them are those of the low extremities. To avoid traumas, the athlete should be aware of dangerous forces acting within low extremity joints. Research in gait analysis indicated that plantar pressure alteration rate correlates with the gait pace. Thus, the changes in plantar pressure should correlate with the accelerations of extremities, and with the forces, acting in the joints. Smart socks provide a budget solution for the measurement of plantar pressure.
OBJECTIVE:
To estimate the correlation between the plantar pressure, measured using smart socks, and forces, acting in the joints of the lower extremities.
METHODS:
The research is case study based. The volunteer performed a set of squats. The arbitrary plantar pressure-related data were obtained using originally developed smart socks with embedded knitted pressure sensors. Simultaneously, the lower extremity motion data were recorded using two inertial measurement units, attached to the tight and the ankle, from which the forces acted in the knee joint were estimated. The simplest possible model of knee joint mechanics was used to estimate force.
RESULTS:
The estimates of the plantar pressure and knee joint forces demonstrate a strong correlation (
CONCLUSION:
The results demonstrate the feasibility of the smart socks for the estimation of the forces in the knee joints. Smart socks therefore could be used to develop excessive joint force alert devices, that could replace less convenient inertial sensors.
1.Introduction
Discussing the positive effect of physical activity on human health, one should always consider potential injuries. Among all sport-related traumas, lower extremity injuries account for 66–73% and are the most widespread [1, 2]. From these, knee injuries take 10–25% of all traumas [3]. The damage to the musculoskeletal structures could both lead to acute conditions, such as anterior cruciate ligament rupture or meniscal tears, and provoke degenerative diseases, like joint osteoarthritis or Achilles tendinopathy [4]. The reason for the damage is increased mechanical strain in the muscular and joint tissues, and the resulting disabilities and treatment costs are obvious [4]. The approach used so far to prevent injuries implies various training programs, such as FIFA11
The alternative approach implies the estimation of the joint load during the training. This is especially important for amateur sportsmen, as they often are training without supervision by a coach, but is relevant for professional sportsmen, too. With the increase in fatigue, in addition to the reduction in dexterity and accuracy of motion, an athlete loses the “sense of force” [8], hence he or she could not notice overloading. Biomechanical measurements directly demonstrate an increase in such parameters, as knee joint peak flexion and abduction moments, maximum horizontal ground reaction force, valgus moment, etc. [9]. Therefore, the monitoring of the joint forces during training could become a useful tool for prevention of lower limb injuries.
The direct measurement of the joint forces in vivo is a highly invasive procedure that requires the insertion of miniaturized force sensors directly in the joint [10] and obviously is not suitable for “in-field” sports applications. The alternative is the calculation of the joint forces on the base of the lower limb biomechanical model [4, 11, 12, 13]. The input data for the model are obtained using the motion capture technique and include results of kinematic (linear and angular velocities) and dynamic (reaction forces) measurements. The forces of interest are then calculated, using e.g., the inversion dynamic approach [14]. Recently, the machine learning approach was used, too [15]. Hence, there are two prerequisites for the development of joint force monitoring devices: the wearable motion capture technology, which provides kinematic and dynamic data on athlete motion, and the computational model, which enables the calculation of the forces from the measured data. This approach is widely discussed in the literature (see, e.g. [4, 16]).
The various design approaches and examples of wearable motion capture systems may be found both in the literature [17, 18, 19] and on the market [20, 21]. Mostly, such systems are based on inertial measurement units (IMU) and could be equipped with insoles or shoes to measure ground reaction force. IMU-based systems provide accurate data on human limb motion kinematics and dynamics and generally are suitable for the in-field environment.
An important problem with wearable devices is user compliance. Research, made in various fields of wearable use demonstrated a dropout rate of about 20–25% within the first three months and about 50–84% within 1–1.5 years [22, 23]. In some short-term studies, dropout rates reached up to 75% within the first two months (see review in [22]). Among factors that influence the user adherence to the device, ease of use, comfort, and unobtrusiveness play an important role [24]. From this point of view, the complexity and cost of advanced IMU-based systems could prevent their routine use, especially by amateur sportsmen. In addition, some full-body IMU suits are often made from synthetic materials and are uncomfortable causing excessive sweating.
To summarize, there is a need for a cost-effective and simple solution to monitor limb joint forces in sports exercises. A possible approach is the use of so-called “smart socks”, i.e., socks, equipped with plantar pressure measurement sensors and data acquisition system. Various models of such socks are both commercially available [25] and described in the literature [26, 27, 28, 29]. The reason to use plantar pressure measuring socks as a tool for the estimation of joint forces is a relationship between plantar pressure and different kinematic motion parameters, such as knee flexion angles [30], foot joint flexion angles [31], gait cadence [32] and speed [33]. An association between running speed and plantar pressure distribution pattern was reported, as well [34]. At a higher walking speed, there are faster changes in both the limb motion velocity and plantar pressure. As the change in velocity over unit time is, in fact, acceleration, one could hypothesize that the changes in plantar pressure should correlate with the limb accelerations and, therefore, with dynamic forces acting on the joints. At the same time, it cannot be ruled out that there could be a correlation between joint forces and other parameters of plantar pressure signal waveform (amplitude, time parameters, etc.).
The objective of the present preliminary research is to evaluate the feasibility of the proposed hypothesis. The research is limited to the case study of the correlation between the forces acting on the knee joint and parameters of the plantar pressure waveforms, measured using smart socks with integrated stress sensors.
2.Materials and methods
2.1Smart socks and data acquisition module
The research used dAid smart socks and data acquisition modules, developed at Riga Technical University [29, 35]. The socks (Fig. 1a) have six knitted resistive sensors, positioned on the foot plantar surface when the socks are on (Fig. 2b). The sensors and conductive traces are knitted using conductive yarn and integrated into the sock directly during the manufacturing process. The conductivity of the sensors increases with applied pressure. The traces are connected to the originally designed data acquisition module (Fig. 1c) using the snap button-ended wires. The data acquisition module enables simultaneous connection of 8 resistive sensors (although only 6 of them were used). Sensor resistance is measured using the calibrated current injection method. The resulting voltage drop is converted using 10-bit ADC and converted to resistance; the resistance measurement range could be adjusted from 2 kOhms up to 1024 kOhms. Alongside this, the module is equipped with an embedded 6D IMU, that enables the measurement of linear and angular acceleration. The module data acquisition rate is about 160 s
Figure 1.
Pair of dAid smart socks with knitted sensors marked by numbers (a); typical position of sensors over the foot plantar surface (b); data acquisition module (c).
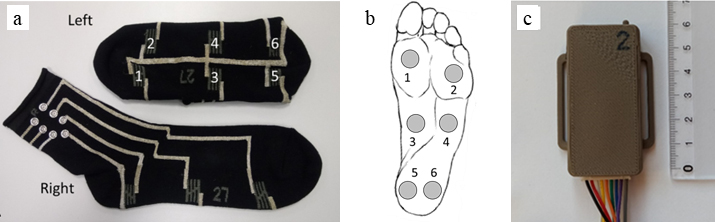
Figure 2.
Experimental setup: Position of the ankle (a) and tight (b) modules, initial position for measurements (c).
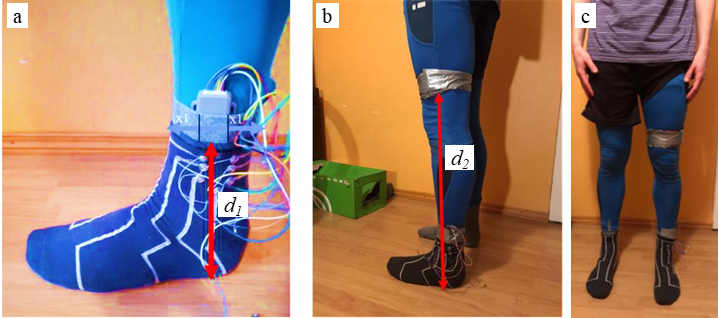
The experimental setup included a smart sock and two data acquisition modules (Fig. 2). Within the scope of the present paper, measurements were made on the subject’s left leg only. The first module was attached to the lateral surface of the subject’s ankle at the distance
The modules did not have a synchronization option. To synchronize the tight and ankle modules, a sharp stomp was made at the beginning of each data recording. Then the acceleration waveforms, recorded by each module were used to check the synchronization of the modules and upon necessity align the waveforms manually, using the stomp-related spike as an alignment landmark. The inaccuracy of alignment was within one data point or 6 ms.
The recorded waveforms were digitally filtered using 2
2.2The exercise
The research was conducted, involving only one volunteer subject – one of the authors of the research. The subject got into the starting position, then performed a series of 10 squats. The subject was instructed to perform squats as naturally as possible, trying to perform them at a similar depth, as well as perform squats steadily, without rapid acceleration. The exercise was performed barefoot. The series was repeated three times. In parallel to the data recording, all measurements were recorded on video – this visual information facilitated the process of result analysis.
2.3The biomechanical model and calculation of moments and forces
The present study is limited to the analysis of motion in the plane, which coincides with the x-y plane of IMU. Any motion in the lateral, or z-axis direction, as well as rotation of tight and calf around their longitudinal axes, are ignored. All exercises were designed in a manner that the subject moved only along a straight line, with the movement of each segment being tracked along the x-y plane. For the squat motion, the tight and calf were considered as being coplanar all squat time. Figure 3a presents the geometry of the lower limb, where the height of the ankle
Figure 3.
Geometry of the leg model for the squat exercise (a); the relation between IMU and global coordinate systems (b). The segments of the leg are the height of the ankle
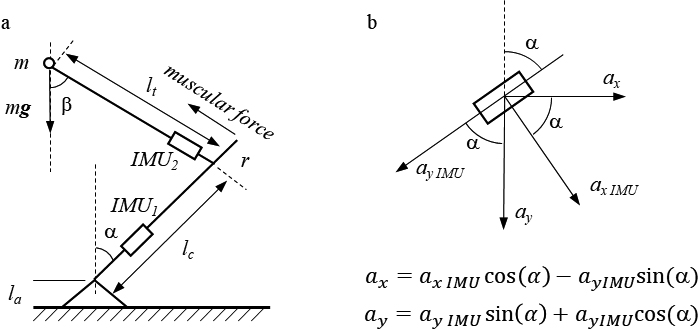
The angular position of the calf and tight were described by declination from the plumb line, measured by the angles
The calculation of forces was made using the model (Fig. 3a), based on the simplified inverse dynamic approach [14]. As the subject made squats slowly, the tight was considered as being in quasi-equilibrium. The loading mass
(1)
Using this model, the knee torque and force were calculated for all squat duration.
The parameters of the subject, involved in the research were: body mass 86 kg, the height of the ankle
2.4The plantar pressure estimation
In the scope of the present research, the plantar pressure was not calculated. Instead, the values of reciprocal readouts of the sock sensors were used. These reciprocal values, measured in kOhm
The research used data from metatarsal sensors, middle sensor, and heel sensors (sensors 1, 2, 4, 5, 6, Fig. 1a). Sensor 3, placed under the foot ark, was excluded, as it was not loaded during barefoot exercises. The sum of the reciprocal readouts from all five sensors was used to detect foot contact instances in walking/running tasks and separate stance phase waveforms.
3.Results
3.1Correlation between knee joint force and sock sensor data
Figure 4.
The typical waveforms of the estimated knee joint force (top) and average reciprocal sock sensors readout (bottom) for a series of squats.
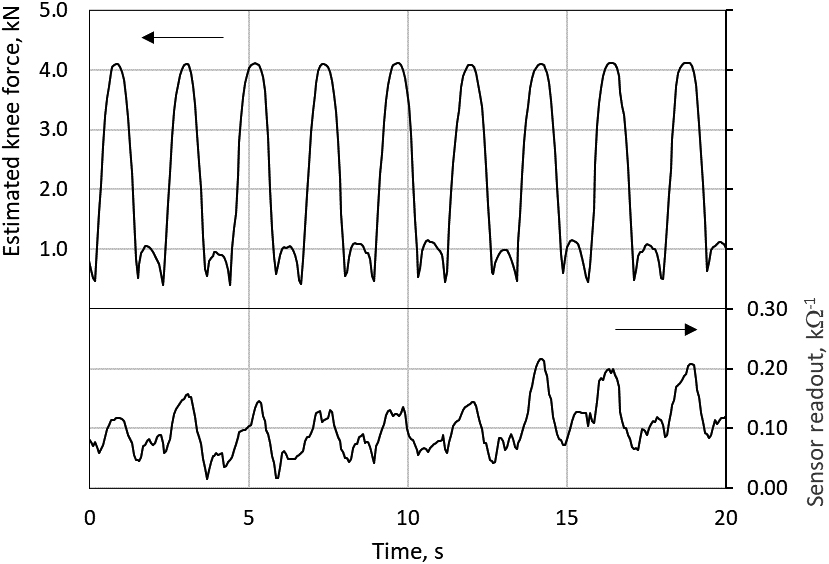
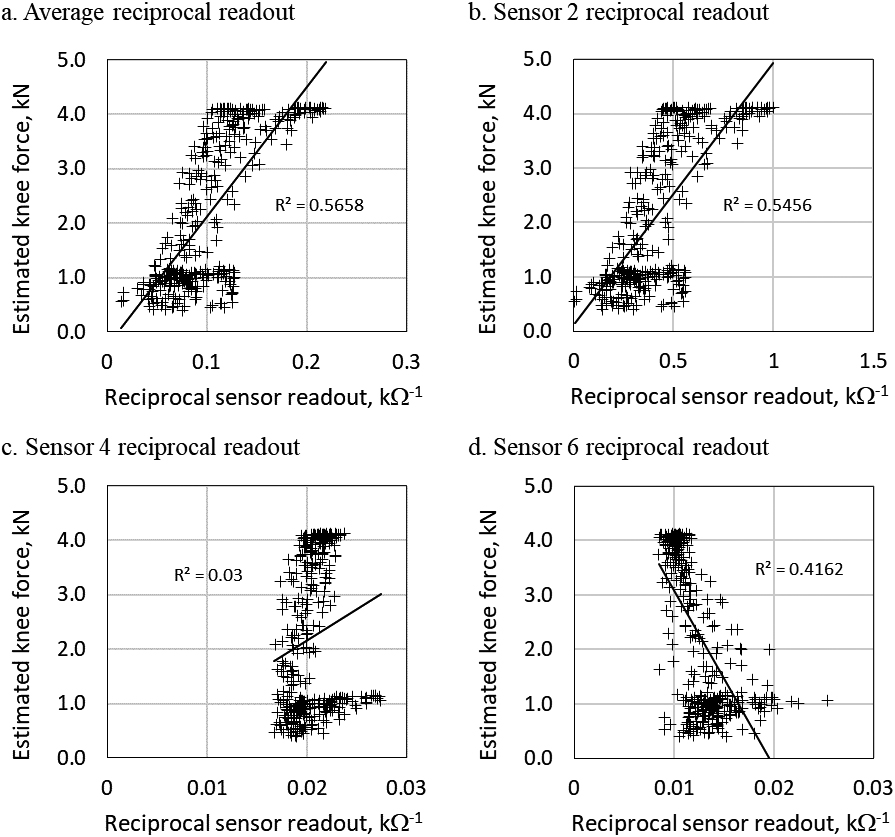
Figure 4 represents the typical waveforms of the estimated knee joint forces and reciprocal sock sensor readouts in a series of squats. The calculated knee joint force ranged from about 0.5 kN at the beginning of the squat (i.e. in the start position) to 4 kN at the maximal squat depth. These values correspond to the range of 0.58 to 4.6 body weights (BW) and, generally are close to data, reported in the literature for squatting [10]and high-risk dynamic tasks [38], and are reasonably higher, than forces, reported for walking/running [15]. The force maximums generally coincided with the sensor readouts, and hence, with plantar pressure maximums. The readout, presented in Fig. 4. is an average of five sensors waveforms. Analysis of the recordings of each individual sensor revealed that not all sensor waveforms exhibit clear congruence with the force waveform, as the averaged data do. The best coincidence was found for the lateral toe sensor (sensor 2, Fig. 1b). The coincidence between waveforms was evaluated both graphically and numerically. Figure 5 shows correlation diagrams between knee joint force and readouts of some sensors. The diagrams reveal a moderate knee joint force association with averaged sensors data and data from the lateral toe sensor (sensor 2), but poor correlation with, e.g., medial and heel sensors (sensors 4 and 6). The correlation coefficients, summarized in Table 1, endorse this observation. These (Pearson) correlation coefficients were calculated for each sensor and for each squat series. The
Table 1
Correlation coefficients between estimated knee joint force and reciprocal sensor readouts for three 10-squat series. For all coefficients, the
| Sensor | Measurement series | ||
|---|---|---|---|
| 1 set | 2 set | 3 set | |
| 1 | 0.55 | 0.45 | 0.47 |
| 2 | 0.74 | 0.74 | 0.79 |
| 4 | 0.17 | 0.52 | 0.25 |
| 5 | 0.55 | 0.67 | 0.59 |
| 6 | |||
| Average | 0.75 | 0.75 | 0.80 |
Figure 5.
The correlation diagram for the estimated knee joint force and reciprocal data of the selected sensors: a) averaged data; b) toe lateral sensor (Sensor 2); c) middle lateral sensor (Sensor 4); d) heel lateral sensor (Sensor 6).
3.2Linear regression model
Table 2
Linear regression coefficients for the estimation of the knee joint force
| Measurement series | A model with b | A model with b | |||
|
|
| ||||
| kN | kN | kN | |||
| Series 1 | 23.8 | 0.57 | 21.7 | 0.88 | |
| Series 2 | 21.3 | 0.56 | 19.4 | 0.87 | |
| Series 3 | 23.8 | 0.72 | 19.1 | 0.91 | |
| All data | 21.9 | 0.57 | 19.5 | 0.88 | |
A simple mathematical model for the prediction of knee joint force was built using linear regression. Two models were considered: one with non-zero intercept, and another with zero intercept. The model was constructed for each squat series separately and for the merged together data from all series. Table 2 summarizes the parameters of the models. For all models, either with zero or non-zero intercept, the model coefficients are significant at the level of 0.05: the
(2)
where
Figure 6.
Linear regression approximation for the estimated knee joint force (a) and corresponding Bland-Altman plot (b).
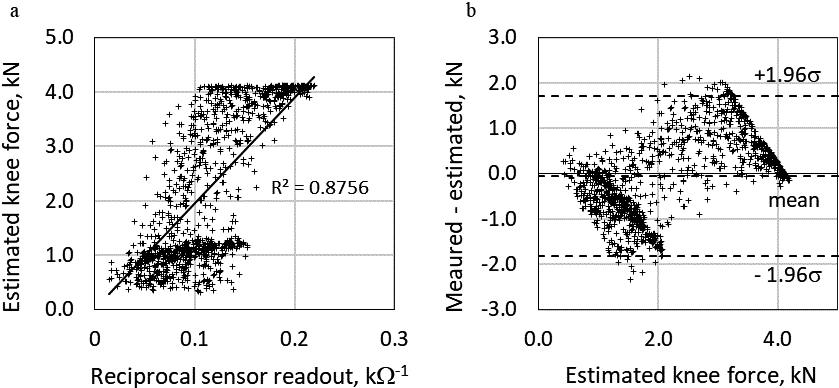
Figure 6a shows the linear model in comparison with the scattering diagram knee joint force – sensor readouts. Despite the rather high
3.3The overload detection
Table 3
Contingency table for the excessive force test
| Predicted knee force | |||
|---|---|---|---|
| Observed knee force | Total | ||
| 829 | 0 | 829 | |
| 200 | 90 | 290 | |
| Total | 1029 | 90 | 1119 |
To simulate the detection of the extremely high forces, the developed linear model (Eq. (2)) was used to design an overload test. The force equal to the 0.9 of the maximal observed force 4.1 kN was chosen as a threshold. If the force, calculated from Eq. (2), exceeded the threshold, the test was considered as positive – overload was detected. The prediction of the linear model was compared with actual knee joint force values, classified using the same principle. The 2x2 contingency table of the test is presented in Table 3. The resulting parameters of the tests are sensitivity 0.31, and specificity 1.00. The total accuracy of the test, measured as the ratio of the total number of correct predictions (either positive or negative) to the total number of cases, was 0.82. Such parameters mean that the test could detect about 31% of all overload cases, but never generates false alert. Bearing in mind the nature of physical exercises that are repeated for a long time, such a low sensitivity still is acceptable. As the potential purpose of the perspective alert system is to prevent long-term overload, even with low sensitivity, the athlete will be sooner or later alerted about excessive training. For instance, during running, the alert comes at each third step, on average.
4.Discussion
The obvious limitation of the presented study is the use of the two-dimensional model of lower extremity. Generally, two-dimensional models provide lower accuracy as compared with three-dimensional ones [13], alongside, use of two-dimensional models excludes from consideration such intrinsically three-dimensional movements as cutting maneuvers, typical for sport games.
Despite of this limitation, the obtained characteristics of the relationship between estimated knee joint forces and reciprocal sensors readouts
The obtained pilot results indicated some potential of the smart socks systems as a possible tool for the estimation of joint forces and development of the sportsmen overload detection applications, as there is a strong correlation between the readouts of the socks sensors and forces, acted in the limb joints. The attractiveness of this approach is in a great extent related to the cost-effectiveness of the knitted smart socks, that could make them available to the broad community of amateur sportsmen. Unfortunately, the present pilot case study demonstrated rather poor force prediction accuracy. The way to increase the prediction value of the system could be related to the use of neural network for the sock data analysis. This approach was already described in the literature [37]. On the other hand, application of the neural network requires remarkable computational power, that could complicate the design of the device. Therefore, other methods of data processing should be tested in future.
Another important limitation of the present work is its case study nature. The research was based on one subject only, performing one type of exercise. To estimate the feasibility of the proposed approach in a greater scope, the involvement of more subjects and widening of the exercise area is of critical importance. The most attractive is to test the socks system ability to predict overload during walking and running.
5.Conclusion
The present paper demonstrated limited feasibility of the smart sock system for the estimation of the forces in the knee joint. Despite low force prediction accuracy, the proposed smart socks can detect excessive knee joint forces, and hereby could be used for the development of the excessive joint force alert device, that could replace less convenient inertial sensors.
Acknowledgments
This work used devices and software developed in the framework of the European Regional Development Fund Project “Synthesis of textile surface coating modified in nano-level and energetically independent measurement system integration in smart clothing with functions of medical monitoring” (agreement no. 1.1.1.1/16/A/020).
Conflict of interest
None to report.
References
[1] | Hootman JM, Dick R, Agel J. Epidemiology of collegiate injuries for 15 sports: Summary and recommendations for injury prevention initiatives. J Athl Train. (2007) ; 42: (2): 311-9. |
[2] | Rezasoltani Z, Dehghan F, Azizan A, Dadarkhah A, Yadegarian F. The frequency of knee-joint injuries caused by sports activities among the armed forces personnel. J Arch Mil Med. (2016) ; 4: (4): e38447. doi: 10.5812/jamm.38447. |
[3] | Donnell-Fink LA, Klara K, Collins JE, Yang HY, Goczalk MG, Katz JN, et al. Effectiveness of knee injury and anterior cruciate ligament tear prevention programs: A meta-analysis. Zhao C, editor. PLoS ONE. (2015) ; 10: (12): e0144063. doi: 10.1371/journal.pone.0144063. |
[4] | Lloyd D. The future of in-field sports biomechanics: wearables plus modelling compute real-time in vivo tissue loading to prevent and repair musculoskeletal injuries. Sports Biomech. (2021) Sep 8; 1-29. doi: 10.1080/14763141.2021.1959947. |
[5] | Silvers-Granelli H, Mandelbaum B, Adeniji O, Insler S, Bizzini M, Pohlig R, et al. Efficacy of the FIFA 11+ injury prevention program in the collegiate male soccer player. Am. J. Sports Med. (2015) ; 43: (11): 2628-37. doi: 10.1177/0363546515602009. |
[6] | Lindblom H, Sonesson S, Forslind J, Waldén M, Hägglund M. Implementation of the injury prevention exercise programme Knee Control |
[7] | Herman K, Barton C, Malliaras P, Morrissey D. The effectiveness of neuromuscular warm-up strategies, that require no additional equipment, for preventing lower limb injuries during sports participation: A systematic review. BMC Med. (2012) ; 10: : 75. doi: 10.1186/1741-7015-10-75. |
[8] | Vuillerme N, Boisgontier M. Muscle fatigue degrades force sense at the ankle joint. Gait & Posture. (2008) ; 28: (3): 521-4. doi: 10.1016/j.gaitpost.2008.03.005. |
[9] | Liu Z, Yang C, Yu J, Zhao X, Wu J, Zhang Y, et al. The effect of muscles fatigue on the knee’s kinetics and kinematics characteristics. Sustainability. (2023) ; 15: (4): 3029. doi: 10.3390/su15043029. |
[10] | D’Lima DD, Fregly BJ, Patil S, Steklov N, Colwell CW. Knee joint forces: Prediction, measurement, and significance. Proc Inst Mech Eng H. (2012) ; 226: (2): 95-102. doi: 10.1177/0954411911433372. |
[11] | Marta G, Quental C, Folgado J, Guerra-Pinto F. Multibody modelling of the foot for the biomechanical analysis of the ankle joint during running: A narrative review. Proc Inst Mech Eng Part K J Multi-body Dyn. (2022) ; 236: (2): 338-53. doi: 10.1177/14644193221090871. |
[12] | Donelon TA, Dos’Santos T, Pitchers G, Brown M, Jones PA. Biomechanical determinants of knee joint loads associated with increased anterior cruciate ligament loading during cutting: A systematic review and technical framework. Sports Med – Open. (2020) ; 6: (1). doi: 10.1186/s40798-020-00276-5. |
[13] | Madeti BK, Chalamalasetti SR, Bolla Pragada SKSSR. Biomechanics of knee joint – A review. Front Mech Eng. (2015) ; 10: (2): 176-86. doi: 10.1007/s11465-014-0306-x. |
[14] | Holder J, Trinler U, Meurer A, Stief F. A systematic review of the associations between inverse dynamics and musculoskeletal modeling to investigate joint loading in a clinical environment. Front Bioeng Biotechnol. (2020) ; 8: : 603907. doi: 10.3389/fbioe.2020.603907. |
[15] | Stetter BJ, Ringhof S, Krafft FC, Sell S, Stein T. Estimation of knee joint forces in sport movements using wearable sensors and machine learning. Sensors. (2019) ; 9: (17): 3690. doi: 10.3390/s19173690. |
[16] | Lloyd DG, Saxby DJ, Pizzolato C, Worsey M, Diamond LE, Palipana D, et al. Maintaining soldier musculoskeletal health using personalised digital humans, wearables and/or computer vision. J. Sci. Med. Sport. (2023) ; 26: : S30-9. doi: 10.1016/j.jsams.2023.04.001. |
[17] | Lee CJ, Lee JK. Inertial motion capture-based wearable systems for estimation of joint kinetics: A systematic review. Sensors. (2022) ; 22: (7): 2507. doi: 10.3390/s22072507. |
[18] | Lind CM, Abtahi F, Forsman M. Wearable motion capture devices for the prevention of work-related musculoskeletal disorders in ergonomics – an overview of current applications, challenges, and future opportunities. Sensors. (2023) ; 23: (9): 4259. doi: 10.3390/s23094259. |
[19] | Mason R, Pearson LT, Barry G, Young F, Lennon O, Godfrey A, et al. Wearables for running gait analysis: A systematic review. Sports Med. (2023) ; 53: (1): 241-68. doi: 10.1007/s40279-022-01760-6. |
[20] | Kinvent. Kinvent Physio; (2023) [cited 2023 Jul 21]. Available from: physio.kinvent.com (https://physio.kinvent.com/). |
[21] | Delsys Incorporated. Delsys; (2023) [cited 2023 Jul 21]. Available from delsys.com (https://delsys.com/). |
[22] | Faust L, Jiménez-Pazmino P, Holland JK, Lizardo O, Hachen D, Chawla NV. What 30 days tells us about 3 years: Identifying early signs of user abandonment and non-adherence. In: PervasiveHealth: Pervasive Computing Technol Healthc. (2019) ; pp. 216-24. doi: 10.1145/3329189.3329196. |
[23] | Eapen ZJ, Turakhia MP, McConnell MV, Graham G, Dunn P, Tiner C, et al. Defining a mobile health roadmap for cardiovascular health and disease. J Am Heart Assoc. (2016) ; 5: (7): e003119. doi: 10.1161/JAHA.115.003119. |
[24] | Lacey A, Whyte E, O’Keeffe S, O’Connor S, Moran K. A qualitative examination of the factors affecting the adoption of injury focused wearable technologies in recreational runners. PLoS ONE. (2022) ; 17: (7 July): e0265475. doi: 10.1371/journal.pone.0265475. |
[25] | Sensoria Inc. The Sensoria Textile Pressure Sensors Technology; (2023) [cited 2023 Jul 21]. Available from sensoriafitness.com (https://www.sensoriafitness.com/). |
[26] | Luczak T, Burch VRF, Smith BK, Carruth DW, Lamberth J, Chander H, et al. Closing the Wearable Gap – Part V: Development of a pressure-sensitive sock utilizing soft sensors. Sensors. (2019) ; 20: (1): 208. doi: 10.3390/s20010208. |
[27] | Amitrano F, Coccia A, Ricciardi C, Donisi L, Cesarelli G, Capodaglio EM, et al. Design and validation of an e-textile-based wearable sock for remote gait and postural assessment. Sensors. (2020) ; 20: (22): 6691. doi: 10.3390/s20226691. |
[28] | Lucangeli L, D’angelantonio E, Camomilla V, Pallotti A. SISTINE 2.0: Sensorized Socks for Postural Telemonitoring. In: IEEE Int Workshop Metrol Ind 40 IoT, MetroInd 40 IoT – Proc. (2022) . pp. 283-8. doi: 10.1109/MetroInd4.0IoT54413.2022.9831630. |
[29] | Eizentals P, Katashev A, Oks A, Pavare Z. DAid pressure socks system: Performance evaluation. Gait and Posture. (2021) ; 84: : 368-76. doi: 10.1016/j.gaitpost.2021.01.007. |
[30] | Cross JA, Mohamud F, Meinerz C, Harris GF, Dziuk C, Fritz JM. Correlations between plantar pressure and joint kinematics in female recreational runners. Biomed Sci Instrum. (2021) ; 57: (2): 100-5. doi: 10.34107/YHPN9422.04100. |
[31] | Giacomozzi C, Leardini A, Caravaggi P. Correlates between kinematics and baropodometric measurements for an integrated in-vivo assessment of the segmental foot function in gait. J Biomech. (2014) ; 47: (11): 2654-9. doi: 10.1016/j.jbiomech.2014.05.014. |
[32] | Castro MP, Figueiredo MC, Abreu S, Sousa H, Machado L, Santos R, et al. The influence of gait cadence on the ground reaction forces and plantar pressures during load carriage of young adults. Appl Ergon. (2015) ; 49: : 41-6. doi: 10.1016/j.apergo.2015.01.004. |
[33] | Fernandes WC, Machado Á, Borella C, Carpes FP. Influence of gait speed on plantar pressure in subjects with unilateral knee osteoarthritis. Rev Bras Reumatol. (2014) ; 54: (6): 441-5. doi: 10.1016/j.rbr.2014.06.004. |
[34] | Breine B, Malcolm P, Galle S, Fiers P, Frederick EC, De Clercq D. Running speed-induced changes in foot contact pattern influence impact loading rate. Eur J Sport Sci. (2019) ; 19: (6): 774-83. doi: 10.1080/17461391.2018.1541256. |
[35] | Eizentals P, Katashev A, Okss A, Pavare Z, Balcuna D. Detection of excessive pronation and supination for walking and running gait with smart socks. In: IFMBE Proceedings. Vol. 68. (2018) ; pp. 603-7. doi: 10.1007/978-981-10-9038-7_112. |
[36] | Karatsidis A, Bellusci G, Schepers H, De Zee M, Andersen M, Veltink P. Estimation of ground reaction forces and moments during gait using only inertial motion capture. Sensors. (2016) ; 17: (12): 75. doi: 10.3390/s17010075. |
[37] | Ngoh KJH, Gouwanda D, Gopalai AA, Chong YZ. Estimation of vertical ground reaction force during running using neural network model and uniaxial accelerometer. J Biomech. (2018) ; 76: : 269-73. doi: 10.1016/j.jbiomech.2018.06.006. |
[38] | Cassiolas G, Di Paolo S, Marchiori G, Grassi A, Della Villa F, Bragonzoni L, et al. Knee joint contact forces during high-risk dynamic tasks: 90∘ change of direction and deceleration movements. Bioengineering. (2023) ; 10: (2): 179. doi: 10.3390/bioengineering10020179. |


