
Experimental study using phantom models of cerebral aneurysms and 4D-DSA to measure blood flow on 3D-color-coded images
Abstract
BACKGROUND:
The current 3D-iFlow application can only measure the arrival time of contrast media through intensity values. If the flow rate could be estimated by 3D-iFlow, patient-specific hemodynamics could be determined within the scope of normal diagnostic management, eliminating the need for additional resources for blood flow rate estimation.
OBJECTIVE:
The aim of this study is to develop and validate a method for measuring the flow rate by data obtained from 3D-iFlow images – a prototype application in Four-dimensional digital subtraction angiography (4D-DSA).
METHODS:
Using phantom model and experimental circuit with circulating glycerin solution, an equation for the relationship between contrast media intensity and flow rate was developed. Applying the equation to the aneurysm phantom models, the derived flow rate was evaluated.
RESULTS:
The average errors between the derived flow rate and setting flow rate became larger when the glycerin flow and the X-rays from the X-ray tube of the angiography system were parallel to each other or when the measurement point included overlaps with other contrast enhanced areas.
CONCLUSION:
Although the error increases dependent on the imaging direction and overlap of contrast enhanced area, the developed equation can estimate the flow rate using the image intensity value measured on 3D-iFlow based on 4D-DSA.
1.Introduction
The study of hemodynamics plays an important role in understanding the pathophysiology and treatment outcomes of cerebrovascular diseases [1]. Recent advancements in computational techniques have promoted the application of computational fluid dynamics (CFD) to analyze hemodynamics in cerebral aneurysms [2, 3, 4] specifically by simulating flow fields to solve the basic equations of fluid dynamics. However, CFD analysis requires extensive knowledge of fluid dynamics and numerical analysis, and most general-purpose software used for analysis is highly specialized and requires experience and time to learn. Furthermore, while the required specifications vary depending on the computational cost, a high-performance computer is necessary to perform a stress-free CFD analysis. This is expensive and not widely adopted in clinical practice. Apart from CFD analysis, other devices such as phase contrast magnetic resonance imaging (PC-MRI) must be applied to obtain data on hemodynamics [5]. With these devices, it is possible to measure blood flow rate, which is one of the most important factors in understanding hemodynamics. However, such diagnostic equipment is not routinely used in cerebrovascular diseases. When the blood flow rate is not directly necessary for diagnosis and treatment and remains only as reference information, an additional examination just to obtain the flow rate may cause financial and mental burdens to patients.
Currently, digital subtraction angiography (DSA) is one of the imaging modalities that is routinely used in the diagnosis and treatment of cerebrovascular diseases. DSA acquires images using X-rays and generates well-defined images of the lumen of arteries by subtracting an image acquired before the injection of contrast media from the arterial phase image enhanced by the injected contrast media [6]. The angiography system can also be used to acquire projections around the patients similarly to computed tomography and generate three-dimensional DSA images (3D-DSA) images of arteries [7]. Furthermore, 4D-DSA imaging that includes the temporal information of contrast media flow distribution has been developed and become commercially available in recent years [8, 9, 10, 11].
Further technical developments potentially made it possible to visualize the flow through color mapping of the density values of contrast media determined on 4D-DSA images [12, 13]. The 3D-iFlow application is a prototype software for medical imaging that measures the arrival time of contrast media intensity value at any point in 3D space on 4D-DSA and displays color-mapped 3D geometries of arteries [14, 15, 16, 17, 18]. Replacing 3D-DSA with 4D-DSA, which is compatible with the former, could potentially enable the determination of blood flow rate in cerebral arteries using 3D-iFlow without requiring additional diagnostic equipment such as ultrasound diagnostic equipment and PC-MRI, which are not routinely used in diagnosis and treatment. However, the current 3D-iFlow application can only measure the arrival time of contrast media through intensity values. Although a relationship between the intensity value and flow rate can be inferred since the intensity value varies with the concentration of contrast media, the specific and quantitative relationship between them has not been clarified. If the flow rate could be estimated by 3D-iFlow, patient-specific hemodynamics could be determined within the scope of normal diagnostic management, eliminating the need for additional resources for blood flow rate estimation.
The aim of this study is to develop and validate a method for measuring the flow rate by data obtained from 3D-iFlow. To accomplish this, we acquired contrast enhanced 4D-DSA images of phantom models of cerebral arteries connected to an experimental circuit.
2.Materials and methods
2.1Phantom models of an aneurysm and its parent artery
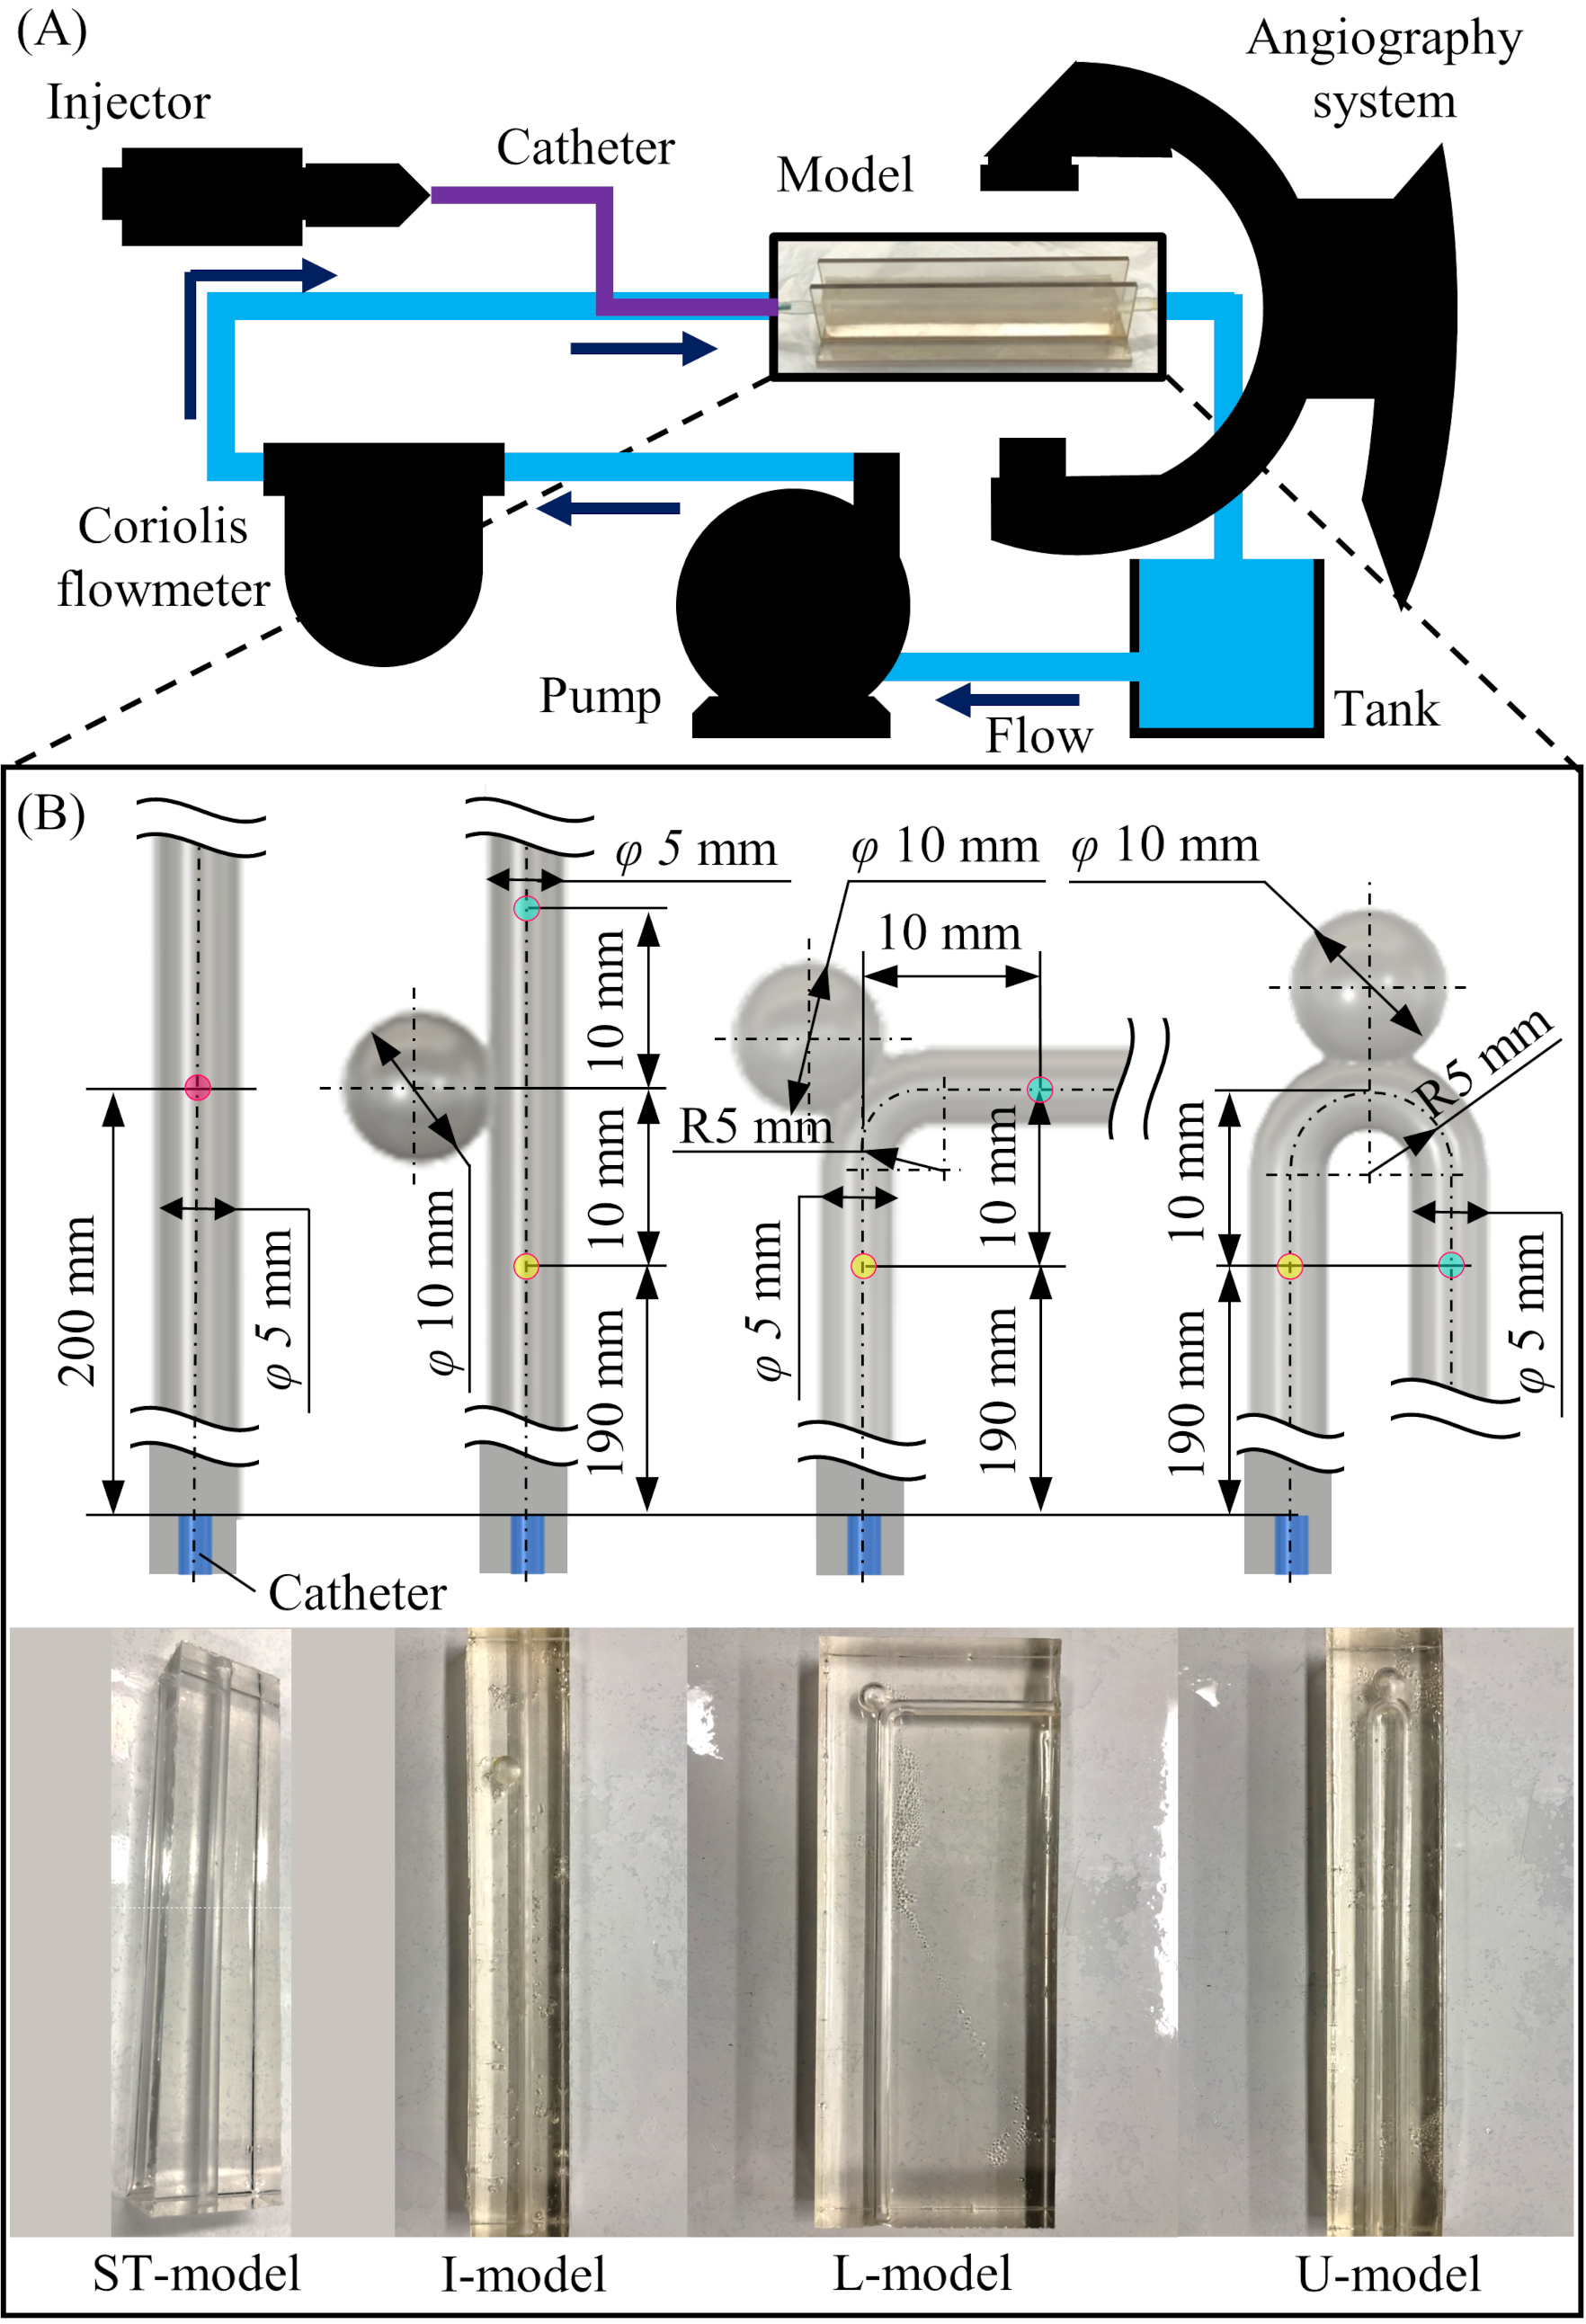
Four types of phantom models were designed to imitate cerebral arteries: ST-model, I-model, L-model, and U-model. Of these, the ST-model is a straight pipe without a model of aneurysm. Each of the other models have a sphere attached to them to represent a cerebral aneurysm of 10 mm diameter and a maximum neck diameter of 5 mm. To evaluate the effect of arterial bending, models were shaped as follows: I-model (0 degree), L-model (90 degree), and U-model (180 degree). In all models, the diameter of the pipe was 5 mm, which is similar to the average diameter of the internal carotid artery [19, 20]. A sufficient entrance region was provided to allow for the development into a Hagen-Poiseuille flow. The three-dimensional arterial models were printed using PolyJet 3D-printing technology by Objet Eden260V (Stratasys, Eden Prairie, MN, USA). The printed models were placed in a frame, and silicone rubber stock solution (Shin-Etsu Chemical Co., Ltd., Tokyo, Japan) was poured along with a curing agent (Shin-Etsu Chemical Co., Ltd., Tokyo, Japan). After the poured silicone cured, the 3D-printed model was removed to create a block-shaped arterial lumen model. The detailed designs of the models and pictures of the created model are summarized in Fig. 1B.
2.2Experimental circuit with circulating glycerin solution
A schematic diagram of the experimental circuit with circulating glycerin solution is shown in Fig. 1A. In this circuit, the glycerin solution (mass concentration: 57%, density: 1099 kg/m3, viscosity: 3.66 mPas, temperature: 37 Celsius) is circulated by an electromagnetic pump (RD-30TV24-HV, Iwaki Co., Ltd., Tokyo, Japan) at a steady flow. The circulating flow rate was measured by a Coriolis flowmeter (FD-SS2A, KEYENCE Corp., Osaka, Japan) and controlled by changing the voltage of the power supply (P4K36-0.1 and P4K36-1, Matsusada Precision Inc., Shiga, Japan). A catheter (Flexor shuttle guiding sheath 6Fr, Cook Medical, IN, USA) connected to an injector (Auto Injector 120S, Nemoto Kyorindo Co., Ltd., Tokyo, Japan) was inserted between the Coriolis flowmeter and the phantom model. To ensure a homogenious distribution of the contrast media injected into the pipe, the catheter was fixed in the center of the channel by attaching a jig at 2 mm from the tip of the catheter. The phantom model was placed in the iso-center area of the angiography system in a way to be exchangeable. A reservoir tank was placed between the phantom model and the pump. To avoid mixing of contrast media, the glycerin solution was changed after each imaging.
Figure 1.
Experimental design and phantom models installed in the circuit. (A) Schematic diagram of the experimental circuit with circulating glycerin solution. (B) Detailed design and pictures of the four types of the phantom model (ST-model, I-model, L-model, and U-model).
2.3Imaging protocol of 4D-DSA and measurement of contrast media intensity values using 3D-iFlow
A single-plane flat-panel detector angiography system (Artis zee floor, Siemens Healthcare GmbH, Forchheim, Germany) was used to acquire 4D-DSA images using a 12 s Dyna4D scan protocol (frame rate: 30 frame/s). Non-ionic contrast media (IOPAQUE 300, Fuji Pharma Co., Ltd., Tokyo, Japan) was injected from the injector via a catheter with a rise time of 0.5 s and a flow rate setting of 3 mL/s for 6 second. The flow rate from the injector with this setting was measured directly with the Coriolis flowmeter in a preliminary experiment, and the average flow rate from 0.5 to 6 seconds after the start of injection was 181.1 mL/min. The acquired 4D-DSA data were transferred to the workstation of the system (X-Workplace, Siemens Healthcare GmbH), and the 4D-DSA application (syngo Dyna4D, Siemens Healthcare GmbH) was used to reconstruct the three-dimensional geometry of the artery resulting in a voxel size of 0.46
(1)
2.4Derivation of the equation for the relationship between the intensity and flow rate
To investigate the relationship between contrast media intensity values obtained from 3D-iFlow and flow rate, 4D-DSA image data of the ST-model were acquired once for each of the 10 steps of progressively increasing flow rate. The measurement point on the 3D-iFlow images was 200 mm from the catheter tip. At the measurement point, the flow should be fully developed as Hagen-Poiseuille flow. Here, the maximum flow rate that becomes Hagen-Poiseuille flow at the 160 mm entrance length is 503 mL/min, based on the following equation.
(2)
where
2.5Derivation of the flow rate using the equation and its validation
The derived equation of the intensity and flow rate was applied to the imaging results of three aneurysm phantom models and validated by comparing the estimated flow rate (FRest) with FRset. The catheter tip was placed 200 mm from the aneurysm (see Fig. 1B). For each phantom model, the FRset was varied in three patterns (124, 248, and 323 mL/min), and 4D-DSA images were acquired for each of them. The measurement points on the 3D-iFlow images were located at 10 mm proximal and distal side from the aneurysm. The FRest was calculated by substituting the measured Intensityave into the equation obtained from the results of the ST-model. The relative error between the calculated FRest and FRset was evaluated using the following equation.
(3)
2.6Measurement of the intensity corresponding to contrast medium concentration
To identify the relationship between the intensity value on the iFlow images and concentration of contrast media, iodine concentrations were calculated for each measurement (10 steps in total) in the experiment. The iodine concentration of the contrast media used in this study is 300 mg/mL, and considering the set flow rate of the injector, the flow rate of the injected iodine is 5.43
2.7Measurement of contrast media particles and evaluation of advection-diffusion
The average particle diameter of the contrast media was investigated using a particle size analyzer (DelsaMax CORE, Beckman Coulter, Inc., CA, USA). Three measurements were taken to obtain the average particle diameter. The average particle diameter was used to calculate the diffusion coefficient of the glycerin solution and contrast media using the Einstein-Stokes formula.
(4)
where
(5)
where
3.Results
3.1Relationship between contrast media intensity value and flow rate obtained from the measurements in the ST-model
Figure 2.
Results of intensity value and flow rate from the 4D-DSA imaging for the ST-model. (A) Time intensity curves (TICs) of the contrast media for 10 flow rates. (B) Relationship between the measured Intensityave and flow rate.
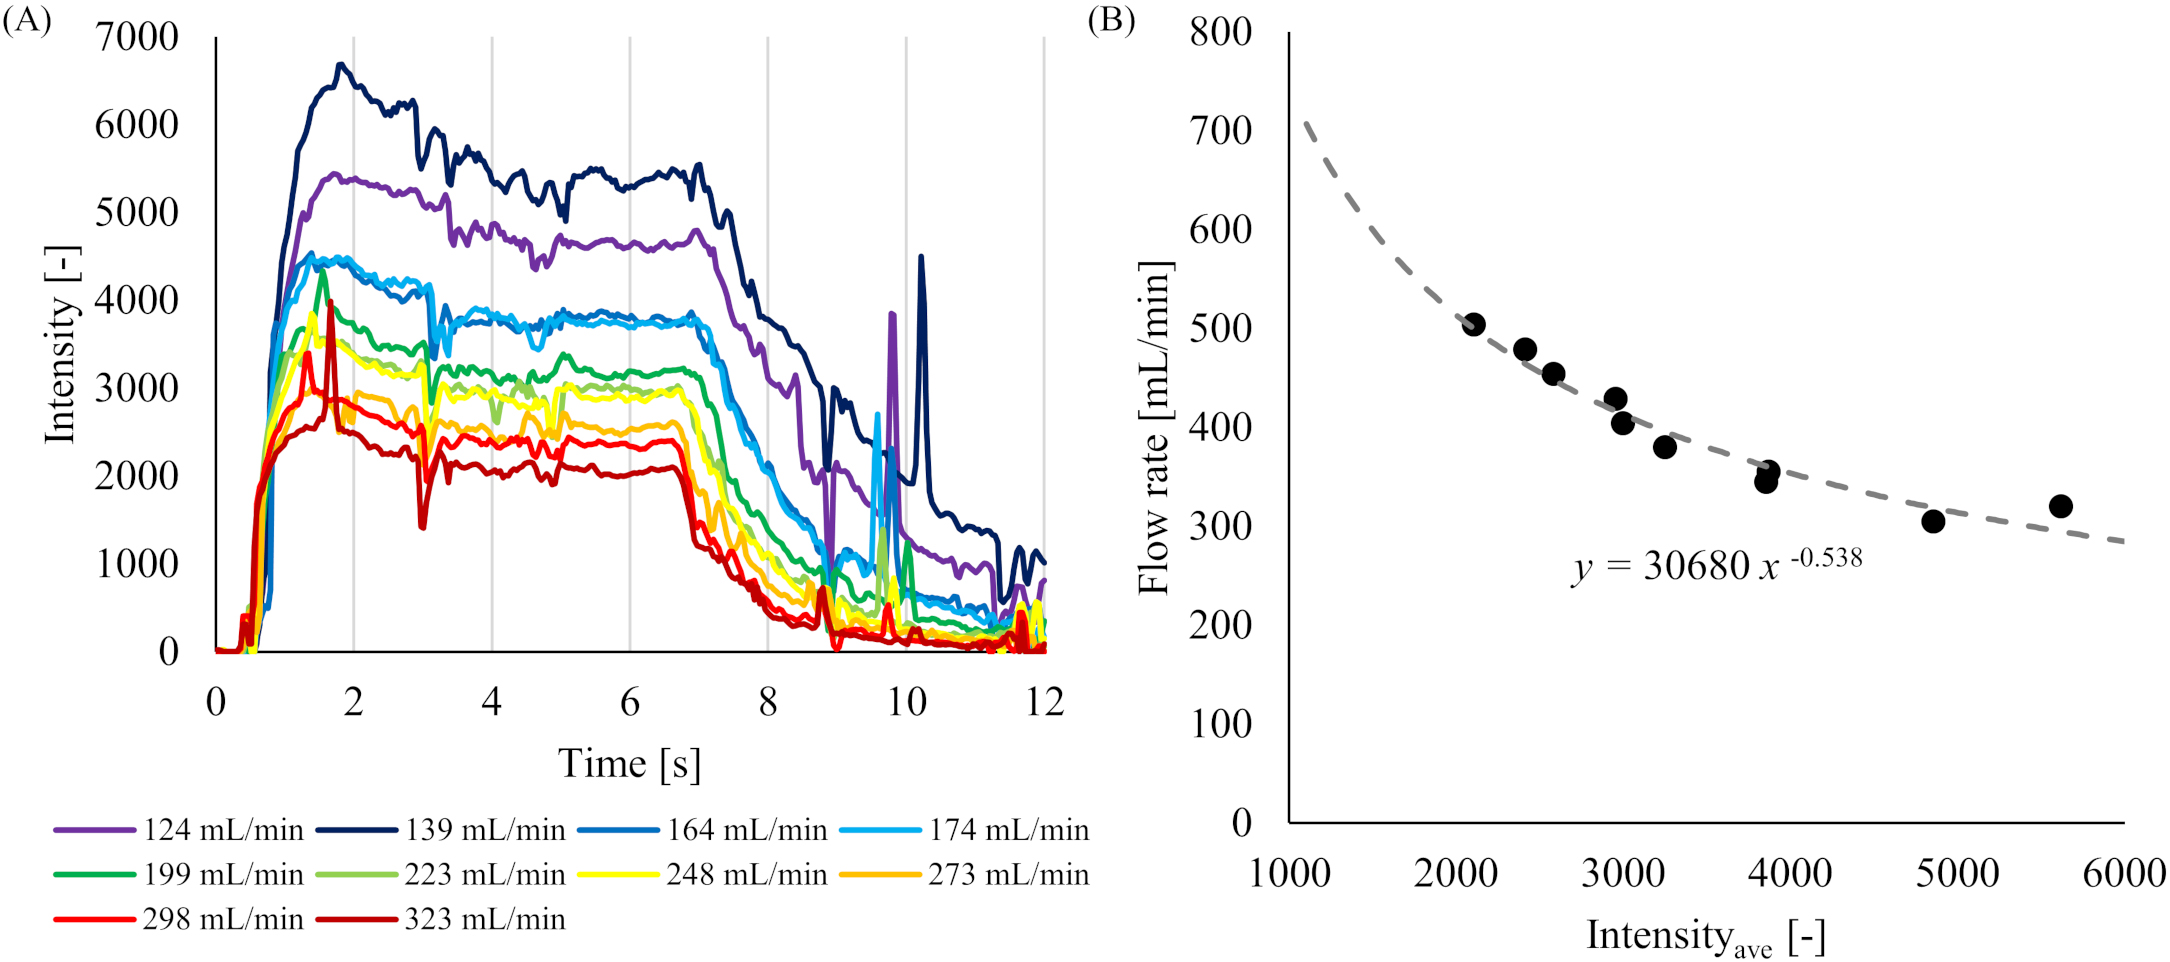
The TICs obtained in the ST-model from 3D-iFlow for 10 different flow rates are shown in Fig. 2A. All TICs indicated similar trends of an increase of the intensity from 0 s to around 2 s after the start of imaging, followed by a plateau of about 5 s, and a decrease until the 12th s. The relationship between the Intensityave and flow rate obtained in each measurement is shown in Fig. 2B. In that figure, the flow rate on the vertical axis was added 181.1 mL/min to the setting flow rate (FRset) since the flow contained both glycerin solution and the contrast media. Introducing a power approximate curve, the following equation was obtained with a coefficient of determination
(6)
Since the original flow rate was obtained by subtracting the flow rate of the contrast media from the flow rate obtained from the above equation, the equation relating the intensity value to the flow rate became as follows.
(7)
The equation shows that the flow rate decreases as the intensity value increases.
3.2Applying the Eq. (7) to the aneurysm phantom models
For the three aneurysm phantom models (I-model, L-model, and U-model), the values of Intensityave on the proximal and distal sides of the aneurysm, the estimated flow rate obtained by substituting the measured Intensityave values into the Eq. (7) (FRest), the setting flow rate (FRset), and the relative error between FRest and FRset are shown in Table 1. The average relative error for the I-model were 7.53
Table 1
Relationship between FRest that were introduced from the Intensity and FRset at each measuring point in each model
| Model | Measuring point | Intensityave [ | VFest [mL/min] | VFset [mL/min] | Error [%] | Average error [%] |
|---|---|---|---|---|---|---|
| I-model | Proximal | 5474 | 117.8 | 124 | 5.00% | 7.53% |
| 3082 | 226.1 | 248 | 8.83% | |||
| 2307 | 294.7 | 323 | 8.76% | |||
| Distal | 5271 | 124 | 124 | 0% | 5.25% | |
| 3009 | 231.3 | 248 | 6.73% | |||
| 2314 | 293.9 | 323 | 9.01% | |||
| L-model | Proximal | 5228 | 125.3 | 124 | 1.05% | 2.56% |
| 2676 | 258.2 | 248 | 4.11% | |||
| 2135 | 314.9 | 323 | 2.51% | |||
| Distal | 1506 | 417.5 | 124 | 237% | 89.5% | |
| 2717 | 254.7 | 248 | 2.70% | |||
| 1508 | 417.1 | 323 | 29.13% | |||
| U-model | Proximal | 4710 | 143 | 124 | 15.32% | 14.0% |
| 3063 | 227.4 | 248 | 8.31% | |||
| 2610 | 264.1 | 323 | 18.24% | |||
| Distal | 4462 | 152.6 | 124 | 23.06% | 13.5% | |
| 2825 | 245.6 | 248 | 0.97% | |||
| 2552 | 269.6 | 323 | 16.53% |
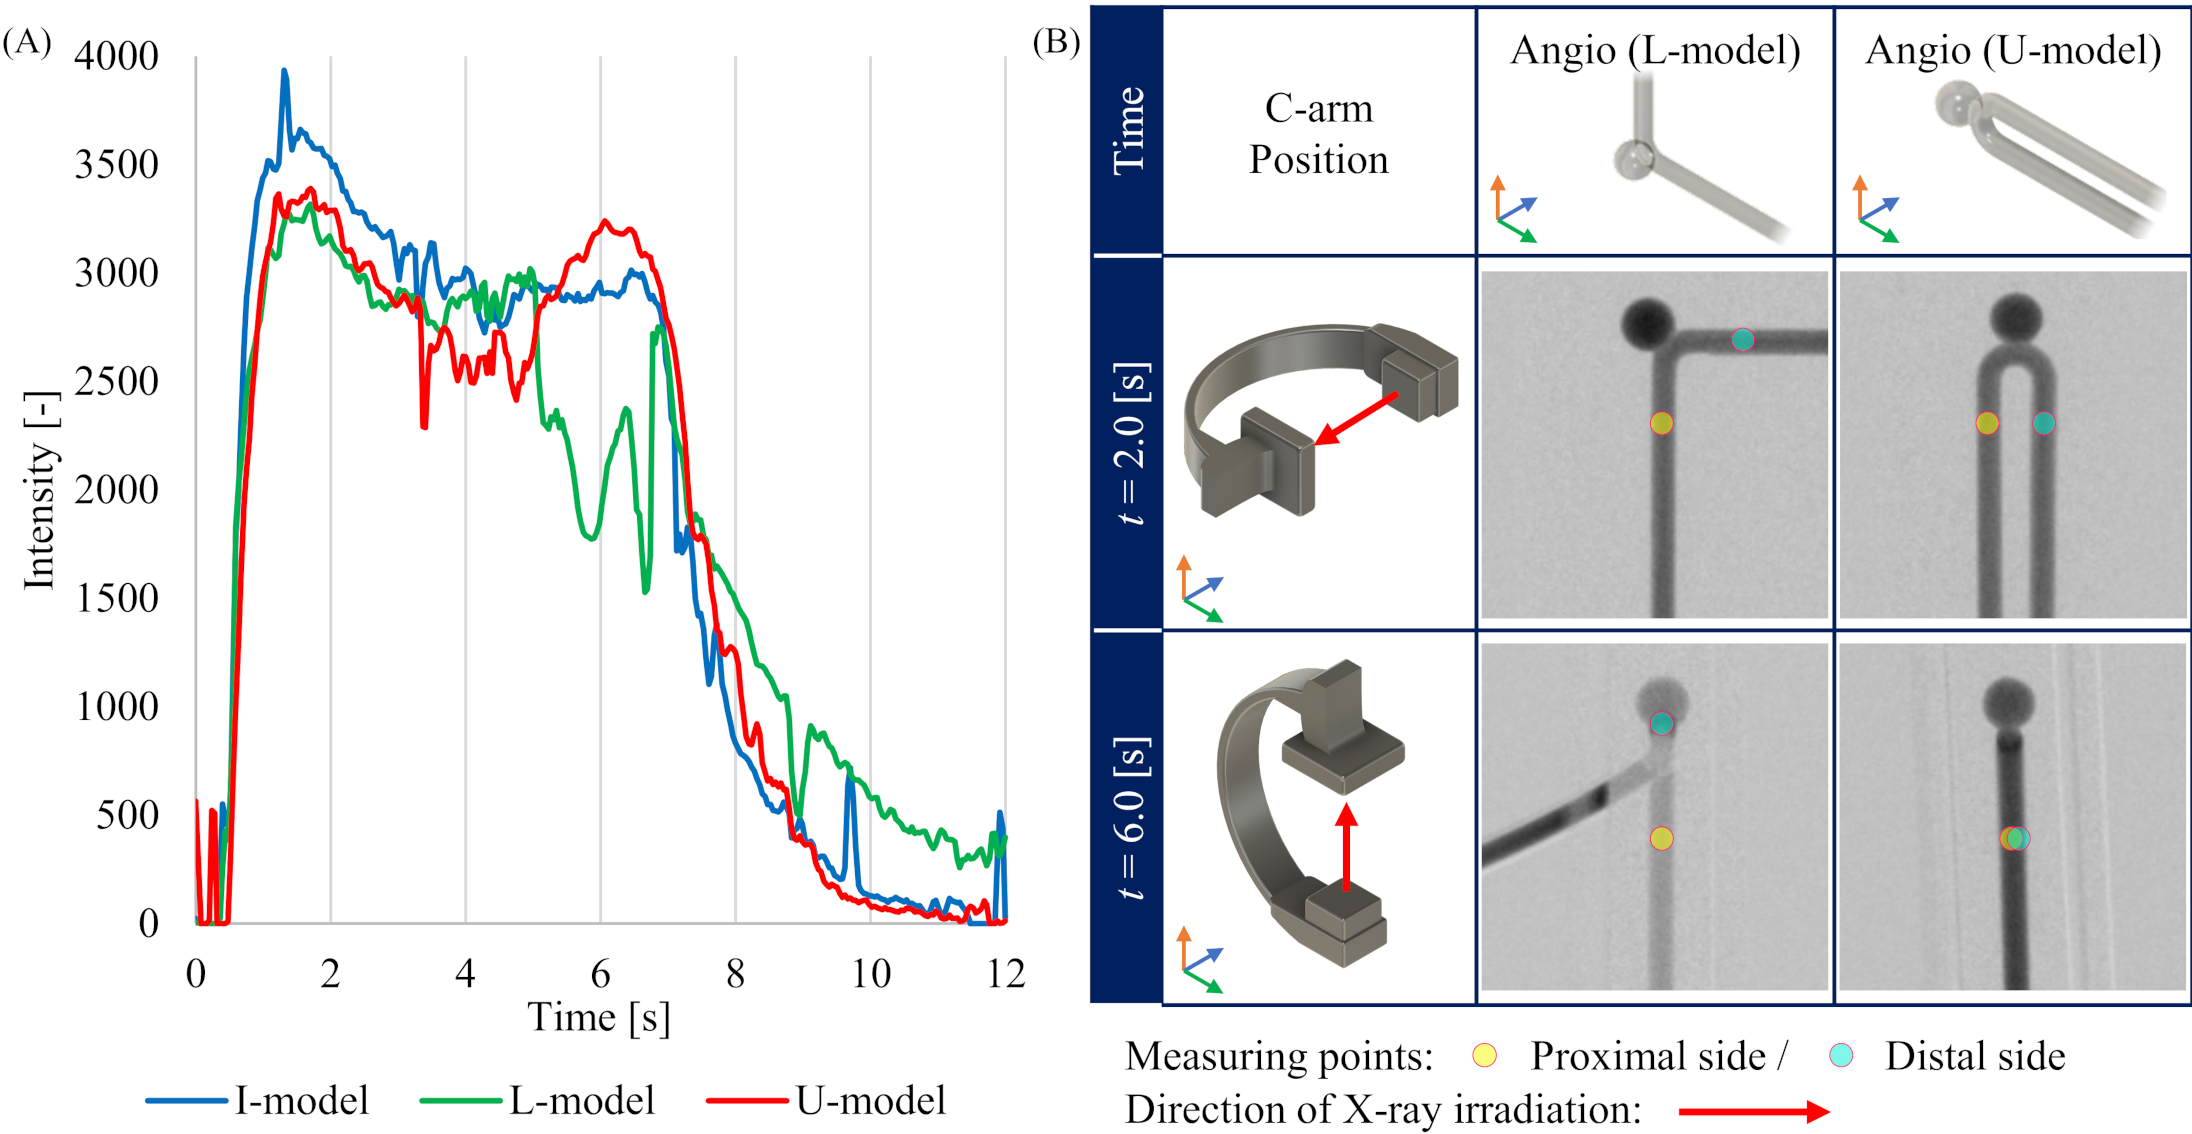
Figure 3.
Conditions during 4D-DSA imaging in each model. (A) Time intensity curves (TICs) at the measurement point on distal side in the aneurysm phantom model. (B) Geometrical relationship between C-arm position and L-model or U-model depending on the time during the imaging protocol.
3.3Relationship between contrast media concentration and intensity values
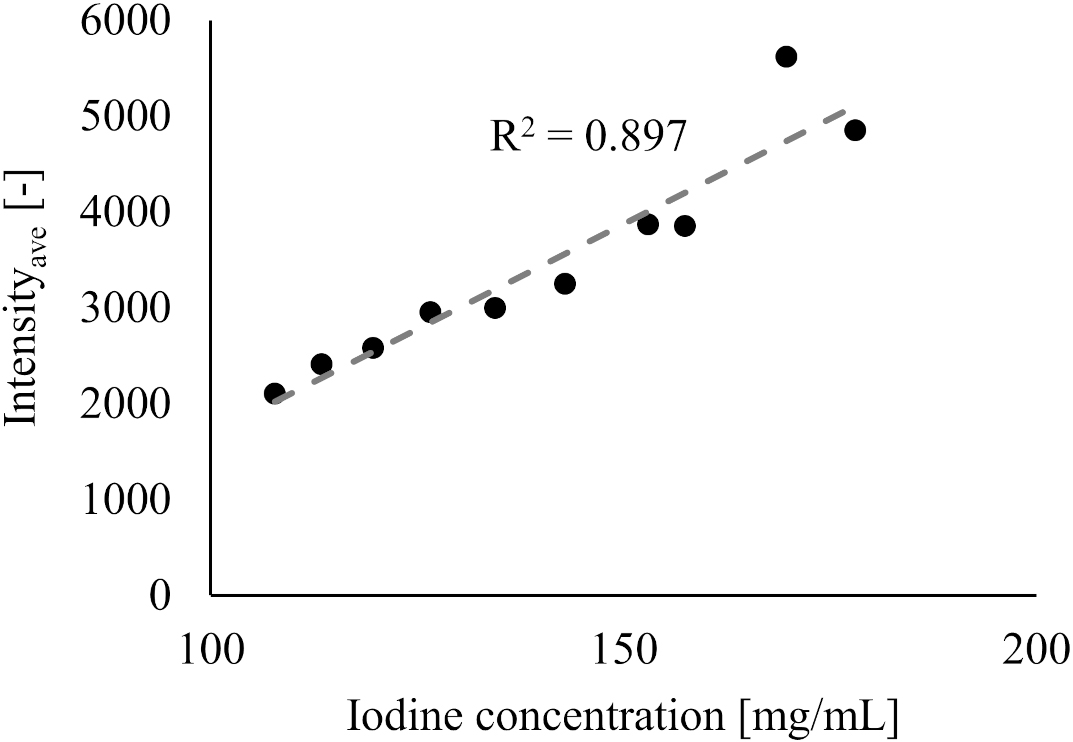
The relationship between iodine concentration and the intensity value for 10 flow rates for the ST-model are shown in Fig. 4. A strong positive correlation was found between iodine concentration and the intensity values (
Figure 4.
Relationship between the Intensityave and iodine concentration.
3.4Contrast media particle diameter measurement and Peclet number
The average particle diameter of the contrast media was 4.80 nm (4.93 nm, 4.61nm, and 4.86 nm for the first, second, and third measurement, respectively), giving the diffusion coefficient
4.Discussion
4.1Factors affecting contrast media intensity values in ST-model
The TICs in the experiment of the ST-model showed that the intensity values shift in the order of increasing, stabilizing, and decreasing for all flow rates. These results reflect the contrast media reaching the measurement point, stabilizing, and being washed out during the 12-second period of the 4D-DSA image acquisition. For the minimum flow rate of 124 mL/min, the injection flow rate of 181 ml/s of contrast media, and the pipe diameter of 5 mm, the average flow velocity in the pipe can be calculated to be 0.26 m/s. Since the distance from the catheter tip to the measurement point is 200 mm, the time for the contrast media to reach the measurement point is 0.77 s. Given that the injector has a rise time of 0.5 s, the contrast media will be in a stable concentration from 1.27 s after the start of injection. The intensity value was confirmed to increase within 2 seconds after the start of imaging and remain stable for 6 seconds after the contrast media reaches the measurement point. Therefore, an average intensity value between 2 to 6 seconds was used as Intensityave in this study.
In addition, our results reveal an inverse correlation between the intensity values and flow rate. This can be explained as the concentration of contrast media being diluted and having a higher flow rate (i.e., the intensity values decrease with higher flow rate). In previous studies, it has been reported that the intensity values correlate with the iodine concentration in contrast media, and similar results were obtained in the present one (see Fig. 4) [22]. Because the total amount of the injected contrast media was the same for all flow rate settings in this study, it is considered that the trend of decreasing intensity value was observed due to dilution of iodine concentration as the flow rate setting increased.
4.2Error in flow rate derivation for aneurysm phantom models
The relative errors on the proximal and distal sides of the I-model and on the proximal side of the L-model are within 10% for all flow rates compared to the estimated flow rate using the Eq. (7) derived from the ST-model. The errors may reflect the influence of the aneurysm in the I-model on the relationship between the intensity value and flow rate. The errors were also larger on the distal side of the L-model and the proximal and distal sides of the U-model. We assumed that the errors are due to the two-dimensional method of calculating contrast media intensity value in 3D-iFlow. Our calculations also did not include corrections for bends, although some authors report that bends may generate secondary flow thus causing the flow pattern to deviate from the Hagen Poiseuille flow pattern assumed in the ST-model [23]. Furthermore, in the present imaging protocol, the lateral view and anterior posterior (AP) view were captured at 3 seconds and 6 seconds after the start of imaging, respectively. In the lateral view, there is no overlap with other contrast areas at the measurement points in either L-model or U-model, and the image is acquired in a direction perpendicular to the flow (the rotation axis of the C-arm is almost parallel to the flow direction). On the other hand, at the time of AP view, which is 6 seconds after the start of imaging, the direction of X-ray irradiation is parallel to the distal pipe in the L-model, and the proximal and distal pipes overlap with each other in the U-model. Although the TICs on the distal side of each model at FRset
4.3Effect of advection and diffusion on the injection of contrast media into cerebral artery
The present method estimates the flow rate from the intensity value of the contrast media. Since the intensity value of the contrast media depends on the iodine concentration as shown in the result, we investigated the effects of advection and diffusion, which are related to iodine concentration, on the injected contrast media. The Pe number calculated from the diffusion coefficient, which represents the ease of mixing the glycerin solution with the contrast media used in the experiment, suggests that advection dominates the mixing and diffusion is negligible because the
4.4Potential use of 3D-iFlow derived flow rate from intensity values
For cerebral aneurysms, one of the most common cerebrovascular diseases, CFD analysis has gained wide acceptance to clarify or predict phenomena such as aneurysmal initiation, growth, and rupture [24, 25, 26, 27]. CFD analysis has also been applied to predict treatments that use devices [28, 29]. In addition, the causes of poor outcomes have also been researched using CFD analysis from the viewpoints of hemodynamics and they can potentially provide valuable clinical information [30, 31, 32]. When patient-specific CFD analysis is performed in such studies, the three-dimensional geometry of cerebral vessels is reconstructed from 3D-DSA or 3D-CTA, which are modalities routinely used in the diagnosis and treatment of cerebrovascular diseases. However, since it is difficult to quantitatively grasp the blood flow rate in conventional 3D-DSA or 3D-CTA, general inlet and outlet boundary conditions are normally imposed referring to previous studies that measure the flow rate using other techniques, such as ultrasound diagnostic equipment and PC-MRI [5]. In the present study, we demonstrated the possibility that the flow rate can be estimated from contrast media intensity value by using 3D-iFlow based on 4D-DSA, from which conventional 3D-DSA images can also be reconstructed. These results may provide CFD analysis results based on patient-specific boundary conditions by obtaining the flow rate from 4D-DSA, which is performed within routine diagnosis and treatment protocols. Some previous investigators have tried to extract the quantitative flow condition such as flow rate by other methods such as stereoscopic DSA, 7 T PC-MRI or from imaging results of 4D-DSA, but these methods remain mostly outside the clinical routine [5, 33]. A promising method has been reported of using time intensity curves acquired from angiographic imaging. The authors applied the method to investigate the effect of stent shapes in an animal model [34]. The advantage of our method is that the flow rate can be simply estimated from the intensity value in the 3D-iFlow application [35, 36, 37, 38, 39, 40, 41] – currently a prototype not for clinical use – that could easily be implemented in clinical routine without additional burden to patients. In addition, it is known that the treatment outcome of a flow diverter stent (FDS) deployment for a cerebral aneurysm may differ depending on the cerebrovascular geometry, even for aneurysms in same location (i.e., non-occlusion was observed in some aneurysms against treatment intent) and may depend on patient specific blood properties [29, 42]. Previous studies have reported methodologies that estimates treatment outcome after FDS deployment by blood flow analysis using DSA data obtained before or after the deployment, but limitations still hinder the application in actual clinical practice [43]. The present methodology with 3D-iFlow may enable the surgeon to estimate the treatment outcome after FDS deployment since assessment of flow rate in the involved cerebral vessels is directly related to the thrombosis inside the aneurysm [31, 44]. However, it should be kept in mind that the flow rate estimated with the calculations presented here are only approximations and may not give precise results in particular in clinical cases where vessels are tortuous and overlapping. Further work is needed to refine the calculations and validate the results. In the future, the phantom models used here to show the feasibility of flow rate estimation based on 4D-DSA and 3D-iFlow for cerebral vessels and aneurysms may be extended beyond the field of cerebrovascular diseases in clinical fields where 4D-DSA imaging is well-established.
4.5Limitations
This study has some limitations. First, while the pipes of the phantom model were all 5 mm in diameter, the actual arterial diameter is continuously changing. We have not investigated the effect of changes in arterial diameter on the equation to estimate the flow rate. In addition, the equation is also affected by the protocol of contrast media injection. In particular, the iodine concentration, which has a dominant influence on the intensity value, varies with the type of contrast media used [45, 46]. A previous study reported that the peak intensity value in the 3D-iFlow data differed between the two contrast media (iodine concentration of 300 mg/mL and 270 mg/mL), even if the flow rate of the working fluid was the same [47]. A change in the flow rate of the injected contrast media may also affect the equation of the relationship between intensity value and flow rate since the concentration would change. It will be necessary to derive and apply the equation relating intensity value to flow rate considering all factors that can influence our protocol (diameter of parent vessels. Iodine content, and so on). In addition, since phantom models were used in the present study, additional validation is needed to determine whether the flow rate can be estimated with the same accuracy when the equation is applied to human arteries. Another limitation is that the changes in intensity values due to pulsation have not been considered in the present study. In the flow rate estimation obtained in the present study, it may be difficult to accurately estimate the flow rate when the direction of the flow and X-ray beam is the same or when the measurement point overlap with other contrast areas, as in the distal parts of L-model and U-model. Considering the real anatomy of cerebral arteries, the present results may be applicable to the common carotid artery and internal carotid artery in the cavernous sinus, where there is little overlap with surrounding vessels and the rotation axis of the C-arm and direction of the artery are relatively parallel. During the use of 4D-DSA visualization in clinical practice, it is possible to observe an unnatural occurrence where distal arteries are visualized before the proximal arteries [10]. This phenomenon has not been considered in this study and requires further investigation in future research to determine its impact on the results.
5.Conclusions
An equation that describes the relationship between the flow rate of glycerin solution contrast media intensity value was derived in a phantom experiment from the results of 3D-iFlow based on 4D-DSA. An experimental circuit with circulating glycerin solution that incorporates a straight pipe model with a similar diameter to that of internal carotid artery and phantom models of a cerebral aneurysm was imaged for different flow rates. Since the concentration of contrast media decreases with higher flow rate, the derived relationship shows the trend of larger flow rates for smaller intensity values. In addition, the flow rate could be estimated from the contrast media intensity values measured on 3D-iFlow images using the derived equation. Although the present method has only be applied to phantom models, the results suggest that the blood flow rate may be estimated using 4D-DSA.
Funding
The authors did not receive any funding for this study.
Data availability
All data generated or analyzed during this study is included in this article.
Acknowledgments
The authors have no acknowledgments.
Conflict of interest
K. Otani is a full-time employee of Siemens Healthcare. The other authors have no conflicts of interest to report.
References
[1] | Fujimura S, Yamanaka Y, Takao H, Ishibashi T, Otani K, Karagiozov K, et al. Hemodynamic and morphological differences in cerebral aneurysms between before and after rupture. J Neurosurg. (2023) Sep 1: : 1-9. |
[2] | Paliwal N, Jaiswal P, Tutino VM, Shallwani H, Davies JM, Siddiqui AH, et al. Outcome prediction of intracranial aneurysm treatment by flow diverters using machine learning. Neurosurg Focus. (2018) Nov 1; 45: (5): E7. |
[3] | Murayama Y, Fujimura S, Suzuki T, Takao H. Computational fluid dynamics as a risk assessment tool for aneurysm rupture. Neurosurg Focus. (2019) Jul 1; 47: (1): E12. |
[4] | Damiano RJ, Tutino VM, Paliwal N, Patel TR, Waqas M, Levy EI, et al. Aneurysm characteristics, coil packing, and post-coiling hemodynamics affect long-term treatment outcome. J Neurointerv Surg. (2020) Jul; 12: (7): 706-713. |
[5] | Rajabzadeh-Oghaz H, van Ooij P, Veeturi SS, Tutino VM, Zwanenburg JJ, Meng H. Inter-patient variations in flow boundary conditions at middle cerebral artery from 7T PC-MRI and influence on Computational Fluid Dynamics of intracranial aneurysms. Comput Biol Med. (2020) May; 120: : 103759. |
[6] | Sahoo A, Abdalkader M, Saatci I, Raymond J, Qiu Z, Huo X, et al. History of neurointervention. Semin Neurol. (2023) Jun; 43: (3): 454-465. |
[7] | Lu L, Zhang LJ, Poon CS, Wu SY, Zhou CS, Luo S, et al. Digital subtraction CT angiography for detection of intracranial aneurysms: Comparison with three-dimensional digital subtraction angiography. Radiology. (2012) Feb; 262: (2): 605-12. |
[8] | Ruedinger KL, Schafer S, Speidel MA, Strother CM. 4D-DSA: Development and current neurovascular applications. AJNR Am J Neuroradiol. (2021) Jan; 42: (2): 214-220. |
[9] | Davis B, Royalty K, Kowarschik M, Rohkohl C, Oberstar E, Aagaard-Kienitz B, et al. 4D digital subtraction angiography: Implementation and demonstration of feasibility. AJNR Am J Neuroradiol. (2013) Oct; 34: (10): 1914-21. |
[10] | Kato N, Yuki I, Hataoka S, Dahmani C, Otani K, Abe Y, et al. 4D digital subtraction angiography for the temporal flow visualization of intracranial aneurysms and vascular malformations. J Stroke Cerebrovasc Dis. (2020) Dec; 29: (12): 105327. |
[11] | Falk KL, Schafer S, Speidel MA, Strother CM. 4D-DSA: Development and current neurovascular applications. AJNR Am J Neuroradiol. (2021) Jan; 42: (2): 214-220. |
[12] | Cover KS, Lagerwaard FJ, Senan S. Color intensity projections: A rapid approach for evaluating four-dimensional CT scans in treatment planning. Int J Radiat Oncol Biol Phys. (2006) Mar 1; 64: (3): 954-61. |
[13] | Cover KS, Lagerwaard FJ, van den Berg R, Buis DR, Slotman BJ. Color intensity projection of digitally subtracted angiography for the visualization of brain arteriovenous malformations. Neurosurgery. (2007) Mar; 60: (3): 511-4; discussion 514-5. |
[14] | Lin CJ, Hung SC, Guo WY, Chang FC, Luo CB, Beilner J, et al. Monitoring peri-therapeutic cerebral circulation time: A feasibility study using color-coded quantitative DSA in patients with steno-occlusive arterial disease. AJNR Am J Neuroradiol. (2012) Oct; 33: (9): 1685-90. |
[15] | Lin CJ, Chang FC, Guo WY, Hung SC, Luo CB, Beilner J, et al. Changes of time-attenuation curve blood flow parameters in patients with and without carotid stenosis. AJNR Am J Neuroradiol. (2015) Jun; 36: (6): 1176-81. |
[16] | Cattaneo GFM, Ding A, Jost T, Ley D, Mühl-Bennighaus R, Yilmaz U, et al. In vitro, contrast agent-based evaluation of the influence of flow diverter size and position on intra-aneurysmal flow dynamics using syngo iFlow. Neuroradiology. (2017) Dec; 59: (12): 1275-1283. |
[17] | Brunozzi D, Shakur SF, Charbel FT, Alaraj A. Intracranial contrast transit times on digital subtraction angiography decrease more in patients with delayed intraparenchymal hemorrhage after Pipeline. Interv Neuroradiol. (2018) Apr; 24: (2): 140-145. |
[18] | Almadidy Z, Brunozzi D, Nelson J, Baumgart J, Atwal G, Alaraj A. Intracranial venous sinus stenosis: Hemodynamic assessment with two-dimensional parametric parenchymal blood flow software on digital subtraction angiography. J Neurointerv Surg. (2020) Mar; 12: (3): 311-314. |
[19] | Krejza J, Arkuszewski M, Kasner SE, Weigele J, Ustymowicz A, Hurst RW, et al. Carotid artery diameter in men and women and the relation to body and neck size. Stroke. (2006) Apr; 37: (4): 1103-5. |
[20] | Carr JMJR, Hoiland RL, Caldwell HG, Coombs GB, Howe CA, Tremblay JC, et al. Internal carotid and brachial artery shear-dependent vasodilator function in young healthy humans. J Physiol. (2020) Dec; 598: (23): 5333-5350. |
[21] | Ford MD, Alperin N, Lee SH, Holdsworth DW, Steinman DA. Characterization of volumetric flow rate waveforms in the normal internal carotid and vertebral arteries. Physiol Meas. (2005) Aug; 26: (4): 477-88. |
[22] | Chida K, Sai M, Saito H, Takase K, Zuguchi M, Sasaki M, et al. Relationship between the pixel value in digital subtraction angiography and iodine concentration: Study in high iodine concentration with original phantom. Tohoku J Exp Med. (2000) Mar; 190: (3): 169-76. |
[23] | Caro CG. The dispersion of indicator flowing through simplified models of the circulation and its relevance to velocity profile in blood vessels. J Physiol. (1966) Aug; 185: (3): 501-19. |
[24] | Fujimura S, Tanaka K, Takao H, Okudaira T, Koseki H, Hasebe A, et al. Computational fluid dynamic analysis of the initiation of cerebral aneurysms. J Neurosurg. (2021) Dec 21: : 1-9. |
[25] | Meng H, Tutino VM, Xiang J, Siddiqui A. High WSS or low WSS? Complex interactions of hemodynamics with intracranial aneurysm initiation, growth, and rupture: Toward a unifying hypothesis. AJNR Am J Neuroradiol. (2014) Jul; 35: (7): 1254-62. |
[26] | Takao H, Murayama Y, Otsuka S, Qian Y, Mohamed A, Masuda S, et al. Hemodynamic differences between unruptured and ruptured intracranial aneurysms during observation. Stroke. (2012) May; 43: (5): 1436-9. |
[27] | Liang L, Steinman DA, Brina O, Chnafa C, Cancelliere NM, Pereira VM. Towards the Clinical utility of CFD for assessment of intracranial aneurysm rupture – a systematic review and novel parameter-ranking tool. J Neurointerv Surg. (2019) Feb; 11: (2): 153-158. |
[28] | Fujimura S, Brehm A, Takao H, Uchiyama Y, Karagiozov K, Fukudome K, et al. Hemodynamic characteristics and clinical outcome for intracranial aneurysms treated with the derivo embolization device, a novel second-generation flow diverter. World Neurosurg. (2022) Mar; 159: : e252-e259. |
[29] | Uchiyama Y, Fujimura S, Takao H, Suzuki T, Ishibashi T, Otani K, et al. Role of patient-specific blood properties in computational fluid dynamics simulation of flow diverter deployed cerebral aneurysms. Technol Health Care. (2022) ; 30: (4): 839-850. |
[30] | Sugiyama S, Niizuma K, Sato K, Rashad S, Kohama M, Endo H, et al. Blood flow into basilar tip aneurysms: A predictor for recanalization after coil embolization. Stroke. (2016) Oct; 47: (10): 2541-7. |
[31] | Zhang M, Tupin S, Anzai H, Kohata Y, Shojima M, Suzuki K, et al. Implementation of computer simulation to assess flow diversion treatment outcomes: Systematic review and meta-analysis. J Neurointerv Surg. (2021) Feb; 13: (2): 164-170. |
[32] | Fujimura S, Takao H, Suzuki T, Dahmani C, Ishibashi T, Mamori H, et al. A new combined parameter predicts re-treatment for coil-embolized aneurysms: A computational fluid dynamics multivariable analysis study. J Neurointerv Surg. (2018) Aug; 10: (8): 791-796. |
[33] | Fencil LE, Doi K, Chua KG, Hoffman KR. Measurement of absolute flow rate in vessels using a stereoscopic DSA system. Phys Med Biol. (1989) Jun; 34: (6): 659-71. |
[34] | Kohata Y, Ohta M, Jin K, Anzai H. Effects of helical centerline stent vs. straight stent placement on blood flow velocity. Front Med Technol. (2023) Jun 2; 5: : 1196125. doi: 10.3389/fmedt.2023.1196125. PMID: 37333882; PMCID: PMC10272720. |
[35] | Shpilfoygel SD, Close RA, Valentino DJ, Duckwiler GR. X-ray videodensitometric methods for blood flow and velocity measurement: A critical review of literature. Med Phys. (2000) Sep; 27: (9): 2008-23. |
[36] | Waechter I, Bredno J, Weese J, Barratt DC, Hawkes DJ. Using flow information to support 3D vessel reconstruction from rotational angiography. Med Phys. (2008) Jul; 35: (7): 3302-16. |
[37] | Bonnefous O, Pereira VM, Ouared R, Brina O, Aerts H, Hermans R, et al. Quantification of arterial flow using digital subtraction angiography. Med Phys. (2012) Oct; 39: (10): 6264-75. |
[38] | Boegel M, Gehrisch S, Redel T, Rohkohl C, Hoelter P, Doerfler A, et al. Patient-individualized boundary conditions for CFD simulations using time-resolved 3D angiography. Int J Comput Assist Radiol Surg. (2016) Jun; 11: (6): 1061-9. |
[39] | Wu Y, Shaughnessy G, Hoffman CA, Oberstar EL, Schafer S, Schubert T, et al. Quantification of blood velocity with 4D digital subtraction angiography using the shifted least-squares method. AJNR Am J Neuroradiol. (2018) Oct; 39: (10): 1871-1877. |
[40] | Shaughnessy G, Schafer S, Speidel MA, Strother CM, Mistretta CA. Measuring blood velocity using 4D-DSA: A feasibility study. Med Phys. (2018) Oct; 45: (10): 4510-4518. |
[41] | Ruedinger KL, Harvey EC, Schafer S, Speidel MA, Strother CM. Optimizing the quality of 4D-DSA temporal information. AJNR Am J Neuroradiol. (2019) Dec; 40: (12): 2124-2129. |
[42] | Waihrich E, Clavel P, Mendes G, Iosif C, Kessler IM, Mounayer C. Influence of anatomic changes on the outcomes of carotid siphon aneurysms after deployment of flow-diverter stents. Neurosurgery. (2018) Dec 1; 83: (6): 1226-1233. |
[43] | Pereira VM, Bonnefous O, Ouared R, Brina O, Stawiaski J, Aerts H, et al. A DSA-based method using contrast-motion estimation for the assessment of the intra-aneurysmal flow changes induced by flow-diverter stents. AJNR Am J Neuroradiol. (2013) Apr; 34: (4): 808-15. |
[44] | Cebral JR, Mut F, Raschi M, Hodis S, Ding YH, Erickson BJ, et al. Analysis of hemodynamics and aneurysm occlusion after flow-diverting treatment in rabbit models. AJNR Am J Neuroradiol. (2014) Aug; 35: (8): 1567-73. |
[45] | Mihl C, Wildberger JE, Jurencak T, Yanniello MJ, Nijssen EC, Kalafut JF, et al. Intravascular enhancement with identical iodine delivery rate using different iodine contrast media in a circulation phantom. Invest Radiol. (2013) Nov; 48: (11): 813-8. |
[46] | Kwon B, Song Y, Hwang SM, Choi JH, Maeng J, Lee DH. Injection of contrast media using a large-bore angiography catheter with a guidewire in place: Physical factors influencing injection pressure in cerebral angiography. Interv Neuroradiol. (2021) Aug; 27: (4): 558-565. |
[47] | Rengo M, Dharampal A, Lubbers M, Kock M, Wildberger JE, Das M, et al. Impact of iodine concentration and iodine delivery rate on contrast enhancement in coronary CT angiography: A randomized multicenter trial (CT-CON). Eur Radiol. (2019) Nov; 29: (11): 6109-6118. |


