
Value of magnetic resonance imaging radiomics features in predicting histologic grade of invasive ductal carcinoma of the breast
Abstract
BACKGROUND:
Breast cancer has the second highest mortality rate of all cancers and occurs mainly in women.
OBJECTIVE:
To investigate the relationship between magnetic resonance imaging (MRI) radiomics features and histological grade of invasive ductal carcinoma (IDC) of the breast and to evaluate its diagnostic efficacy.
METHODS:
The two conventional MRI quantitative indicators, i.e. the apparent diffusion coefficient (ADC) and the initial enhancement rate, were collected from 112 patients with breast cancer. The breast cancer lesions were manually segmented in dynamic contrast-enhanced MRI (DCE-MRI) and ADC images, the differences in radiomics features between Grades I, II and III IDCs were compared and the diagnostic efficacy was evaluated.
RESULTS:
The ADC values (0.77
CONCLUSION:
ADC values and breast MRI radiomics signatures are significant in identifying the histological grades of IDC, with the ADC radiomics signatures having greater value.
1.Introduction
Breast cancer has the second highest mortality rate of all cancers and occurs mainly in women. Its incidence and mortality rate are expected to increase significantly in the coming years [1]. The most common pathological type of breast cancer in clinical practice is invasive ductal carcinoma (IDC) [2]. Studies have shown that IDC’s histological grade is associated with the patient’s 5-year survival rate, clinical outcome and prognosis. The likelihood of invasion and metastasis is higher in poorly differentiated (high histological grade) IDC. Identifying the histological grade of IDC can help in selecting the optimal treatment plan for patients and evaluating treatment effectiveness and prognosis [3]. However, routine imaging examinations are unlikely to accurately determine the histological grade of IDC.
In recent years, there has been increasing use of magnetic resonance imaging (MRI) technology by healthcare professionals to examine patients with IDC, including dynamic contrast-enhanced MRI (DCE-MRI) and diffusion-weighted imaging (DWI) [4, 5]. The ability of MRI to present breast images aids in confirming the progression of IDC, which is helpful in diagnosing the condition. However, the relationship between MRI features and IDC histological grade remains unclear [6, 7]. The initial enhancement rate (IER) is a common quantitative parameter used in DCE-MRI, while the apparent diffusion coefficient (ADC) value is a common quantitative parameter used in DWI. Breast MRI images contain numerous features that cannot be observed by the naked eye. These imaging texture features may have a relationship with the microscopic structure and biological characteristics of tumour tissues. Radiomics refers to the high-throughput extraction and analysis of a large number of advanced and quantitative imaging features from medical images such as MRI [8].
This study aims to investigate the relationship between radiomics features based on breast MRI and the histological grade of IDC, with a view to providing more valuable references for preoperative prediction of the histological grade of patients with breast cancer.
2.Data and methods
2.1Participants
A retrospective analysis was conducted on the medical records of 112 patients with breast cancer who were hospitalised for treatment from January 2020 to January 2023. The inclusion criteria were as follows: (1) patients who had a single mass in the breast that was confirmed to be IDC by the pathological classification of the resected tissue sent for examination, and (2) patients who underwent DCE-MRI and DWI scans and MRI images were obtained. The exclusion criteria were as follows: (1) patients who had a history of radiotherapy or chemotherapy before MRI examination upon admission, (2) patients with a history of biopsy or surgical resection and (3) patients with a history of local or systemic treatment. This study was approved by the ethics committee of the hospital.
2.2Data collection
The breast MRI images of all patients were collected, and values of the breast MRI quantitative parameters ADC and IER were measured. The region of interest (ROI) was independently delineated for all tumour regions in ADC and DCE images. The MATLAB 2012b software package (MathWorks, Natick City, USA) was adopted to extract features from the tumour regions within the ROI in both the ADC and DCE images. The lesion tissue resected from patients after surgery was used as pathological specimens for histological grading. The relationship between the radiomics features of breast MRI and the pathological grade of IDC was compared.
2.2.1Magnetic resonance image acquisition
Scanning was performed using a Siemens 1.5T MRI imaging device (Siemens AG, Munich, Germany). Examination position: The patient was prone on the examination bed with the head entering the scanner first. The upper arms were extended forward to allow the breasts to naturally hang inside the breast coil. Scanning area: The scanning area included both breasts and the axillary region.
Parameters for plain scanning: Row axial fast spin echo (FSE) T1-weighted (repetition time [TR] 600 ms, time to echo [TE] 13 ms, field of view [FOV] 340 mm
Parameters for DCE scanning: A high-pressure injector was used to inject gadodiamide (GE HealthCare) at a flow rate of 2.5 ml/s through the elbow vein at a dose of 0.2 ml/kg body weight, followed by an equal amount of normal saline at the same rate. A T1-Flash-3D sequence was performed without a slice gap (TR 4.67 ms, TE 1.66 ms, slice thickness 1.2 mm, FOV 340 mm
2.2.2Image analysis and parameter extraction
2.2.2.1 Measurement of quantitative parameters of breast magnetic resonance imaging
The ADC and IER values were measured in a Siemens 1.5 T superconducting magnetic resonance system. First, DWI images with
IER
where SI baseline and SI post (3 min) represent the signal enhancement before contrast injection and the peak signal intensity within 3 min after contrast injection, respectively.
2.2.2.2 Manual segmentation of breast tumours
Tumour segmentation was performed manually by using Image J software (National Institutes of Health, Bethesda, USA) to outline ROIs independently for all tumour regions in the ADC and DCE maps without the need to avoid cystic degeneration and necrotic areas. The DCE map was selected from the enhanced scan 3 min after the contrast injection. See Fig. 1.
Figure 1.
Segmentation results of a single breast mass on the left side of a breast cancer patient in ADC and DCE images. Note: a: ADC image; b: DCE image. The yellow-lined area represents the ROI.
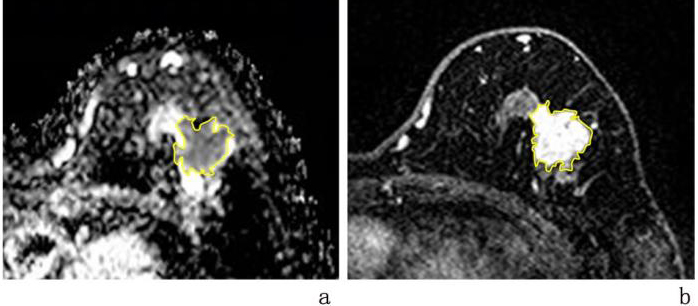
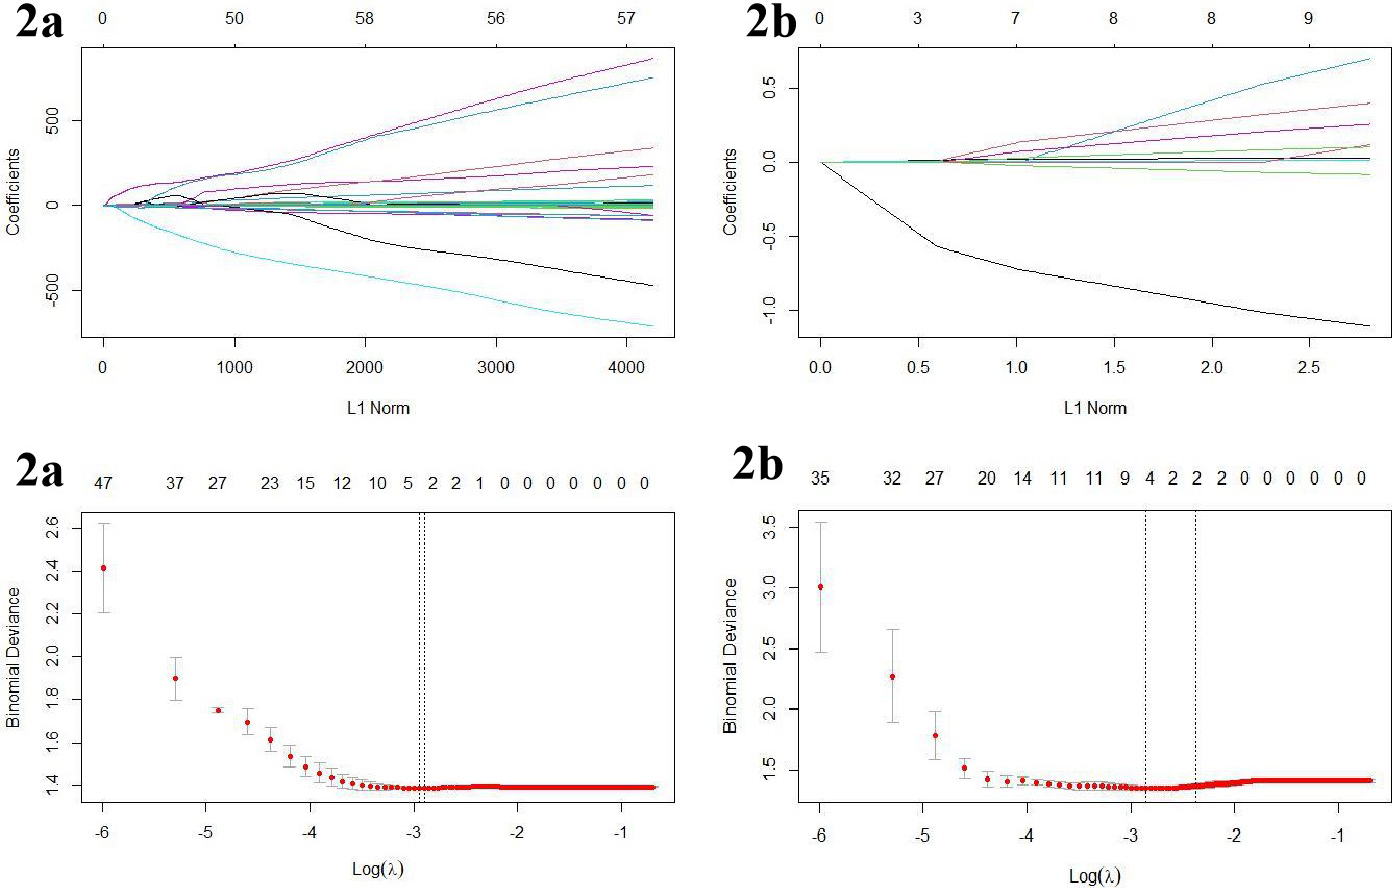
Figure 2.
The variable resolution path diagram for the LASSO regression. a is the ADC group and b is the DCE group. Each line represents a variable, and the numbers at the top of Fig. b are the number of remaining non-zero coefficient variables; the dotted lines represent the best image histological features filtered at this compression strength.
2.2.2.3 Extraction of invasive ductal carcinoma radiomics features and dimensionality reduction
The feature extraction of the tumour region within the ROIs of the ADC and DCE maps was performed using MATLAB software (https://cn.mathworks.com/) [10]. The extracted image features of the lesion region included four categories: morphological features, first-order statistical features, texture features and filtering features. When the features were extracted, they were pre-processed by (1) replacing the missing values in the data by using the median and (2) normalising the extracted features using Z-scores (defined as
2.2.2.4 Modelling of imaging histology
After screening the best features by the above methods, single and multifactor logistic regression was applied to the algorithm for image histology model construction. Three models were constructed: ADC value, ADC image labels and DCE image labels.
2.3Pathological examination
The postoperative resected tissues of all patients were collected as pathological specimens, and the histological grades were evaluated based on three aspects: the degree of glandular formation, the pleomorphism of cell nuclei and the mitotic count [11]. Each of the three parameters was scored between 1–3, and after adding up the scores, IDC was classified into three grades: well-differentiated (Grade I) for 3–5 points, moderately-differentiated (Grade II) for 6–7 points and poorly-differentiated (Grade III) for 8–9 points.
2.4Statistical analysis
R software version 3.3.1 was used for data analysis. The measurement data were presented as mean
3.Results
3.1General characteristics
In accordance with the inclusion and exclusion criteria, a total of 112 patients with breast cancer were enrolled, aged 19–79 years, with a mean age of (48.90
3.2Imaging histological characterisation and construction of models
Analysis of the consistency of the histological features extracted from the ROIs sketched by the two physicians confirmed that the consistency between the two was good. After analysing the ICC values
3.3Comparison of magnetic-resonance-imaging-related parameters and radiomics signatures
The ADC value of breast cancer lesions, B_sum_variance, L_energy and L_sum_average values of patients with Grade III IDC were all significantly lower than those of patients with Grades I and II IDC, whereas the B_uniform and L_SRE values were both significantly higher than those of patients with Grade I IDC, with all differences being statistically significant (
Table 1
Comparison of MRI related parameters and radiomics signatures of IDC patients of different grades
| Parameter | Grade I ( | Grade II ( | Grade III ( | |||||
|---|---|---|---|---|---|---|---|---|
| ADC ( | 0.91 | 0.92 | 0.77 | 4.204 | 0.004 | |||
| IER (%) | 170.78 | 171.15 | 160.75 | 1.556 | 0.562 | |||
| B_uniform | 0.11 | 0.12 | 0.15 | 3.797 | 0.008 | |||
| B_sum_variance | 265.37 | 263.74 | 188.51 | 6.040 | 0.001 | |||
| B_GLN | 52.46 | 54.36 | 60.50 | 2.771 | 0.723 | |||
| L_energy | 0.13 | 0.12 | 0.03 | 7.118 | 0.002 | |||
| L_SRE | 0.78 | 0.79 | 0.85 | 3.024 | 0.001 | |||
| R_RP | 0.84 | 0.83 | 0.80 | 1.647 | 0.603 | |||
| R_homogeneity2 | 0.38 | 0.39 | 0.47 | 1.799 | 0.560 | |||
| R_IDN | 0.89 | 0.90 | 0.89 | 2.793 | 0.085 | |||
| D_energy ( | 0.43 | 0.35 | 1.24 | 1.579 | 0.147 | |||
| L_sum_average | 16.34 | 15.45 | 0.78 | 21.860 | 0.000 | |||
Note: ADC: apparent diffusion coefficient; IER: initial enhancement rate.
3.4Diagnostic efficacy of magnetic-resonance-imaging-related parameters and radiomics signatures on histological grades of patients with invasive ductal carcinoma
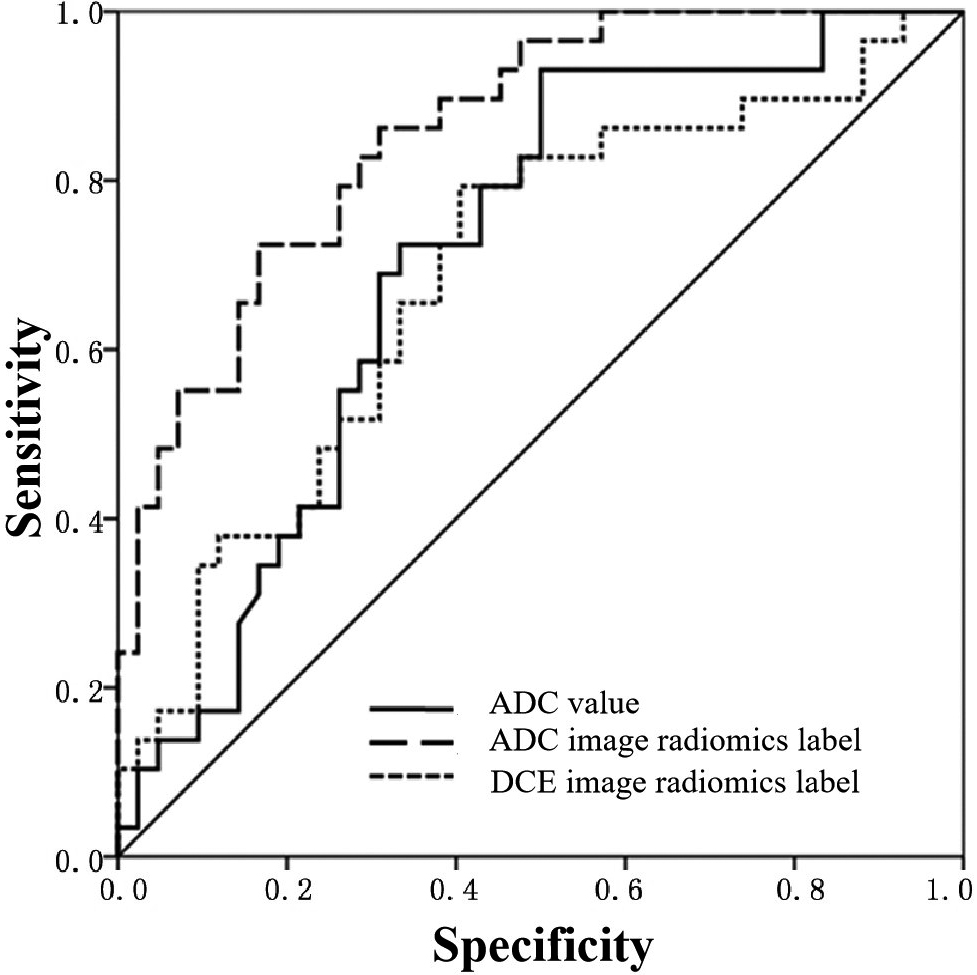
Logistic regression analysis was performed on the radiomics signatures that showed differences in Section 2.2. According to the results, the ADC radiomics signature model had the highest AUC value (0.869), indicating its ability to identify different levels of IDC. Moreover, this model had the highest accuracy (0.812), specificity (0.731), positive predictive value (0.815) and negative predictive value (0.753). The DCE radiomics signature model had the highest sensitivity (0.912) but the lowest specificity (0.342). The ADC value model had a relatively low specificity (0.435), suggesting that the DCE radiomics signature model and the ADC value model had lower values in identifying different levels of IDC than that of the ADC radiomics signature model. See Table 2 and Fig. 3.
Table 2
Diagnostic efficacy of MRI related parameters and radiomics signatures on histological grades of IDC patients
| Indicator | AUC (95% CI) | Accuracy | Sensitivity | Specificity | Positive predictive value | Negative predictive value |
|---|---|---|---|---|---|---|
| ADC value | 0.711 (0.572 | 0.647 | 0.779 | 0.435 | 0.663 | 0.570 |
| Radiomics signatures in ADC image | 0.869 (0.769 | 0.812 | 0.823 | 0.731 | 0.815 | 0.753 |
| Radiomics signatures in DCE image | 0.682 (0.559 | 0.710 | 0.912 | 0.342 | 0.669 | 0.718 |
Note: ADC: apparent diffusion coefficient; DCE: dynamic enhanced.
Figure 3.
ROC curve of ADC value and radiomics signature model for identifying IDC of different grades in breast cancer patients.
4.Discussion
The clinical diagnosis and treatment of malignant breast lesions is challenging due to the different biological behaviours of different regions of the same breast lump and the uncertain and difficult-to-detect pathogenic factors. Previous studies [6] have shown that MRI does not cause ionising radiation damage to patients and has a high sensitivity for detecting subtle pathological changes in the breast. The histological grades of malignant breast lesions play a crucial role in selecting appropriate treatment methods and making accurate prognoses for patients. However, the detection process for this parameter is complicated and susceptible to significant interobserver variability. Studies [12] have indicated that histological grade is related to not only the prognosis of patients with breast cancer but also the involvement of their lymph nodes. Patients with higher histological grades usually have poor prognoses, and their lymph nodes are more prone to be involved.
The DCE-MRI technique provides information about the blood vessels of the lesion, as well as high-resolution morphological information and enhancement features of breast lesions after injection of the contrast agent. The IER semi-quantitative parameter is commonly used in DCE-MRI, reflecting the peak enhancement rate during the first 3 min after injection of the contrast agent. Previous research has suggested that higher IER values indicate faster tumour growth and stronger invasiveness [13]. However, this study found that IER values had no specific value in identifying breast cancer histological grades, which was consistent with the findings of Wu et al. [8]. Diffusion-weighted imaging is a promising complement to routine DCE-MRI. The ADC value reflects the Brownian motion of water molecules in tissue [14]; high-grade breast cancer has a faster growth rate and a higher cell density than low-grade cancers, so the ADC value may be lower. This study found that the ADC value of high-grade breast cancer was significantly lower than that of low-grade breast cancer and had a negative correlation with histological grade [15]. Patients with Grade III breast cancer had significantly lower ADC values than those with Grade I or II. Park et al. [16] found that there was no statistically significant difference in ADC values between Grade I, II and III breast cancer, but the ADC value of Grade III breast cancer was significantly higher than that of Grades I and II, suggesting that the ADC value may be an effective parameter for identifying Grade III breast cancer.
The ADC image was manually segmented in this study, which helped to clarify the tumour boundary, reduced the interference of the penetration effect and minimised the differences between observers [17]. However, manual segmentation has some drawbacks, and different individuals may draw different boundaries for the same tumour. Machine learning algorithms that demonstrate a stand-alone application in mammographic screening workflows achieve or even exceed human reader detection performance and improve efficiency, have good application value in disease prediction and can provide a reference basis for disease diagnosis [18, 19]. Kim et al. [20] achieved good research results by using software to automatically identify the tumour area and implement automatic segmentation. In future studies, the authors will attempt to use software to automatically identify the tumour area for segmentation and introduce artificial intelligence [21, 22]. Furthermore, for the DCE-MRI image, the information acquisition time point in this study was 3 min after contrast agent injection, when the contrast between the normal breast tissue and diseased tumour tissue was most prominent. This could help the interpreting physician identify the tumour boundary and accurately segment the tumour [23].
In this study, two radiomics signature models were established based on ADC and DCE images, and several radiomics features related to tumour heterogeneity were included among many of them. For patients with Grade III IDC, the ADC value of the tumour lesion as well as the B_sum_variance, L_energy and L_sum_average values were all significantly lower than those of patients with Grades I and II IDC. The B_uniform and L_SRE values were both significantly higher than those of patients with Grades I and II IDC. In addition, the specificity, accuracy, positive predictive value and negative predictive value of radiomics features in the ADC image were all better than those in the DCE image and ADC values. These findings suggest that ADC images may contain radiomics features that cannot be directly observed with the naked eye and that these features can help clinicians identify the histological grade of breast cancer.
However, there are some limitations to this study: (1) for non-mass breast cancer lesions, physicians have difficulty accurately determining the tumour boundary when manually segmenting scattered and diffuse masses. Therefore, patients with non-mass breast cancer should be excluded when selecting study participants; (2) two-dimensional segmentation was performed, which may have resulted in the loss of some morphological information about the tumour; and (3) the study focused on a single-centred case and had a small sample size.
5.Conclusion
In summary, ADC values and breast MRI radiomics signatures can facilitate the identification of IDC of different grades, and radiomics signatures in the ADC image have good diagnostic efficiency. With further research, the radiomics of breast MRI are expected to provide more valuable information for identifying the histological grades of tumours in patients with breast cancer.
Availability of data and materials
The datasets used and analyzed during the current study are available from the corresponding author on reasonable request.
Competing interests
None of the authors have any personal, financial, commercial, or academic conflicts of interest to report. There is no one who has contributed to the manuscript but does not qualify as a collaborator.
Funding
The study was supported by the Science and Technology Research Project of Education Department of Jilin Province (JJKH20220070KJ).
Authors’ contributions
Study design: Xin-Lei Yang, Dong-He Ni, Yang Yu, Jin-Cui Zhao.
Data acquisition: Rui Lin, Chao Xiu, Zhe-Xing Chang.
Data analysis and interpretation: Rui Lin, Chao Xiu, Zhe-Xing Chang.
Manuscript preparation: Xin-Lei Yang, Dong-He Ni, Yang Yu, Jin-Cui Zhao.
Critical revision of the manuscript for intellectual content: Chao Xiu, Zhe-Xing Chang.
Obtaining financing: Chao Xiu.
All authors reviewed the manuscript and approved the version to be published.
References
[1] | Grabinski VF, Brawley OW. Disparities in breast cancer. Obstet Gynecol Clin North Am. (2022) ; 49: (1): 149-165. doi: 10.1016/j.ogc.2021.11.010. |
[2] | Tsang JYS, Tse GM. Molecular classification of breast cancer. Adv Anat Pathol. (2020) ; 27: (1): 27-35. doi: 10.1097/PAP.0000000000000232. |
[3] | Metzger-Filho O, Ferreira AR, Jeselsohn R, Barry WT, Dillon DA, Brock JE, Vaz-Luis I, Hughes ME, Winer EP, Lin NU. Mixed invasive ductal and lobular carcinoma of the breast: Prognosis and the importance of histologic grade. Oncologist. (2019) ; 24: (7): e441-e449. doi: 10.1634/theoncologist.2018-0363. |
[4] | Cai LF, Zhu XP. Comparison of clinicopathologic features between intraductal carcinoma and invasive ductal carcinoma of breast. Zhejiang Medical Journal. (2019) ; 41: (18): 2013-2016. |
[5] | Wu JF, Liu WY. Application status and research progress of magnetic resonance imaging in diagnosis and prognostic evaluation of breast cancer. Chinese Journal of Magnetic Resonance Imaging. (2023) ; 14: (04): 171-175. |
[6] | Gong N, Li HA, Zhu BJ. Diagnostic value of radiomics combination of dynamic contrast-enhanced magnetic resonance imaging and diffusion weighted imaging in microscopic breast cancer lesions. Journal of Clinical Medicine in Practice. (2023) ; 27: (05): 21-25+54. |
[7] | Mori N, Mugikura S, Miyashita M, Mori Y, Maekawa Y, Nagasaka T, Takase K. Turbo spin-echo diffusion-weighted imaging compared with single-shot echo-planar diffusion-weighted imaging: Image quality and diagnostic performance when differentiating between ductal carcinoma in situ and invasive ductal carcinoma. Magn Reson Med Sci. (2021) ; 20: (1): 60-68. doi: 10.2463/mrms.mp.2019-0195. |
[8] | Wu PQ, Liu ZY, Liang CH. Value of radiomics features based on MRI in identifying pathological grades of invasive ductal carcinoma of breast. Journal of Medical Postgraduates. (2018) ; 31: (09): 938-942. doi: 10.16571/j.cnki.1008-8199.2018.09.008. |
[9] | Wang M, Liu PJ, Wen JR, Li X, Jiang ZJ. Analysis of the diagnostic efficacy of radiomic features in magnetic resonance imaging on the histological classification of invasive ductal carcinoma. Oncology Progress. (2020) ; 18: (13): 1324-1326+1380. |
[10] | Waugh SA, Purdie CA, Jordan LB, Vinnicombe S, Lerski RA, Martin P, Thompson AM. Magnetic resonance imaging texture analysis classification of primary breast cancer. Eur Radiol. (2016) ; 26: (2): 322-330. doi: 10.1007/s00330-015-3845-6. |
[11] | Mei F, Liu JiY, Xue WC. Histological grading of invasive breast cancer: Nottingham histological grading system. Chinese Journal of Pathology. (2019) ; 48: (08): 659-664. |
[12] | Li LL, Su QL, Lin FF, Deng YX, Zhang YY Hu Q. Value of contrast-enhanced ultrasound in the preoperative evaluation of histological grade of invasive breast cancer. Chinese Journal of Ultrasound in Medicine. (2022) ; 38: (12): 1350-1354. |
[13] | Mori N, Abe H, Mugikura S, Takasawa C, Sato S, Miyashita M, Mori Y, Pineda FD, Karczmar GS, Tamura H, Takahashi S, Takase K. Ultrafast dynamic contrast-enhanced breast MRI: Kinetic curve assessment using empirical mathematical model validated with histological microvessel density. Acad Radiol. (2019) ; 26: (7): e141-e149. doi: 10.1016/j.acra.2018.08.016. |
[14] | De Cataldo C, Bruno F, Palumbo P, Di Sibio A, Arrigoni F, Clemente A, Bafile A, Gravina GL, Cappabianca S, Barile A, Splendiani A, Masciocchi C, Di Cesare E. Apparent diffusion coefficient magnetic resonance imaging (ADC-MRI) in the axillary breast cancer lymph node metastasis detection: A narrative review. Gland Surg. (2020) ; 9: (6): 2225-2234. doi: 10.21037/gs-20-546. |
[15] | Weber M, Kessler L, Schaarschmidt B, Fendler WP, Lahner H, Antoch G, Umutlu L, Herrmann K, Rischpler C. Textural analysis of hybrid DOTATOC-PET/MRI and its association with histological grading in patients with liver metastases from neuroendocrine tumors. Nucl Med Commun. (2020) ; 41: (4): 363-369. doi: 10.1097/MNM.0000000000001150. |
[16] | Park EK, Cho KR, Seo BK, Woo OH, Cho SB, Bae JW. Additional value of diffusion-weighted imaging to evaluate prognostic factors of breast cancer: Correlation with the apparent diffusion coefficient. Iran J Radiol. (2016) ; 13: (1): e33133. Published 2016 Jan 16. doi: 10.5812/iranjradiol.33133. |
[17] | Pirtea L, Grigoraş D, Matusz P, Pirtea M, Moleriu L, Tudor A, Ilina R, Secoşan C, Horhat F, Mazilu O. Age and HPV type as risk factors for HPV persistence after loop excision in patients with high grade cervical lesions: An observational study. BMC Surg. (2016) ; 16: (1): 70. Published 2016 Oct 6. doi: 10.1186/s12893-016-0185-7. |
[18] | Hickman SE, Woitek R, Le EPV, et al. Machine learning for workflow applications in screening mammography: Systematic review and meta-analysis. Radiology. (2022) ; 302: (1): 88-104. doi: 10.1148/radiol.2021210391. |
[19] | Dou Y, Meng W. Comparative analysis of weka-based classification algorithms on medical diagnosis datasets. Technol Health Care. (2023) ; 31: (S1): 397-408. doi: 10.3233/THC-236034. |
[20] | Jin MQ. Preoperative Prediction of Histological Grade of Invasive Ductal Carcinoma of Breast Based on DCE-MRI Radiomics Signatures. Xinjiang Medical University. (2021) . doi: 10.27433/d.cnki.gxyku.2021.000395. |
[21] | Badnjević A, Avdihodžić H, Gurbeta Pokvić L. Artificial intelligence in medical devices: Past, present and future. Psychiatr Danub. (2021) ; 33: (Suppl 3): S336-S341. |
[22] | Kröner PT, Engels MM, Glicksberg BS, et al. Artificial intelligence in gastroenterology: A state-of-the-art review. World J Gastroenterol. (2021) ; 27: (40): 6794-6824. doi: 10.3748/wjg.v27.i40.6794. |
[23] | Sontakke BR, Ambulkar PS, Talhar S, Shivkumar PV, Bharambe MS, Pal A. Molecular Genetic Study to Detect Prevalence of High-risk Human Papilloma Virus Strains (type 16 and 18) in Cervical Lesions and Asymptomatic Healthy Subjects of Rural Central India. J Cytol. (2019) ; 36: (1): 32-37. doi: 10.4103/JOC.JOC_10_18. |


