
Post-processing calcium subtraction method to minimize stenosis-overestimation by blooming artifact
Abstract
BACKGROUND:
CT images are often affected by blooming artifacts during the diagnosis that facilitate an overestimation of the expression of calcification stenosis, thereby impeding the accurate diagnosis of this condition.
OBJECTIVE:
Arterial calcification can act as a blooming artifact in computed tomography (CT) images, leading to overestimations of the blood vessel and the size of calcified plaque. This study proposes an improved CT post-processing method that accurately measures calcium and lumen size in blood vessels.
METHODS:
Six hundred and thirty calcium datasets were obtained from 63 patients diagnosed with a vascular disease. Patients were grouped into three sets corresponding to each image acquisition method used: G1, for the invasive coronary angiography (ICA); G2, for multiplanar reconstruction (MPR) imaging and post-processing; and G3, for the novel method of mixed Gaussian filter and K-mean clustering (GK). Results of GK were generated by adding Gaussian and k-mean clustering algorithms to the MPR post-processing procedure. The analysis of variance (ANOVA), linear regression, and intraclass correlation coefficient (ICC) were used to compare the accuracy and sensitivity of the different methods. All measurements were performed multiple times to mitigate human error.
RESULTS:
The ANOVA test revealed no significant differences between the G1 and G3 groups. Hence, linear regression was used to analyze the correlation between the G1 and G3 groups (
CONCLUSIONS:
Results of the study indicate that the GK method yields images that are very similar to ICA image measurements. This suggests that the GK can be used as a more effective post-processing method over the inaccurate MPR while remaining non-intrusive when determining the arterial stenosis degree, unlike the ICA.
1.Introduction
Although the annual rates of mortality are decreasing in Korea, the highest proportion (61%) of deaths is attributed to cardiovascular diseases (CVDs) [1]. CVDs are a group of cardiac and blood vessel disorders that are the leading cause of noncommunicable morbidity and mortality on a global level. In fact, CVDs such as hypertension, stroke, heart failure, and coronary heart disease result in
A previous study has found that CT images tend to overestimate the extent of stenosis when calcification is present, especially when obtaining images by adjusting the time resolution of the CT [4]. Other methods, such as multiplanar reconstruction (MPR), a post-processing method applied to CT images, maintains some of these inaccuracies. Therefore, such image post-processing techniques can only be used in limited environments.
Our study proposes a method to enhance the diagnostic outcome of CT scans with a multiple sampling technique, similar to the process employed by the coronary computed tomography angiography (CCTA), which uses subtraction data to generate more accurate images [5]. However, instead of simple subtraction data, the proposed method utilizes threshold and fuzzy algorithms to reduce the overestimation of calcification [6, 7]. The experimental process was performed by varying contrast with the IMAGE J Program, whereas image post-processing technology was used to improve the accuracy of calcification readings [8]. To detect and quantify aortic calcification, the Hough transform was used in all noncontrast CT images [9]. Despite the efforts made to support the development of robust deep learning (DL) software [10], an established limitation of these DL algorithms is that performance can be rapidly degraded and fail with what appears to humans as only slight variations in the input data [11]. Current studies have not taken the actual size of calcium in CT into consideration.
We acquired CT images using the calcification phantom and we measured the calcification with a microscope. Next, images were compared with eight post-processed CT images, and calcification was extracted with the application of a mixed Gaussian filter and k-mean clustering (GK). The GK utilizes Gaussian and k-mean clustering algorithms to compare the calcified plaque within a calcification phantom, defined by microscopic measurements of the calcification phantom, with the calcified plaque of an MPR image. In general, CT image post-processing can be performed with approximately eight methods (i.e., MPR), and the GK method attempts to limit the number of these post-processing methods for brevity while reporting equivalent or better imaging [12]. This study aimed to evaluate whether the GK method can produce data as accurately as the ICA while maintaining the beneficial features of a CT scan.
Contributions
• As an updated option for overcoming the blooming artifact-related CTCA limitation, this study attempts to implement a software-based technique at the stage of post-processing.
• Among eight post-processing algorithms, a mixed GK methodology was adopted, which is the best method to extract the calcification.
• Although the predictability in linear regression analysis based on ICA data was not high, the degrees of stenosis measured by the GK method showed statistical significance.
2.Method
2.1Patient characteristics
This study was approved by the Kyungpook National University Institutional Review Board (IRB No. 2017–0120). Images were collected from 50 to 70 years old patients with calcium. To maintain patient confidentiality, all medical image data were anonymous, and a total of 630 medical images were obtained from 63 patients. ICA and MPR images were retrieved from 63 patients with multiple sites of calcification. Ten images were taken from one calcium site. Data were divided into three group sets: group one (G1) was the result of ICA imaging, group two (G2) was the default outcome of the standard MPR post-processing, and group three (G3) included the MPR images treated with the GK method. A total of 630 calcium data images were collected from the 63 patients to comprise the groups.
2.2Modalities
A third-generation dual-source CT scanner, the SOMATOM Force (Siemens Healthineers Global, Forchheim, Germany) was used for CT/MPR data acquisition. Prospective adaptive-sequential scan data were acquired during 20%–100% of the respiratory rate-interval. An automated tube current modulation (CARE Dose4D, Siemens Healthineers Global, Forchheim, Germany) and an automated tube voltage selection (ATVS, Siemens) were applied. The peak voltage (kVp) settings ranged from 70 to 120 according to the patient’s body habitus, and the adaptive detector collimation ranged from 96 to 192 steps of 8
2.3ICA image post-processing
This study used the ICA image as the standard, exhibiting a method to examine coronary arteries containing contrast media using MDCT for a more accurate determination of the presence of vascular stenosis (Fig. 1). The degree of stenosis in the same vessel, as shown on the ICA images, was used to calculate the ratio between the areas with and without stenosis. Equation (1) was used to calculate the degree of stenosis, which is defined as ((vessel size with stenosis – vessel size without stenosis)/vessel size with stenosis)
(1)
Figure 1.
Stenosis measurement of blood vessels in ICA images.
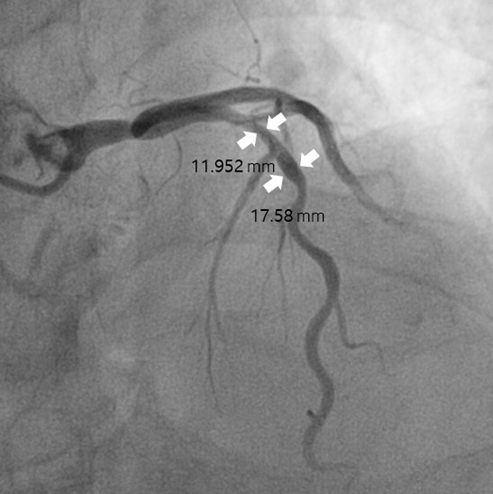
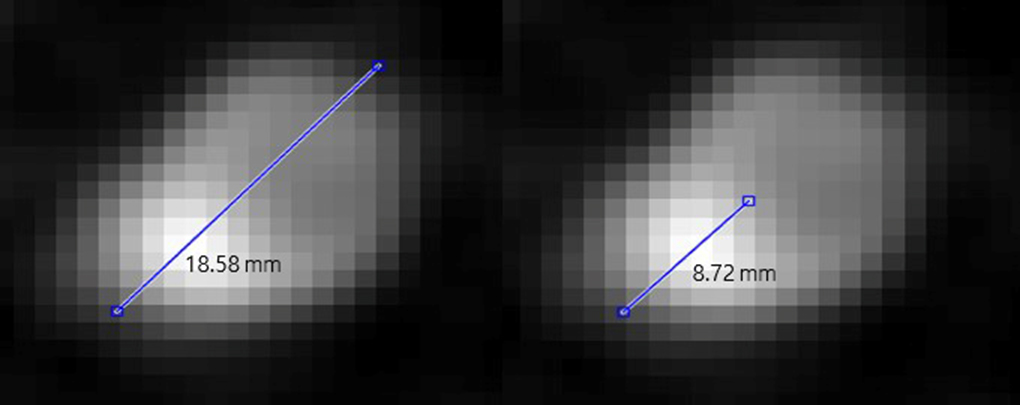
Figure 2.
The longest diameter of the blood vessel was measured and then compared with the calcium at the same diameter. (a) Measurement of the outer diameter of the blood vessel (b) Measurement of the length of the calcium region in the blood vessel.
2.4MPR image post-processing
We obtained the MPR image that was used as the control group in the study by a CT scan of the coronary artery. In the subsequent images, the degree of stenosis was calculated as the ratio of the total length of the vessel to the length of the calcified area. MPR images were measured using cross-sectional images of the blood vessels, whereas MPR images of other shapes were excluded. Regarding blood vessels and calcium in the MPR images, we measured the longest diameter of blood vessels and calcium was measured within that longest diameter (Fig. 2). Equation (2) describes the degree of stenosis, which is defined as (calcified area/blood vessel containing calcified)
(2)
2.5GK image post-processing
(3)
For K-means clustering, the first K centers were specified. Dependent on the center of the data to form a cluster, a cluster is created that minimizes the cost function. The k-means clustering function is shown in the form of Eq. (4).
(4)
Figure 3.
The original image was cut to include calcium and lumen. A Gaussian filter was used to filter the cropped image and k-mean clustering was used to extract the calcification values. Then, the cut image is multiplied from the original and the resulting image is the image without the blooming artifact. Equation (3) was used to reduce noise in the image using a Gaussian filter.
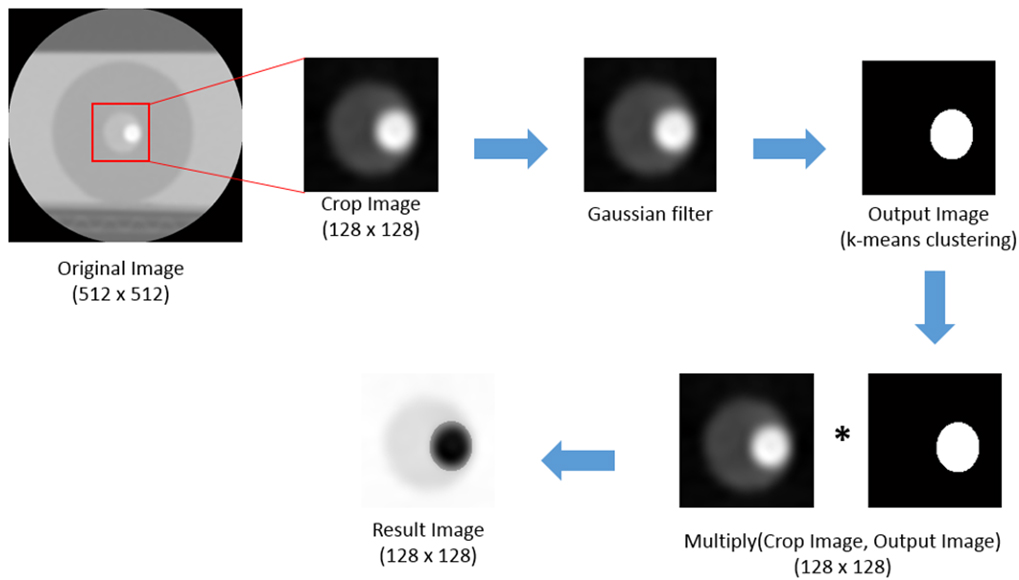
The GK method (Fig. 3) is an image-processing technique that allows researchers to obtain more accurate stenosis information because it reduces the range of exaggerated calcium in MPR images by combining Gaussian and k-mean clustering algorithms. The GK method takes 128
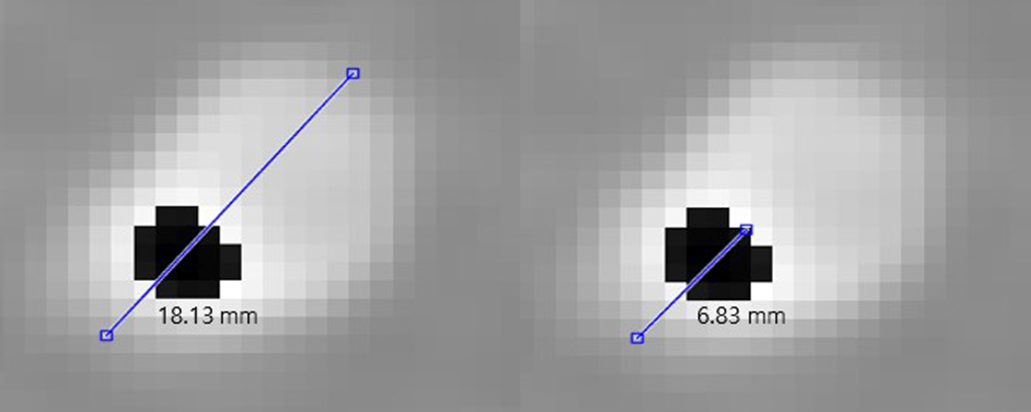
Figure 4.
Measurement of the length of the lumen and calcium in the GK image with (left) measurement of the diameter of the blood vessel and (right) measurement of the length of the calcium region in the blood vessel.
3.Statistical analysis
G1 (ICA) was used as the control group, whereas G2 (MPR) and G3 (MPR with GK) were the experimental groups. One-way analysis of variance (ANOVA) was used for the control group and we compared the mean values obtained with the experimental groups. Next, a linear regression analysis was performed to determine whether a correlation between the control group and the experimental groups existed. The intraclass correlation coefficient (ICC) was calculated and was used to determine whether differences depended on the person measuring the blooming artifact, as well as to evaluate the reproducibility of such a measurement method. The researcher measured three consecutive cases of the same image, 10 times in each of the three groups, while measuring the reliability and reproducibility with the ICC [13]. Statistical analysis was performed by excluding outlier data.
4.Results
Table 1 presents the acquired ANOVA results (
Table 1
Descriptive statistics and ANOVA results comparing the stenosis of the three groups tested
| Group | N | Mean (mm) | SD (mm) | Min (mm) | Max (mm) | ANOVA | Tukey’s HSD | |
|---|---|---|---|---|---|---|---|---|
| G1 | 630 | 38.1 | 5.24 | 13.24 | 51.11 | Group | ||
| G2 | 630 | 42.5 | 4.86 | 14.21 | 56.34 | G1 vs G2 | ||
| G3 | 630 | 38.9 | 4.97 | 13.12 | 55.77 | G1 vs G3 | ||
ANOVA between G1, ICA image (control group); G2, MPR image (experimental group); G3, GK image (experimental group), N (number of calcium data).
Table 2
Linear regression showing the relationship between the experimental and the control groups
| Group | R square | |
|---|---|---|
| G1 vs G2 | 0.432 | |
| G1 vs G3 | 0.885 |
G1, ICA image (control group); G2, MPR image (experimental group); G3, GK image (experimental group).
Table 3
Intraclass correlation coefficient of G1, G2, and G3
| Group | ICC | 95% CI | ||
| Min | Max | |||
| G1 | 0.994 | 0.981 | 0.998 | |
| G2 | 1 | 0.999 | 1 | |
| G3 | 0.999 | 0.999 | 1 | |
G1, ICA image (control group); G2, MPR image (experimental group); G3, GK image (experimental group).
Linear regression analysis was used to examine the correlation among the control group G1 and the experimental groups G2 and G3. As shown in Table 2, we found a value of R2
5.Conclusion
The degree of stenosis due to blooming artifacts was measured in ICA, MPR, and GK images. With the ICA images used as the standard, we compared the MPR images, and we used GK to identify which method could most accurately identify the degree of stenosis in spite of the blooming artifacts. ANOVA and linear regression showed that the MPR image was significantly different from the ICA image, whereas GK showed similar results to the standard image. Thus, the GK method can promise more accurate and highly reproducible stenosis measurements that are unaffected by blooming artifacts. We expect that the GK method can improve the ability of health professionals to provide more accurate diagnosis and minimize the number of ICA scans on patients. Based on the results of our research, it is important to develop software that can remove calcification from the existing CT images, and thus provide accurate images to clinicians.
Acknowledgments
This study was funded by the National Research Foundation (NRF), ICT and Future Planning (MSIP; Grant Number: 2015R1A2A2A03005433).
Conflict of interest
None to report.
References
[1] | Korea S. Causes of death statistics in 2016 [Internet]. Daejeon: Statistics Korea; c2017 [cited 2017 Sep 22]. |
[2] | Lim J-H, Kwon T-K. Effects of Luteolin on IL-1β-Induced MCP1 Protein Expression. Journal of Life Science. (2009) ; 19: (4): 514-9. |
[3] | Polonsky TS, McClelland RL, Jorgensen NW, Bild DE, Burke GL, Guerci AD, et al. Coronary artery calcium score and risk classification for coronary heart disease prediction. Jama. (2010) ; 303: (16): 1610-6. |
[4] | Van Straten M, Venema HW, Streekstra GJ, Reekers JA, den Heeten GJ, Grimbergen CA. Removal of arterial wall calcifications in CT angiography by local subtraction. Medical Physics. (2003) ; 30: (5): 761-70. |
[5] | Rollano-Hijarrubia E, van der Meer F, van der Lugt A, Weinans H, Vrooman H, Vossepoel A, et al., eds. Improving the imaging of calcifications in CT by histogram-based selective deblurring. Medical Imaging 2005: Physics of Medical Imaging; 2005: International Society for Optics and Photonics. |
[6] | Do S, Karl WC, Liang Z, Kalra M, Brady TJ, Pien HH. A decomposition-based CT reconstruction formulation for reducing blooming artifacts. Physics in Medicine & Biology. (2011) ; 56: (22): 7109. |
[7] | Amanuma M, Kondo T, Sano T, Sekine T, Takayanagi T, Matsutani H, et al. Subtraction coronary computed tomography in patients with severe calcification. The International Journal of Cardiovascular Imaging. (2015) ; 31: (8): 1635-42. |
[8] | Kidoh M, Utsunomiya D, Oda S, Yuki H, Funama Y, Namimoto T, et al. Optimized subtraction coronary CT angiography protocol for clinical use with short breath-holding time – initial experience. Academic Radiology. (2015) ; 22: (1): 117-20. |
[9] | Lee J-W, Kim S-H, Kim J-H, Lee H-W, Jung W-G, Lee G-K. Detection of coronary artery stenosis using Fuzzy algorithm. Journal of the Korea Institute of Information and Communication Engineering. (2011) ; 15: (9): 2013-8. |
[10] | Sun Z, Ng CK. High calcium scores in coronary CT angiography: Effects of image post-processing on visualization and measurement of coronary lumen diameter. Journal of Medical Imaging and Health Informatics. (2015) ; 5: (1): 110-6. |
[11] | Kurkure U, Avila-Montes OC, Kakadiaris IA, eds. Automated segmentation of thoracic aorta in non-contrast CT images. 2008 5th IEEE International Symposium on Biomedical Imaging: From Nano to Macro; 2008: : IEEE. |
[12] | Kim J-H, Park J-E, Park Y-J, Ji I-H, Lee J-M, Cho J-H. Comparison of blooming artifact reduction using image segmentation method in CT image. Journal of Biomedical Engineering Research. (2017) ; 38: (6): 295-301. |
[13] | Mead R, Curnow RN, Hasted AM. Statistical methods in agriculture and experimental biology: Chapman and Hall/CRC; (2017) . |


