
Exploration of quality criteria for the detection of peak inspiratory flow under different resistance conditions
Abstract
BACKGROUND:
At present, robust quality criteria and methods for the assessment of Peak inspiratory flow meter performance are lacking.
OBJECTIVE:
A standard flow-volume simulator for quality control analyses of an inhalation assessment device was utilized with different simulated resistance levels in order to propose a quality testing method and associated standard for this device type.
METHODS:
A standard flow-volume simulator was utilized to assess the performance of an In-Check DIAL
RESULTS:
Both devices exhibited good repeatability (
CONCLUSION:
Standard monitoring methods and standards provide a valuable approach to the more reliable clinical assessment and application of these instruments.
1.Introduction
Chronic airway diseases affect a large segment of the population and can impose a heavy burden of disease, thus posing a major threat to global public health [1, 2]. The treatment of these diseases centers around inhalation therapy approaches in which specific medicines are delivered to the lungs through inhaler devices, including pressurized metered dose inhalers (pMDIs), soft mist inhalers (SMIs), and dry powder inhalation devices (DPIs).
DPI resistance can be separated into five levels (R1–R5, from low to high) based on the amount of inhalation flow necessary to produce a pressure drop of 4 kPa [3, 4, 5, 6]. This value was selected for use when conducting the in vitro characterization of a drug dose delivered by a DPI. When using a DPI, patients must inhale forcefully to facilitate optimal inspiratory flow and drug release [7]. If this flow rate is too low or too high, however, it will result in suboptimal pulmonary drug deposition [8, 9, 10]. Owing to airflow limitations or impaired respiratory muscle strength, individuals suffering from chronic airway diseases often face difficulties reaching this minimum flow rate [11, 12, 13]. As such, peak inspiratory flow (PIF) is an important metric that can influence the therapeutic effects of inspiration in patients undergoing inhalation therapy [14, 15].
Measuring PIF under additional resistance can provide insight into the ability of patients to use DPIs [16], while also guiding inhalation device selection and inhaler technique training [17, 18]. The number of instruments capable of measuring PIF under different levels of resistance is gradually rising. The In-Check DIAL
Standard flow-volume simulations or similar standardized instruments need to be used to test the performance of spirometers and other devices that measure flow rates in clinical practice to ensure that only devices meeting defined technical and quality standards are used by patients. These devices must also undergo regular testing to ensure stability and accuracy [23]. Based on the current quality testing scheme without an inhalation assessment device, the present study was conducted using a standard flow-volume simulator for quality control analyses of an inhalation assessment device with different simulated resistance levels in order to propose a quality testing method and associated standard for this device type.
2.Materials and methods
2.1Materials
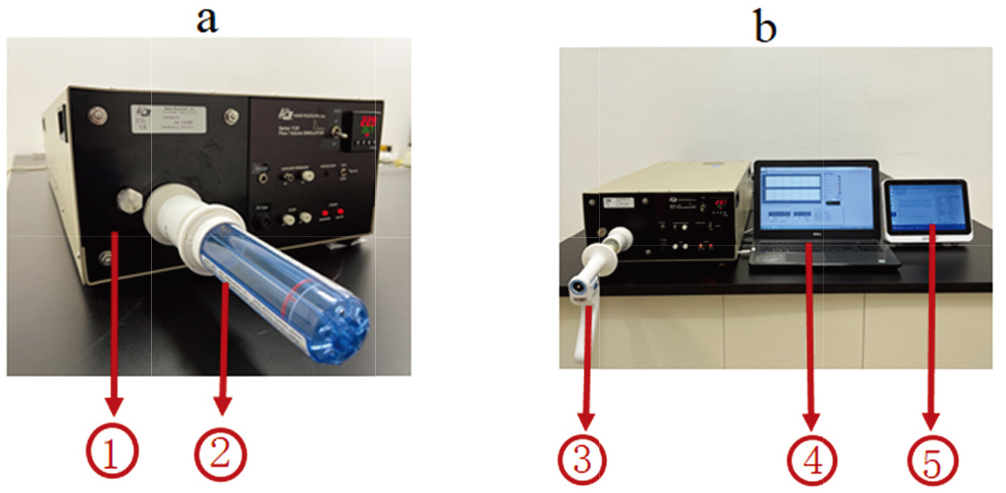
A standard flow-volume simulator (Model 1120, Hans Rudolph, USA) and a computer terminal were used for measurement. Devices that underwent measurement included an inhaler training device (G16, In-Check DIAL
2.2Methods
Prior to testing, the devices should be kept at room temperature of 15
Figure 1.
Test equipment operational diagram. Note: ⟀ Standard flow-volume simulator, ⟁ In-Check DIAL
2.3Evaluation parameters
The absolute error was measured with the following formula:
Target criteria for result interpretation included repeatability
2.4Data analysis
Microsoft Excel 2016, Prism 9.0 (GraphPad Software) and SPSS statistical software package version 25.0 (SPSS Inc., USA) were used to analyze data. Bland-Altman analyses were used to assess consistency between results for the measured devices and standard simulator values under the same instrument settings. Paired
3.Results
When assessing repeatability, both Device I and Device P yielded test results that were below
The difference between test results and standard simulator values for Device P was
Device P passed the linearity test at the R2 resistance level and partially passed the test at the R1 and R3–R5 resistance levels, while Device I partially passed the linearity test at all five resistance levels. Repeatability, absolute error, relative error, and linearity results are summarized in Tables 1 and 2.
Table 1
Measurement results for Device P under different testing parameters
| Parameters | F0.250 | F0.500 | F0.750 | F1.00 | F1.250 | F1.500 | F1.750 | F2.000 | Through (Y/N) |
|---|---|---|---|---|---|---|---|---|---|
| Resistance I | |||||||||
| Mean of simulator’s PIF (L/s) | 0.250 | 0.500 | 0.750 | 1.000 | 1.250 | 1.500 | 1.750 | 1.999 | |
| Mean of Device P’s PIF (L/s) | 0.267 | 0.485 | 0.719 | 0.970 | 1.220 | 1.396 | 1.662 | 1.892 | |
| Repeatability of Device P (L/s) | 0.000 | 0.000 | 0.000 | 0.000 | 0.000 | 0.000 | 0.017 | 0.017 | Y |
| Absolute error of Device P (L/s) | 0.017 | Y | |||||||
| Relative error of Device P (%) | 6.988 | Y | |||||||
| Linearity of Device P (%) | 0.466 | 2.221 | 5.338 | 0.967 | / | N | |||
| Resistance II | |||||||||
| Mean of simulator’s PIF (L/s) | 0.250 | 0.500 | 0.750 | 1.000 | 1.250 | 1.500 | 1.746 | 1.954 | |
| Mean of Device P’s PIF (L/s) | 0.249 | 0.482 | 0.715 | 0.954 | 1.196 | 1.394 | 1.612 | 1.828 | |
| Repeatability of Device P (L/s) | 0.000 | 0.000 | 0.000 | 0.017 | 0.000 | 0.017 | 0.000 | 0.000 | Y |
| Absolute error of Device P (L/s) | N | ||||||||
| Relative error of Device P (%) | Y | ||||||||
| Linearity of Device P (%) | 3.604 | 2.431 | 1.124 | 0.618 | 3.761 | 1.747 | / | Y | |
| Resistance III | |||||||||
| Mean of simulator’s PIF (L/s) | 0.250 | 0.500 | 0.750 | 1.000 | 1.250 | 1.497 | 1.744 | 1.947 | |
| Mean of Device P’s PIF (L/s) | 0.267 | 0.485 | 0.715 | 0.953 | 1.187 | 1.313 | 1.585 | 1.789 | |
| Repeatability of Device P (L/s) | 0.000 | 0.000 | 0.017 | 0.000 | 0.000 | 0.000 | 0.017 | 0.000 | Y |
| Absolute error of Device P (L/s) | 0.017 | N | |||||||
| Relative error of Device P (%) | 6.988 | N | |||||||
| Linearity of Device P (%) | 0.466 | 2.699 | 1.325 | 1.311 | 9.276 | / | N | ||
| Resistance IV | |||||||||
| Mean of simulator’s PIF (L/s) | 0.250 | 0.500 | 0.750 | 1.000 | 1.249 | 1.488 | 1.710 | 1.928 | |
| Mean of Device P’s PIF (L/s) | 0.251 | 0.475 | 0.719 | 0.953 | 1.157 | 1.296 | 1.555 | 1.772 | |
| Repeatability of Device P (L/s) | 0.000 | 0.017 | 0.000 | 0.000 | 0.017 | 0.000 | 0.000 | 0.000 | Y |
| Absolute error of Device P (L/s) | 0.001 | N | |||||||
| Relative error of Device P (%) | 0.301 | Y | |||||||
| Linearity of Device P (%) | 0.826 | 1.675 | 3.929 | 7.630 | 0.050 | / | N | ||
| Resistance V | |||||||||
| Mean of simulator’s PIF (L/s) | 0.250 | 0.500 | 0.750 | 0.999 | 1.221 | 1.467 | 1.680 | 1.987 | |
| Mean of Device P’s PIF (L/s) | 0.234 | 0.468 | 0.702 | 0.936 | 1.103 | 1.183 | 1.381 | 1.454 | |
| Repeatability of Device P (L/s) | 0.000 | 0.000 | 0.000 | 0.000 | 0.000 | 0.017 | 0.050 | 0.000 | Y |
| Absolute error of Device P (L/s) | N | ||||||||
| Relative error of Device P (%) | N | ||||||||
| Linearity of Device P (%) | 3.411 | 2.302 | 1.577 | 5.006 | 14.013 | 1.080 | 16.106 | / | N |
Table 2
Measurement results for Device I under different testing parameters
| Parameters | F0.250 | F0.500 | F0.750 | F1.00 | F1.250 | F1.500 | F1.750 | F2.000 | Through (Y/N) |
|---|---|---|---|---|---|---|---|---|---|
| Resistance I | |||||||||
| Mean of Device I’s PIF (L/s) | 0.250 | 0.433 | 0.590 | 0.833 | 1.017 | 1.297 | 1.497 | 1.657 | |
| Repeatability of Device I (L/s) | 0.000 | 0.033 | 0.000 | 0.017 | 0.017 | 0.017 | Y | ||
| Absolute error of Device I (L/s) | 0.000 | N | |||||||
| Relative error of Device I (%) | 0.000 | N | |||||||
| Linearity of Device I (%) | 15.385 | 15.819 | 0.800 | 6.557 | 3.367 | 5.372 | / | N | |
| Resistance II | |||||||||
| Mean of Device I’s PIF (L/s) | 0.233 | 0.413 | 0.573 | 0.803 | 0.990 | 1.180 | 1.383 | 1.550 | |
| Repeatability of Device I (L/s) | 0.000 | 0.017 | 0.017 | 0.017 | 0.033 | 0.017 | 0.033 | 0.033 | Y |
| Absolute error of Device I (L/s) | N | ||||||||
| Relative error of Device I (%) | N | ||||||||
| Linearity of Device I (%) | 16.935 | 15.698 | 2.490 | 6.397 | 5.102 | 3.070 | 2.654 | / | N |
| Resistance III | |||||||||
| Mean of Device I’s PIF (L/s) | 0.227 | 0.397 | 0.590 | 0.783 | 0.987 | 1.147 | 1.370 | 1.483 | |
| Repeatability of Device I (L/s) | 0.017 | 0.000 | 0.033 | 0.033 | 0.033 | 0.017 | 0.017 | 0.033 | Y |
| Absolute error of Device I (L/s) | N | ||||||||
| Relative error of Device I | N | ||||||||
| Linearity of Device I | 20.168 | 9.605 | 7.234 | 4.689 | 7.640 | 1.684 | 6.058 | / | N |
| Resistance IV | |||||||||
| Mean of Device I’s PIF (L/s) | 0.233 | 0.390 | 0.617 | 0.753 | 1.027 | 1.130 | 1.370 | 1.410 | |
| Repeatability of Device I (L/s) | 0.000 | 0.017 | 0.000 | 0.033 | 0.017 | 0.033 | 0.017 | 0.017 | Y |
| Absolute error of Device I (L/s) | N | ||||||||
| Relative error of Device I (%) | N | ||||||||
| Linearity of Device I (%) | 23.932 | 3.784 | 15.044 | 11.935 | 12.638 | / | N | ||
| Resistance V | |||||||||
| Mean of Device I’s PIF (L/s) | 0.223 | 0.383 | 0.557 | 0.727 | 0.917 | 1.097 | 1.193 | 1.250 | |
| Repeatability of Device I (L/s) | 0.017 | 0.000 | 0.017 | 0.017 | 0.033 | 0.033 | 0.017 | 0.033 | Y |
| Absolute error of Device I (L/s) | N | ||||||||
| Relative error of Device I (%) | N | ||||||||
| Linearity of Device I (%) | 23.478 | 13.808 | 10.844 | 3.535 | 5.982 | 9.715 | 20.091 | / | N |
Table 3
Impedance comparisons for Device I and Device P
| Resistances | Device I kPa | Device P kPa | 95% CI |
|
|
|---|---|---|---|---|---|
| R | 0.0195 | 0.0170 | (0.0023, 0.0026) | 36.786 | 0.000 |
| R | 0.0208 | 0.0214 | ( | 0.014 | |
| R | 0.0290 | 0.0253 | (0.0022, 0.0034) | 37.276 | 0.000 |
| R | 0.0317 | 0.0288 | (0.0022, 0.0034) | 13.100 | 0.000 |
| R | 0.0338 | 0.0446 | ( | 0.003 |
The impedance for these two devices under a fixed pressure (4 kPa) was assessed based on the flow rate at these 5 tested resistance gear levels. Device P exhibited greater impedance than Device I at the R2 and R5 resistance levels, whereas the opposite was true at the R1, R3, and R4 resistance levels (Table 3).
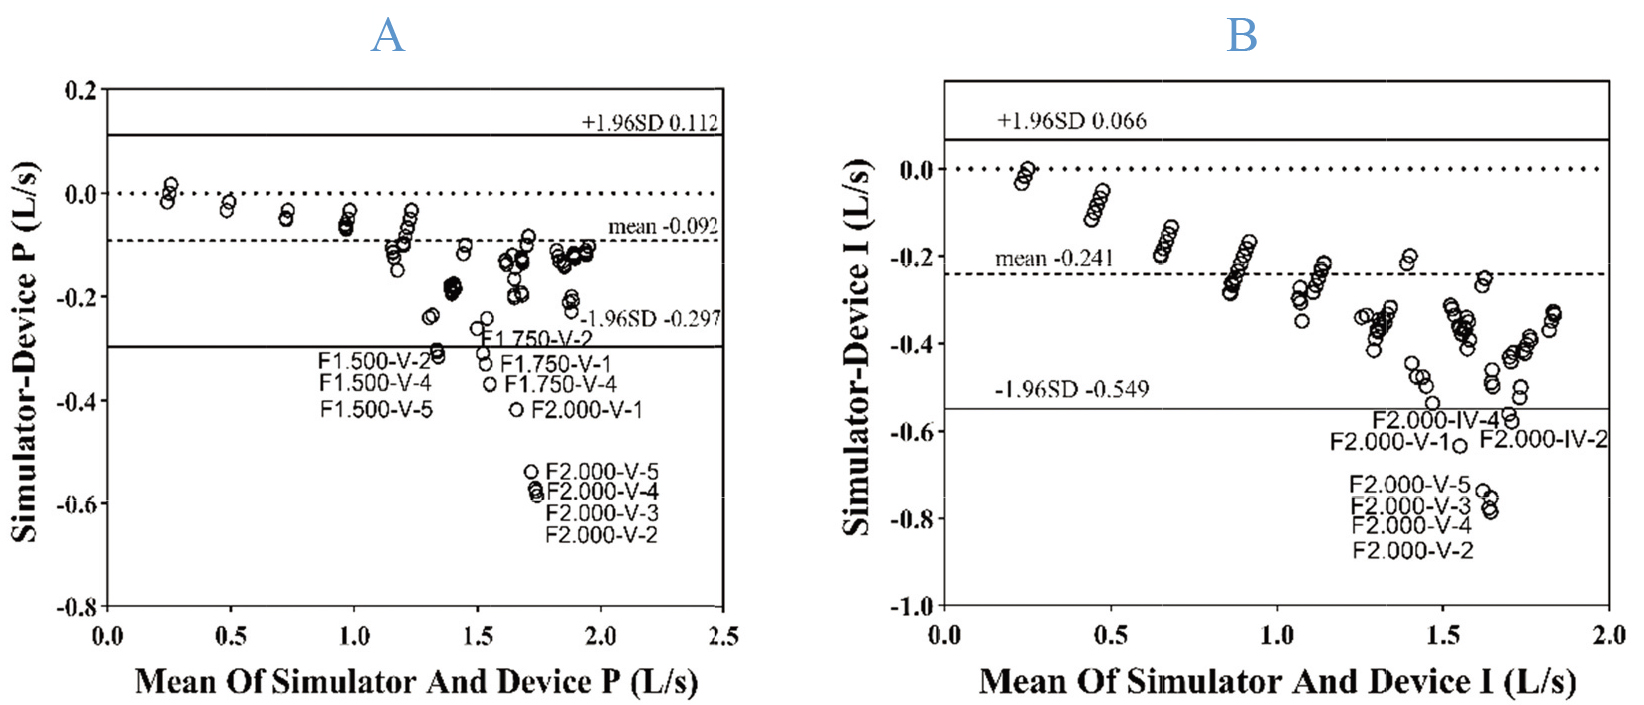
In Bland-Altman analyses, most (94.50% and 96.50%) measurement results and standard simulator values at the R1-R5 levels fell within the 95% limits of agreement (LOAs), indicating that the measurements produced by these two devices were in good agreement with the standard simulator values (Fig. 2).
Figure 2.
Bland-Altman plots for measured values from these two devices and standard simulator values, with the limits of agreement extending from
4.Discussion
While PIF is frequently measured with a standard spirometer, these measurements are made in the absence of any additional resistance. Some reports have demonstrated that these values are not strongly correlated with the PIF values measured with an In-Check DIAL
It is important that appropriate quality control testing standards be established for measurement instruments to guarantee a strong scientific basis for measurement data reliability. Spirometers, which are the devices that are most frequently used to measure inhalation and exhalation, are subject to specific quality control testing methods and standards regulated by professional institutions [23]. Similarly, peak expiratory flow meters (PEFMs) are subject to a set of mature industry standards [24, 29]. However, methods and quality assessment criteria for PIF meters under additional resistance as discussed in this paper have yet to be firmly established. Barnes et al. [22] proposed that PIF repeatability should be
Per the industry standard for PEFMs [29], the maximum allowable error for PEF measurements is within
Per the quality control standards for PEFMs, the linearity of a measurement instrument should be
The present findings support a recommendation that a standard flow-volume simulator be used to assess the quality of PIF meters under additional levels of resistance in order to guarantee appropriate measurement accuracy. When conducting such testing, all instruments should be allowed to rest in the same environment for at least 30 min before testing to ensure that any measurement errors resulting from differences in environmental conditions are minimized. All instruments were preheated for more than 15 min before the experiment, and the connections between the tested devices and the simulator were checked to ensure tightness. Under matching parameters, each device was then measured 5 times to generate one set of data. The standard of repeatability should be
While the measurement results for these two tested devices did not fully meet with the quality control standard proposed herein, these results and standards nonetheless offer significance as a reference. One of the reasons why these devices fail to meet established performance requirements may be that standard flow/volume simulators also have certain errors in generating standard air flow (the error of flow
5.Conclusion
A standard flow-volume simulator was used to test the quality of flow measurement instruments under additional resistance in an objective, scientifically rigorous manner. This approach to evaluate these instruments is highly conducive to further clinical application and to the more widespread use of these types of instruments.
Funding
The study was supported by the ZhongNanshan Medical Foundation of Guangdong Province (ZNSA-2020013); Key Technology R&D Program of Zhejiang, China (2020C03062); Science and Technology Innovation Project of Guangzhou Medical University in 2022–2023 (2021A001); National Key Technology R&D Program (Nos. 2018YFC1311901 and 2016YFC1304603) and National Science & Technology Pillar Program (No. 2015BAI12B10).
Author contributions
YP, ZW and KL wrote the manuscript; RH, JH, JL and SC collected and analyzed the data; YG and JZ corrected the manuscript. All authors reviewed and approved the final manuscript.
Ethics approval and consent to participate
Not applicable.
Availability of data and material
All data generated or analyzed during this study are included in this published article.
Competing interests
The authors have no conflicts of interest to declare that are relevant to the content of this article.
Acknowledgments
The authors would like to thank all reviewers who participated in the review and MJEditor (www.mjeditor.com) for its linguistic assistance during the preparation of this manuscript.
References
[1] | Brusselle GG, Ko FW. Prevalence and burden of asthma in China: Time to act. Lancet. (2019) ; 394: (10196): 364-366. doi: 10.1016/S0140-6736(19)31349-2. |
[2] | Anees Ur R, Ahmad Hassali MA, Muhammad SA, et al. The economic burden of chronic obstructive pulmonary disease (COPD) in the USA, Europe, and Asia: Results from a systematic review of the literature. Expert Rev Pharmacoecon Outcomes Res. (2020) ; 20: (6): 661-672. doi: 10.1080/14737167.2020.1678385. |
[3] | Mahler DA. Peak inspiratory flow rate as a criterion for dry powder inhaler use in chronic obstructive pulmonary disease. Ann Am Thorac Soc. (2017) ; 14: (7): 1103-1107. doi: 10.1513/AnnalsATS.201702-156PS. |
[4] | Clark AR, Hollingworth AM. The relationship between powder inhaler resistance and peak inspiratory conditions in healthy volunteers-implications for in vitro testing. J Aerosol Med. (1993) ; 6: (2): 99-110. doi: 10.1089/jam.1993.6.99. |
[5] | Sanders MJ. Guiding inspiratory flow: Development of the In-Check DIAL G16, a Tool for Improving Inhaler Technique. Pulm Med. (2017) ; 2017: : 1495867. doi: 10.1155/2017/1495867. |
[6] | Laube BL, Janssens HM, de Jongh FH, et al. What the pulmonary specialist should know about the new inhalation therapies. Eur Respir J. (2011) ; 37: (6): 1308-1331. doi: 10.1183/09031936.00166410. |
[7] | Muralidharan P, Hayes D Jr., Mansour HM. Dry powder inhalers in COPD, lung inflammation and pulmonary infections. Expert Opin Drug Deliv. (2015) ; 12: (6): 947-962. doi: 10.1517/17425247.2015.977783. |
[8] | Usmani OS, Biddiscombe MF, Barnes PJ. Regional lung deposition and bronchodilator response as a function of beta2-agonist particle size. Am J Respir Crit Care Med. (2005) ; 172: (12): 1497-1504. doi: 10.1164/rccm.200410-1414OC. |
[9] | Broeders ME, Molema J, Vermue NA, et al. In Check Dial: Accuracy for Diskus and Turbuhaler. Int J Pharm. (2003) ; 252: (1-2): 275-280. doi: 10.1016/s0378-5173(02)00650-6. |
[10] | Capstick TG, Clifton IJ. Inhaler technique and training in people with chronic obstructive pulmonary disease and asthma. Expert Rev Respir Med. (2012) ; 6: (1): 91-101; quiz 102-103. doi: 10.1586/ers.11.89. |
[11] | Sanchis J, Corrigan C, Levy ML, et al. Inhaler devices – from theory to practice. Respir Med. (2013) ; 107: (4): 495-502. doi: 10.1016/j.rmed.2012.12.007. |
[12] | van der Palen J. Peak inspiratory flow through diskus and turbuhaler, measured by means of a peak inspiratory flow meter (In-Check DIAL). Respir Med. (2003) ; 97: (3): 285-289. doi: 10.1053/rmed.2003.1289. |
[13] | Chrystyn H. Is inhalation rate important for a dry powder inhaler? Using the In-Check Dial to identify these rates. Respir Med. (2003) ; 97: (2): 181-187. doi: 10.1053/rmed.2003.1351. |
[14] | Haughney J, Price D, Barnes NC, et al. Choosing inhaler devices for people with asthma: Current knowledge and outstanding research needs. Respir Med. (2010) ; 104: (9): 1237-1245. doi: 10.1016/j.rmed.2010.04.012. |
[15] | Everard ML, Devadason SG, Le Souëf PN. Flow early in the inspiratory manoeuvre affects the aerosol particle size distribution from a Turbuhaler. Respir Med. (1997) ; 91: (10): 624-628. doi: 10.1016/s0954-6111(97)90009-3. |
[16] | Cegla UH. Pressure and inspiratory flow characteristics of dry powder inhalers. Respir Med. (2004) ; 98 Suppl A: S22-28. doi: 10.1016/j.rmed.2004.02.003. |
[17] | Kondo T, Hibino M, Tanigaki T, et al. Appropriate use of a dry powder inhaler based on inhalation flow pattern. J Pharm Health Care Sci. (2017) ; 3: : 5. doi: 10.1186/s40780-017-0076-9. |
[18] | Kamin WE, Genz T, Roeder S, et al. The inhalation manager: A new computer-based device to assess inhalation technique and drug delivery to the patient. J Aerosol Med. (2003) ; 16: (1): 21-29. doi: 10.1089/089426803764928329. |
[19] | Kawamatawong T, Khiawwan S, Pornsuriyasak P. Peak inspiratory flow rate measurement by using In-Check DIAL for the different inhaler devices in elderly with obstructive airway diseases. J Asthma Allergy. (2017) ; 10: : 17-21. doi: 10.2147/jaa.S127580. |
[20] | Mahler DA, Waterman LA, Gifford AH. Prevalence and COPD phenotype for a suboptimal peak inspiratory flow rate against the simulated resistance of the Diskusdry® powder inhaler. J Aerosol Med Pulm Drug Deliv. (2013) ; 26: (3): 174-179. doi: 10.1089/jamp.2012.0987. |
[21] | Altman P, Wehbe L, Dederichs J, et al. Comparison of peak inspiratory flow rate via the Breezhaler®, Ellipta® and HandiHaler® dry powder inhalers in patients with moderate to very severe COPD: A randomized cross-over trial. BMC Pulm Med. (2018) ; 18: (1): 100. doi: 10.1186/s12890-018-0662-0. |
[22] | Barnes CN, Mahler DA, Ohar JA, et al. Peak inspiratory flows: Defining repeatability limits and a predictive equation for different inhalers. Chest. (2020) ; 158: (4): 1413-1419. doi: 10.1016/j.chest.2020.03.072. |
[23] | Graham BL, Steenbruggen I, Miller MR, et al. Standardization of spirometry 2019 update. An official american thoracic society and european respiratory society technical statement. Am J Respir Crit Care Med. (2019) ; 200: (8): e70-e88. doi: 10.1164/rccm.201908-1590ST. |
[24] | 23747-2016 U-EI. Anaesthetic and respiratory equipment – Peak expiratory flow meters for the assessment of pulmonary function in spontaneously breathing humans (ISO 23747:2015). doi: |
[25] | Duarte AG, Tung L, Zhang W, et al. Spirometry measurement of peak inspiratory flow identifies suboptimal use of dry powder inhalers in ambulatory patients with COPD. Chronic Obstr Pulm Dis. (2019) ; 6: (3): 246-255. doi: 10.15326/jcopdf.6.3.2018.0163. |
[26] | Price DB, Yang S, Ming SWY, et al. Physiological predictors Of peak inspiRatory flow using Observed lung function resultS (POROS): Evaluation at discharge among patients hospitalized for a COPD exacerbation. Int J Chron Obstruct Pulmon Dis. (2018) ; 13: : 3937-3946. doi: 10.2147/copd.S174371. |
[27] | Ghosh S, Pleasants RA, Ohar JA, et al. Prevalence and factors associated with suboptimal peak inspiratory flow rates in COPD. Int J Chron Obstruct Pulmon Dis. (2019) ; 14: : 585-595. doi: 10.2147/COPD.S195438. |
[28] | Hua JL, Ye XF, Du CL, et al. Optimizing inhalation therapy in the aspect of peak inhalation flow rate in patients with chronic obstructive pulmonary disease or asthma. BMC Pulm Med. (2021) ; 21: (1): 302. doi: 10.1186/s12890-021-01674-5. |
[29] | Administration CFaD. Anaesthetic and resiratory equipment – Peak expiratory flow meters for the assessment of pulmonary function in spontaneously breathing humans. (2016) , YY/T 1438-2016. doi: |
[30] | Ross DL, Schultz RK. Effect of inhalation flow rate on the dosing characteristics of dry powder inhaler (DPI) and metered dose inhaler (MDI) products. J Aerosol Med. (1996) ; 9: (2): 215-226. doi: 10.1089/jam.1996.9.215. |


