
The difference in the relationship of spinal sagittal alignment between individuals with flat lumbar and normal lordosis posture based on global and regional angles
Abstract
BACKGROUND:
According to previous studies, the relationship between lumbar lordosis and thoracic kyphosis or that between pelvic parameters and thoracic kyphosis have been inconsistent.
OBJECTIVE:
The purpose of this study was to investigate spinal sagittal alignment and its relationship to global and regional lumbar and thoracic angles, pelvic and sway angles, and C7–S1 distance measurements, followed by a detailed subgroup analysis using an inertial measurement unit system.
METHODS:
A total of 51 asymptomatic volunteers stood in a comfortable posture with inertial measurement units attached to the T1, T7, T12, L3, and S2 vertebrae. T1, T7, T12, L3, and S2 sagittal angles were acquired during standing posture using the Eulerian angle coordinate system. All angles are reported as the mean of three 5-s measurements. Following the measurement of lumbar lordosis angles (T12 relative S2), participants were divided into the flat lumbar and normal lordosis groups.
RESULTS:
There were different correlation patterns between groups because of spinal sagittal imbalance, which was greater in the flat lumbar group than in the normal lordosis group. In addition, sacral inclination proved the ideal parameter to evaluate reciprocal balance in lumbar lordosis, showing a stronger correlation with lower than with upper lumbar lordosis. T1 was the key element in assessing thoracic kyphosis, which showed a stronger correlation with upper than with lower thoracic kyphosis.
CONCLUSION:
We suggest that when assessing posture, it is necessary to identify the global and regional angles and it is useful to classify spinal sagittal alignment into subgroups according to lumbar lordosis and evaluate the groups separately.
1.Introduction
Spinal posture assessment is often emphasized by clinicians because of its clinical importance for managing pain, surgical treatment outcomes, prevention of pain or deformity, and functional assessment [1, 2, 3]. In the sagittal plane, the human spine comprises a series of reciprocal curvatures between the cervical and pelvis, with the cervical spine and lumbar spine generally characterized as being lordotic, whereas the thoracic spine is normally kyphotic. These series of segments support the spine and are linked together along a linear chain to maintain a stable posture [4]. An optimally balanced spinal posture contributes to maximal mechanical advantage and minimal energy expenditure during standing and walking by absorbing the shock of the load imposed on the spinal column [4]. However, sagittal profile imbalance is considered one of the variables most highly correlated with adverse health status and outcomes such as significant low back pain, deformity, or gait abnormalities [3, 4, 5, 6].
An excess of lumbar lordosis or thoracic kyphosis is the common driver of sagittal contour imbalance, but a deficiency of normal lumbar lordosis or thoracic kyphosis can also cause spinal sagittal imbalance [2, 3, 7]. Previous studies have reported that such reduced sagittal contours of the spine may be caused by advanced age, as in degenerative lumbar kyphosis, or passive structural problems, such as iatrogenic flat back syndrome and ankylosing spondylitis or scoliosis [2, 7, 8]. However, even healthy people may present with a sagittal profile imbalance such as flat back or sway back postures. These are relatively minor forms of deviated posture and may be a consequence of uncontrolled or faulty movement patterns [8, 9].
Posture is commonly understood to be influenced by a complex interplay of various elements of the human body such as the bone structure, muscular system, and neural system, interacting with external environmental forces such as gravity. In particular, the orientation of the line of gravity relative to the spinal column plays a vital biomechanical role in the stress placed on the region [9, 10]. For instance, if a gravity line passes through the lumbar anterior region, the low back nature lordosis will be reduced due to generating continuous external flexion torques [8]. Thus, the reduction of lumbar lordosis increases under stress, which can lead to mechanical changes in shear forces and coupling motions in the spine. This, in other words, can cause compensatory posture and associated movement in adjacent segments of the vertebral curve during various static and dynamic daily activities [4, 7]. Therefore, it is important that early and precise assessment of spinal curves to alterations of sagittal alignment in individuals with a risk of spinal disorders. In addition, it is necessary to investigate how these spinal sagittal imbalances affect the interconnected spinal chains.
Many previous studies on sagittal assessment of the spine have reported that pelvic morphological parameters, such as pelvic incidence, have a significant influence on the orientation parameters of global lumbar lordosis (GLL) and global thoracic kyphosis (GTK) [3, 4, 7, 11, 12]. These authors reported that greater lordosis angles were correlated with increased sacral slope, pelvic incidence, and pelvic tilt [1, 4, 7, 12, 13]. These relationships between pelvic parameters and lumbar lordosis appear to be clear, although in previous studies, the link between GLL and GTK or that between pelvic parameters and GTK has been inconsistent. According to the results of previous studies, greater GTK is generally associated with greater GLL, although some studies have reported individuals with increased GLL but reduced GTK. Moreover, other studies have concluded that GTK is not influenced by GLL in the maintenance of physiologic balance, as implied by the association between sacral slope and GLL or that between GLL and GTK [4, 7, 14].
It is believed that these conflicting results are due to the wide normal ranges of GLL and GTK, the diversity of participants, and the wide range of age groups studied. Roussouly et al. [3] classified patterns of sagittal curvature associated with lumbar lordosis into four types based on the upper and lower lumbar (LLx) lordotic arcs in 160 participants with healthy backs and ranging in age from 18–48 years. The authors reported that the participant’s sacral slopes varied from 20
Lumbar lordosis primarily includes the LLx vertebrae, with the L5 segment contributing almost 40% to overall lordosis and L1 contributing only 5% [17]. Consistent with greater mechanical stress through the LLx regions, higher risks for degenerative low back pain are more evident in these regions than in the upper lumbar (ULx) regions [15, 16]. Furthermore, the majority of spinal surgeries are in the LLx region [18]. Thus, it is considered that during the assessment of spinal sagittal balance, it is most efficient to evaluate the spine globally and then divide it into sections. Therefore, the purpose of this study was to investigate spinal sagittal alignment and its relationship to global and regional lumbar and thoracic angles, pelvic and sway angles, and C7–S1 distance measurements, followed by a detailed subgroup analysis using an inertial measurement unit system.
2.Methods
2.1Subjects
In total, 51 asymptomatic younger volunteers (16 males, 35 females) were recruited by advertisements at universities in Gyeongsangnam-do, Republic of Korea, for the present cross-sectional study. Participants had no history of surgery, traumatic injury, or musculoskeletal pathology during the 12 months prior to the study, and had no functional restrictions, respiratory or neurologic disorders, or pain in the spine or lower limbs. Table 1 lists the characteristics of all subjects. Ethics approval was granted by University Ethics Committee for Human Investigations, and written informed consent was obtained from all participants.
Table 1
General characteristics of the participants (
| Variables | Flat lumbar group ( | Normal lordosis group ( |
|
|---|---|---|---|
| Age (years) | 23.31 | 22.50 | 0.260 |
| Height (cm) | 167.16 | 164.31 | 0.474 |
| Weight (kg) | 60.16 | 59.19 | 0.946 |
| BMI (kg/m | 21.51 | 21.90 | 0.849 |
| Global angle | 12.63 | 22.92 |
All values are mean
2.2Inertial measurement unit (IMU) systems
We used five wireless inertial measurement unit (IMU) systems to measure global and regional angles. Each IMU device consisted of five transmitters (model EBIMU24G, E2BOX, Seoul, South Korea), a receiver (39
T1, T7, T12, L3, and S2 sagittal angles were acquired during standing posture using the Eulerian angle coordinate system (i.e., in a roll-pitch-yaw angle sequence) [19]. All angles are reported as the mean of three 5-s measurements. Following the measurement of lumbar lordotic angles (T12 relative to S2), participants were divided into either a flat lumbar (T12–S2: GLL
2.3Three-dimensional (3D) ultrasonic motion analysis system
A three-dimensional (3D) ultrasonic motion analysis system (CMS-HS; Zebris Medizintechnik GmbH, Isny, Germany) was used to measure sway angle (angles between the acromion, greater trochanter, and lateral malleolus) [20] and the C7–S1 sagittal vertical axis (SVA) distance [21] during standing. To measure the sway angle, three single markers were attached to the acromion, greater trochanter, and right lateral ankle malleolus, and to measure the C7–S1 SVA line, two single markers were attached to the C7 spinous process and S1 midpoint using double-sided tape. A measurement sensor consisting of three microphones facing the markers was used to record the ultrasound signal. The measurement device was positioned on a stand approximately 1 m to the right of the subject; the sampling rate was 60 Hz. Kinematic data were analyzed using WinData 2.19 software (Zebris Medical System, Tübingen, Germany). The means over three trials of the maximum sway angles and C7–S1 SVA distance were used for the analysis. Test-retest reliability indices for the three-dimensional ultrasonic motion analysis data during stance were assessed using the ICC (3, 1) and 95% CI (Supplementary Table 1).
2.4Procedures
Prior to task performance, each participant was asked to stand in a comfortable posture, looking ahead, with the feet shoulder width apart. The examiner marked the participant’s T1, T7, T12, L3, and S2 spinous processes and the midpoint of transmitters mounted on a plastic frame. Then, the examiner attached the marked points on the five mounted transmitters to the T1, T7, T12, L3, and S2 spinous processes using Transpore medical tape (3M, Seoul, South Korea). In addition, the examiner used double-sided tape to attach three single markers to the participant’s acromion, greater trochanter, and right lateral ankle malleolus to measure sway angle and two single markers to the participant’s C7 and S1 to measure the C7–S1 SVA. Finally, the examiner began acquiring data. We conducted standing-posture measurements three times, each for 5 seconds. Following these measurements, participants were categorized into groups according to the GLL angle: flat lumbar group, GLL
2.5Statistical analyses
Data were processed using the SPSS software package (version 22.0 for Windows; SPSS, Chicago, IL). All data were analyzed to verify the assumption of normality using the Kolmogorov-Smirnov test, and
3.Results
3.1Kinematic data
The normality of the distribution of outcome variables was assessed using the Kolmogorov-Smirnov test (
Table 2
Comparison of global and regional trunk angles in slump sitting posture among the standing global lumbar lordosis group (
| Variables | Flat lumbar group ( | Normal lordosis group ( | Effect size |
| ||||
|---|---|---|---|---|---|---|---|---|
| Lumbar lordosis ( | ||||||||
| Global | 10.6 | 27.1 | 11 | 001 | ||||
| Upper lumbar | 0.8 | 59 | 0. | 049 | ||||
| Lower lumbar | 11.8 | 26.2 | 44 | 001 | ||||
| Thoracic kyphosis ( | ||||||||
| Global | | | 0. | 80 | 0. | 010 | ||
| Upper thoracic | 0. | 20 | 0. | 490 | ||||
| Lower thoracic | 0. | 86 | 0. | 005 | ||||
| S2 ( | 90.6 | 77.7 | 2. | 5 | 001 | |||
| Sway angle ( | 9.5 | 11.1 | 52 | 0. | 024 | |||
| C7S1 (mm) | 439.1 | 416.0 | 0. | 67 | 0. | 027 | ||
All values are mean
The flat lumbar group demonstrated a significantly greater S2 angle than the normal lordosis group (90.6
Table 3
Correlations among the parameters during standing in the flat lordosis group (
| Sway | GTK | UTx | LTx | GLL | ULx | LLx | C7S1 | T1 | T7 | T12 | L3 | S2 | |||||||||||||
|---|---|---|---|---|---|---|---|---|---|---|---|---|---|---|---|---|---|---|---|---|---|---|---|---|---|
| Sway | |||||||||||||||||||||||||
| GTK | 119 | ||||||||||||||||||||||||
| UTx | 204 | 0. | 739 | ||||||||||||||||||||||
| LTx | 0. | 091 | 0. | 490 | 225 | ||||||||||||||||||||
| GLL | 0. | 155 | 095 | 0. | 097 | 262 | |||||||||||||||||||
| ULx | 0. | 139 | 0. | 143 | 0. | 023 | 0. | 176 | 0. | 479 | |||||||||||||||
| LLx | 0. | 077 | 207 | 091 | 418 | 0. | 787 | 164 | |||||||||||||||||
| C7S1 | 0. | 103 | 0. | 011 | 004 | 0. | 010 | 213 | 350 | 0. | 006 | ||||||||||||||
| T1 | 009 | 0. | 900 | 0. | 792 | 0. | 278 | 0. | 090 | 0. | 264 | 085 | 133 | ||||||||||||
| T7 | 0. | 292 | 0. | 312 | 253 | 0. | 779 | 004 | 0. | 383 | 273 | 217 | 0. | 391 | |||||||||||
| T12 | 0. | 252 | 352 | 0. | 012 | 524 | 0. | 409 | 0. | 242 | 0. | 290 | 310 | 0. | 092 | 0. | 127 | ||||||||
| L3 | 0. | 137 | 419 | 006 | 599 | 0. | 049 | 458 | 0. | 377 | 047 | 096 | 144 | 0. | 752 | ||||||||||
| S2 | 0. | 057 | 200 | 086 | 178 | 648 | 272 | 537 | 048 | 012 | 0. | 110 | 0. | 430 | 0. | 579 | |||||||||
Table 4
Correlations among the parameters during standing in the normal lumbar group (
| Sway | GTK | UTx | LTx | GLL | ULx | LLx | C7S1 | T1 | T7 | T12 | L3 | S2 | |||||||||||||
|---|---|---|---|---|---|---|---|---|---|---|---|---|---|---|---|---|---|---|---|---|---|---|---|---|---|
| Sway | |||||||||||||||||||||||||
| GTK | 0. | 503 | |||||||||||||||||||||||
| UTx | 0. | 539 | 0. | 730 | |||||||||||||||||||||
| LTx | 0. | 026 | 0. | 404 | 331 | ||||||||||||||||||||
| GLL | 062 | 480 | 157 | 353 | |||||||||||||||||||||
| ULx | 0. | 060 | 0. | 033 | 0. | 218 | 246 | 009 | |||||||||||||||||
| LLx | 083 | 345 | 221 | 180 | 0. | 859 | 507 | ||||||||||||||||||
| C7S1 | 0. | 169 | 276 | 168 | 157 | 204 | 213 | 113 | |||||||||||||||||
| T1 | 0. | 547 | 0. | 909 | 0. | 791 | 0. | 196 | 270 | 0. | 277 | 355 | 322 | ||||||||||||
| T7 | 177 | 0. | 023 | 616 | 0. | 792 | 091 | 0. | 000 | 096 | 140 | 005 | |||||||||||||
| T12 | 195 | 693 | 286 | 574 | 0. | 456 | 0. | 403 | 0. | 167 | 0. | 070 | 328 | 0. | 045 | ||||||||||
| L3 | 212 | 565 | 442 | 189 | 0. | 358 | 712 | 0. | 645 | 0. | 271 | 535 | 0. | 034 | 0. | 355 | |||||||||
| S2 | 033 | 0. | 089 | 0. | 024 | 0. | 090 | 880 | 0. | 225 | 877 | 0. | 266 | 0. | 129 | 0. | 126 | 0. | 020 | 213 | |||||
3.2Linear data
Tables 4 and 4 present the correlations among the global and regional thoracic and lumbar angles and the sacral inclination in the flat lumbar and normal lordosis groups. Figure 1 depicts the data analysis using a stepwise regression model.
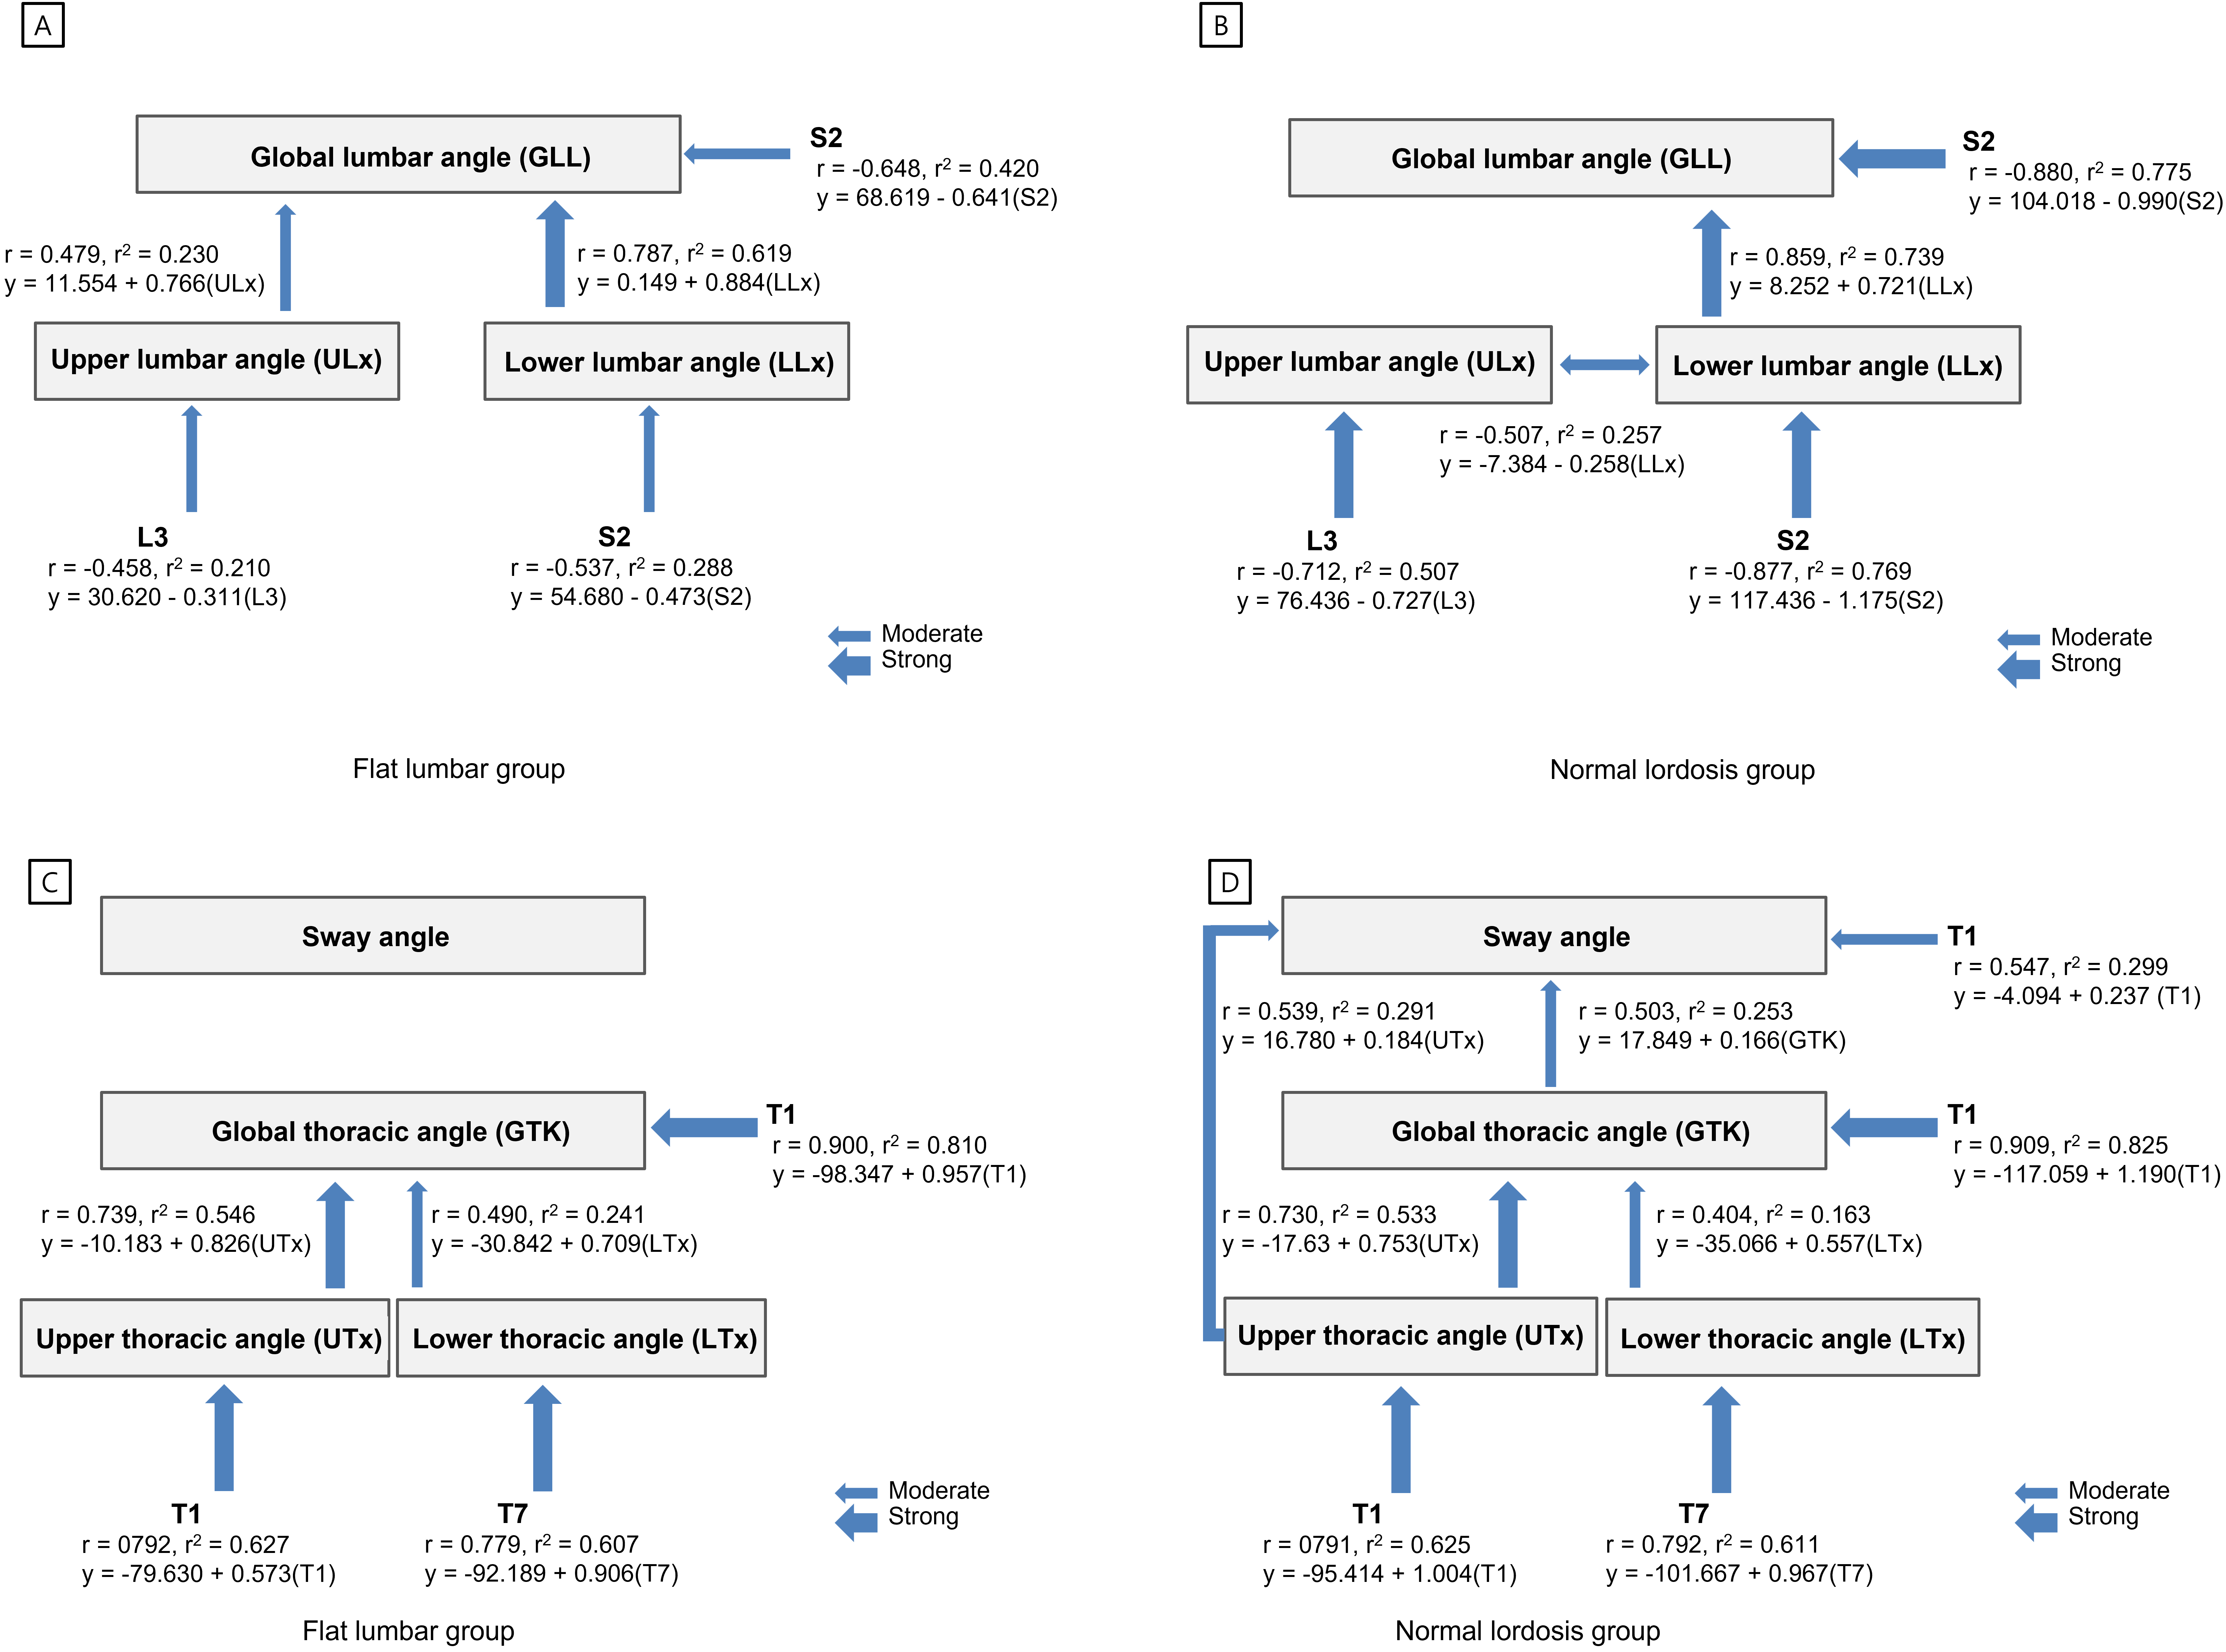
Figure 1.
Correlations between global and regional angles of lumbar in flat lordosis group (A) and normal lumbar group (B). Correlations among thoracic global and regional angles and sway angles in flat lordosis group (C) and normal lumbar group (D).
3.2.1Global and regional lumbar data
A strong correlation was observed between the GLL and LLx angles in the flat lumbar group (
A strong correlation was observed between the L3 and ULx angles in the normal lordosis group (
The stepwise regression model revealed that S2 (i.e., sacral inclination) was the best predictor of GLL and LLx angles in both groups, accounting for 42% and 28.8% of the variation in them, respectively, during standing in the flat lumbar group, and for 77.5% and 76.9%, respectively, in the normal lordosis group (Fig. 1A and B). Additionally, L3 was the best predictor of ULx in both groups, accounting for 21% of the variation in the flat lumbar group and for 50.7% in the normal lordosis group (Fig. 1A and B).
3.2.2Global and regional thoracic data
A strong correlation was observed between GTK and UTx angles in the flat lumbar group (
The stepwise regression model revealed that T1 was the best predictor of GTK and UTx angles in both groups, accounting for 81% and 62.7% of them, respectively, in the flat lumbar group, and for 82.5% and 62.5%, respectively, in the normal lordosis group (Fig. 1C and D). Additionally, T7 was the best predictor of the LTx angle in both groups, accounting for 60.7% of the variation in the flat lumbar group and 61.1% in the normal lordosis group (Fig. 1C and D).
3.2.3Lumbar, thoracic, and sway angles
In the normal lordosis group, moderate correlations were observed between the GTK and GLL angles (
4.Discussion
This study assessed the global and regional angles of the lumbar and thoracic spine and pelvis and postural alignment in standing, as well as the relationships among these angles, in individuals with flat lumbar posture and normal lordosis. Our primary findings demonstrate that the global and regional lumbar and thoracic angles were generally reduced in the flat lumbar group compared with the normal lordosis group, except for the upper thoracic (UTx) angle, whereas the S2 angle (i.e., sacral inclination) was increased in the flat lumbar group relative to the normal lordosis group. Moreover, the S2 angle proved to be the single best predictor of GLL and LLx in the standing position for both groups. Additionally, there was a significant and strong correlation between GLL and LLx in both groups. These results indicate that the GLL angle is affected by the orientation of the pelvis and controls sacral inclination in a standing position. Furthermore, the S2 angle was the main contributor to GLL and LLx in these young healthy volunteers. Many previous studies suggested that pelvic alignment, as defined by pelvic incidence, sacral slope, pelvic tilt, and sacral inclination, should be employed to assess the sagittal profile [3, 4, 5, 6] because optimal sagittal contour is influenced by pelvic shape and orientation. The present results are similar to the findings of Hyun et al. [18], who demonstrated a strong correlation between GLL and sacral slope (
Despite these differences in measurement techniques, the results of the previous studies and this one are similar. Legaye et al. [11] reported that apart from the strong relationship between GLL and sacral slope, a high correlation was also observed between sacral slope and sacral inclination (i.e., S2 angle), and as GLL increased, sacral inclination and sacral horizontal angles also tended to increase. Thus, in light of previous data and the present findings, we consider that the GLL angle was affected by the orientation of the pelvis and its control of sacral inclination during a standing position and that the S2 angle was the main contributor to GLL and LLx in these young healthy volunteers. Furthermore, a previous study by Shin and Yoo [19] also reported that as GLL increased, ULx and LLx tended to increase, whereas the sacral inclination tended to decrease. In that study, the sacral inclination was the single best predictor of GLL in standing participants using IMU measurements. In the present study, individuals with a flat lumbar posture tended toward a posterior pelvic alignment compared with those exhibiting normal lumbar lordosis, possibly due to the reduced range of the reciprocal lower lumbar curve. Additionally, the flat lumbar group also showed a decreased sway angle (i.e., angles between the acromion, greater trochanter, and lateral malleolus) and increased C7-S1 distance compared with the normal lordosis group because the latter group had a well-balanced GLL, whereas the flat lordosis group displayed pelvic posterior tilt. This result indicates that the flat lumbar group demonstrated greater spinal sagittal imbalance than the normal lordosis group. For this reason, we consider that global and regional lumbar and thoracic angles were generally reduced in the flat lumbar group compared with the normal lordosis group.
In this study, although the S2 angle was the key contributor to GLL and LLx in both groups, the groups showed several important differences. GLL and LLx were strongly correlated with S2 in the normal lordosis group, whereas the correlation with S2 was only moderate in the flat lumbar group. Furthermore, the amount of variance in GLL explained by the LLx angle was 38.9% greater than that due to ULx in the flat lumbar group, whereas the amount of variance in GLL explained by LLx was 73.8% in the normal lordosis group. In addition, only the normal lordosis group showed a moderate correlation between GTK and GLL. A possible explanation for this observation is that the GLL angle was more influenced by LLx than by ULx, and the extent of the influence on GLL varied depending on the S2 angle. Król et al. [24] and Berthonnaud et al. [4] reported a significant correlation between the pelvic tilt angle and lumbar lordosis, and it seems that lumbar lordosis is closely linked to pelvic position. When the pelvis is tilted posteriorly, the sacral end is projected posteriorly, displacing the axis of gravity in the same direction. Lumbar lordosis increases linearly with the sacral slope, and it has become apparent that the shape of the pelvis and its contribution to the sacral slope strongly influence lumbar lordosis [8]. Because the lumbar spine is associated with the pelvis through the kinematic lumbopelvic link, anterior and posterior pelvic tilt can lead to lumbar extension and flexion, respectively. In addition, the superior facet surfaces in the ULx region tend to be oriented closest with the sagittal plane, and the inferior articular facets are slightly convex, generally facing laterally to anterolaterally. The inferior facets of L5 articulate with the superior joints, which are typically oriented much closer to the frontal plane than the other lumbar articulations. This anatomical feature of the lumbar vertebra tends to increase the lordotic angle of the LLx compared to the ULx. The S2 angle is the best single indicator of GLL among skin surface measurements; however, a change in the shape or orientation at one level causes a change in the line of gravity, which alters the interrelationship between each vertebral region and directly affects adjacent segments, resulting in a change in posture. In this study, the flat lumbar group demonstrated significantly more posterior tilt than the normal lordosis group, and this result led to reduced GLL in the flat lumbar group compared to the normal lordosis group. Therefore, our results suggest that there was a weaker correlation between ULx and LLx in the flat lumbar group compared to the balanced, normal lordosis group. Thus, we suggest that it is necessary to evaluate sacral inclination (S2), GLL, and RLL for efficient lumbar postural assessment, and IMU-based measurement is necessary to classify subgroups according to GLL.
In this study, GLL showed a stronger correlation with LLx than with ULx, and GTK showed a stronger correlation with LTx than with UTx. In addition, pelvic inclination showed no relationship to GTK and regional thoracic angles. These results indicate that pelvic alignment had little direct influence on GTK, and GLL may not be the ideal parameter to evaluate reciprocal changes in GTK, although we also found a moderate relationship of GLL and GTK with well-balanced LLx and ULx in young healthy participants. In this study, the T1 angle was the single best predictor of GTK and UTx in the standing position for both groups. Our results are supported by Berthonnaud et al. [4] who demonstrated a weak correlation between the lumbar and thoracic spinal segments. The authors found a stronger relationship between shape and orientation parameters that tend to occur in the highly mobile areas of the spine, such as the lumbar and cervical areas. The less mobile thoracic spine does not respond as easily to changes in the shape or orientation of the pelvis and lumbar spine. In addition, based on the results, we consider that GTK is affected more by higher-level influences (e.g., cervical) than by lower-level (lumbar or pelvic) influences. The cervical and lumbar spine maintain lordosis, and the thoracic spine creates reciprocal kyphosis, but the upper thoracic vertebrae are an extension of the lordosis of the lower cervical spine, and the lower thoracic vertebrae are an extension of the lordosis of the upper lumbar spine. Our results are supported by those of several previous studies that examined sagittal balance in the standing position using radiologic methods. These previous studies demonstrated a weak or moderate relationship between GLL and GTK [12, 18, 23], and several studies showed a stronger relationship between the global cervical angle and GTK than between GTK and GLL [25, 26]. Previous findings by Hardacker et al. [25] showed that GTK alignment was strongly correlated with changes in cervical sagittal alignment in asymptotic participants. In addition, Lee et al. [26] and Knott et al. [27] reported that measurement of the T1 slope angle or sagittal angle may be very useful in evaluating cervical spine sagittal balance. An individual with an increased T1 slope requires a large global cervical angle to maintain physiologic sagittal balance. Although we did not measure the cervical angle in this study, our results show that the T1 angle may be a key factor in GTK.
This study has several limitations. First, all of our participants were asymptomatic healthy young adults. Therefore, our findings cannot be generalized to the general population. Second, we did not measure global and regional cervical angles; therefore, we did not assess the entirety of spinal sagittal balance and the relationship between global cervical angles and GTK. Third, although radiographic analysis is considered the gold standard measurement method, it is difficult to measure dynamic movements using this technique. Thus, in this study, we investigated spinal sagittal balance based on global, regional, and pelvic angles as measured by an IMU system using skin-surface sensors; these data were later used to study dynamic movements according to GLL. Finally, we did not examine other variables that might have affected posture, such as muscle length and intra-abdominal pressure patterns; we measured only the spinal angles noted in a standing posture. Future studies should investigate sagittal spinal balance, including cervical spine and muscle activation, in various posture subgroups.
5.Conclusion
The flat lumbar group displayed characteristic imbalances in the sagittal plane and a spinal relationship based on global and regional angles that was distinct from the normal lordosis group. In addition, the flat lumbar group showed no correlation between GLL and GTK, unlike the normal lordosis group. Despite these differences, LLx is useful for predicting GLL angles and UTx is useful for predicting GTK. Therefore, we suggest that when assessing posture, it is necessary to identify the global and regional angles and to classify patients into subgroups according to their spinal sagittal balance and degree of lumbar lordosis. Taken together, our results provide support for the comprehension of sagittal balance in the context of normal and pathological conditions of the spine and pelvis.
Conflict of interest
None to report.
Funding
This work was supported by the National Research Foundation of Korea (NRF) grant funded by the Korean government (MSIT) (No. NRF-2020R1F1A1049191 and 2022R1C1C2012317).
References
[1] | Schwab F, Patel A, Ungar B, Farcy JP, Lafage V. Adult spinal deformity-postoperative standing imbalance: How much can you tolerate? An overview of key parameters in assessing alignment and planning corrective surgery. Spine. (2010) ; 35: (25): 2224-2231. |
[2] | Jang JS, Lee SH, Min JH, Maeng DH. Influence of lumbar lordosis restoration on thoracic curve and sagittal position in lumbar degenerative kyphosis patients. Spine. (2009) ; 34: (3): 280-284. |
[3] | Roussouly P, Gollogly S, Berthonnaud E, Dimnet J. Classification of the normal variation in the sagittal alignment of the human lumbar spine and pelvis in the standing position. Spine. (2005) ; 30: (3): 346-353. |
[4] | Berthonnaud E, Dimnet J, Roussouly P, Labelle H. Analysis of the sagittal balance of the spine and pelvis using shape and orientation parameters. J Spinal Disord Tech. (2005) ; 18: (1): 40-47. |
[5] | O’Sullivan PB, Grahamslaw KM, Kendell M, Lapenskie SC, Möller NE, Richards KV. The effect of different standing and sitting postures on trunk muscle activity in a pain-free population. Spine. (2002) ; 27: (11): 1238-1244. |
[6] | Booth KC, Bridwell KH, Lenke LG, Baldus CR, Blanke KM. Complications and predictive factors for the successful treatment of flatback deformity (fixed sagittal imbalance). Spine. (1999) ; 24: (16): 1712-1720. |
[7] | Vialle R, Levassor N, Rillardon L, Templier A, Skalli W, Guigui P. Radiographic analysis of the sagittal alignment and balance of the spine in asymptomatic subjects. J Bone Joint Surg Am. (2005) ; 87: (2): 260-267. |
[8] | Neumann DA. Kinesiology of the Musculoskeletal System. New York, NY: Mosby; (2016) . |
[9] | Magee DJ. Orthopedic physical assessment. 7th edition. Philadelphia, PA: Saunders; (2018) . |
[10] | Kendall FP, McCreary EK, Provance PG, Rodgers MM, Romani WA. Muscles: testing and function, with posture and pain. 5th edition. Lippincott Williams & Wilkins, Baltimore: (2005) . |
[11] | Legaye J. The femoro-sacral posterior angle: An anatomical sagittal pelvic parameter usable with dome-shaped sacrum. Eur Spine J. (2007) ; 16: (2): 219-225. |
[12] | Vaz G, Roussouly P, Berthonnaud E, Dimnet J. Sagittal morphology and equilibrium of pelvis and spine. Eur Spine J. (2002) ; 11: (1): 80-87. |
[13] | Roussouly P, Nnadi C. Sagittal plane deformity: An overview of interpretation and management. Eur Spine J. (2010) ; 19: : 1824-1836. |
[14] | Mac-Thiong JM, Labelle H, Berthonnaud E, Betz RR, Roussouly P. Sagittal spinopelvic balance in normal children and adolescents. Eur Spine J. (2007) ; 16: : 227-234. |
[15] | Mitchell T, O’Sullivan PB, Burnett AF, Straker L, Smith A. Regional differences in lumbar spinal posture and the influence of low back pain. BMC Musculoskelet Disord. (2008) ; 18: (9): 152. |
[16] | Burton K. The ratio of upper lumbar to lower lumbar sagittal mobility related to age, sex and low back trouble. Eng Med. (1987) ; 16: (4): 233-236. |
[17] | Been E, Barash A, Marom A, Kramer PA. Vertebral bodies or discs: Which contributes more to human-like lumbar lordosis? Clin Orthop Relat Res. (2010) ; 468: : 1822-1829. |
[18] | Hyun SJ, Han S, Kim YB, Kim YJ, Kang GB, Cheong JY. Predictive formula of ideal lumbar lordosis and lower lumbar lordosis determined by individual pelvic incidence in asymptomatic elderly population. Eur Spine J. (2019) ; 28: (9): 1906-1913. |
[19] | Shin SS, Yoo WG. Inertial measurement unit-based evaluation of global and regional lumbar spine and pelvis alignment in standing individuals with a flat lumbar posture. J Manipulative Physiol Ther. (2019) ; 42: (8): 594-600. |
[20] | Pezolato A, de Vasconcelos EE, Defino HL, Nogueira-Barbosa MH. Fat infiltration in the lumbar multifidus and erector spinae muscles in subjects with sway-back posture. Eur Spine J. (2012) ; 21: (11): 2158-2164. |
[21] | Rothenfluh DA, Stratton A, Nnadi C, Beresford-Cleary N. A critical thoracic kyphosis is required to prevent sagittal plane deterioration in selective thoracic fusions in Lenke I and II AIS. Eur Spine J. (2019) ; 28: (12): 3066-3075. |
[22] | Fetters L, Tilson J. Evidence-based physical therapy. Philadelphia: F.A. Davis; (2012) . |
[23] | Moon HJ, Bridwell KH, Theologis AA, Kelly MP, Lertudomphonwanit T, Kim HJ, et al. Thoracolumbar junction orientation: Its impact on thoracic kyphosis and sagittal alignment in both asymptomatic volunteers and symptomatic patients. Eur Spine J. (2019) ; 28: (9): 1937-1947. |
[24] | Król A, Polak M, Szczygieł E, Wójcik P, Gleb K. Relationship between mechanical factors and pelvic tilt in adults with and without low back pain. J Back Musculoskelet Rehabil. (2017) ; 30: (4): 699-705. |
[25] | Hardacker JW, Shuford RF, Capicotto PN, Pryor PW. Radiographic standing cervical segmental alignment in adult volunteers without neck symptoms. Spine. (1997) ; 22: (13): 1472-1480. |
[26] | Lee SH, Kim KT, Seo EM, Suk KS, Kwack YH, Son ES. The influence of thoracic inlet alignment on the craniocervical sagittal balance in asymptomatic adults. J Spinal Disord Tech. (2012) ; 25: (2): E41-E47. |
[27] | Knott PT, Mardjetko SM, Techy F. The use of the T1 sagittal angle in predicting overall sagittal balance of the spine. Spine J. (2010) ; 10: (11): 994-998. |
Appendices
Supplementary data
Supplementary Table 1
Reliability indices for IMU data during standing (
| Variables | ICC | 95% CI |
|---|---|---|
| T1 | 0.990 | 0.984 |
| T7 | 0.986 | 0.978 |
| T12 | 0.978 | 0.965 |
| L3 | 0.986 | 0.977 |
| S2 | 0.998 | 0.998 |
| Sway angle | 0.902 | 0.843 |
| C7S1 | 0.969 | 0.950 |
ICC intra-class correlation coefficient. CI, 95% Confidence Interval; Sway angle, among the acromion, greater trochanter, and lateral malleolus; C7S1, distance between vertical line C7 and S1.


